Direct Numerical Simulation of Seawater Desalination Based on Ion Concentration Polarization


Abstract
1. Introduction
2. Methods
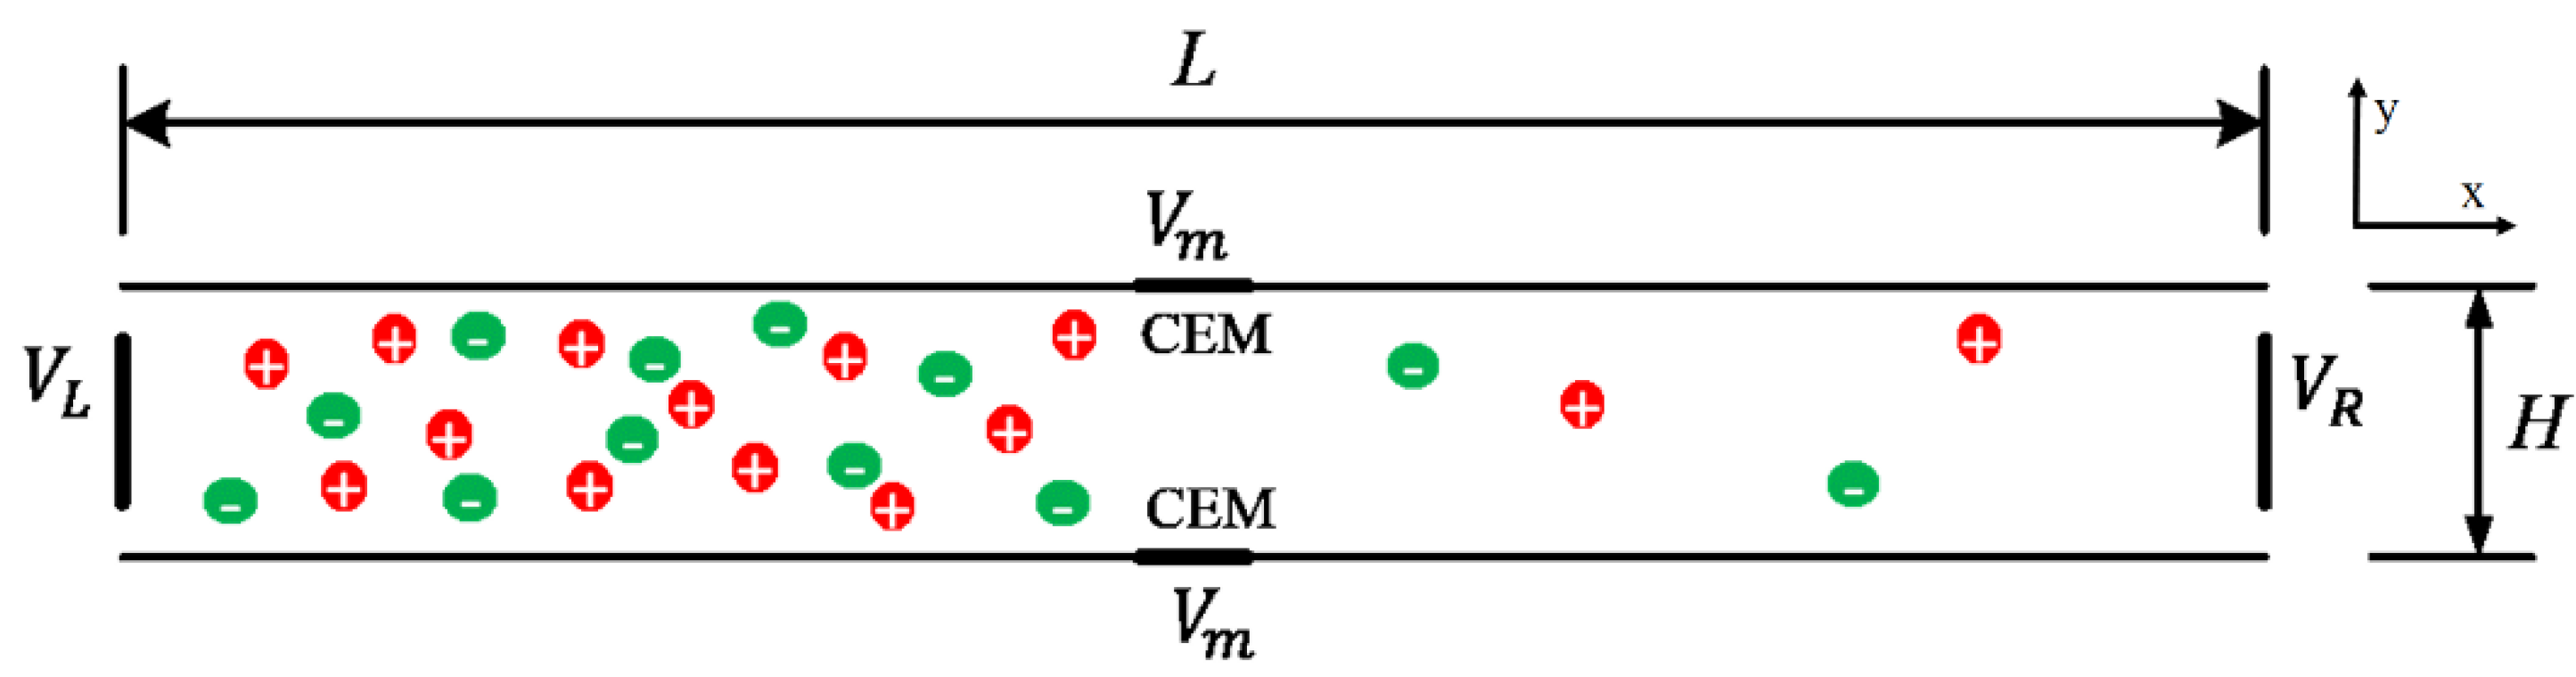
2.1. System Setup
2.2. Governing Equations and Boundary Conditions
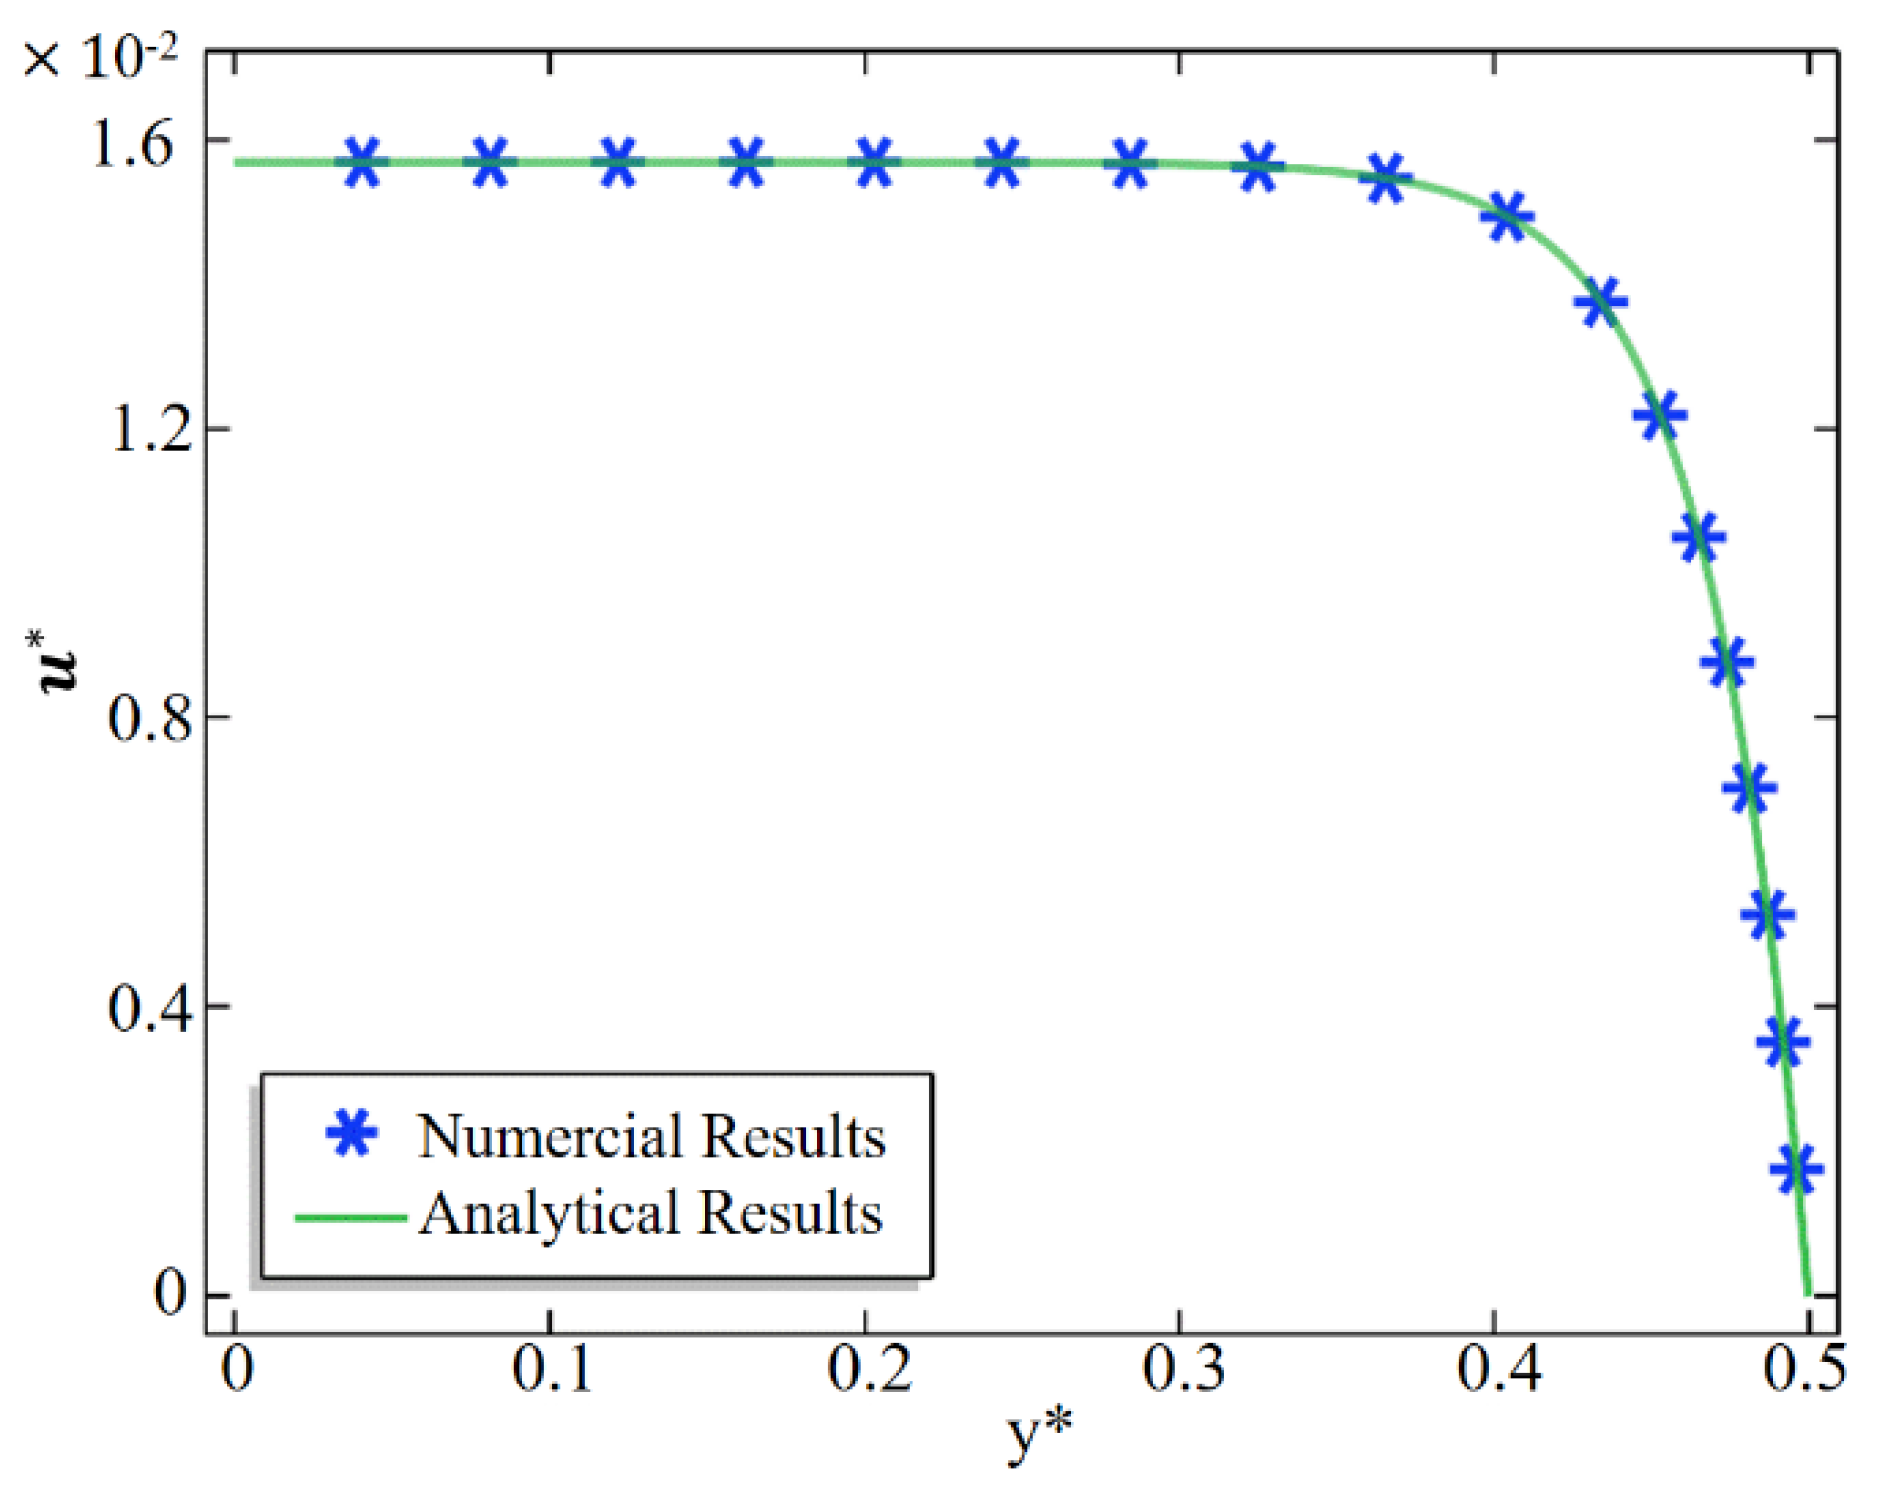
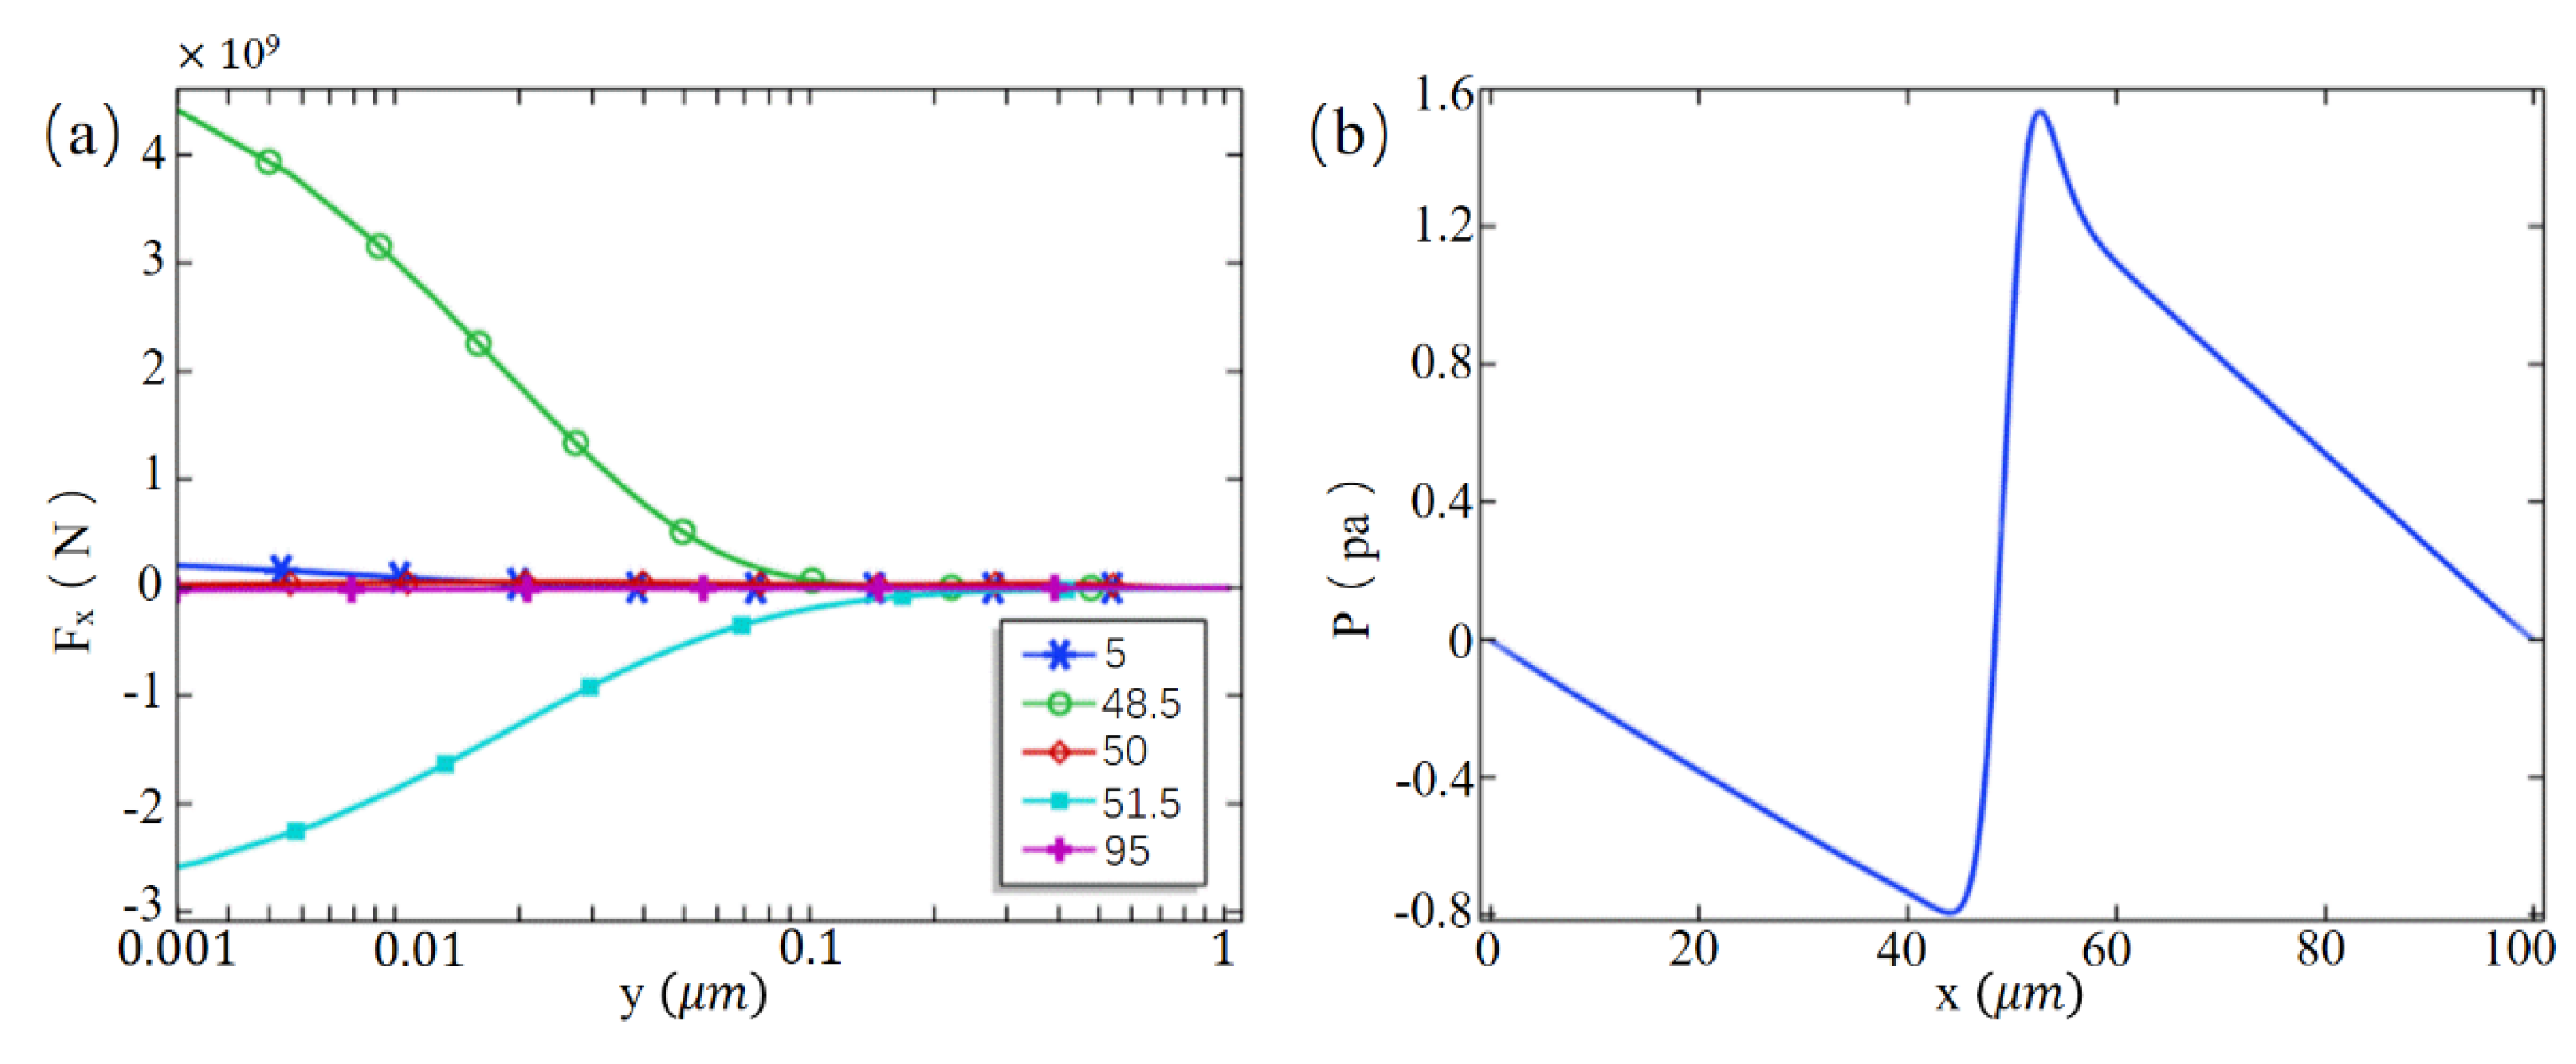
2.3. Numerical Method and Code Validation
3. Results and Discussion
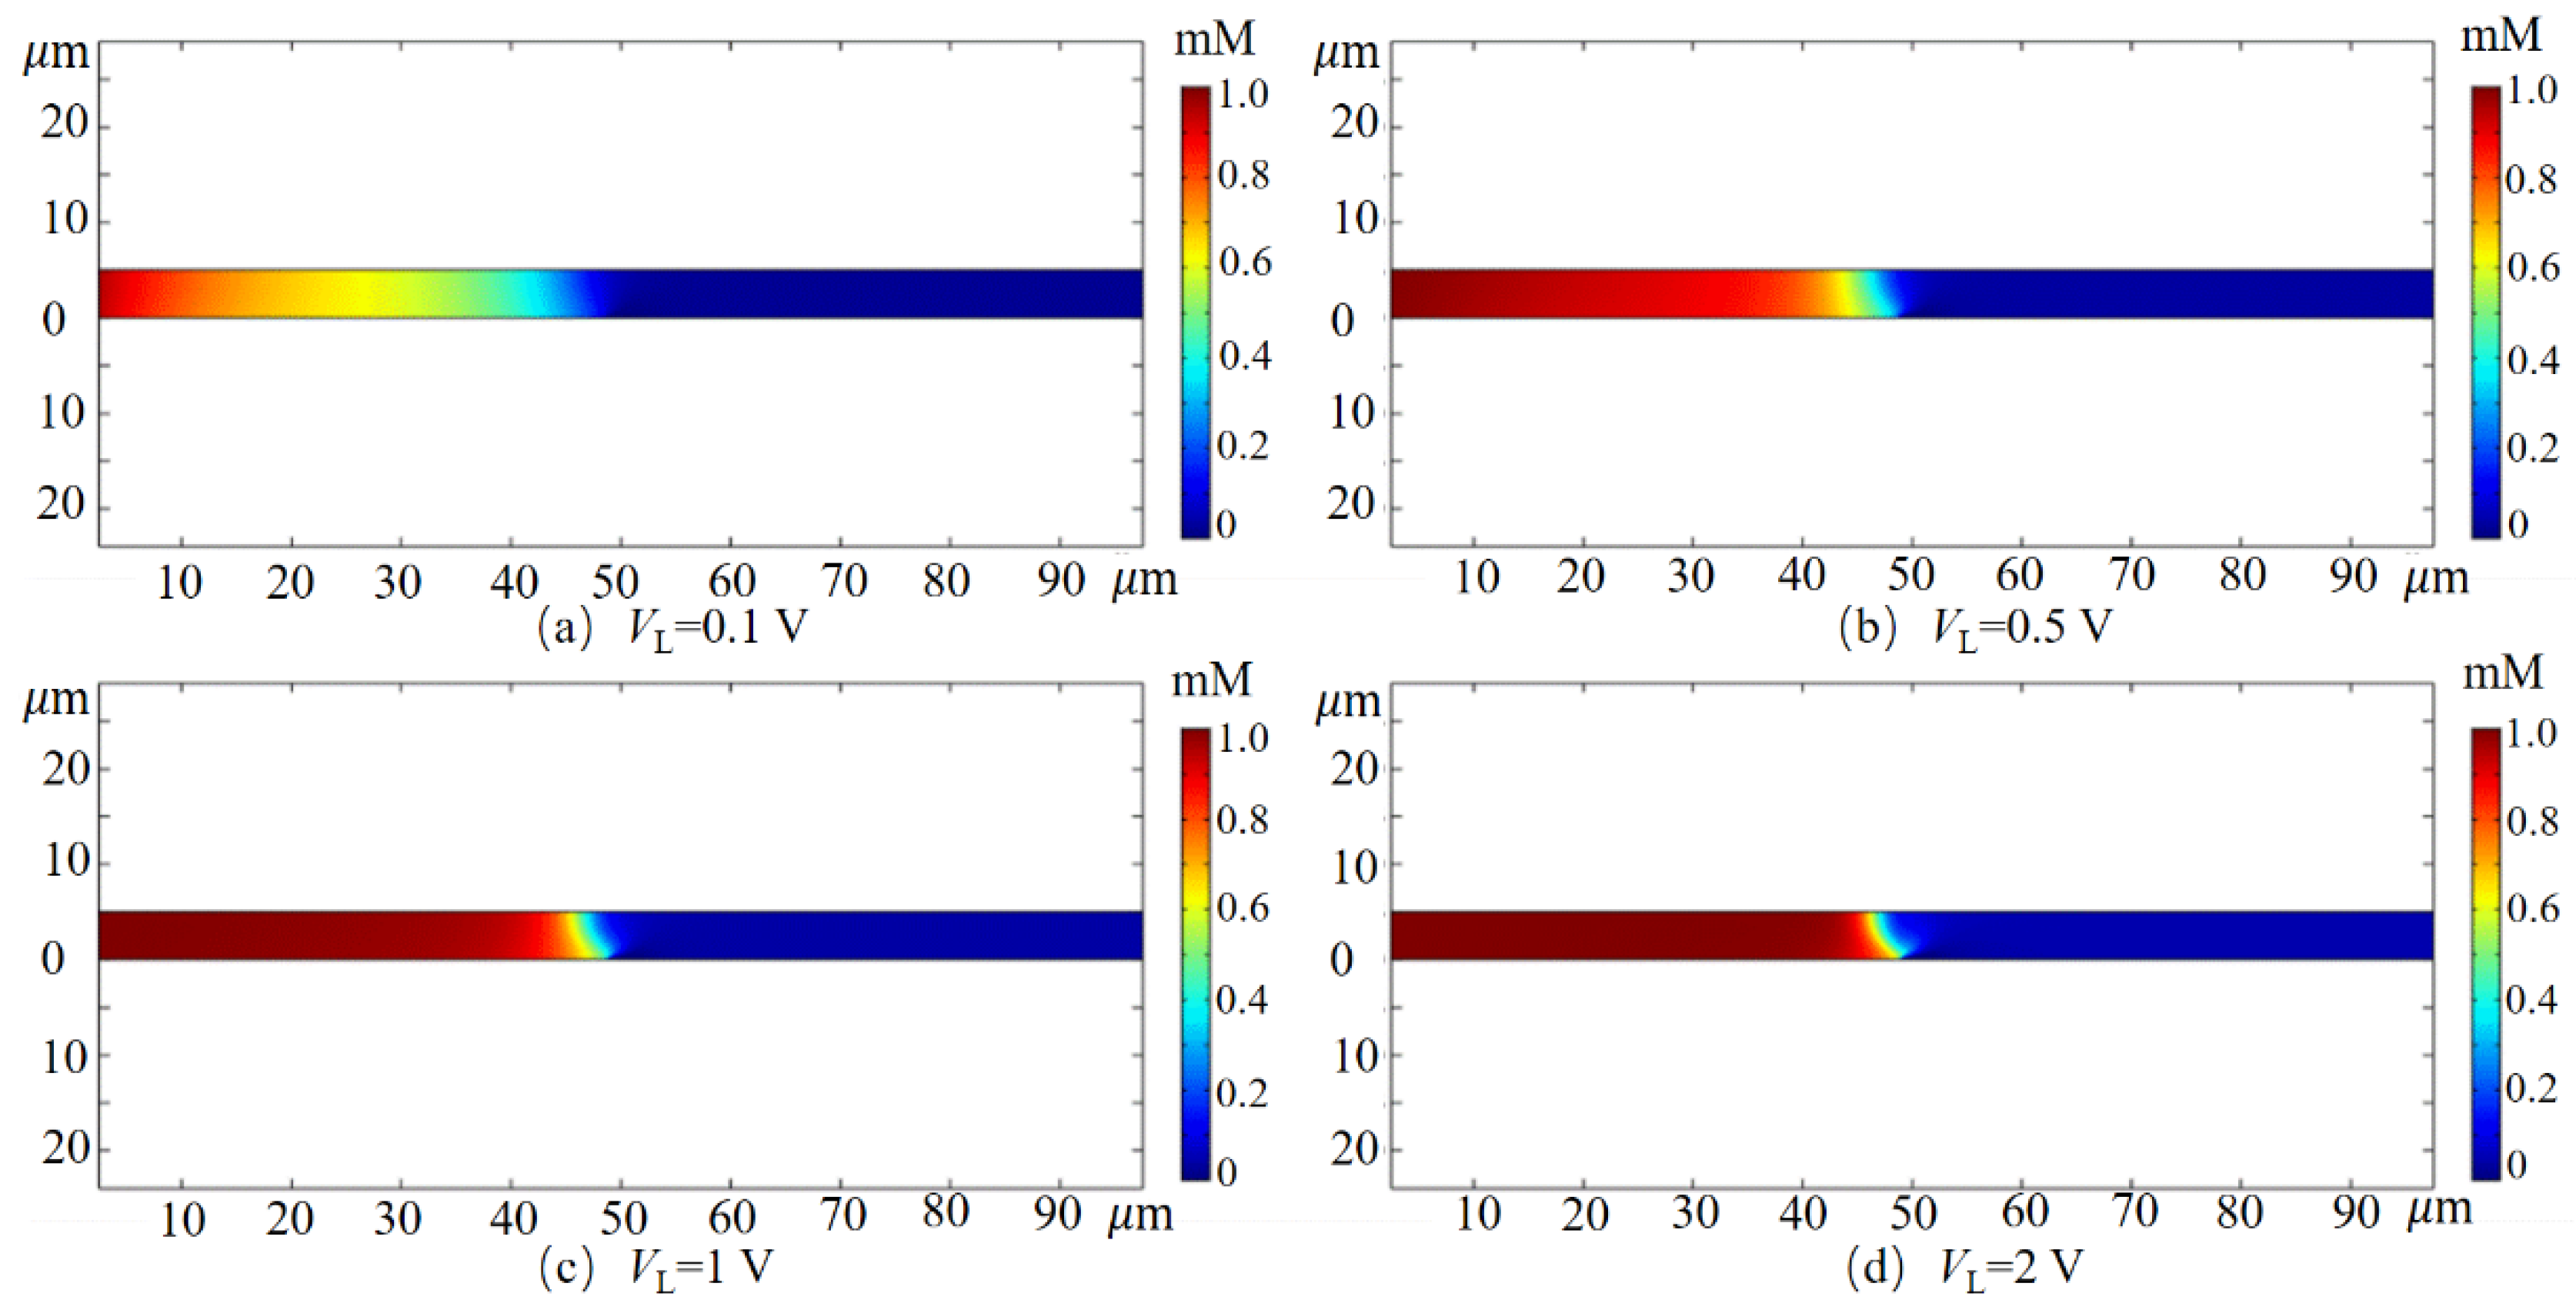
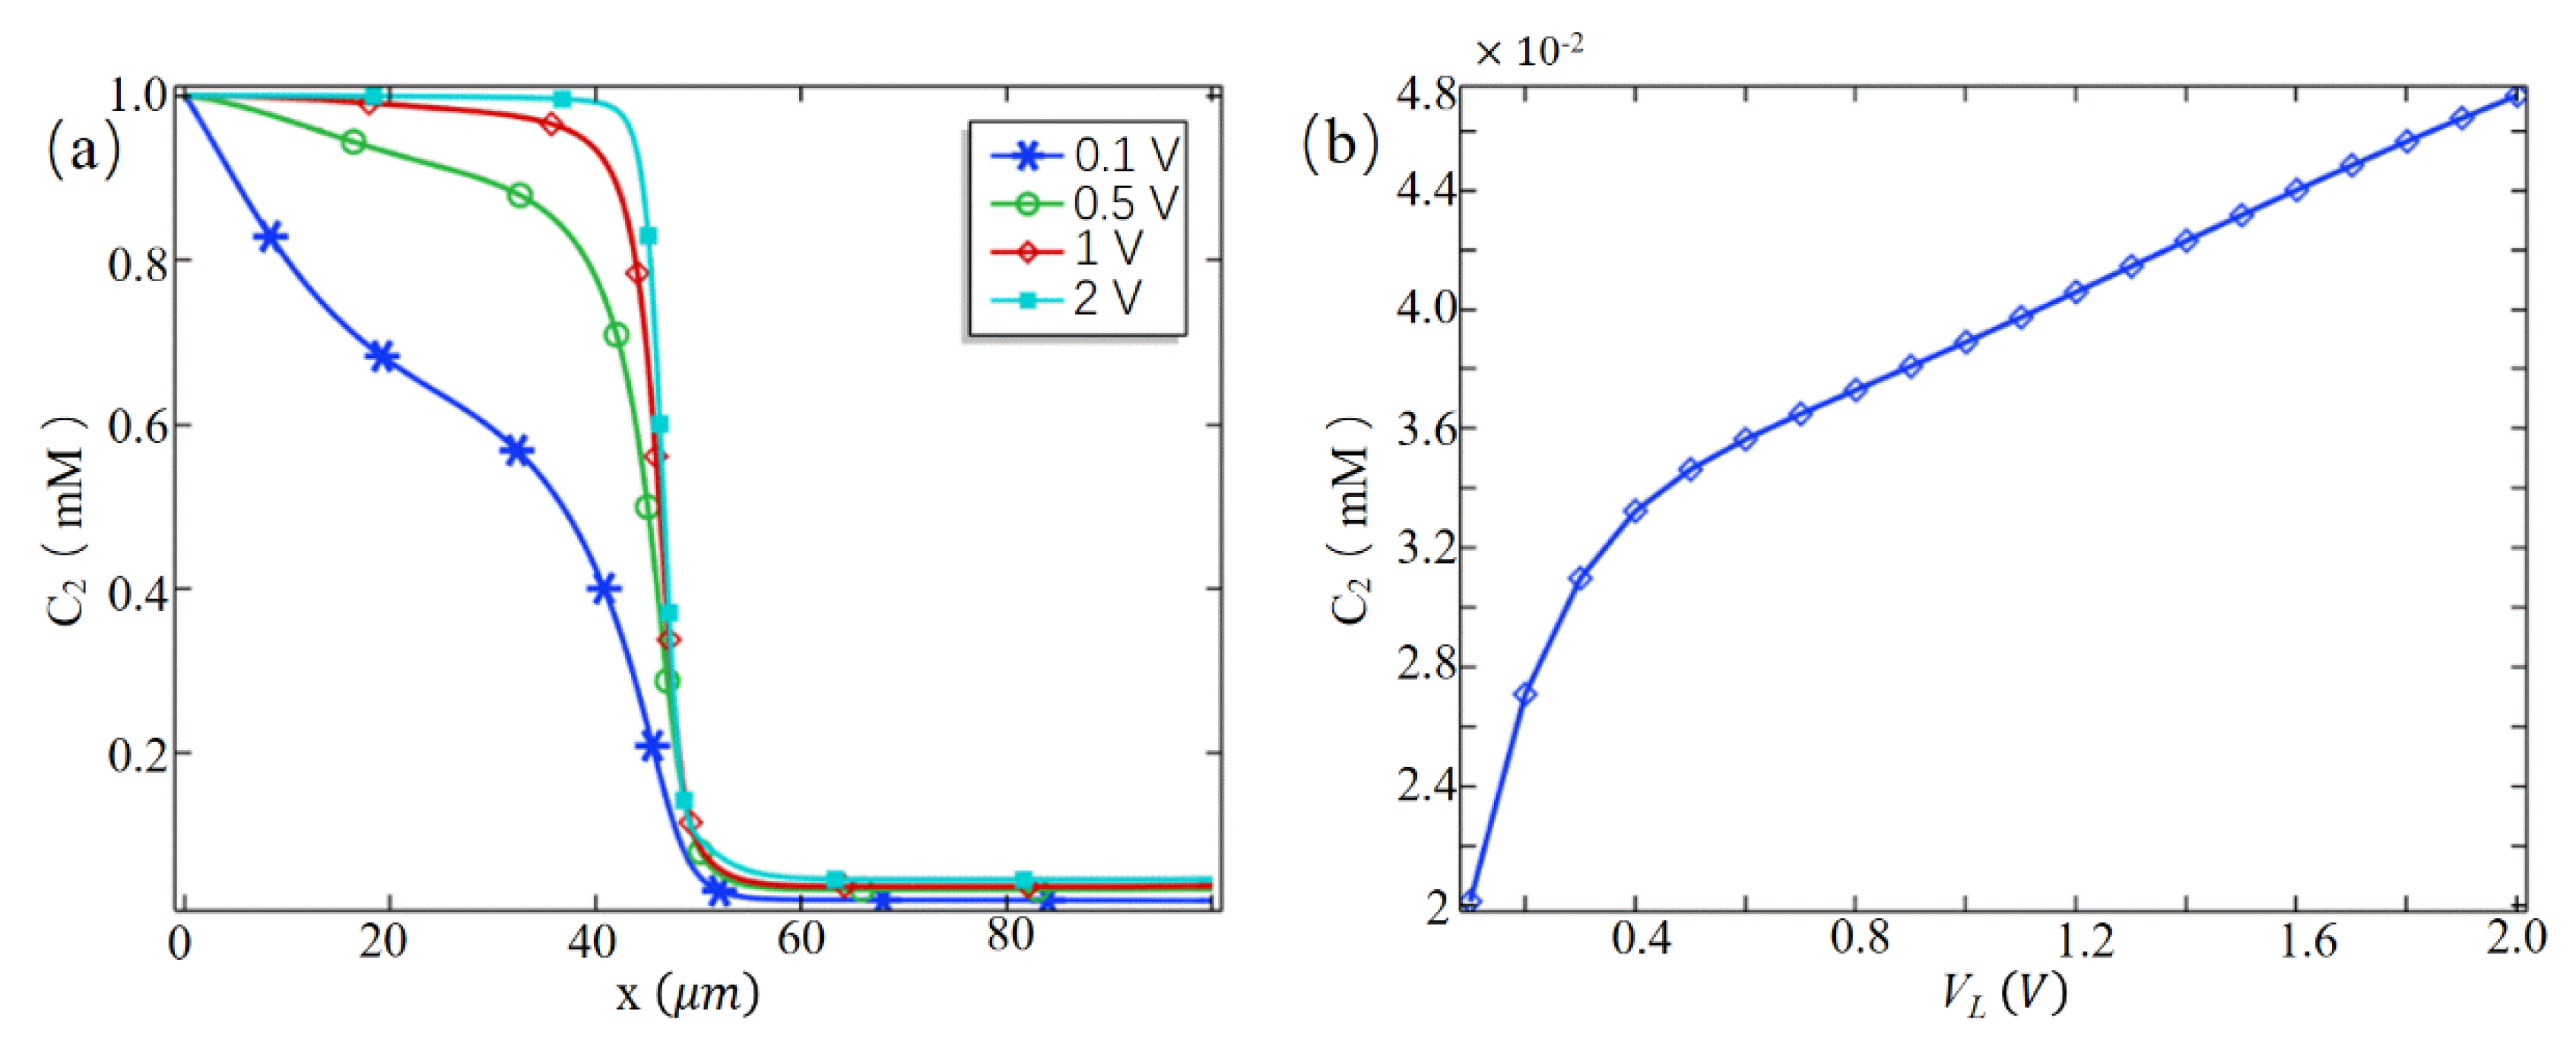
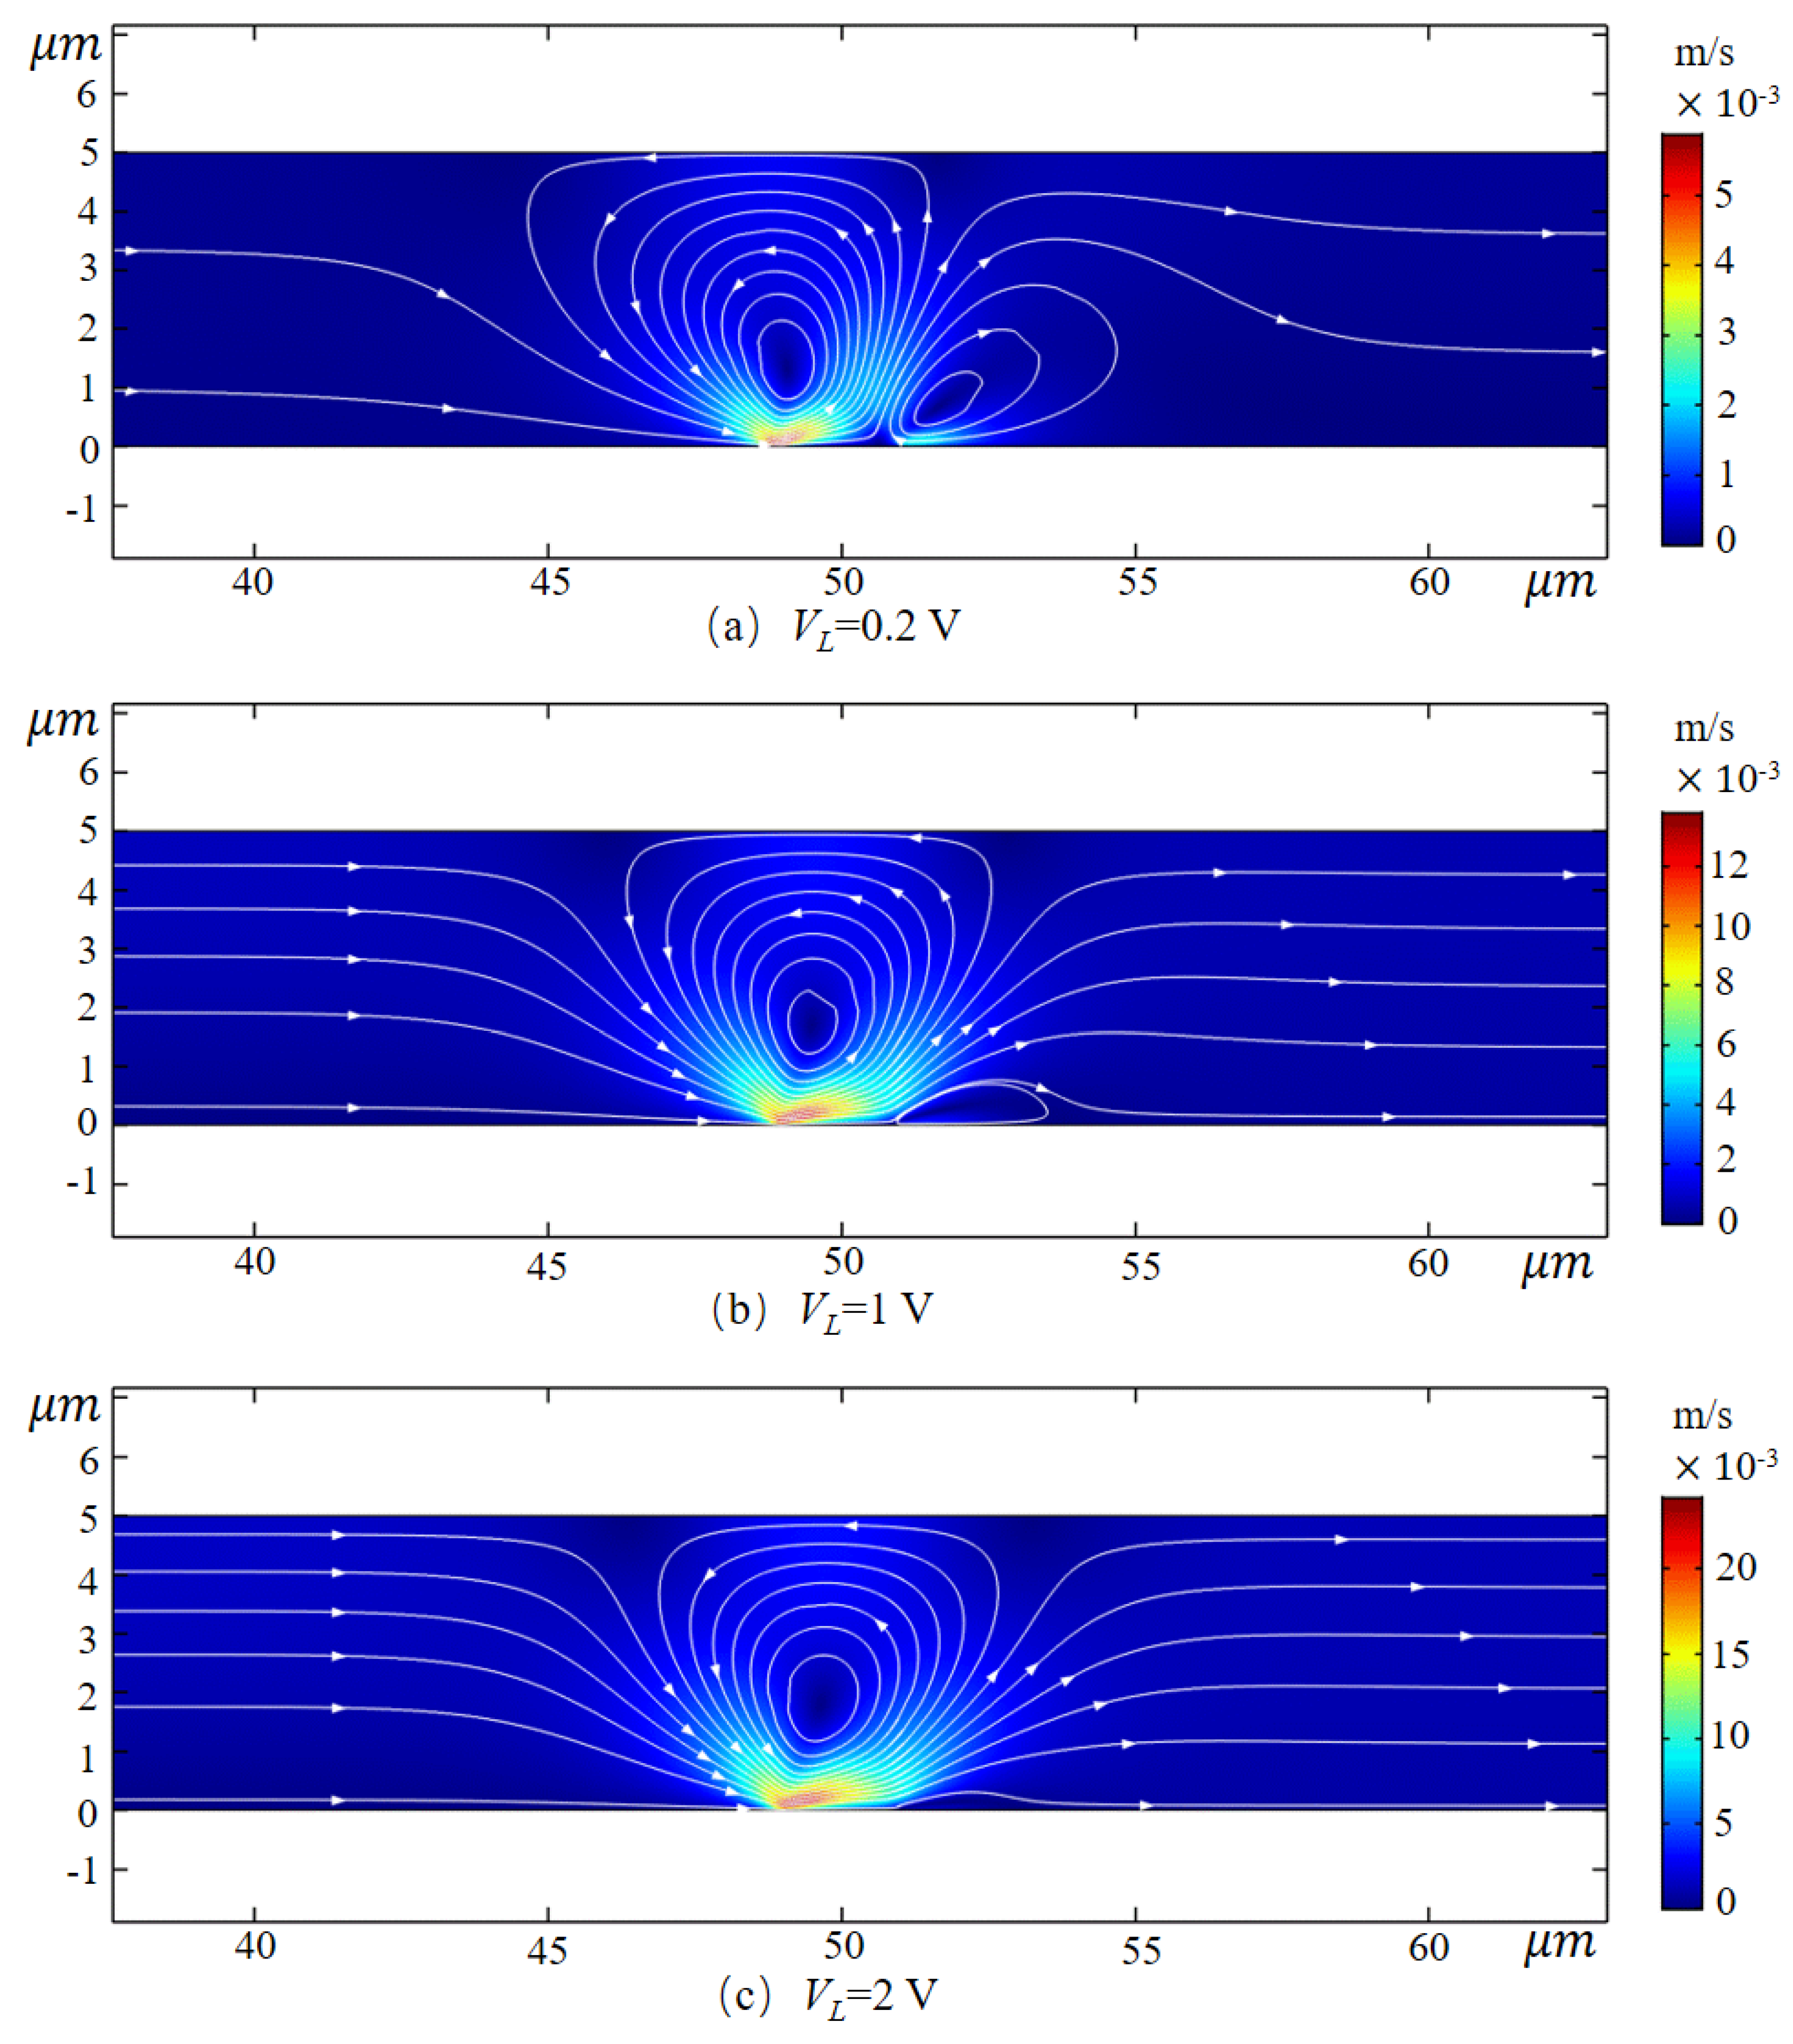
3.1. Desalting Effect
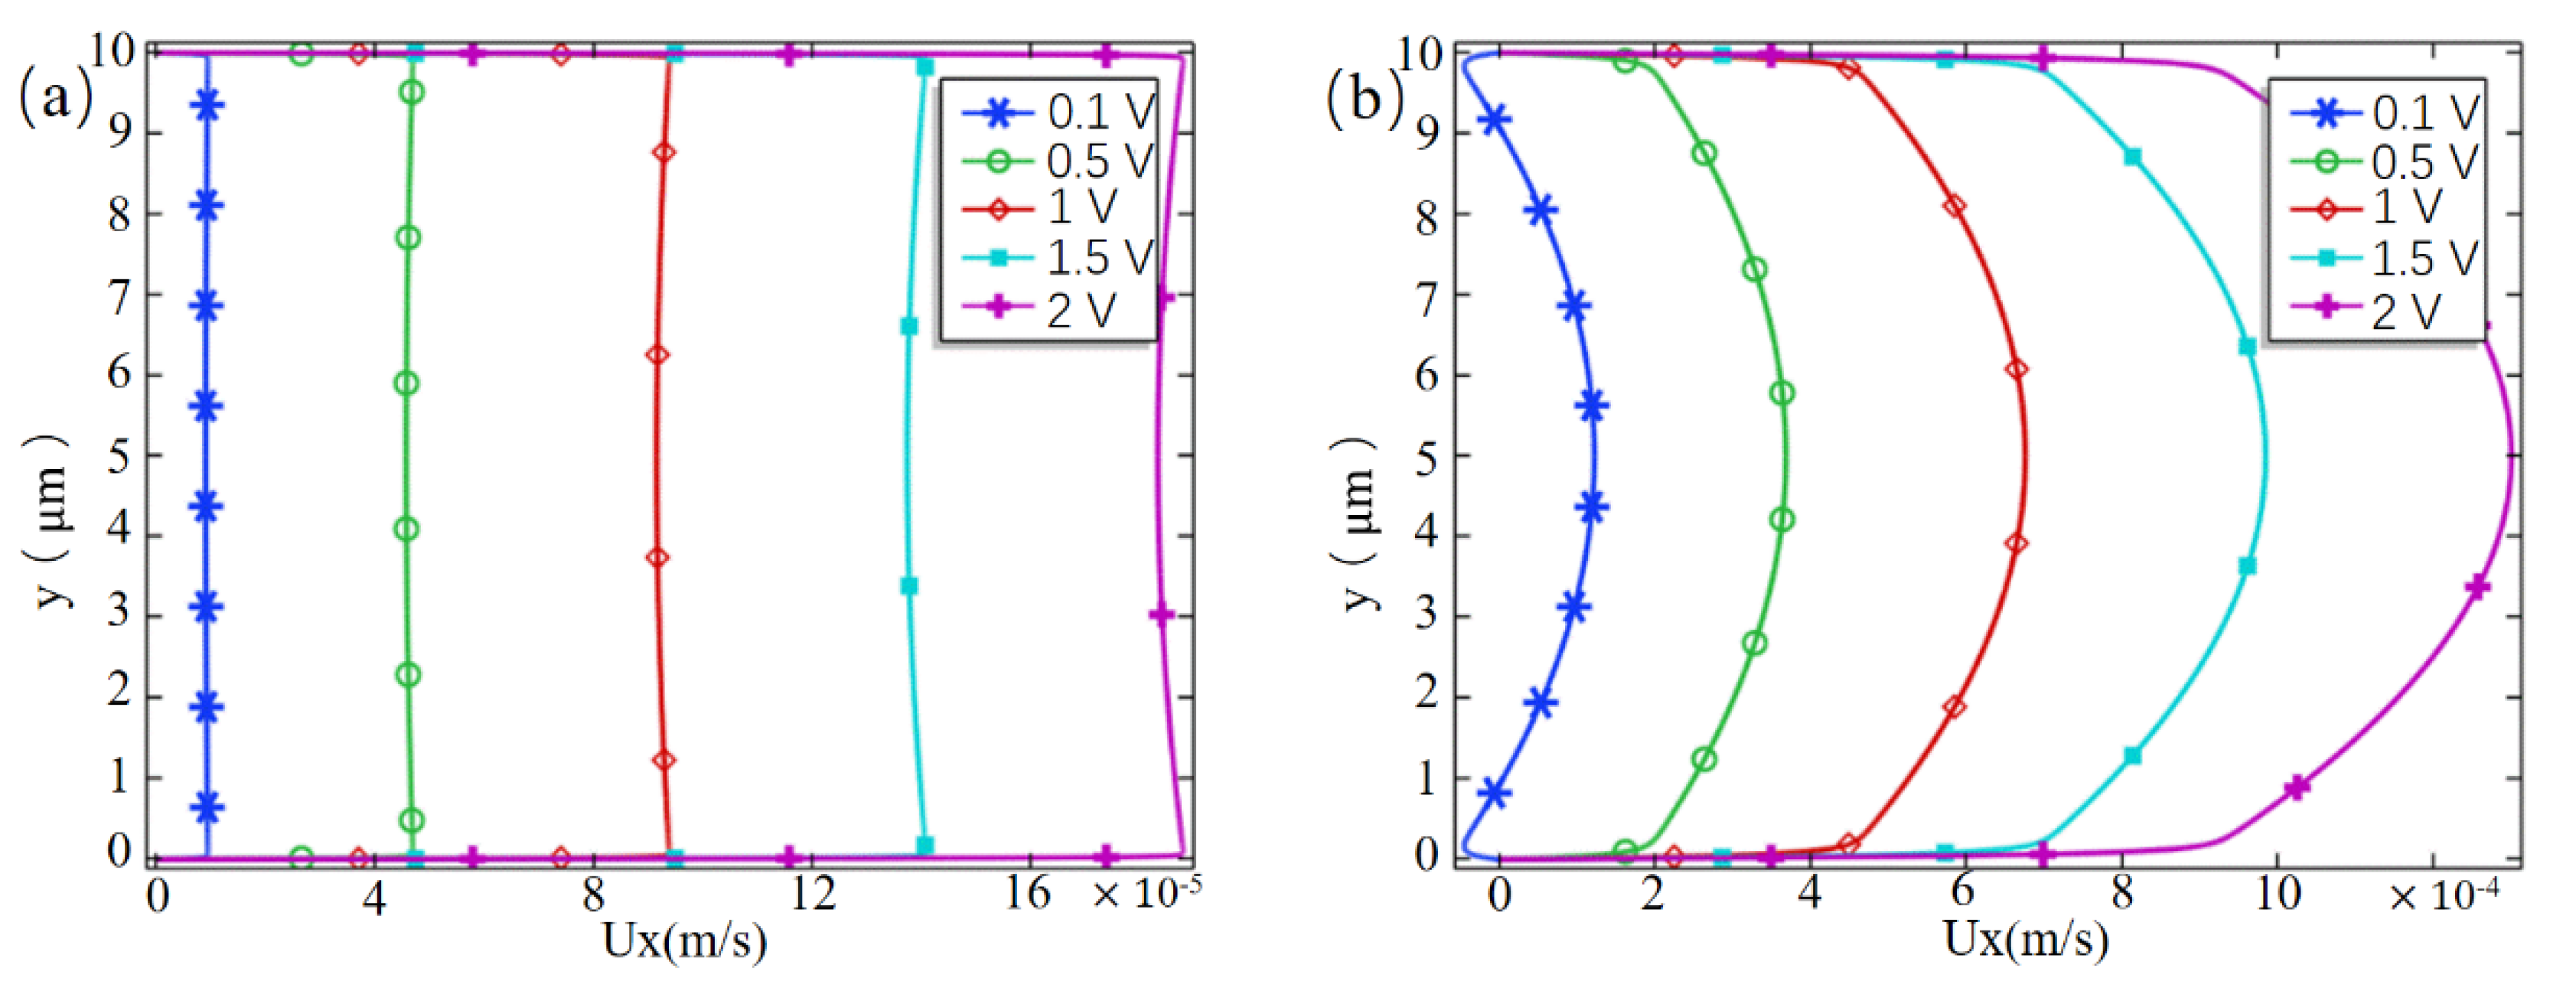
3.2. Pump Effect
4. Conclusions
Author Contributions
Funding
Conflicts of Interest
References
- Reuss, F.F. Notice sur un nouvel effet de l’electricité galvanique, Mémoire Soc. Sup. Imp. de Moscou 1809, 2, 327–337. [Google Scholar]
- Helmholtz, H. Ueber einige Gesetze der Vertheilung elektrischer Ströme in körperlichen Leitern, mit Anwendung auf die thierisch-elektrischen Versuche. Annalen der Physik 1853, 165, 353–377. [Google Scholar] [CrossRef]
- Stroock, A.D.; Weck, M.; Chiu, D.T.; Huck, W.T.; Kenis, P.J.; Ismagilov, R.F.; Whitesides, G.M. Patterning electro-osmotic flow with patterned surface charge. Phys. Rev. Lett. 2000, 84, 3314–3317. [Google Scholar] [CrossRef] [PubMed]
- Li, Z.R.; Liu, G.R.; Chen, Y.Z.; Wang, J.S.; Bow, H.; Cheng, Y.; Han, J. Continuum transport model of Ogston sieving in patterned nanofilter arrays for separation of rod-like biomolecules. Electrophoresis 2008, 29, 329–339. [Google Scholar] [CrossRef] [PubMed]
- Gascoyne, P.R.; Vykoukal, J. Particle separation by dielectrophoresis. Electrophoresis 2002, 23, 1973–1983. [Google Scholar] [CrossRef]
- Li, Z.R.; Liu, W.; Zhu, Y.D.; Lu, X.H.; Gu, Y.T.; Han, J. Accurate multi-physics numerical analysis of particle preconcentration based on ion concentration polarization. Int. J. Appl. Mech. 2017, 9, 1750107. [Google Scholar] [CrossRef]
- Mishchuk, N.A. Concentration polarization of interface and non-linear electrokinetic phenomena. Adv. Colloid Interface Sci. 2010, 160, 16–39. [Google Scholar] [CrossRef]
- Smyrl, W.H.; Newman, J. Double layer structure at the limiting current. Trans Faraday Soc. 1967, 63, 207–216. [Google Scholar] [CrossRef]
- Krol, J.J.; Wessling, M.; Strathmann, H. Concentration polarization with monopolar ion exchange membranes: current–voltage curves and water dissociation. J. Membr. Sci. 1999, 162, 145–154. [Google Scholar] [CrossRef]
- Rubinstein, I.; Shtilman, L. Voltage against current curves of cation exchange membranes. J. Chem. Soc. Faraday Trans. Molecul. Chem. Phys. 1979, 75, 231–246. [Google Scholar] [CrossRef]
- Dukhin, S.S. Electrokinetic phenomena of the second kind and their applications. Adv. Colloid. Interface Sci. 1991, 35, 173–196. [Google Scholar] [CrossRef]
- Baran, A.A.; Babich, Y.A.; Tarovsky, A.A.; Mischuk, N.A. Superfast electrophoresis of ion-exchanger particles. ColloidsSurfs 1992, 68, 141–151. [Google Scholar] [CrossRef]
- Kim, S.J.; Wang, Y.C.; Lee, J.H.; Jang, H.; Han, J. Concentration polarization and nonlinear electrokinetic flow near a nanofluidic channel. Phys. Rev. Lett. 2007, 99, 044501. [Google Scholar] [CrossRef] [PubMed]
- Kwak, R.; Pham, V.S.; Lim, K.M.; Han, J. Shear flow of an electrically charged fluid by ion concentration polarization: Scaling laws for electroconvective vortices. Phys. Rev. Lett. 2013, 110, 114501. [Google Scholar] [CrossRef] [PubMed]
- Khair, A.S.; Squires, T.M. Fundamental aspects of concentration polarization arising from nonuniform electrokinetic transport. PhysFluids 2008, 20, 087102. [Google Scholar] [CrossRef]
- Yossifon, G.; Chang, H.C. Selection of nonequilibrium overlimiting currents: Universal depletion layer formation dynamics and vortex instability. Phys. Rev. Lett. 2008, 101, 254501. [Google Scholar] [CrossRef] [PubMed]
- Rubinstein, S.M.; Manukyan, G.; Staicu, A.; Rubinstein, I.; Zaltzman, B.; Lammertink, R.G.; Mugele, F.; Wessling, M. Direct observation of a nonequilibrium electro-osmotic instability. Phys. Rev. Lett. 2008, 101, 236101. [Google Scholar] [CrossRef] [PubMed]
- Rubinstein, I.; Maletzki, F. Electroconvection at an electrically inhomogeneous permselective membrane surface. Faraday Trans. 1991, 87, 2079–2087. [Google Scholar] [CrossRef]
- Rubinstein, I.; Zaltzman, B.; Kedem, O. Electric fields in and around ion-exchange membranes1. J. Membr. Sci. 1997, 125, 17–21. [Google Scholar] [CrossRef]
- Druzgalski, C.L.; Andersen, M.B.; Mani, A. Direct numerical simulation of electroconvective instability and hydrodynamic chaos near an ionselective surface. Phys. Fluids 2013, 25, 110804. [Google Scholar] [CrossRef]
- Demekhin, E.A.; Nikitin, N.V.; Shelistov, V.S. Direct numerical simulation of electrokinetic in stability and transition to chaotic motion. Phys. Fluids 2013, 25, 122001. [Google Scholar] [CrossRef]
- Pham, V.S.; Li, Z.; Lim, K.M.; White, J.K.; Han, J. Direct numerical simulation of electroconvective instability and hysteretic current-voltage response of a permselective membrane. Phys. Rev. E 2012, 86, 046310. [Google Scholar] [CrossRef] [PubMed]
- Karatay, E.; Druzgalski, C.L.; Mani, A. Simulation of chaotic electrokinetic transport: Performance of commercial software versus custom-built direct numerical simulation codes. J. Colloid Interface Sci. 2015, 446, 67–76. [Google Scholar] [CrossRef] [PubMed]
- Chang, H.C.; Yossifon, G.; Demekhin, E.A. Nanoscale electrokinetics and microvortices: How microhydrodynamics affects nanofluidic ion flux. Annu. Rev. Fluid Mech. 2012, 44, 401–426. [Google Scholar] [CrossRef]
- Mishchuk, N.A.; Heldal, T.; Volden, T.; Auerswald, J.; Knapp, H. Micropump based on electroosmosis of the second kind. Electrophoresis 2009, 30, 3499–3506. [Google Scholar] [CrossRef]
- Kivanc, F.C.; Litster, S. Pumping with electroosmosis of the second kind in mesoporous skeletons. Sens. Actuators B-Chem. 2011, 151, 394–401. [Google Scholar] [CrossRef]
- Kim, S.J.; Li, L.D.; Han, J. Amplified electrokinetic response by concentration polarization near nanofluidic channel. Langmuir 2009, 25, 7759–7765. [Google Scholar] [CrossRef] [PubMed]
- Sherwood, J.D.; Mao, M.; Ghosal, S. Electroosmosis in a finite cylindrical pore: simple models of end effects. Langmuir 2014, 30, 9261–9272. [Google Scholar] [CrossRef]
- Yang, Y.; Pintauro P, N. Multicomponent space-charge transport model for ion-exchange membranes with variable pore properties. Ind. Eng. Chem. Res. 2004, 43, 2957–2965. [Google Scholar] [CrossRef]
- Szymczyk, A.; Zhu, H.; Balannec, B. Pressure-driven ionic transport through nanochannels with inhomogenous charge distributions. Langmuir 2009, 26, 1214–1220. [Google Scholar] [CrossRef]
- Moya A, A. Electrochemical impedance of ion-exchange membranes in ternary solutions with two counterions. J. Phys. Chem. C 2014, 118, 2539–2553. [Google Scholar] [CrossRef]
- Ahualli, S.; Fernandez, M.M.; Iglesias, G.; Jiménez, M.L.; Liu, F.; Wagterveld, M.; Delgado, A.V. Effect of solution composition on the energy production by capacitive mixing in membrane-electrode assembly. J. Phys. Chem. C 2014, 118, 15590–15599. [Google Scholar] [CrossRef] [PubMed]
- Deng, D.; Dydek, E.V.; Han, J.-H.; Schlumpberger, S.; Mani, A.; Zaltzman, B.; Bazant, M.Z. Overlimiting current and shock electrodialysis in porous media. Langmuir 2013, 29, 16167–16177. [Google Scholar] [CrossRef] [PubMed]
- White, H.S.; Bund, A. Ion current rectification at nanopores in glass membranes. Langmuir 2008, 24, 2212–2218. [Google Scholar] [CrossRef] [PubMed]
- Kim, S.J.; Ko, S.H.; Kang, K.H.; Han, J. Direct seawater desalination by ion concentration polarization. Nat. Nanotech. 2010, 5, 297–301. [Google Scholar] [CrossRef] [PubMed]


© 2019 by the authors. Licensee MDPI, Basel, Switzerland. This article is an open access article distributed under the terms and conditions of the Creative Commons Attribution (CC BY) license (http://creativecommons.org/licenses/by/4.0/).
Share and Cite
Li, J.; Chen, D.; Ye, J.; Zhang, L.; Zhou, T.; Zhou, Y. Direct Numerical Simulation of Seawater Desalination Based on Ion Concentration Polarization. Micromachines 2019, 10, 562. https://doi.org/10.3390/mi10090562
Li J, Chen D, Ye J, Zhang L, Zhou T, Zhou Y. Direct Numerical Simulation of Seawater Desalination Based on Ion Concentration Polarization. Micromachines. 2019; 10(9):562. https://doi.org/10.3390/mi10090562
Chicago/Turabian StyleLi, Jie, Dilin Chen, Jian Ye, Lai Zhang, Teng Zhou, and Yi Zhou. 2019. "Direct Numerical Simulation of Seawater Desalination Based on Ion Concentration Polarization" Micromachines 10, no. 9: 562. https://doi.org/10.3390/mi10090562
APA StyleLi, J., Chen, D., Ye, J., Zhang, L., Zhou, T., & Zhou, Y. (2019). Direct Numerical Simulation of Seawater Desalination Based on Ion Concentration Polarization. Micromachines, 10(9), 562. https://doi.org/10.3390/mi10090562