Driving Forces of the Bubble-Driven Tubular Micromotor Based on the Full Life-Cycle of the Bubble


Abstract
:1. Introduction
2. Materials and Methods
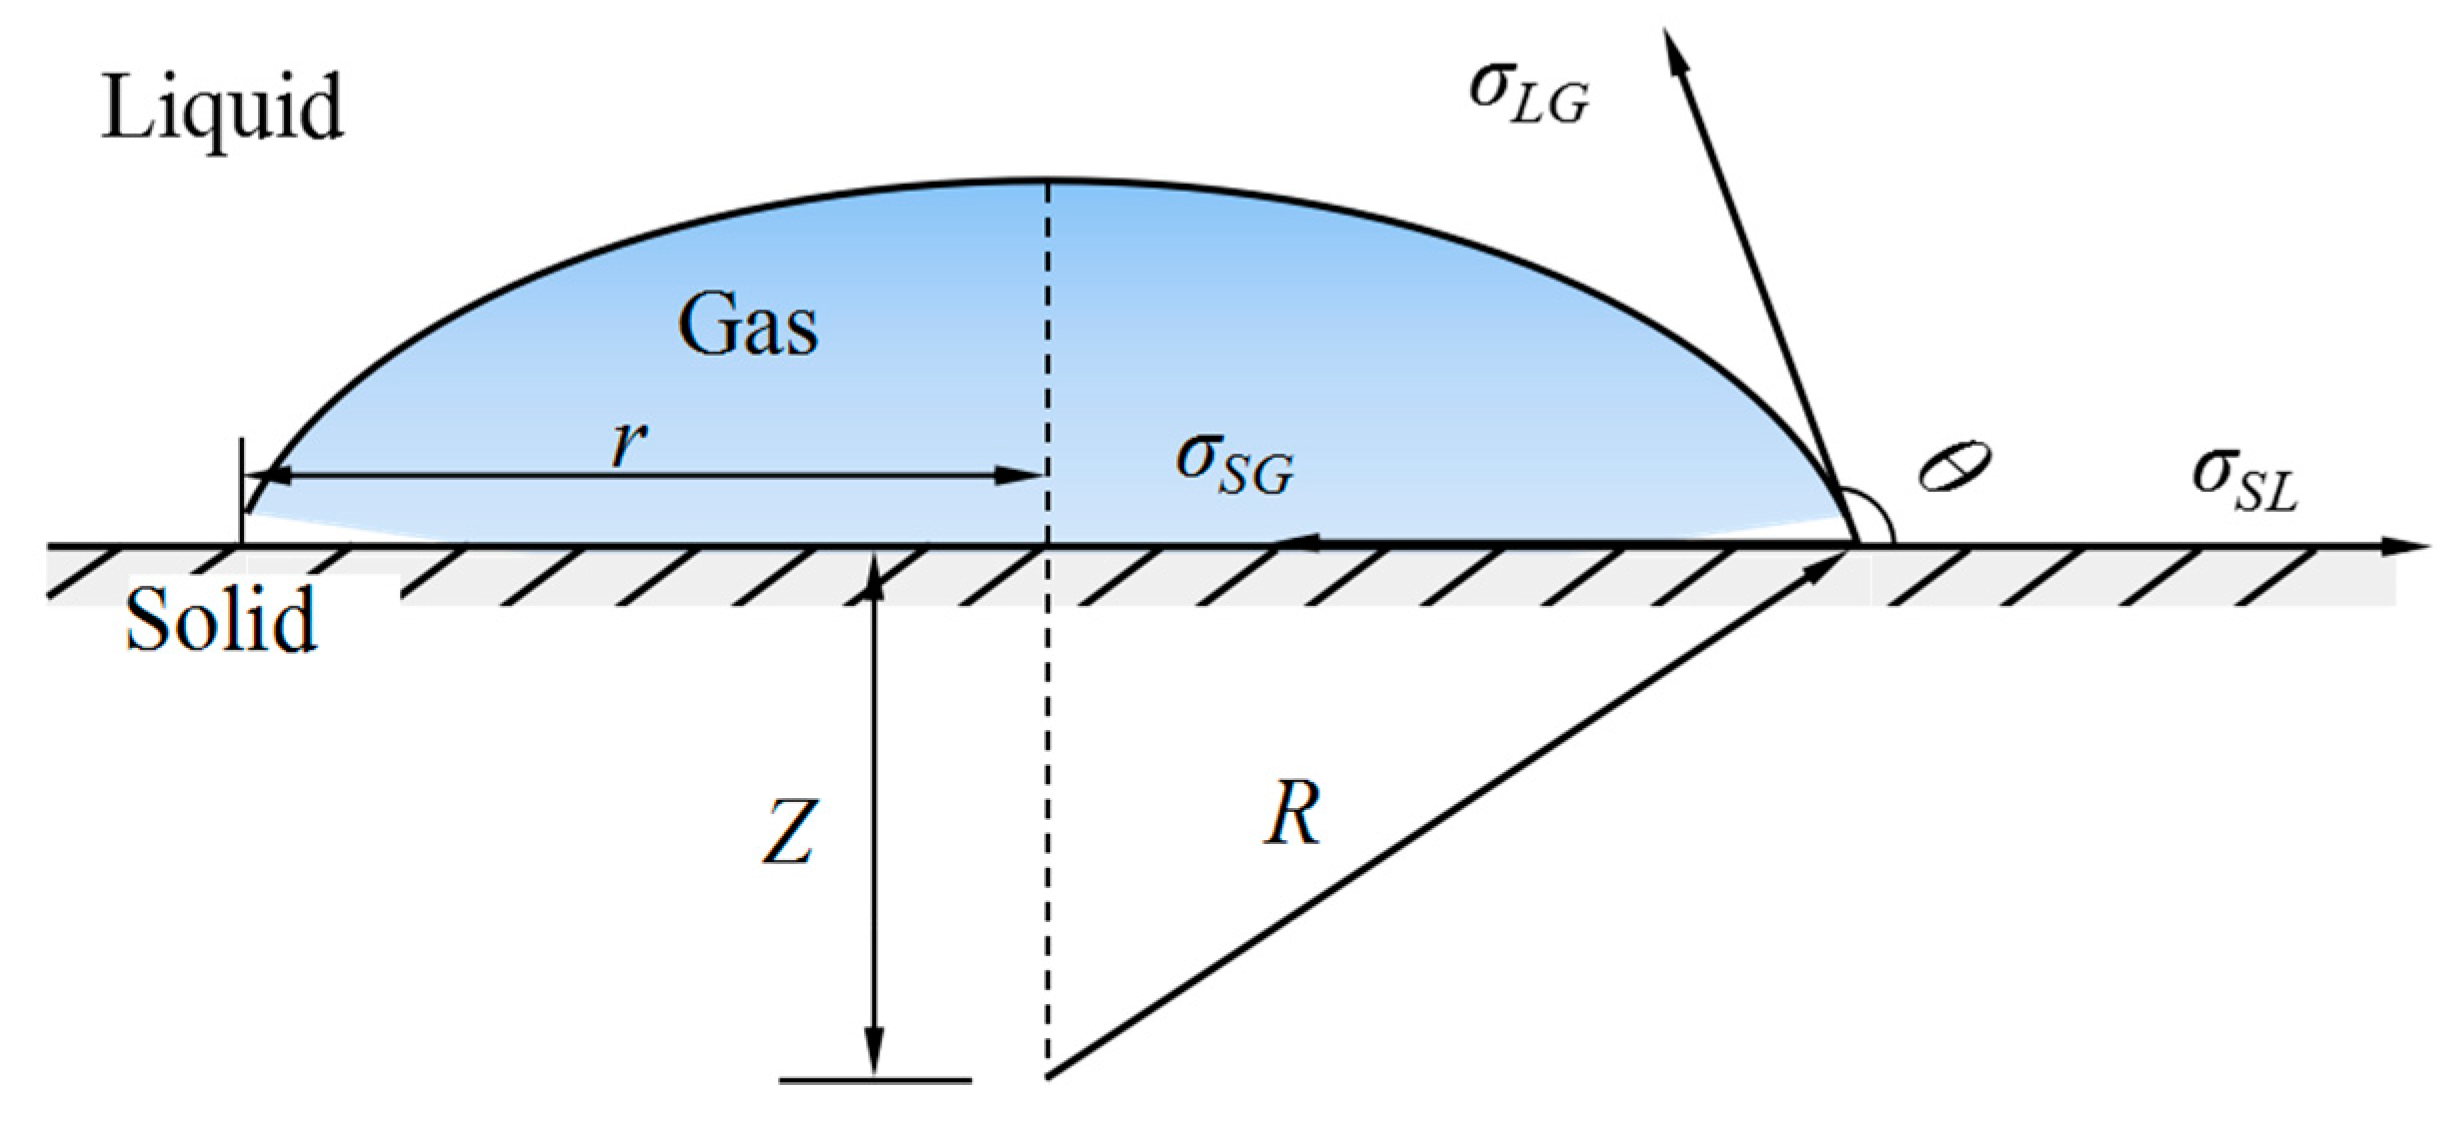
2.1. Bubble Nucleation
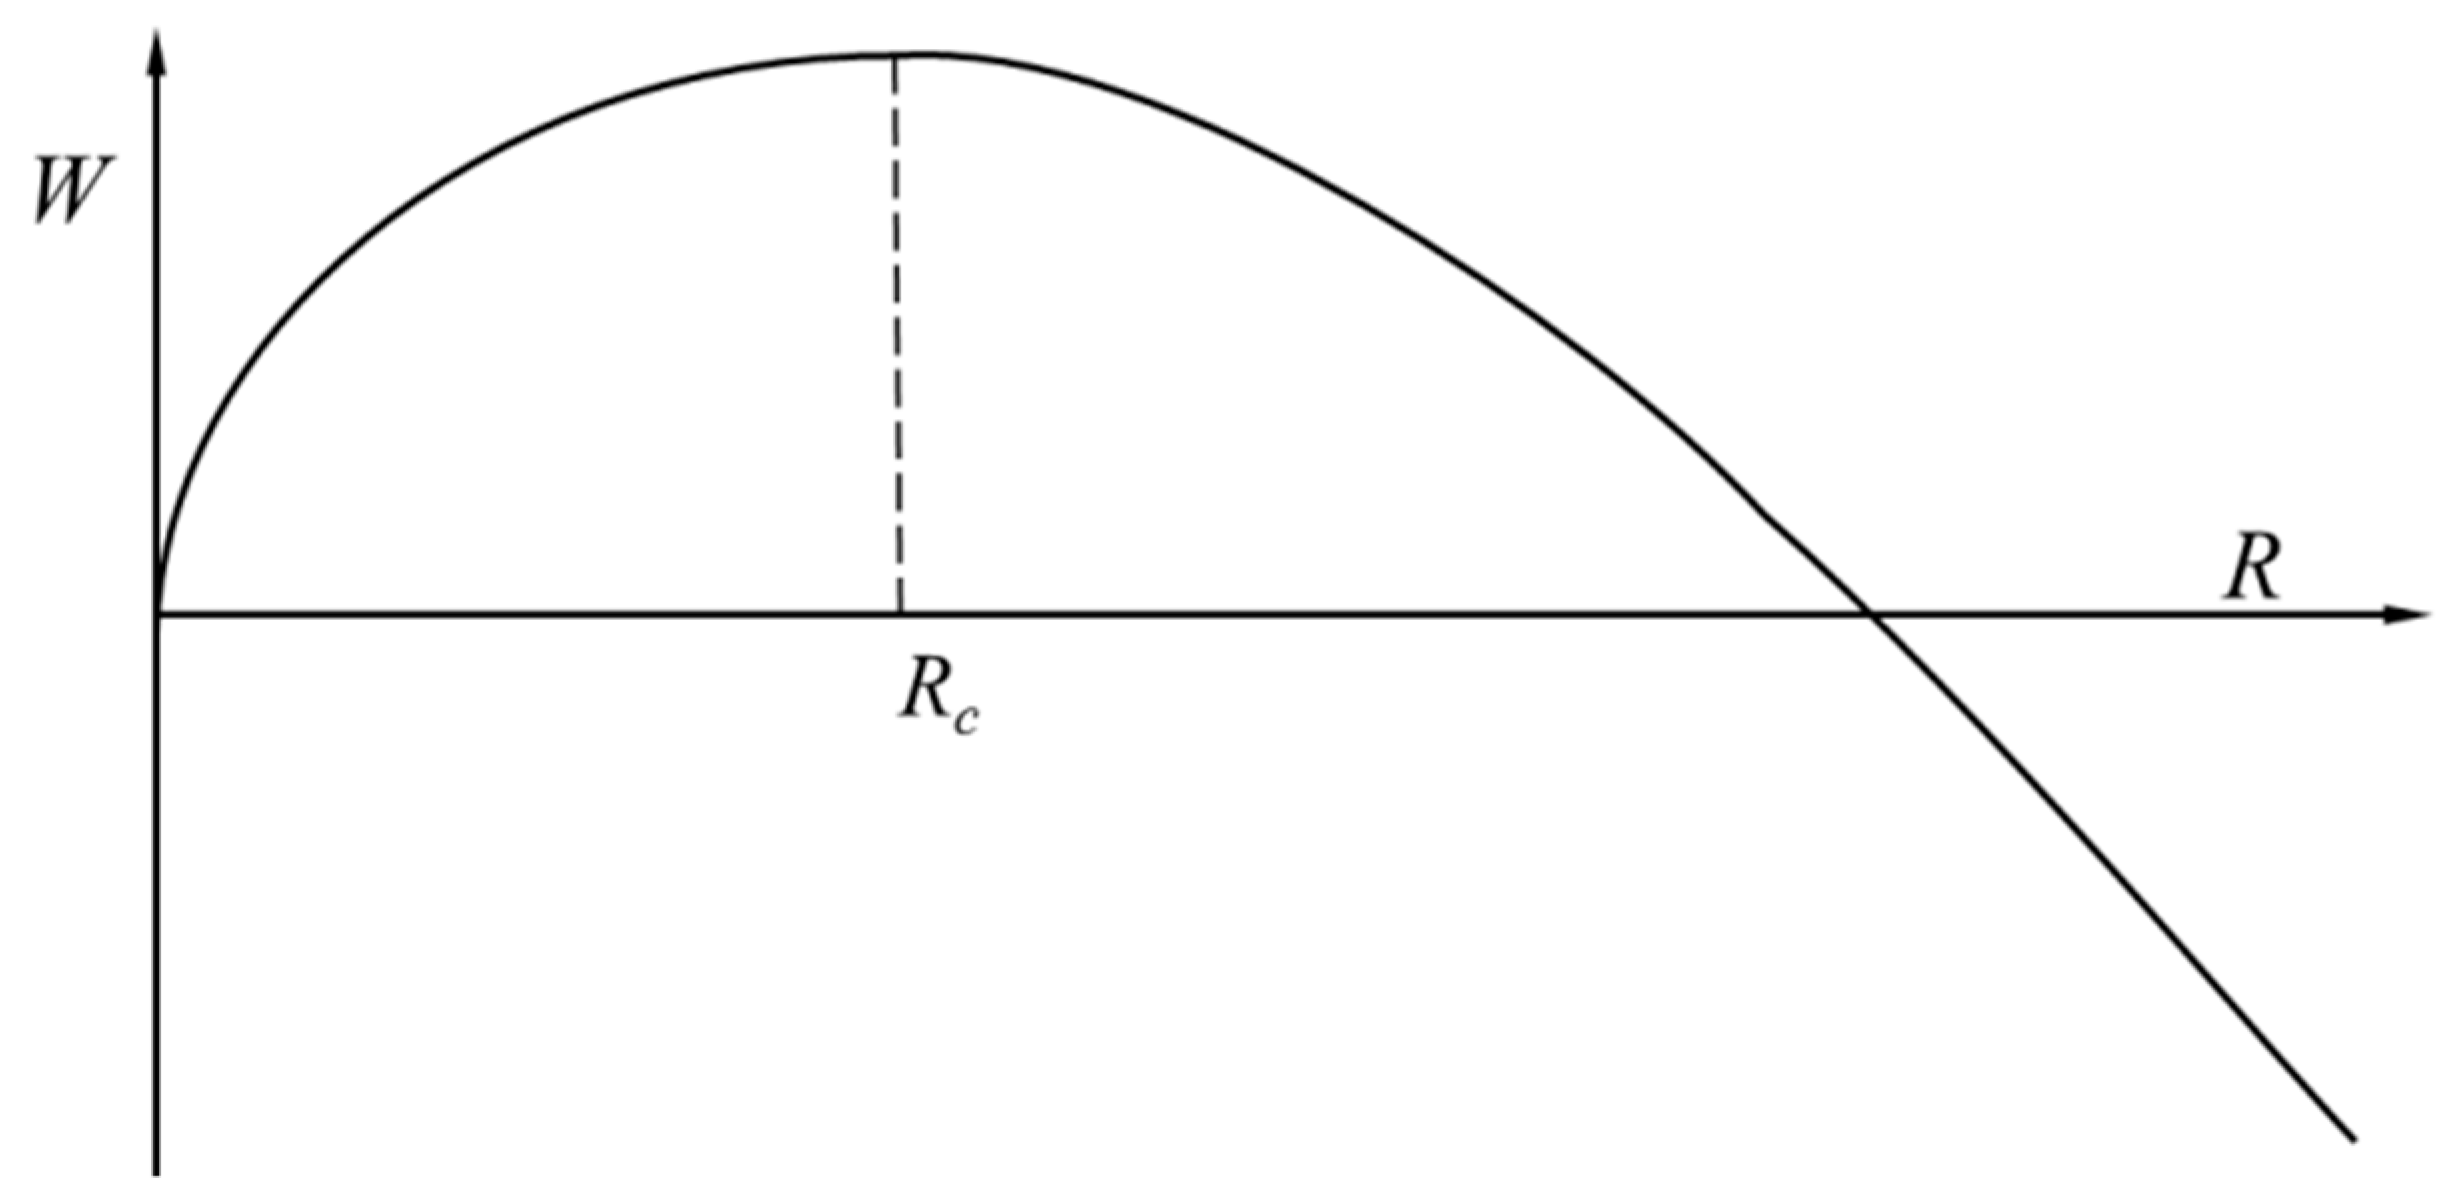
2.2. Bubble Growth
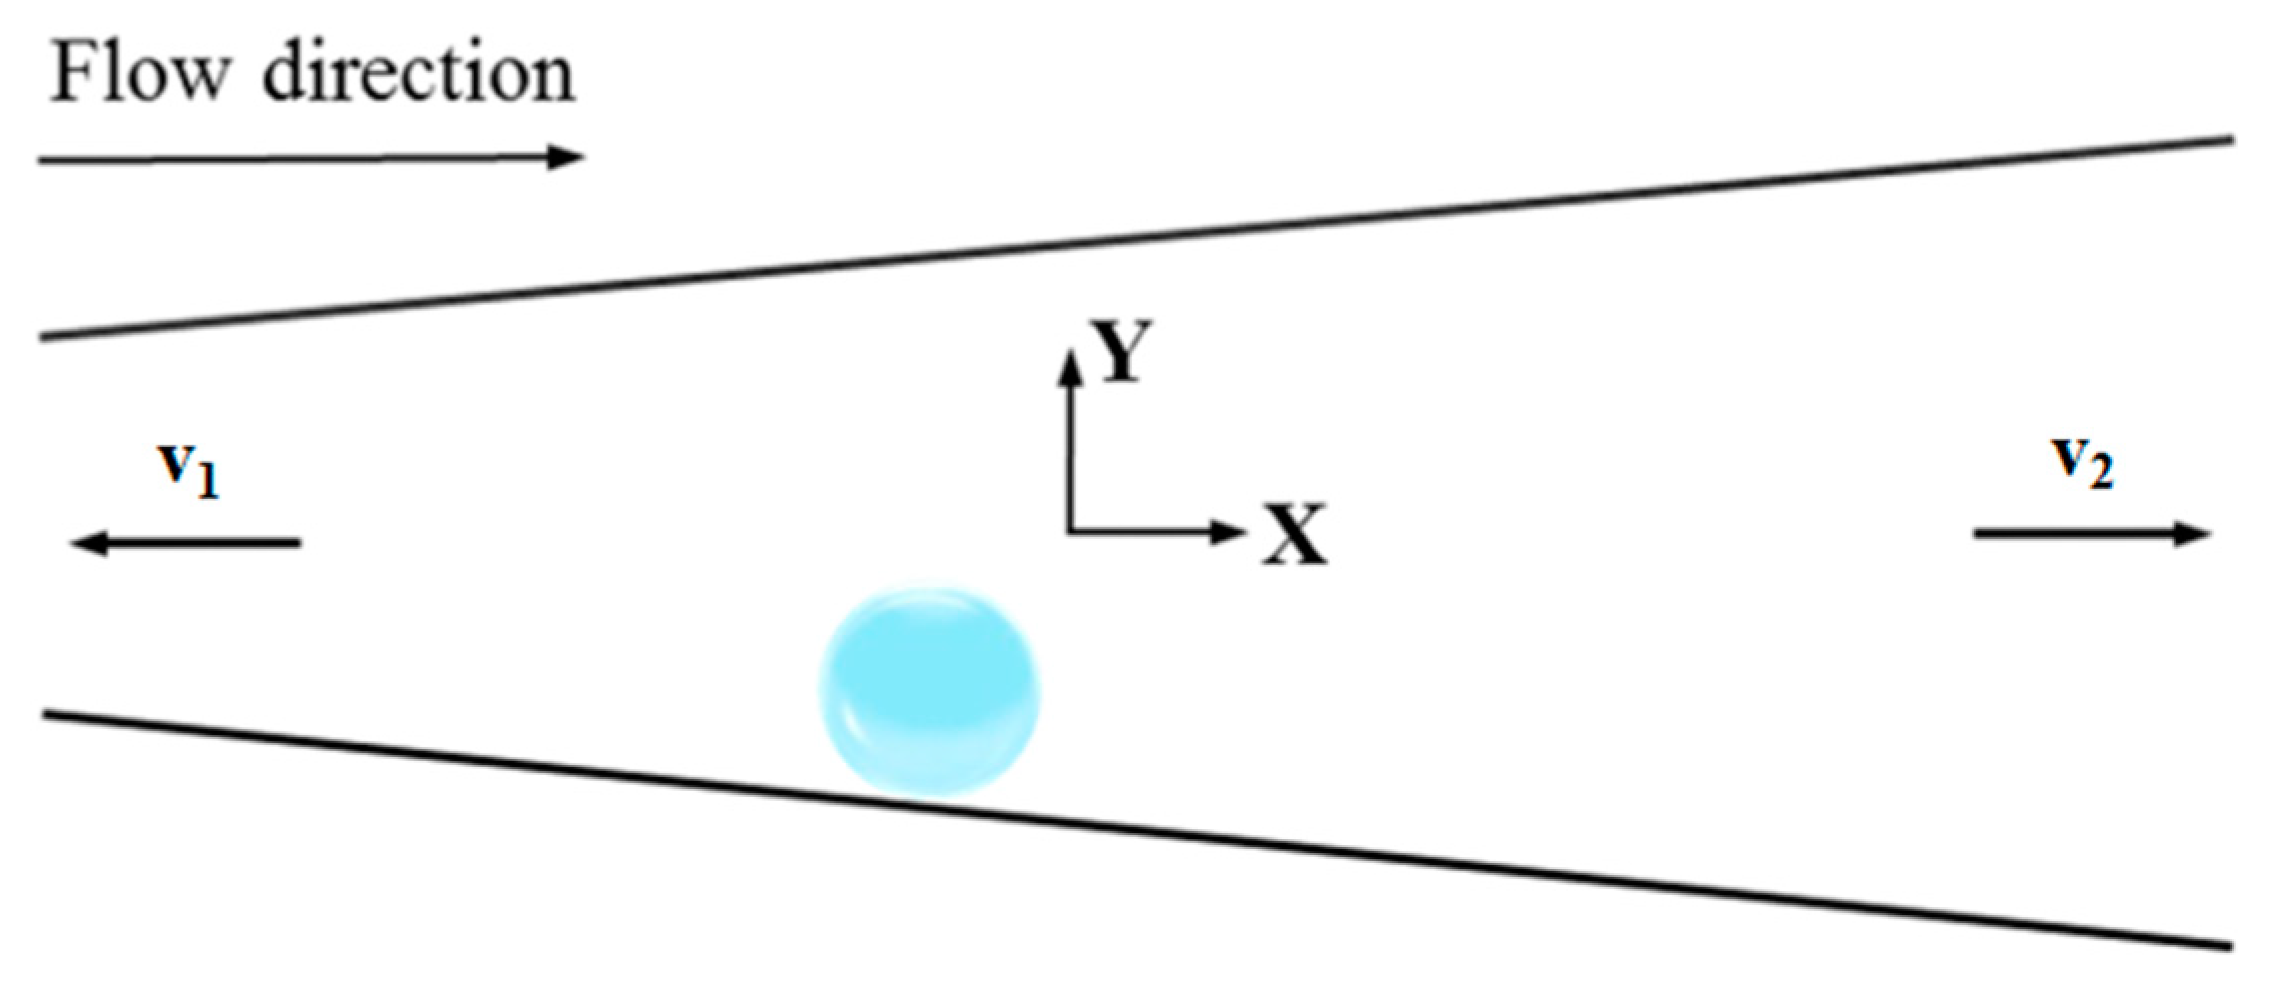
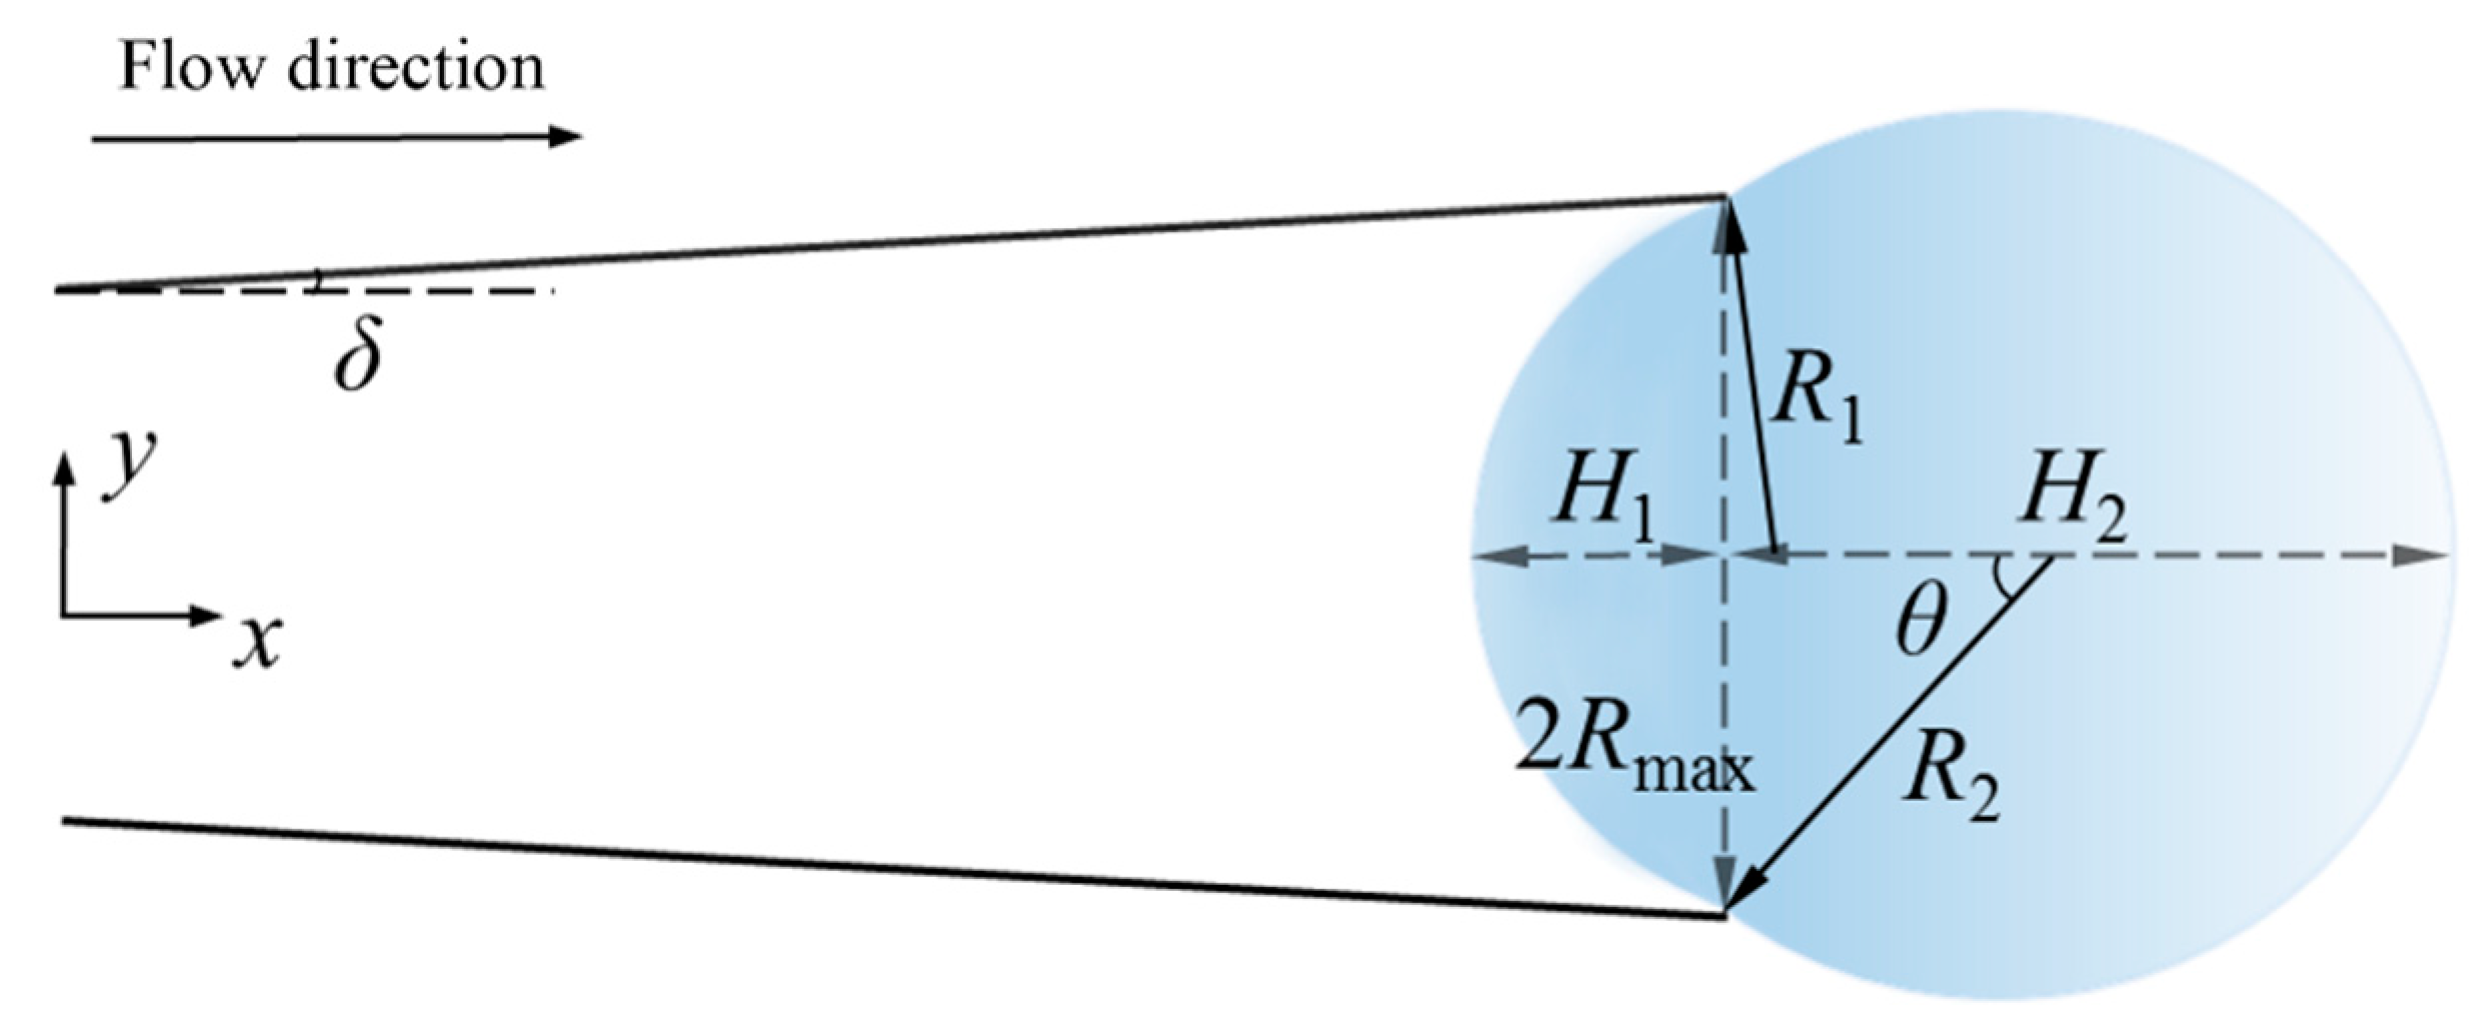
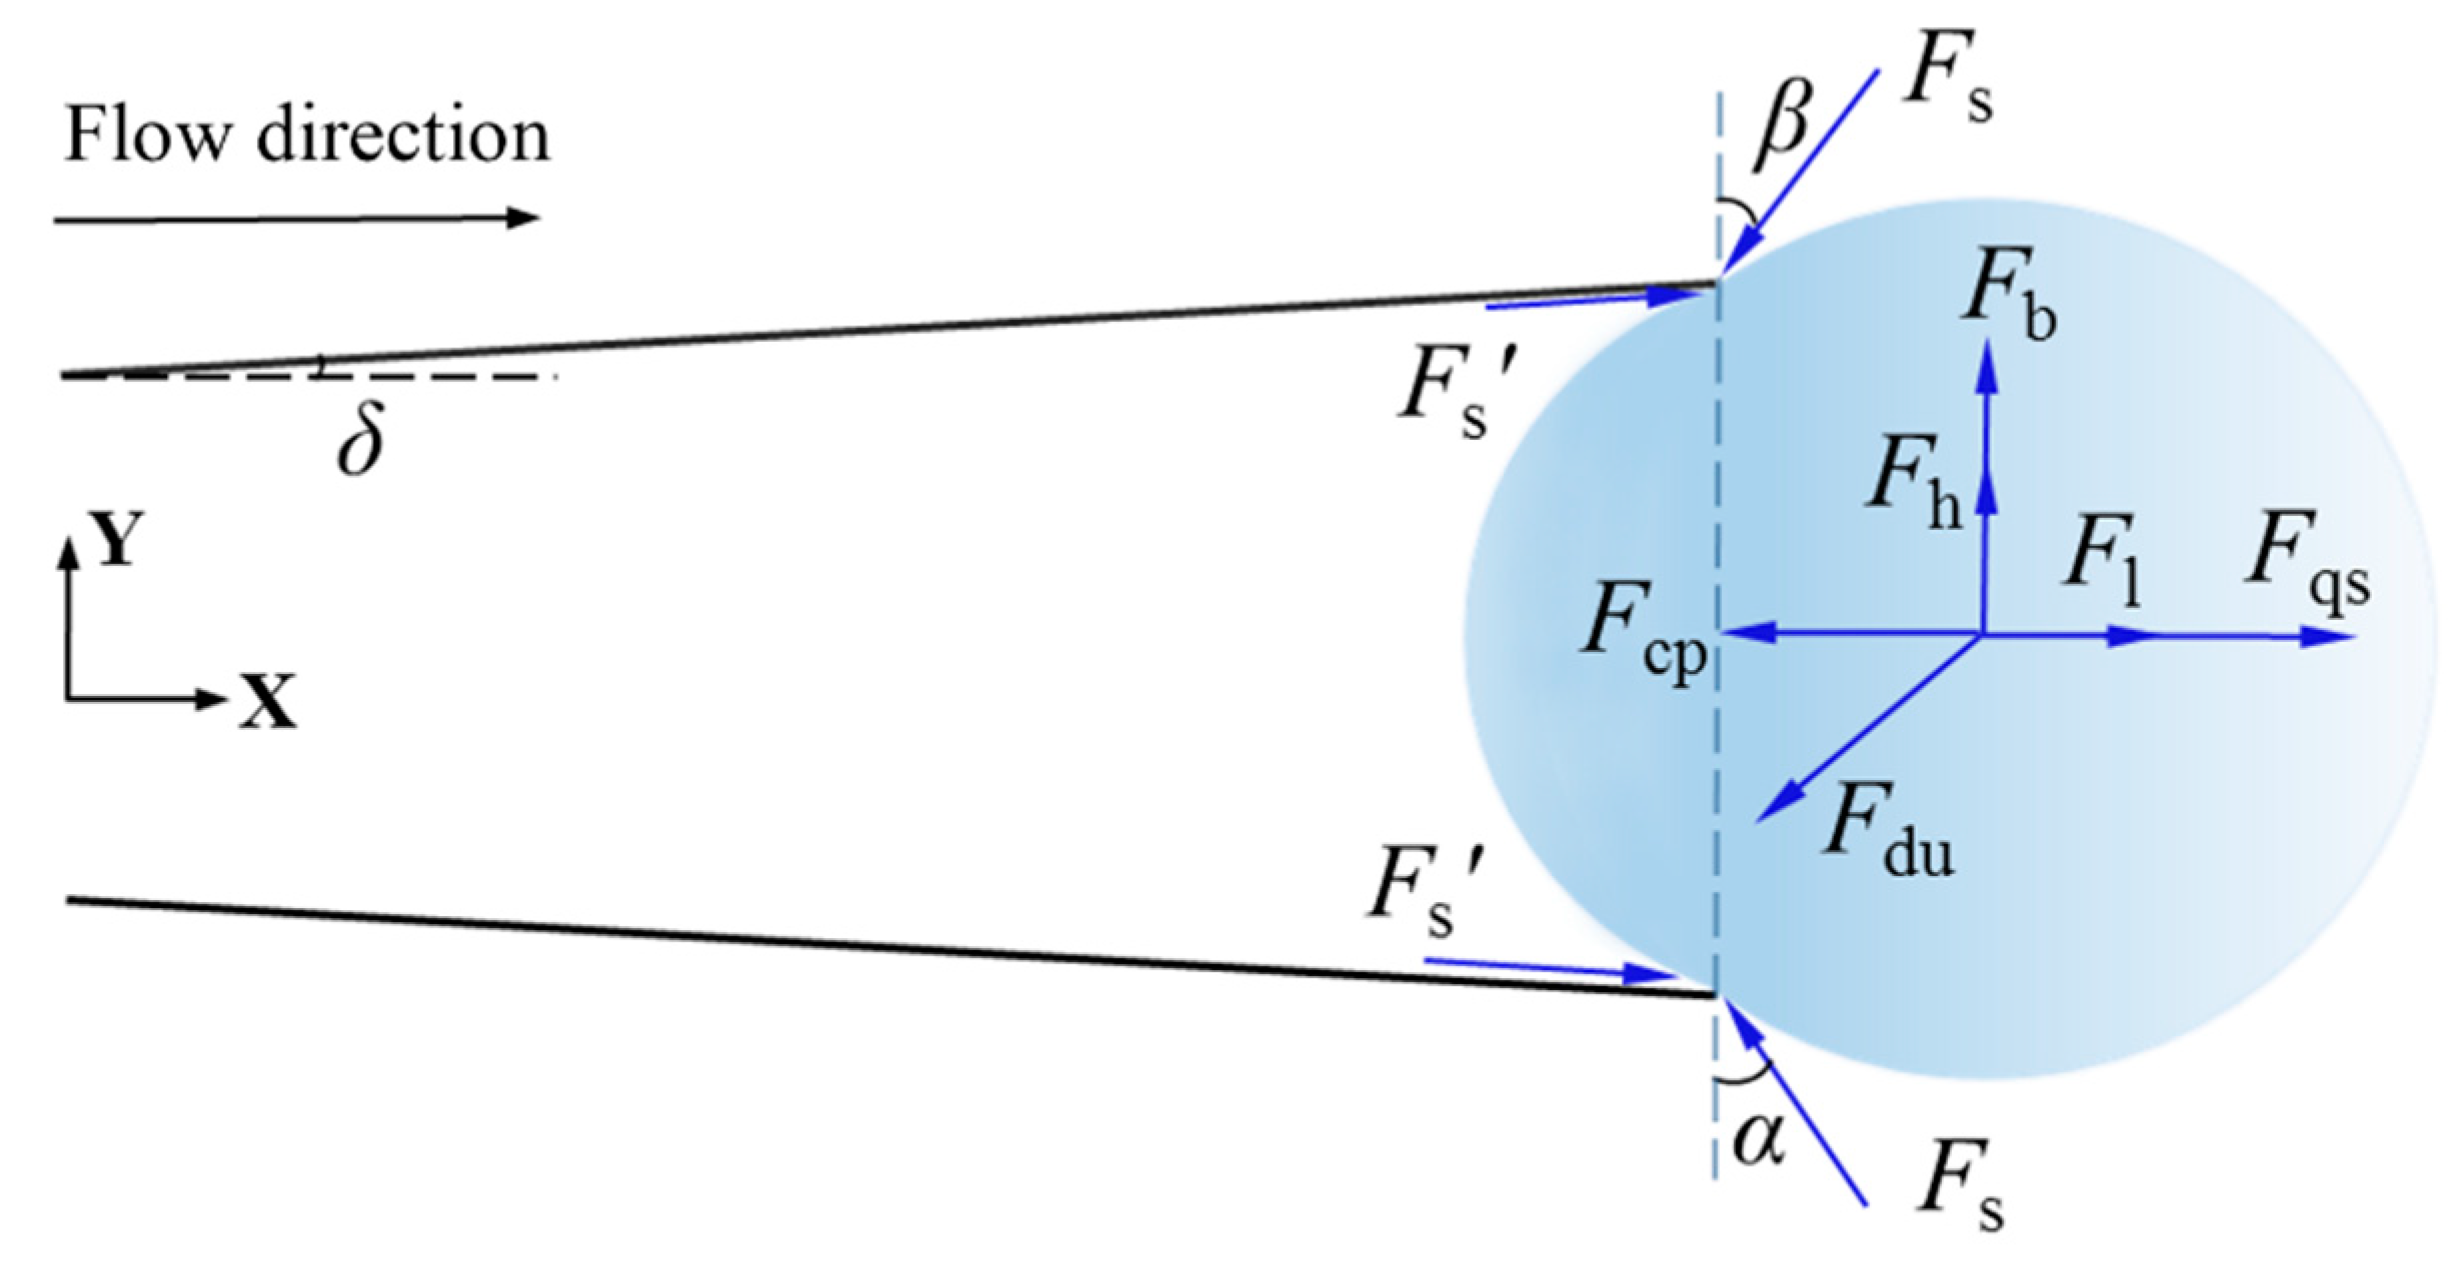
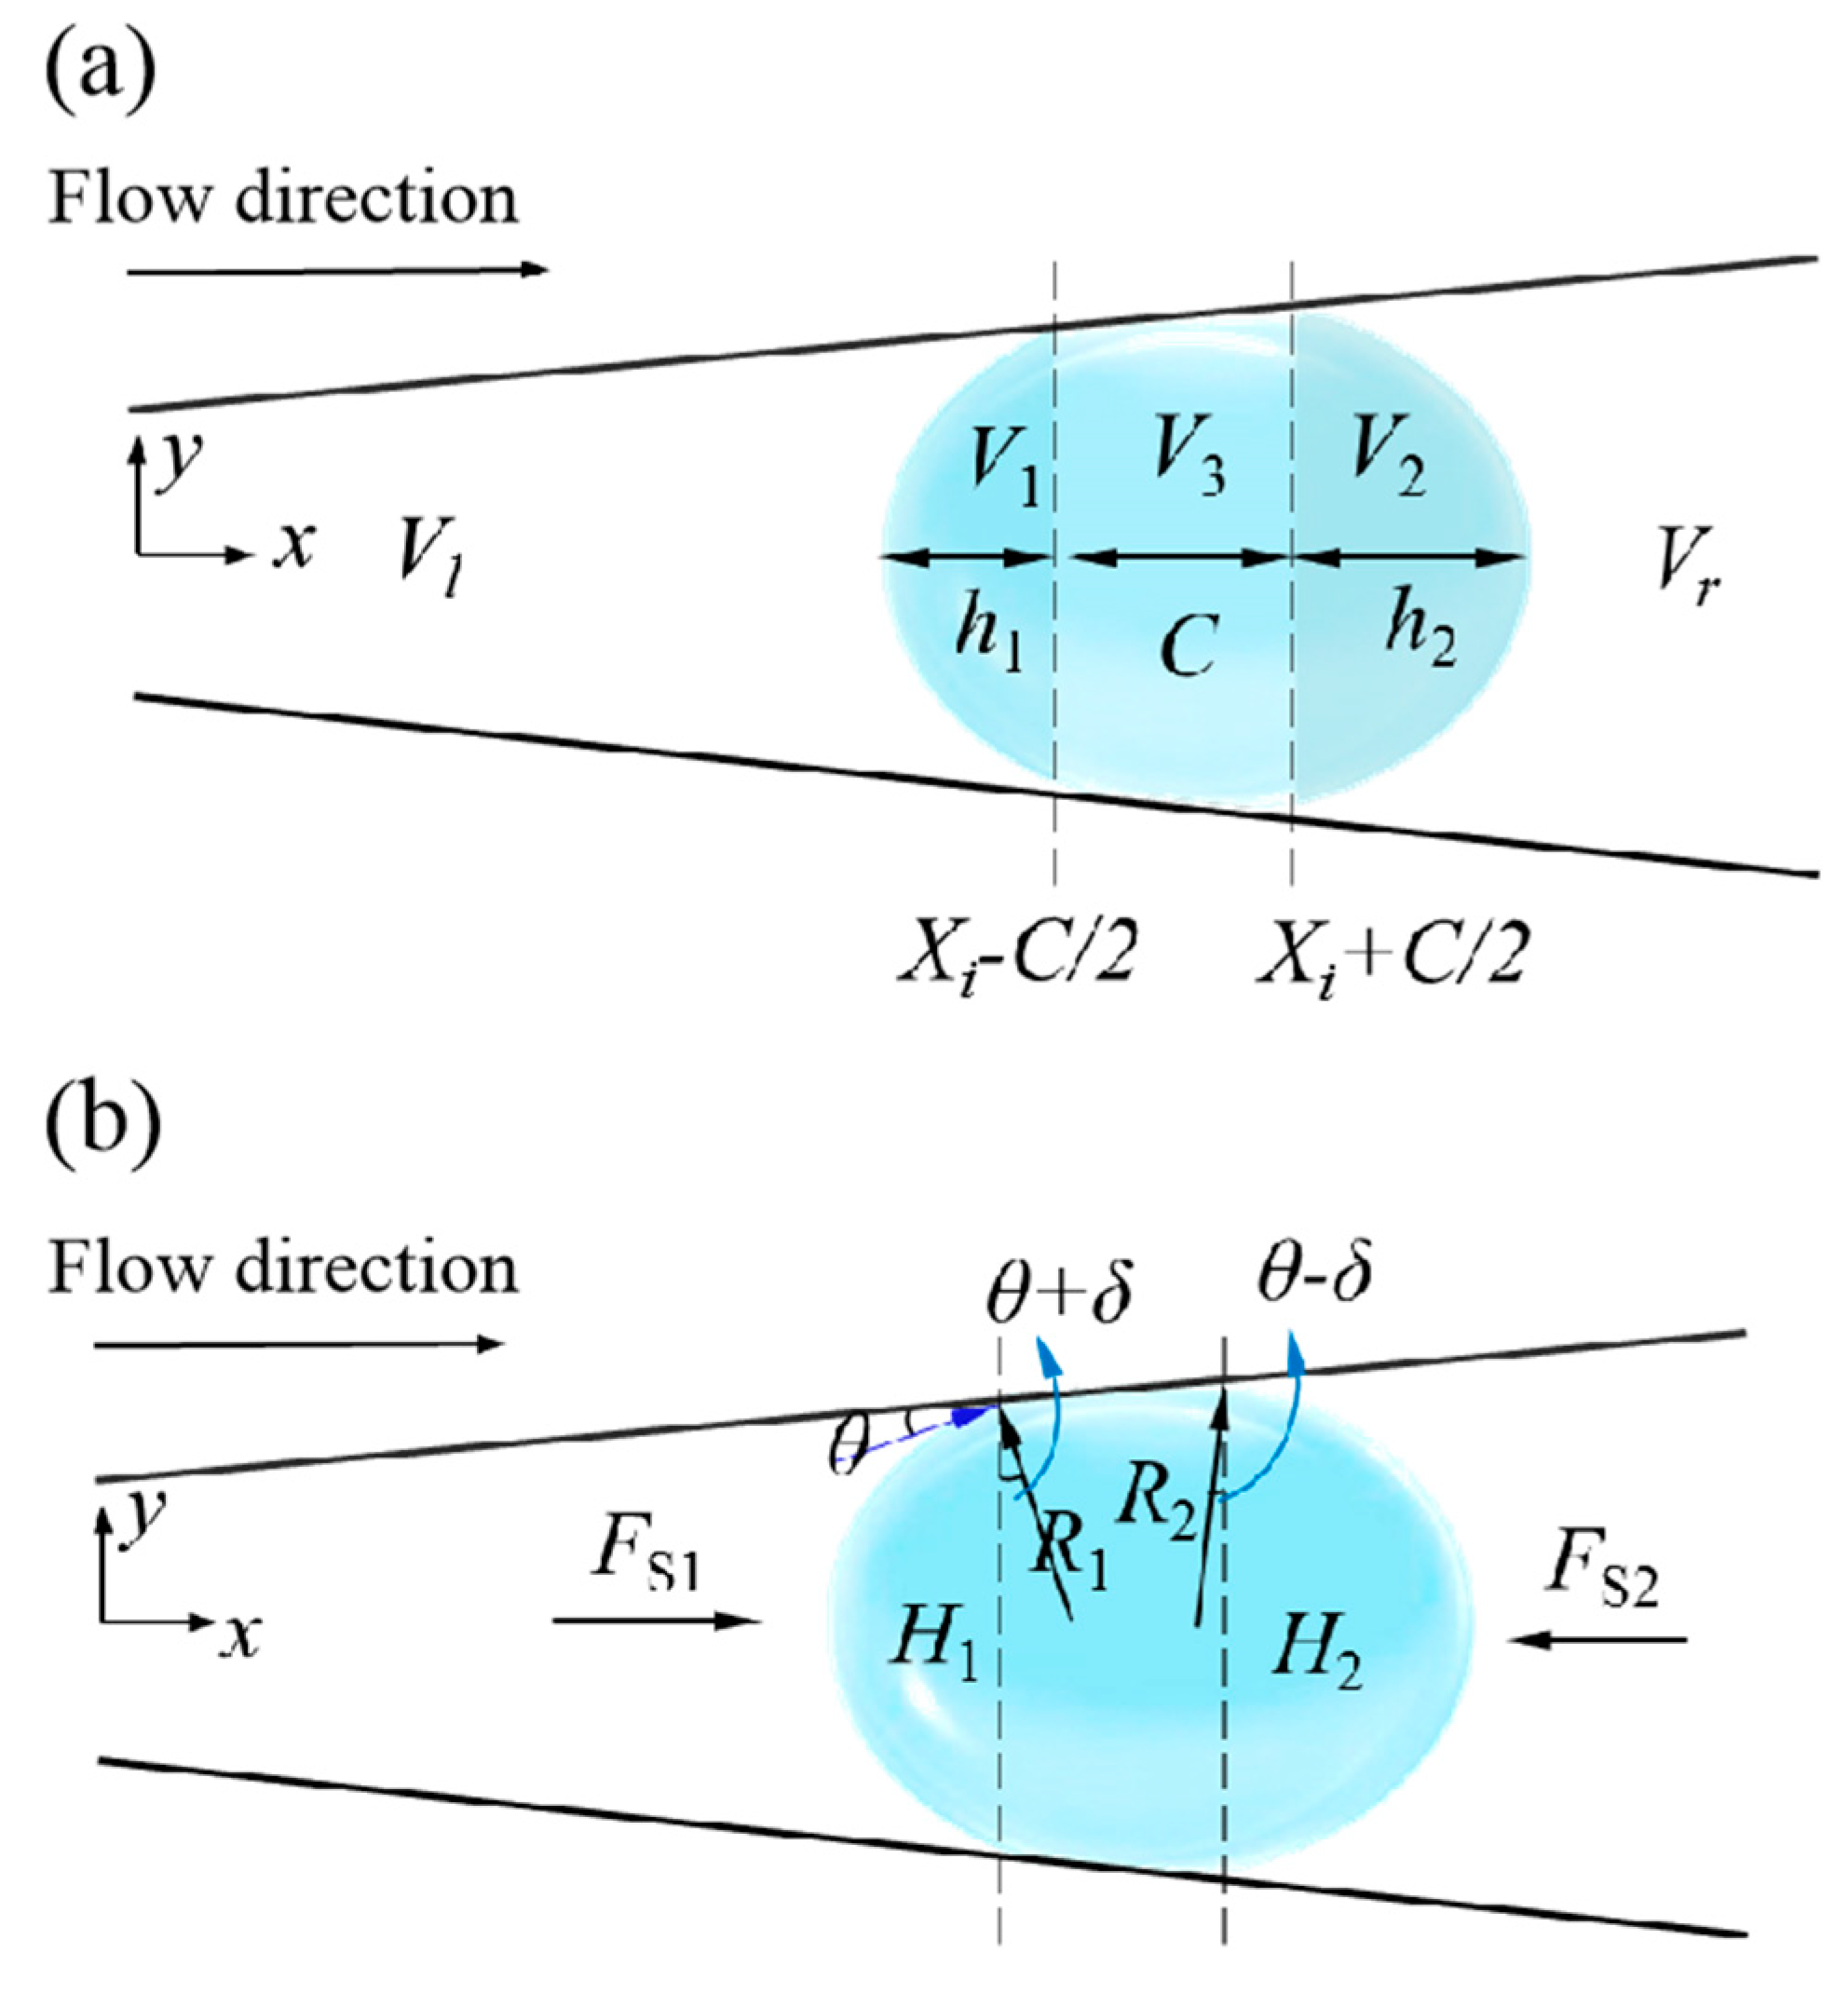
2.3. Bubble Slip
2.4. Bubble Ejection
2.5. Micromotor Velocity
3. Results and Discussion
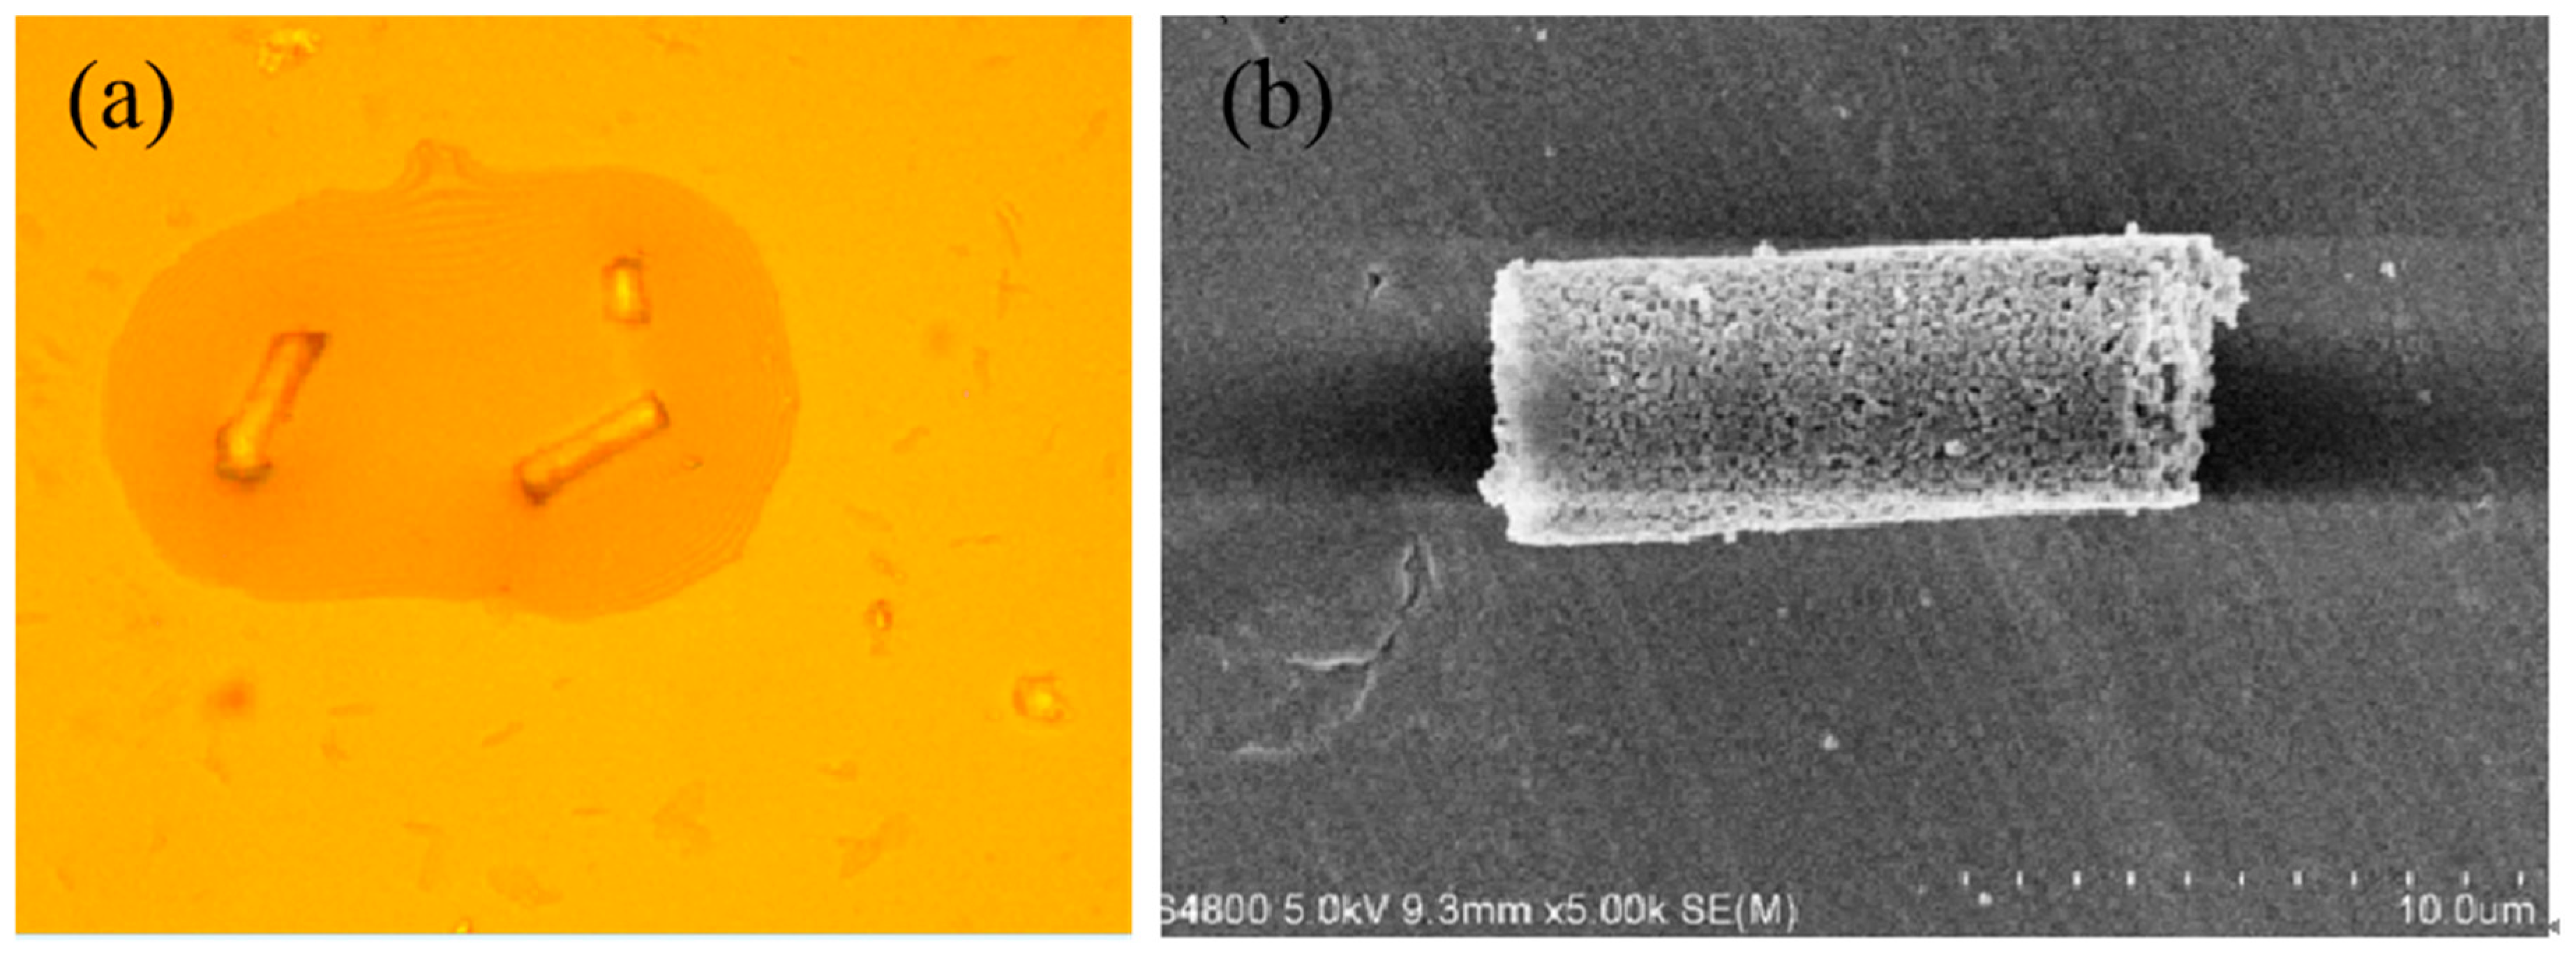
3.1. Bubble Nucleation and Growth
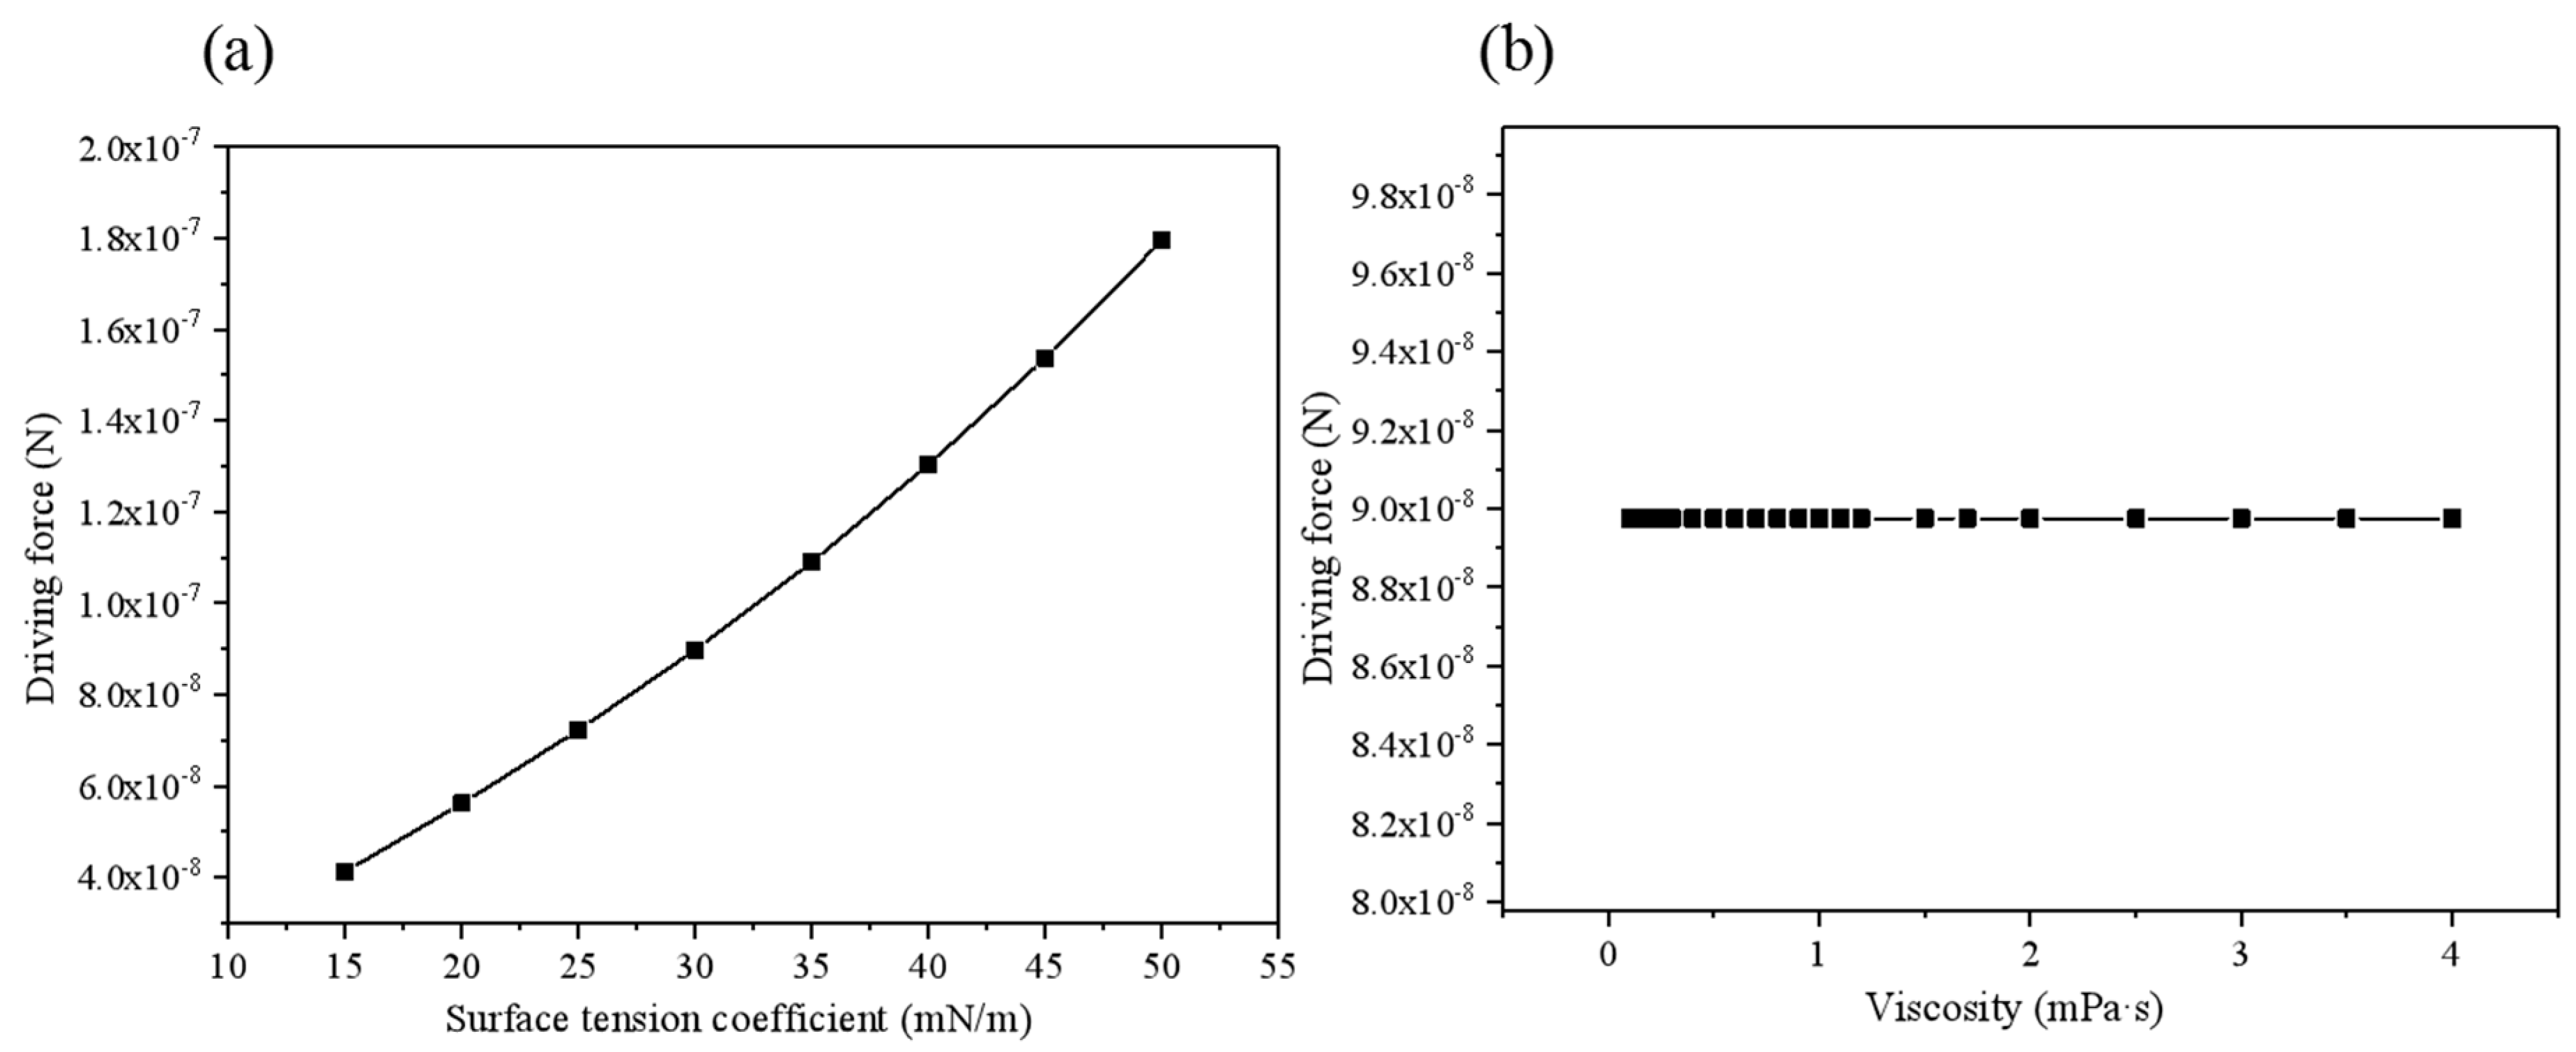
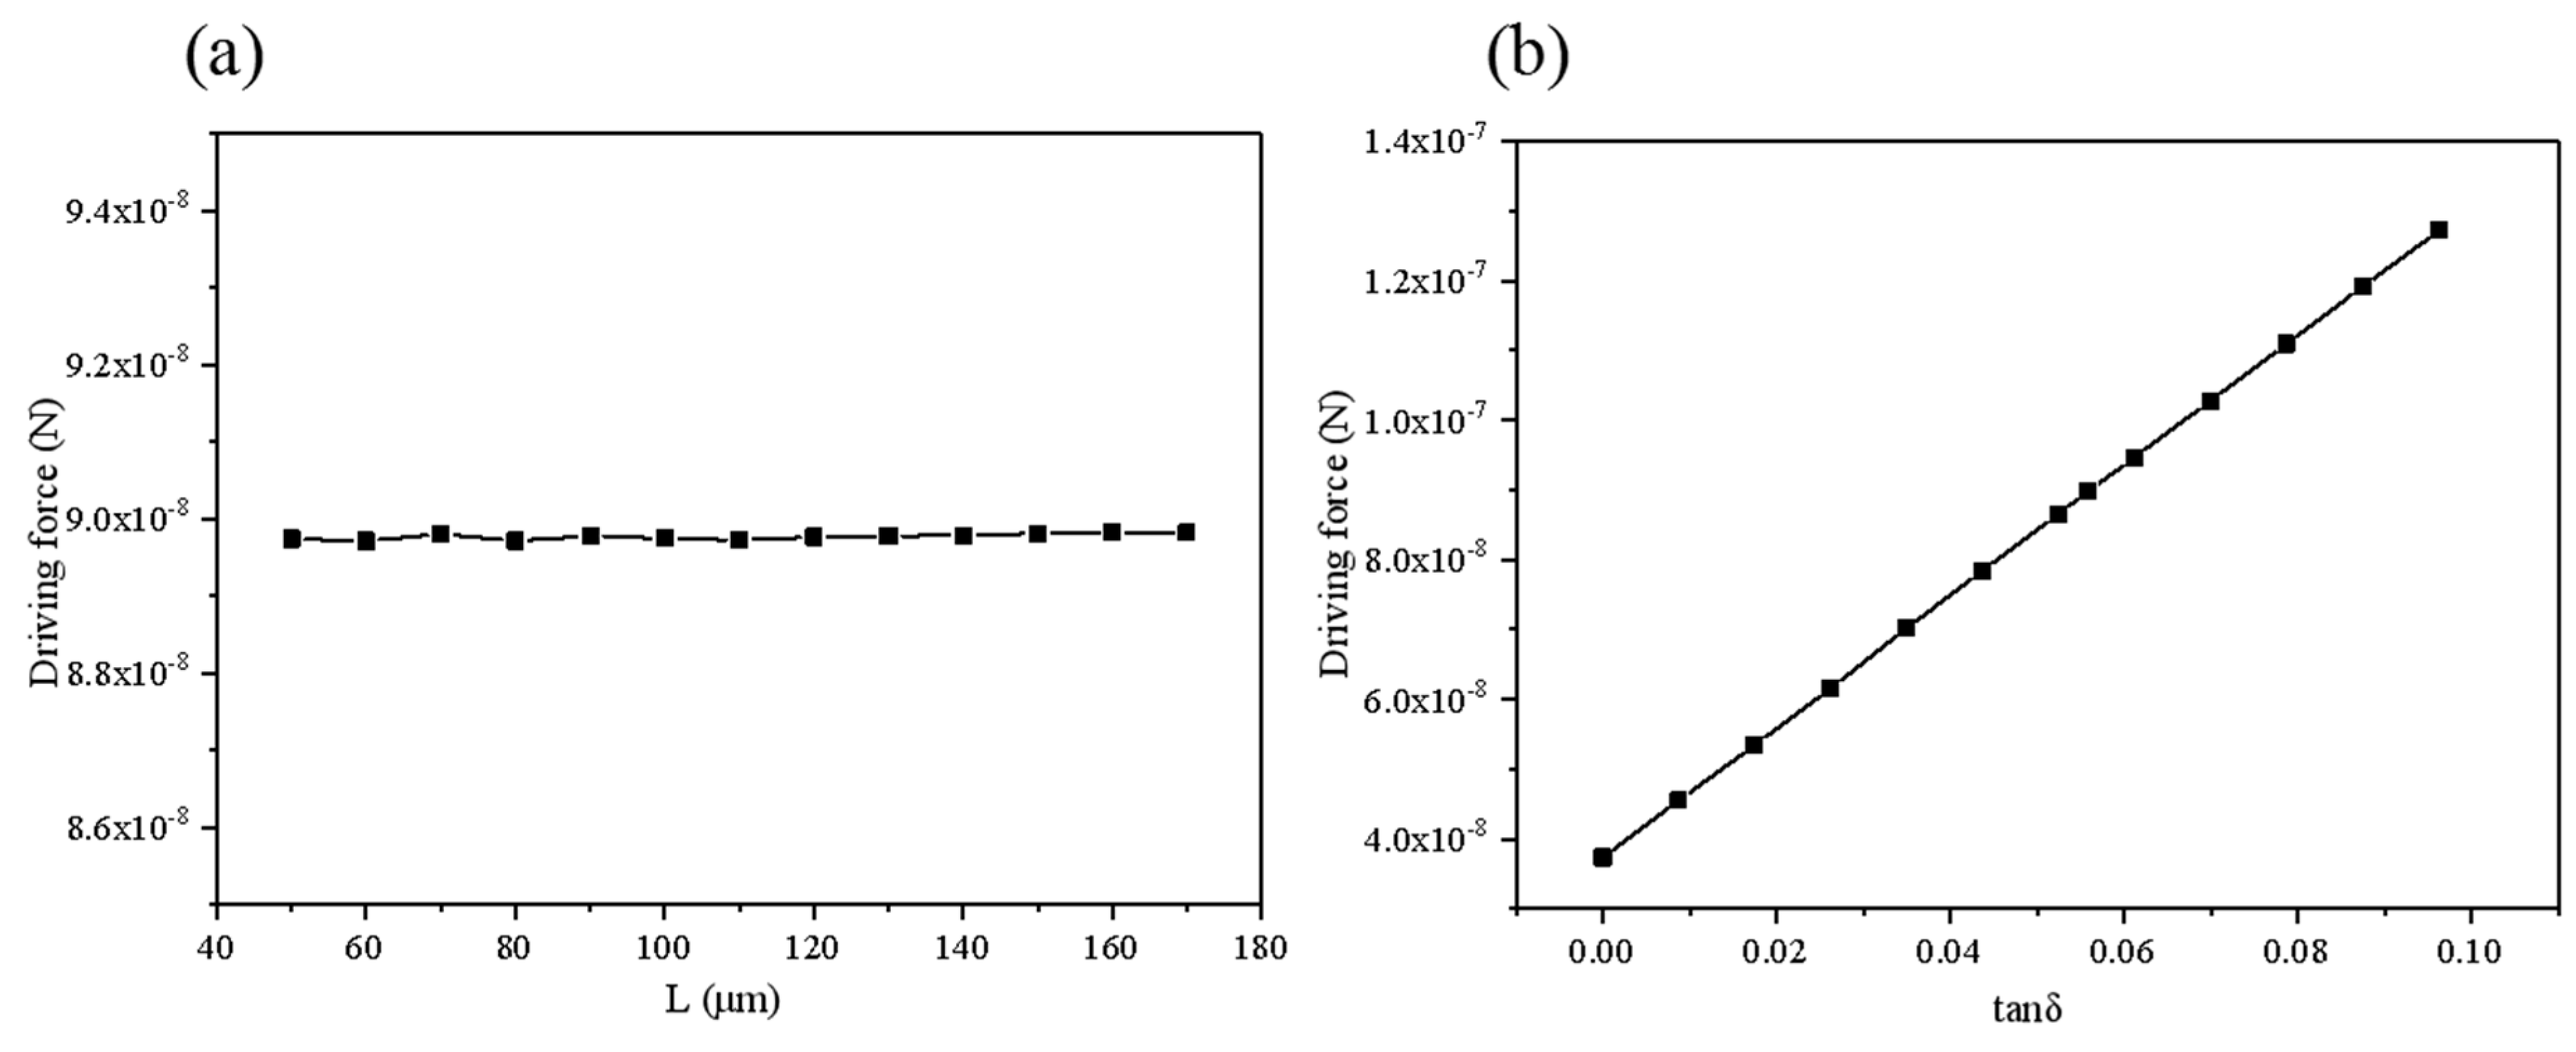
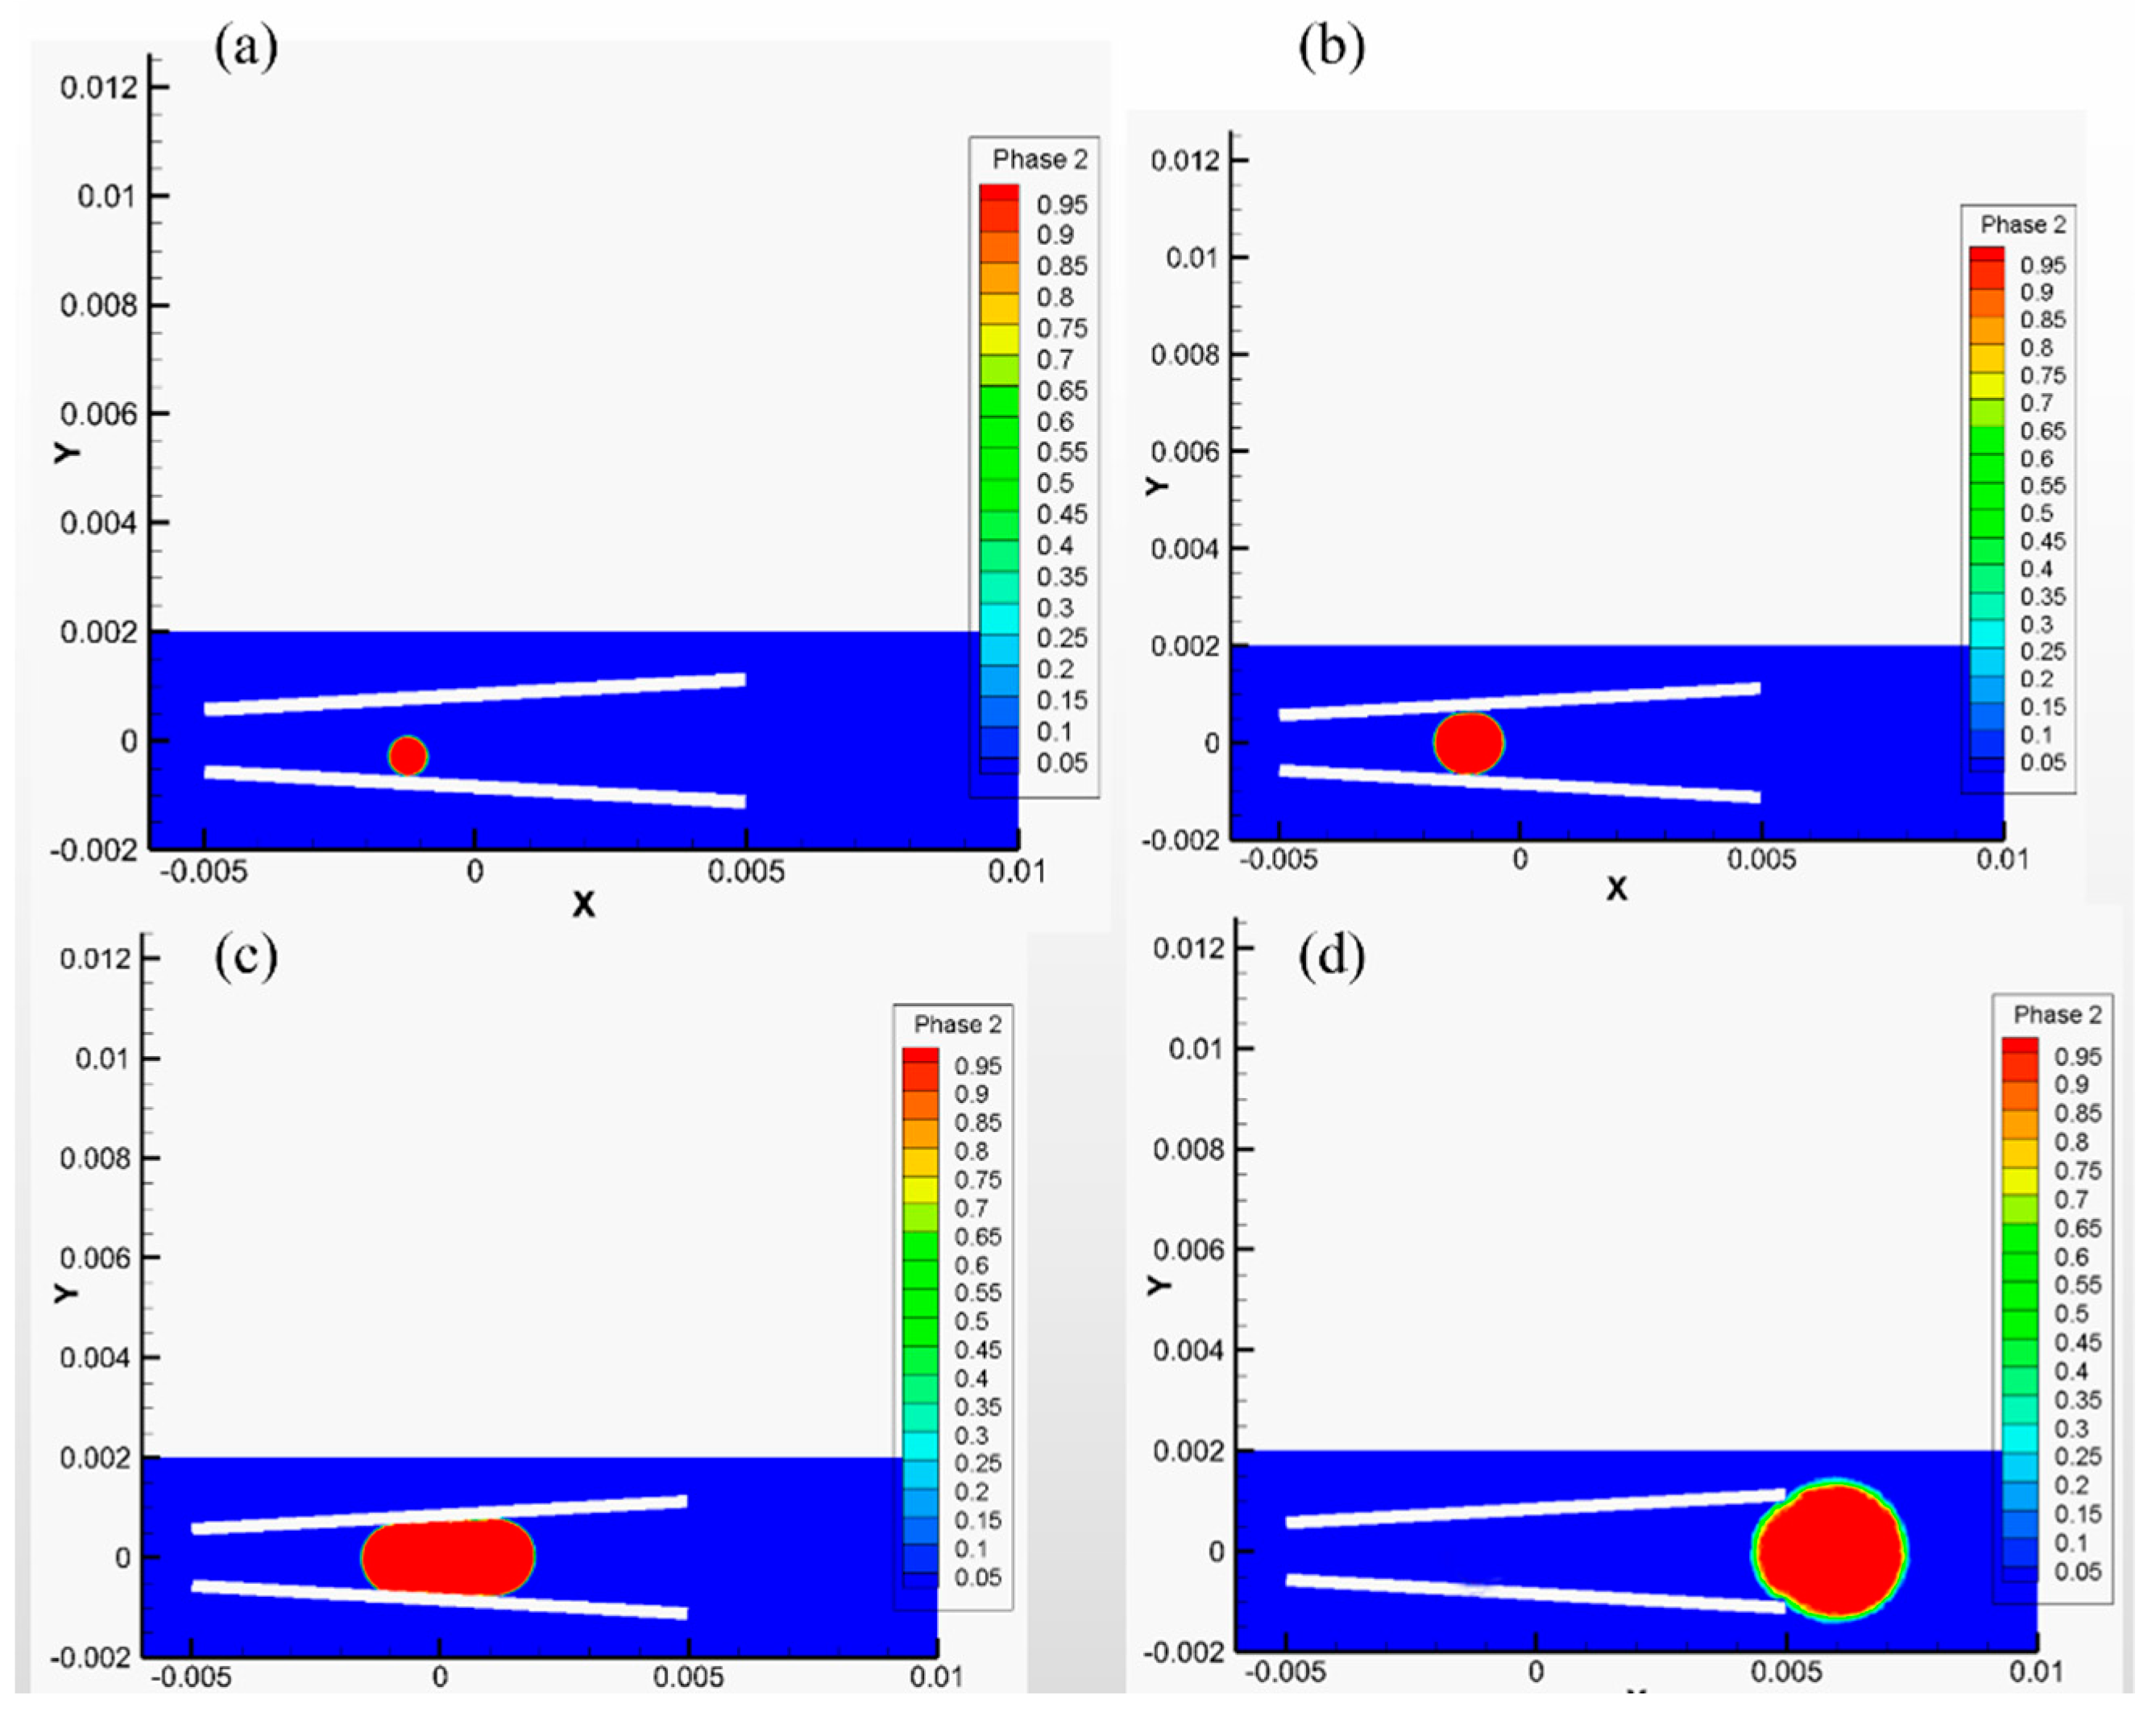
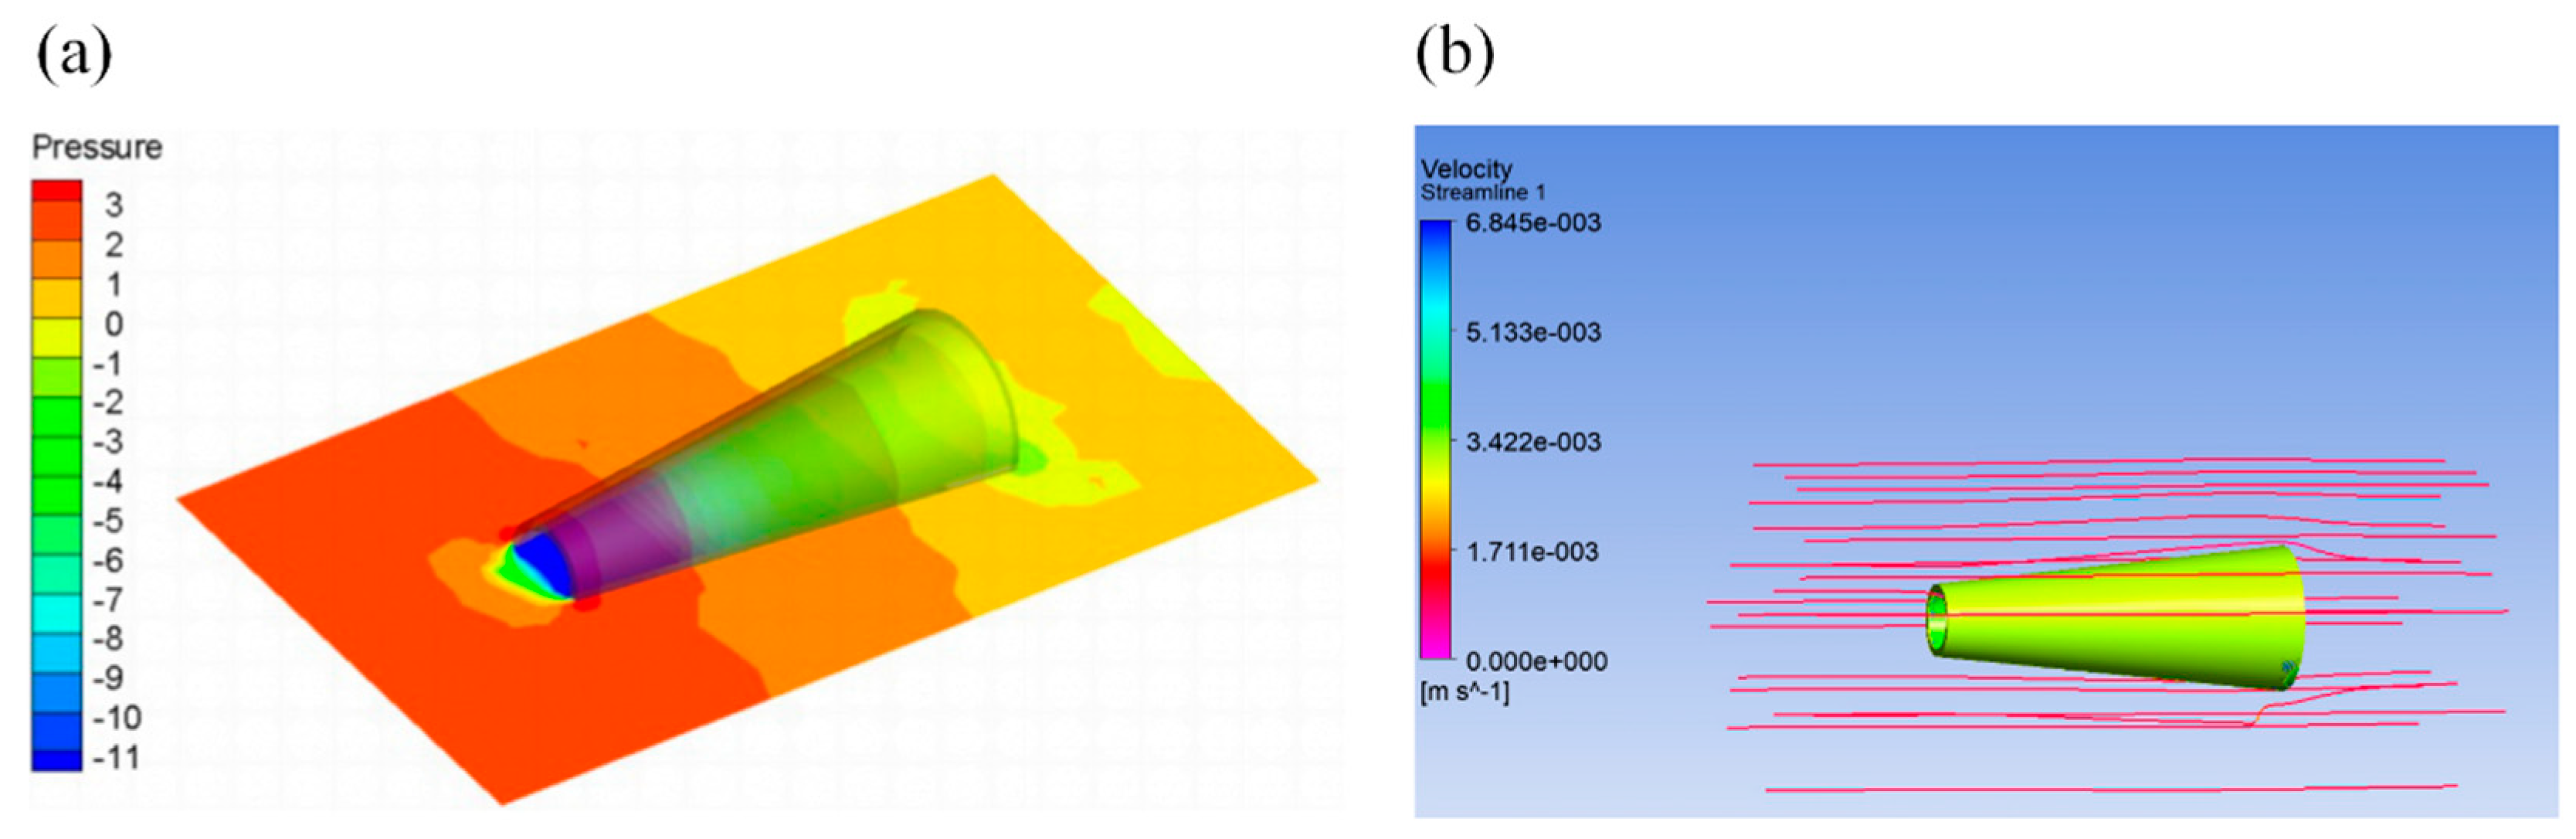
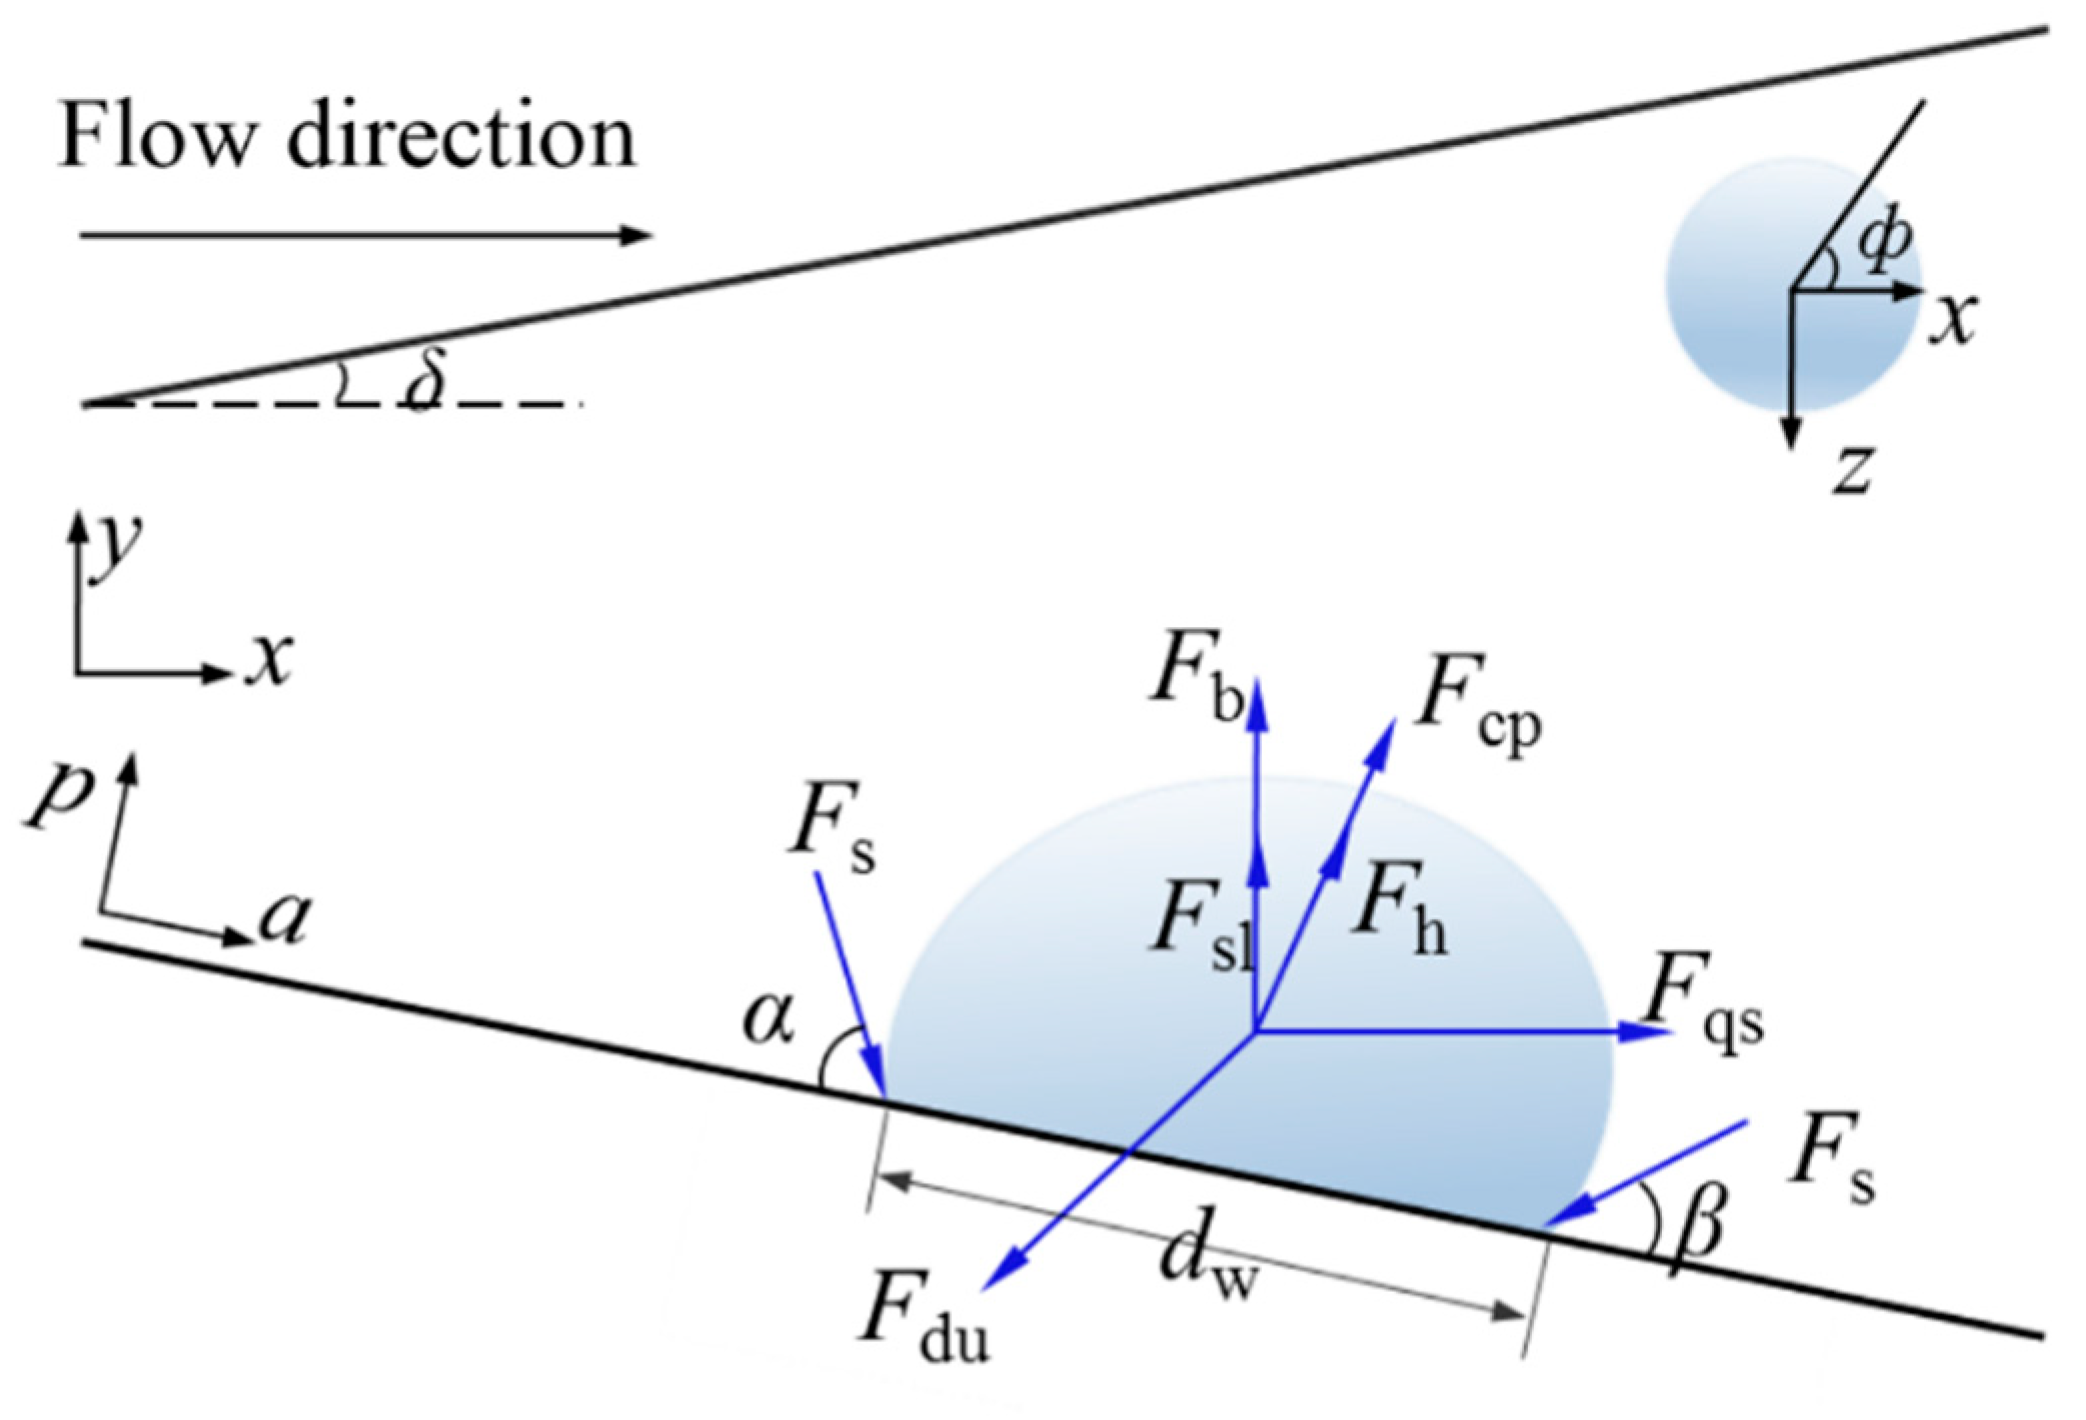
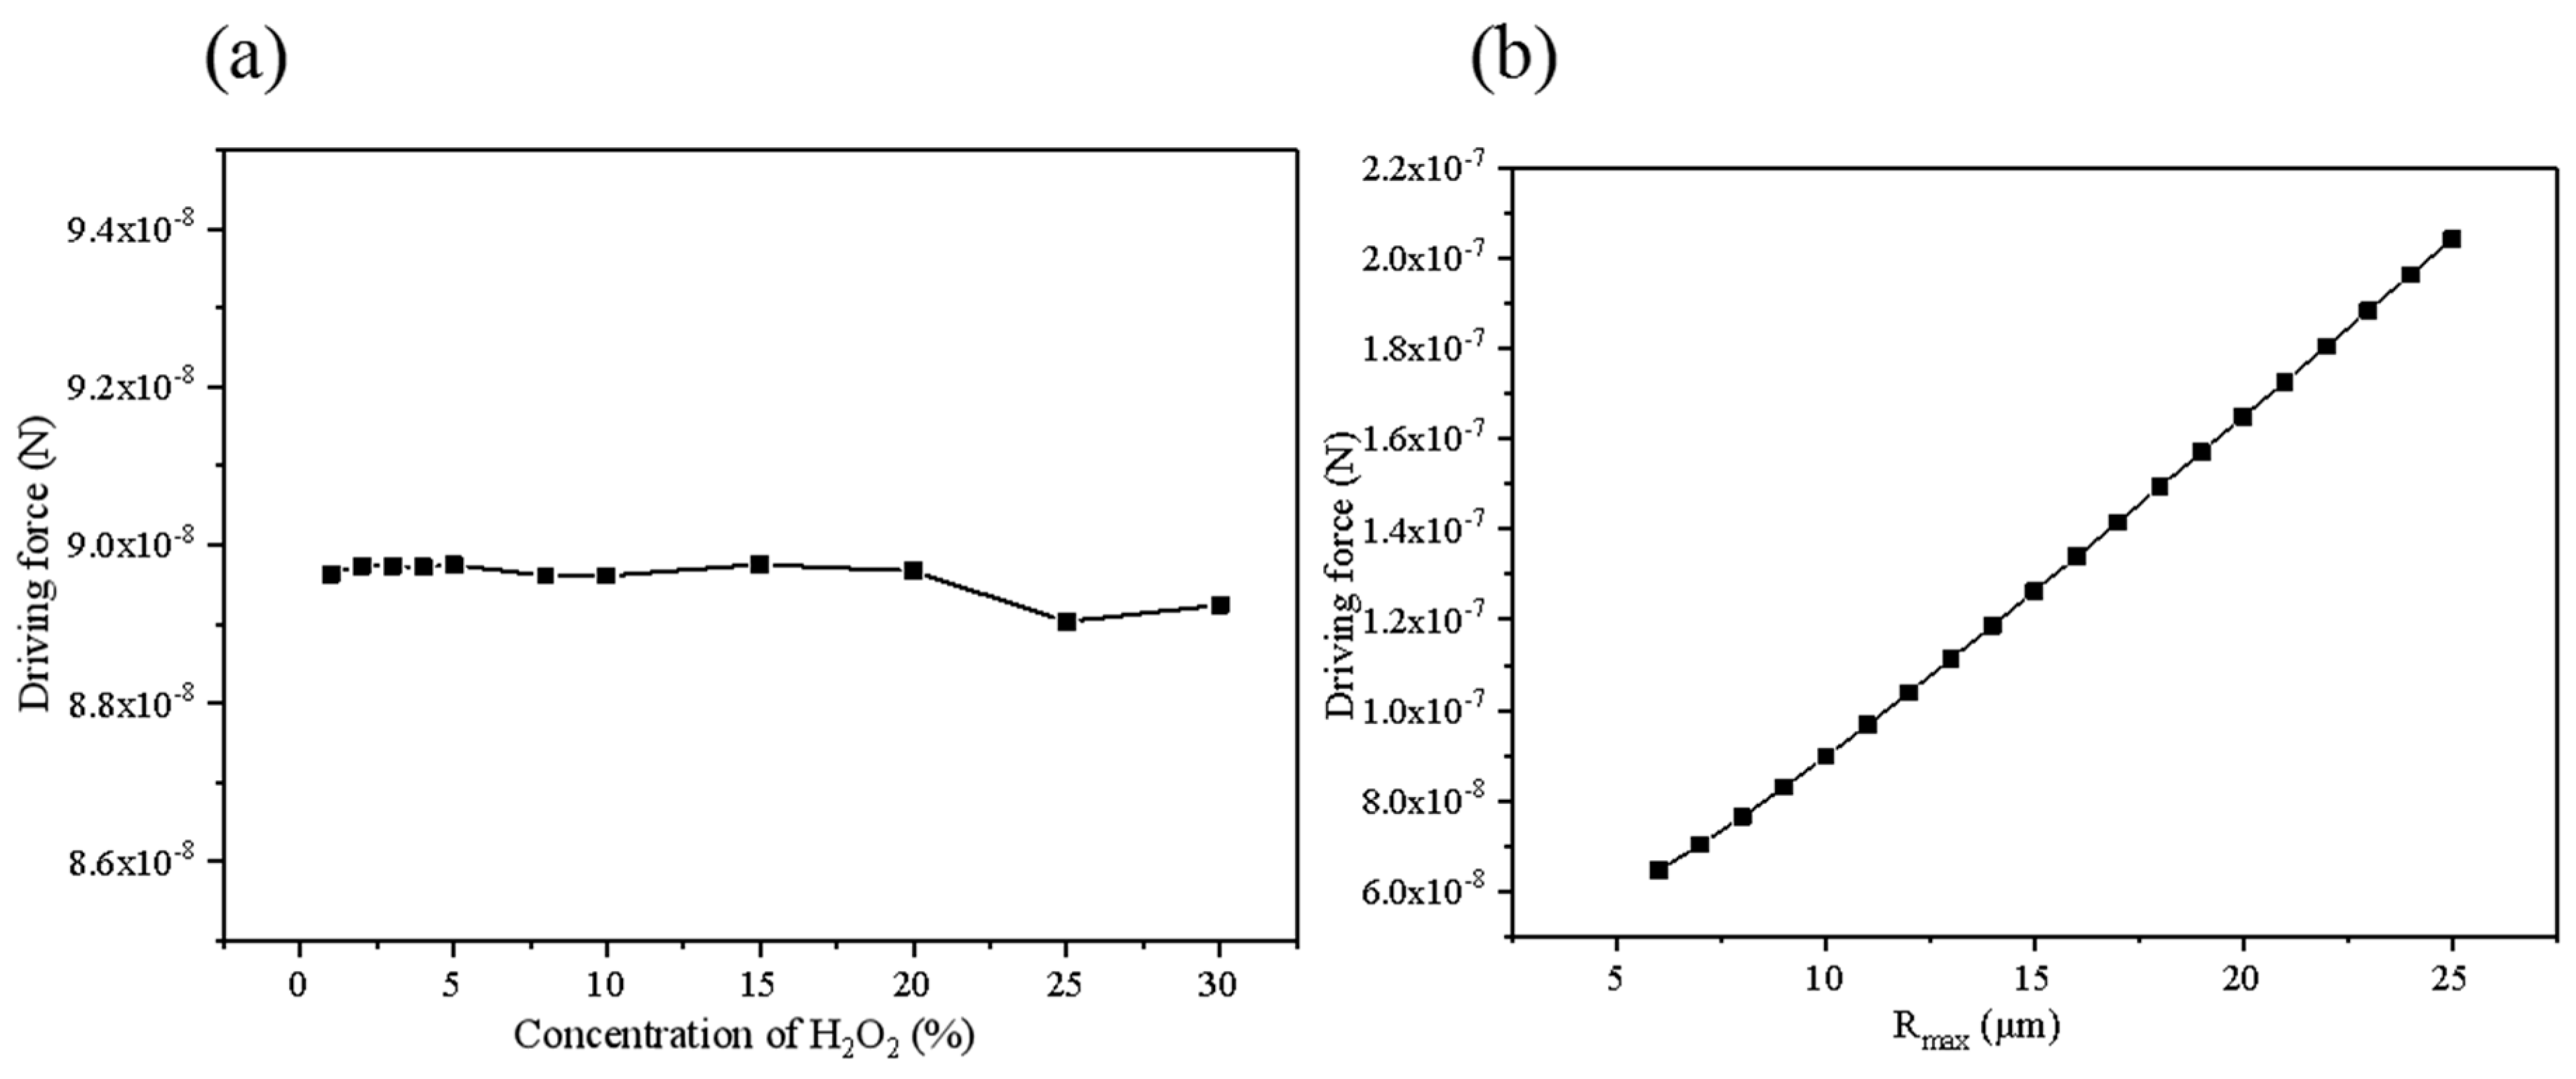
3.2. Driving Force of the Full Life-Cycle of the Bubbles
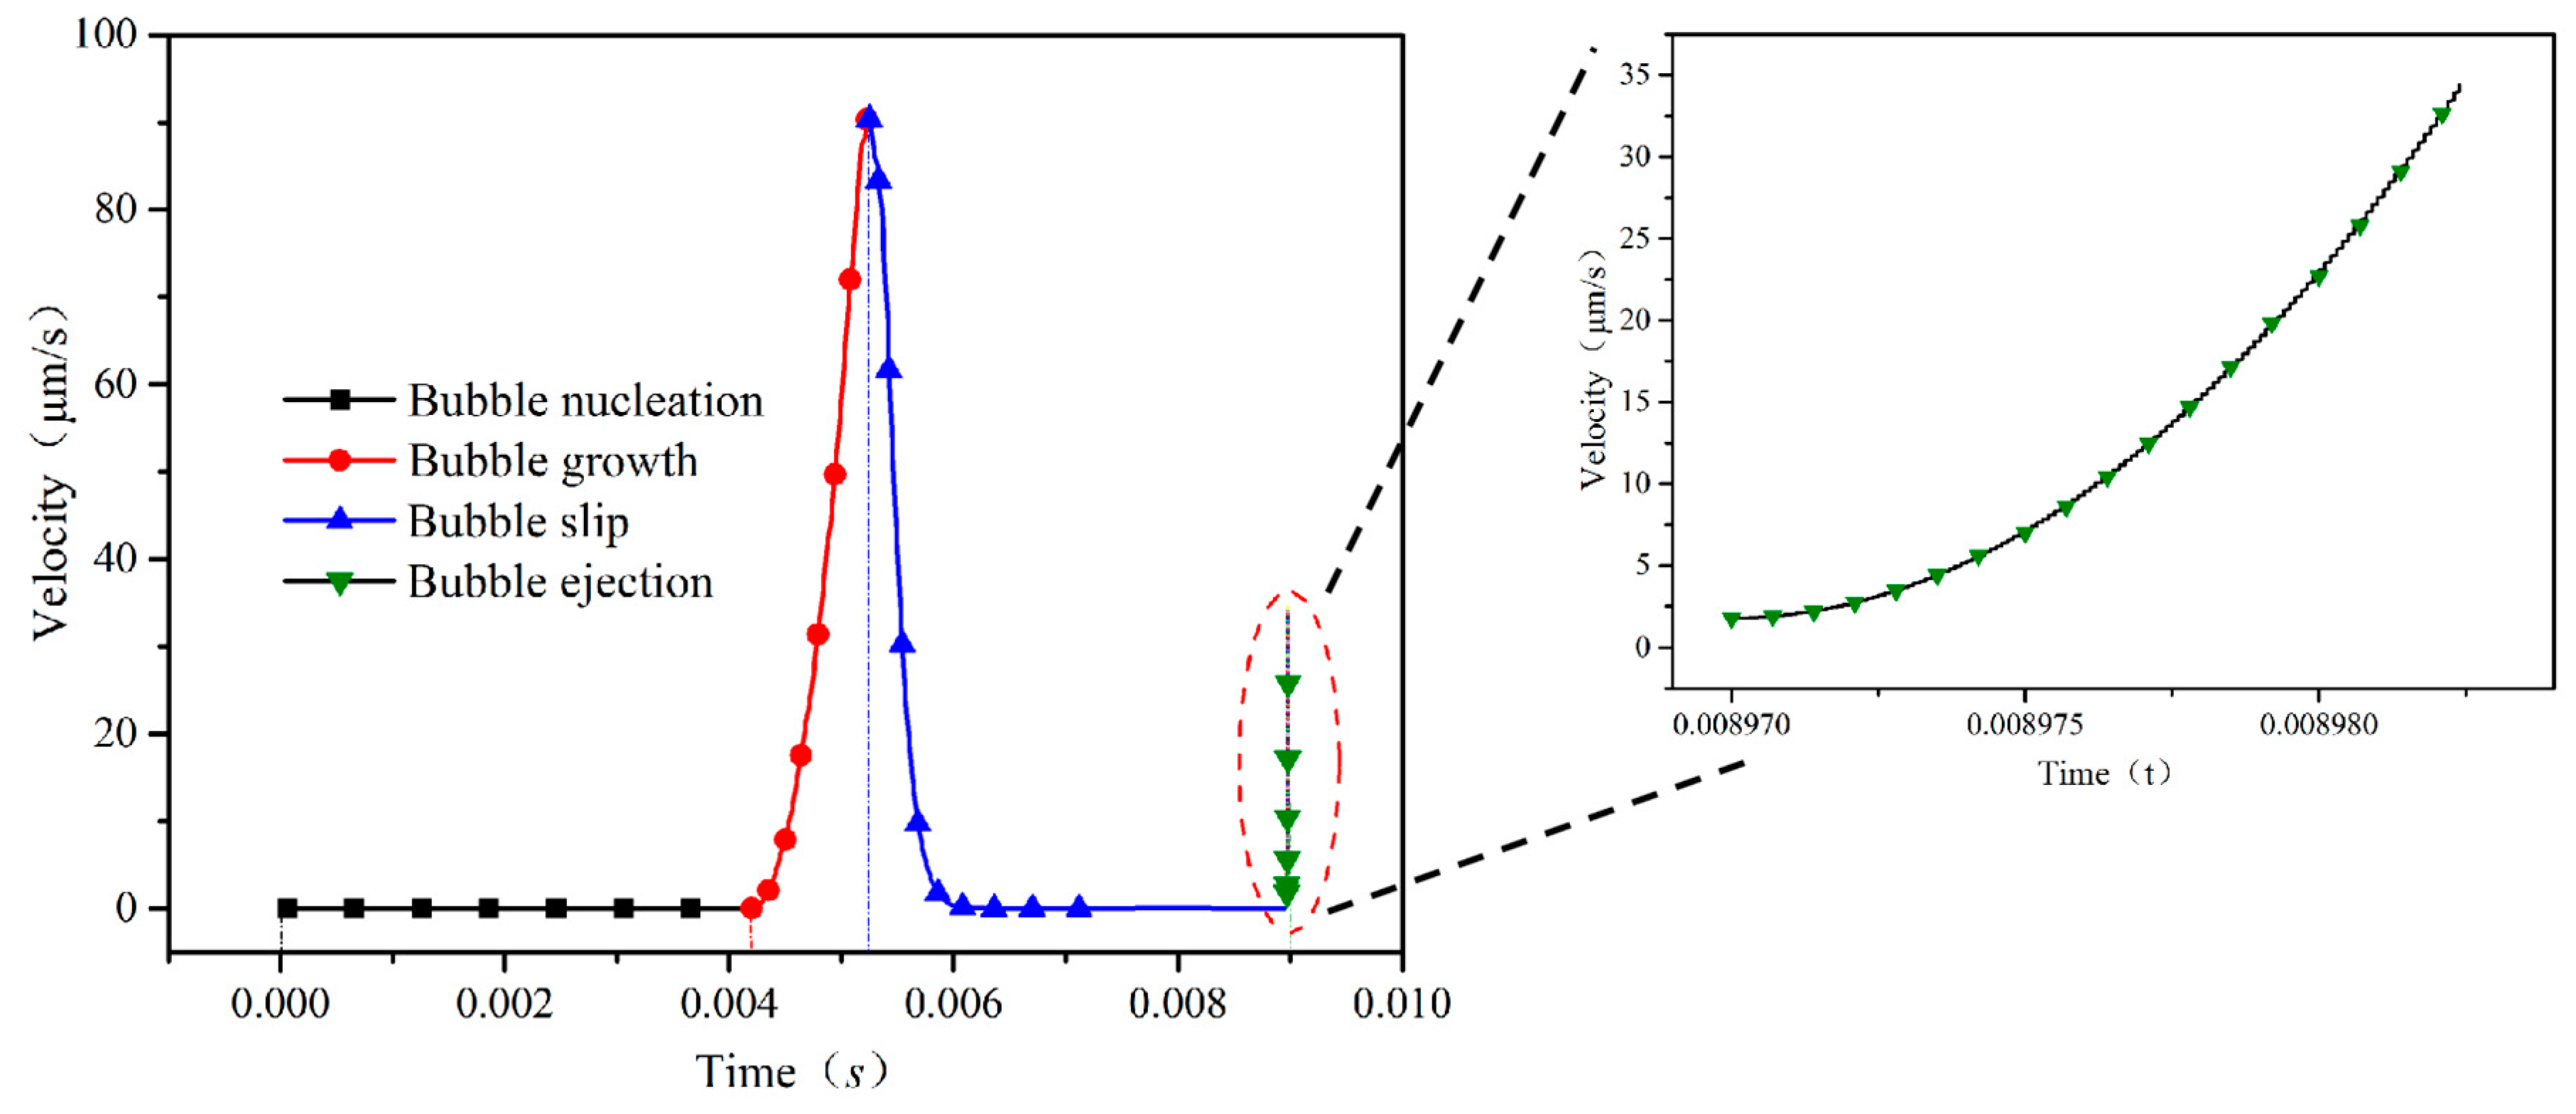
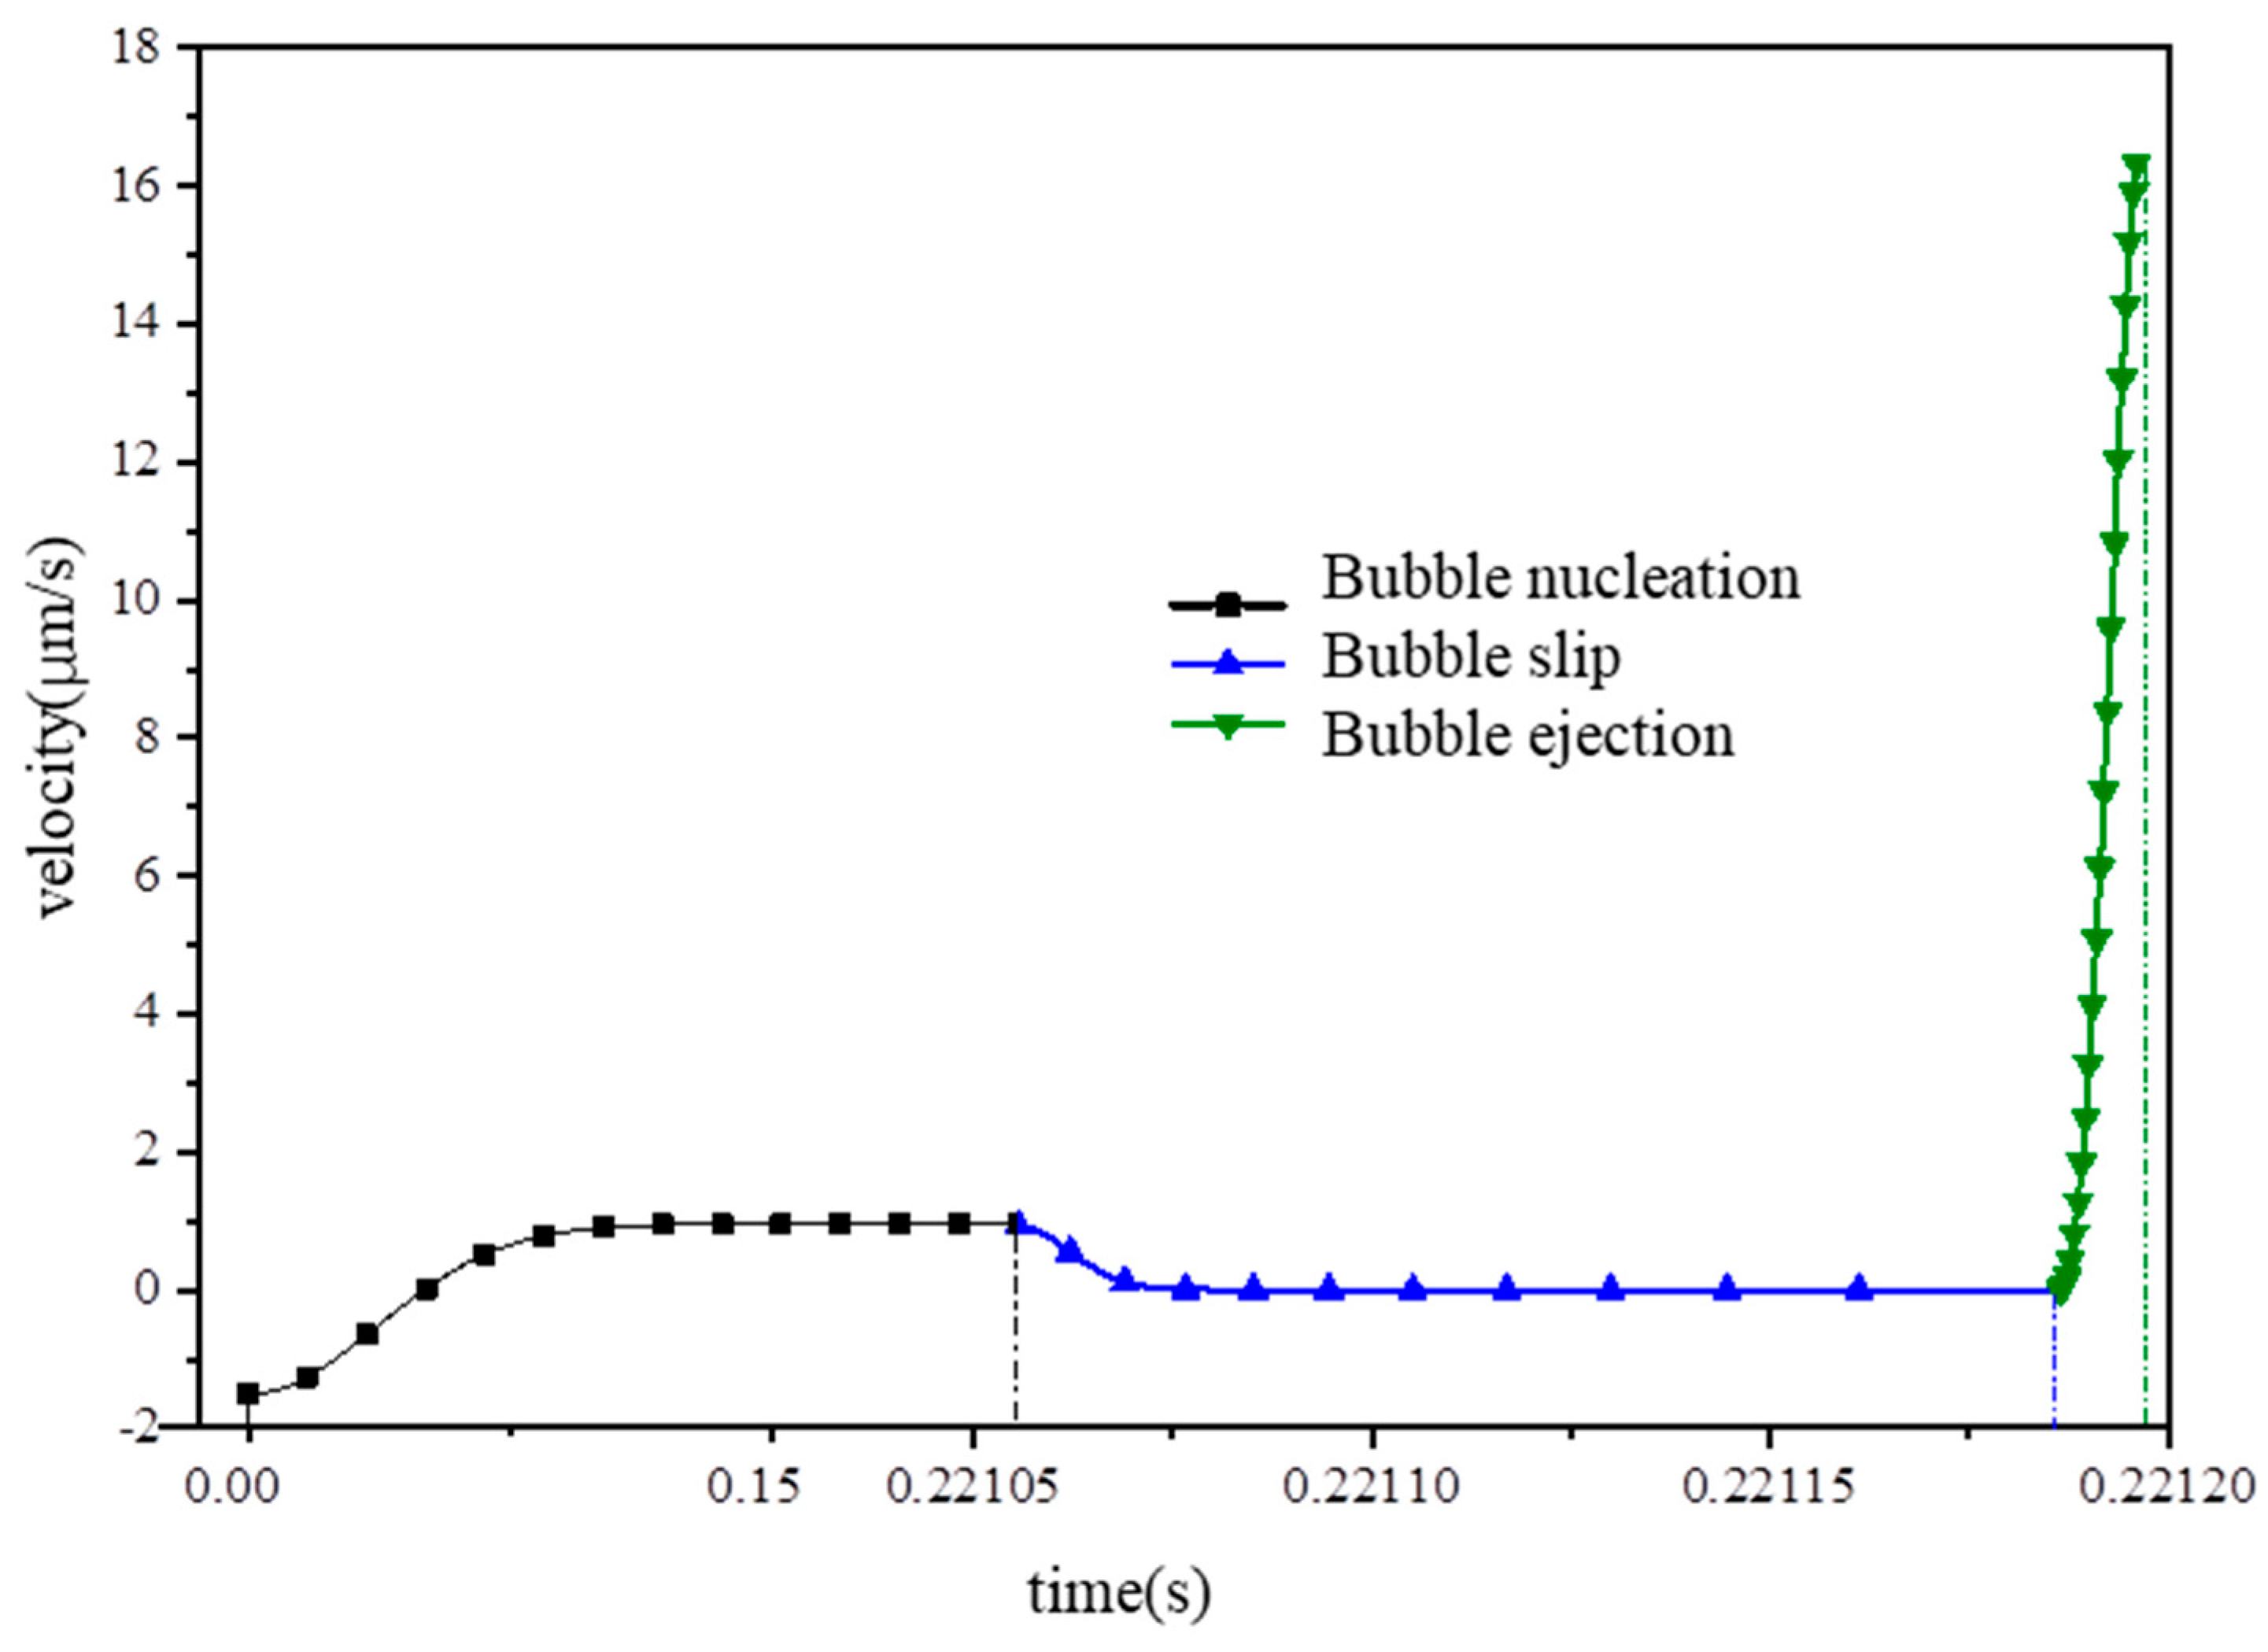
3.3. The Influence of Driving Force on Speed in Each Stage
4. Conclusions
Author Contributions
Funding
Conflicts of Interest
References
- Gao, W.; Uygun, A.; Wang, J. Hydrogen-bubble-propelled zinc-based microrockets in strongly acidic media. J. Am. Chem. Soc. 2012, 134, 897–900. [Google Scholar] [CrossRef] [PubMed]
- Balasubramanian, S.; Kagan, D.; Jack Hu, C.-M.; Campuzano, S.; Lobo-Castañon, M.J.; Lim, N.; Kang, D.Y.; Zimmerman, M.; Zhang, L.; Wang, J. Micromachine-enabled capture and isolation of cancer cells in complex media. Angew. Chem. 2011, 123, 4247–4250. [Google Scholar] [CrossRef]
- Yoshizumi, Y.; Okubo, K.; Yokokawa, M.; Suzuki, H. Programmed transport and release of cells by self-propelled micromotors. Langmuir 2016, 32, 9381–9388. [Google Scholar] [CrossRef] [PubMed]
- Wu, Z.; Esteban-Fernández de Ávila, B.; Martín, A.; Christianson, C.; Gao, W.; Thamphiwatana, S.K.; Escarpa, A.; He, Q.; Zhang, L.; Wang, J. Rbc micromotors carrying multiple cargos towards potential theranostic applications. Nanoscale 2015, 7, 13680–13686. [Google Scholar] [CrossRef] [PubMed]
- Li, L.; Wang, J.; Li, T.; Song, W.; Zhang, G. Hydrodynamics and propulsion mechanism of self-propelled catalytic micromotors: Model and experiment. Soft Matter 2014, 10, 7511–7518. [Google Scholar] [CrossRef] [PubMed]
- Li, J.; Angsantikul, P.; Liu, W.; Esteban-Fernández de Ávila, B.; Thamphiwatana, S.; Xu, M.; Sandraz, E.; Wang, X.; Delezuk, J.; Gao, W.; et al. Micromotors spontaneously neutralize gastric acid for ph-responsive payload release. Angew. Chem. Int. Ed. 2017, 56, 2156–2161. [Google Scholar] [CrossRef] [PubMed]
- Zhang, Q.; Dong, R.; Wu, Y.; Gao, W.; He, Z.; Ren, B. Light-driven au-wo3@c janus micromotors for rapid photodegradation of dye pollutants. ACS Appl. Mater. Interfaces 2017, 9, 4674–4683. [Google Scholar] [CrossRef] [PubMed]
- Eskandarloo, H.; Kierulf, A.; Abbaspourrad, A. Nano- and micromotors for cleaning polluted waters: Focused review on pollutant removal mechanisms. Nanoscale 2017, 9, 13850–13863. [Google Scholar] [CrossRef]
- Hayakawa, M.; Onoe, H.; Nagai, K.H.; Takinoue, M. Influence of asymmetry and driving forces on the propulsion of bubble-propelled catalytic micromotors. Micromachines 2016, 7, 229. [Google Scholar] [CrossRef]
- Liang, Y.; Wang, H.; Yao, D.; Chen, Y.; Deng, Y.; Wang, C. Transportation and release of janus micromotors by two-stage rocket hydrogel. J. Mater. Chem. A 2017, 5, 18442–18447. [Google Scholar] [CrossRef]
- Yang, F.; Manjare, M.; Zhao, Y.; Qiao, R. On the peculiar bubble formation, growth, and collapse behaviors in catalytic micro-motor systems. Microfluid. Nanofluid. 2017, 21, 6. [Google Scholar] [CrossRef]
- Li, J.; Huang, G.; Ye, M.; Li, M.; Liu, R.; Mei, Y. Dynamics of catalytic tubular microjet engines: Dependence on geometry and chemical environment. Nanoscale 2011, 3, 5083–5089. [Google Scholar] [CrossRef] [PubMed]
- Gallino, G.; Zhu, L.; Gallaire, F. The hydrodynamics of a micro-rocket propelled by a deformable bubble. Fluids 2019, 4, 48. [Google Scholar] [CrossRef]
- Kulkarni, A.A.; Joshi, J.B. Bubble formation and bubble rise velocity in gas−liquid systems: A review. Ind. Eng. Chem. Res. 2005, 44, 5873–5931. [Google Scholar] [CrossRef]
- Bari, S.A.; Hallett, J. Nucleation and growth of bubbles at an ice–water interface. J. Glaciol. 1974, 13, 489–520. [Google Scholar] [CrossRef]
- Kundumani-Sridharan, V.; Dyukova, E.; Hansen, D.E.; Rao, G.N. 12/15-lipoxygenase mediates high-fat diet-induced endothelial tight junction disruption and monocyte transmigration: A new role for 15(s)-hydroxyeicosatetraenoic acid in endothelial cell dysfunction. J. Biol. Chem. 2013, 288, 15830–15842. [Google Scholar] [CrossRef]
- Solovev, A.A.; Yongfeng, M.; Esteban, B.U.A.; Gaoshan, H.; Schmidt, O.G. Catalytic microtubular jet engines self-propelled by accumulated gas bubbles. Small 2010, 5, 1688–1692. [Google Scholar] [CrossRef]
- Manjare, M.; Yang, B.; Zhao, Y.P. Bubble driven quasioscillatory translational motion of catalytic micromotors. Phys. Rev. Lett. 2012, 109, 128305. [Google Scholar] [CrossRef]
- Manjare, M.; Yang, B.; Zhao, Y.P. Bubble-propelled microjets: Model and experiment. J. Phys. Chem. C 2013, 117, 4657–4665. [Google Scholar] [CrossRef]
- Fomin, V.M.; Hippler, M.; Magdanz, V.; Soler, L.; Sanchez, S.; Schmidt, O.G. Propulsion mechanism of catalytic microjet engines. IEEE Trans. Robot. 2014, 30, 40–48. [Google Scholar] [CrossRef]
- Gibbs, J.G.; Zhao, Y.P. Autonomously motile catalytic nanomotors by bubble propulsion. Appl. Phys. Lett. 2009, 94, 759. [Google Scholar] [CrossRef]
- Wang, Z.; Chi, Q.; Liu, L.; Liu, Q.; Bai, T.; Wang, Q. A viscosity-based model for bubble-propelled catalytic micromotors. Micromachines 2017, 8, 198. [Google Scholar] [CrossRef] [PubMed]
- Wang, Z.; Chi, Q.; Bai, T.; Wang, Q.; Liu, L. A dynamic model of drag force for catalytic micromotors based on navier–stokes equations. Micromachines 2018, 9, 459. [Google Scholar] [CrossRef] [PubMed]
- Liu, L.; Bai, T.; Chi, Q.; Wang, Z.; Xu, S.; Liu, Q.; Wang, Q. How to make a fast, efficient bubble-driven micromotor: A mechanical view. Micromachines 2017, 8, 267. [Google Scholar] [CrossRef] [PubMed]
- Chi, Q.; Wang, Z.; Tian, F.; You, J.A.; Xu, S. A review of fast bubble-driven micromotors powered by biocompatible fuel: Low-concentration fuel, bioactive fluid and enzyme. Micromachines 2018, 9, 537. [Google Scholar] [CrossRef]
- Blander, M.; Katz, J.L. Bubble nucleation in liquids. Adv. Colloid Interface Sci. 1975, 10, 1–32. [Google Scholar] [CrossRef]
- Thorncroft, G.E.; Klausner, J.F.; Mei, R. An experimental investigation of bubble growth and detachment in vertical upflow and downflow boiling. Int. J. Heat Mass Transf. 1998, 41, 3857–3871. [Google Scholar] [CrossRef]
- Staniszewski, B.E. Nucleate Boiling Bubble Growth and Departure; Massachusetts Institute of Technology: Cambridge, MA, USA, 2011. [Google Scholar]
- Ishida, N.; Inoue, T.; Minoru Miyahara, A.; Higashitani, K. Nano bubbles on a hydrophobic surface in water observed by tapping-mode atomic force microscopy. Langmuir 2000, 16, 6377–6380. [Google Scholar] [CrossRef]
- Mei, R.; Klausner, J.F. Unsteady force on a spherical bubble at finite reynolds number with small fluctuations in the free: Tream velocity. Phys. Fluids A Fluid Dyn. 1991, 4, 613–631. [Google Scholar]
- Happel, J.; Brenner, H. Low Reynolds Number Hydrodynamics, with Special Applications to Particulate Media; Springer Science & Business Media: Berlin, Germany, 1973. [Google Scholar]
- Klausner, J.F.; Mei, R.; Bernhard, D.M.; Zeng, L.Z. Vapor bubble departure in forced convection boiling. Int. J. Heat Mass Transf. 1993, 36, 651–662. [Google Scholar] [CrossRef]
- Saffman, P.G. The lift on a small sphere in a slow shear flow. J. Fluid Mech. 2006, 22, 385–400. [Google Scholar] [CrossRef]
- Wang, W.; Chiang, T.Y.; Velegol, D.; Mallouk, T.E. Understanding the efficiency of autonomous nano- and microscale motors. J. Am. Chem. Soc. 2013, 135, 10557–10565. [Google Scholar] [CrossRef] [PubMed]
- Orozco, J.; Jurado-Sanchez, B.; Wagner, G.; Gao, W.; Vazquez-Duhalt, R.; Sattayasamitsathit, S.; Galarnyk, M.; Cortes, A.; Saintillan, D.; Wang, J. Bubble-propelled micromotors for enhanced transport of passive tracers. Langmuir 2014, 30, 5082–5087. [Google Scholar] [CrossRef] [PubMed]


| Stages | Equation | Driving Force | Average Speed (μm/s) | Duration (ms) |
|---|---|---|---|---|
| Nucleation | (14) | 0.03958 | 6.808 × 10⁻⁴ | 0–4.2 |
| Growth | (56) | 2995 | 1011 | 4.2–5.25 |
| Slip | (33) | 18.83 | 191.4 | 5.25–8.97 |
| Ejection | (49) | 2360 | 15.65 | 8.97–8.98 |
| Surface Area | Upstream Ring | Backflow Ring | Outer Wall | Inner Wall |
|---|---|---|---|---|
| Drag force (nN) | 0.028 | 0.043 | 0.002 | 0.191 |
| Drag force (nN) | 0.264 | |||
© 2019 by the authors. Licensee MDPI, Basel, Switzerland. This article is an open access article distributed under the terms and conditions of the Creative Commons Attribution (CC BY) license (http://creativecommons.org/licenses/by/4.0/).
Share and Cite
Lin, Y.; Geng, X.; Chi, Q.; Wang, C.; Wang, Z. Driving Forces of the Bubble-Driven Tubular Micromotor Based on the Full Life-Cycle of the Bubble. Micromachines 2019, 10, 415. https://doi.org/10.3390/mi10060415
Lin Y, Geng X, Chi Q, Wang C, Wang Z. Driving Forces of the Bubble-Driven Tubular Micromotor Based on the Full Life-Cycle of the Bubble. Micromachines. 2019; 10(6):415. https://doi.org/10.3390/mi10060415
Chicago/Turabian StyleLin, Yongshui, Xinge Geng, Qingjia Chi, Chunli Wang, and Zhen Wang. 2019. "Driving Forces of the Bubble-Driven Tubular Micromotor Based on the Full Life-Cycle of the Bubble" Micromachines 10, no. 6: 415. https://doi.org/10.3390/mi10060415
APA StyleLin, Y., Geng, X., Chi, Q., Wang, C., & Wang, Z. (2019). Driving Forces of the Bubble-Driven Tubular Micromotor Based on the Full Life-Cycle of the Bubble. Micromachines, 10(6), 415. https://doi.org/10.3390/mi10060415