A Microfluidic Split-Flow Technology for Product Characterization in Continuous Low-Volume Nanoparticle Synthesis

 , ,
, , 
 and
and 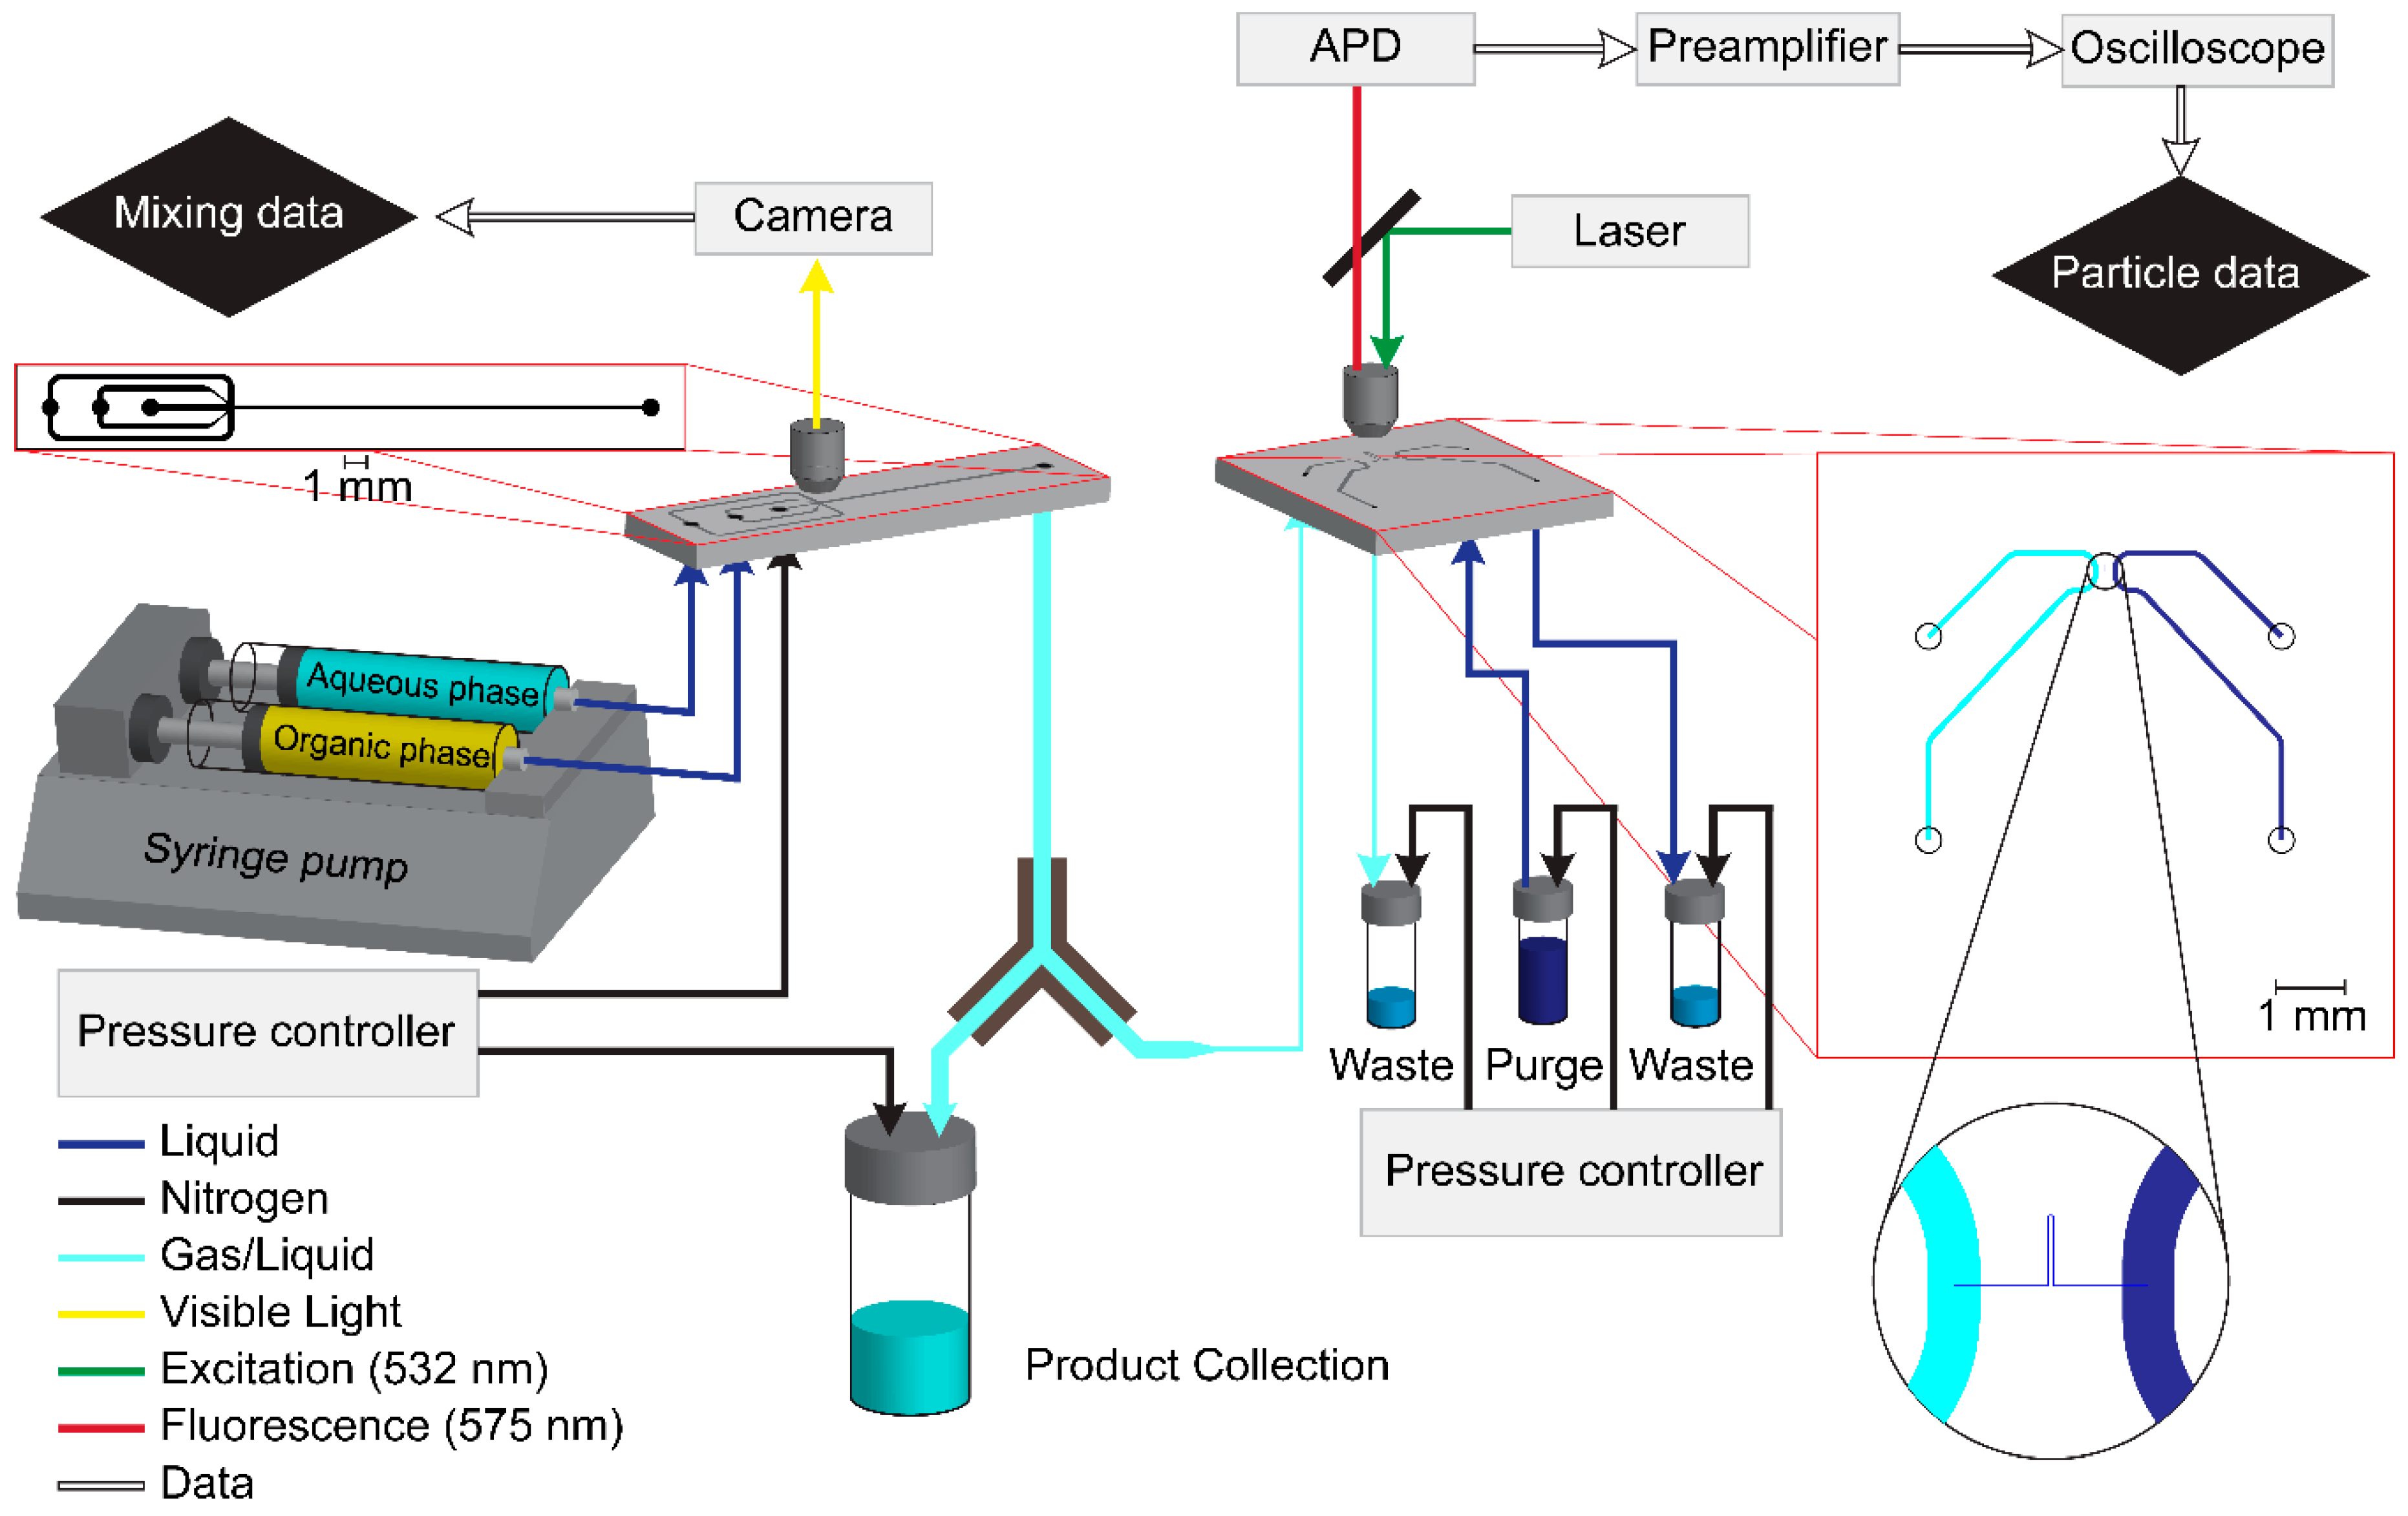
Abstract
1. Introduction
2. Materials and Methods
2.1. Mixing Chip
2.2. Detection Setup
2.3. Chemicals and Solutions
2.4. Nanoparticle Characterization and Data Processing
2.5. Experiments
3. Results and Discussion
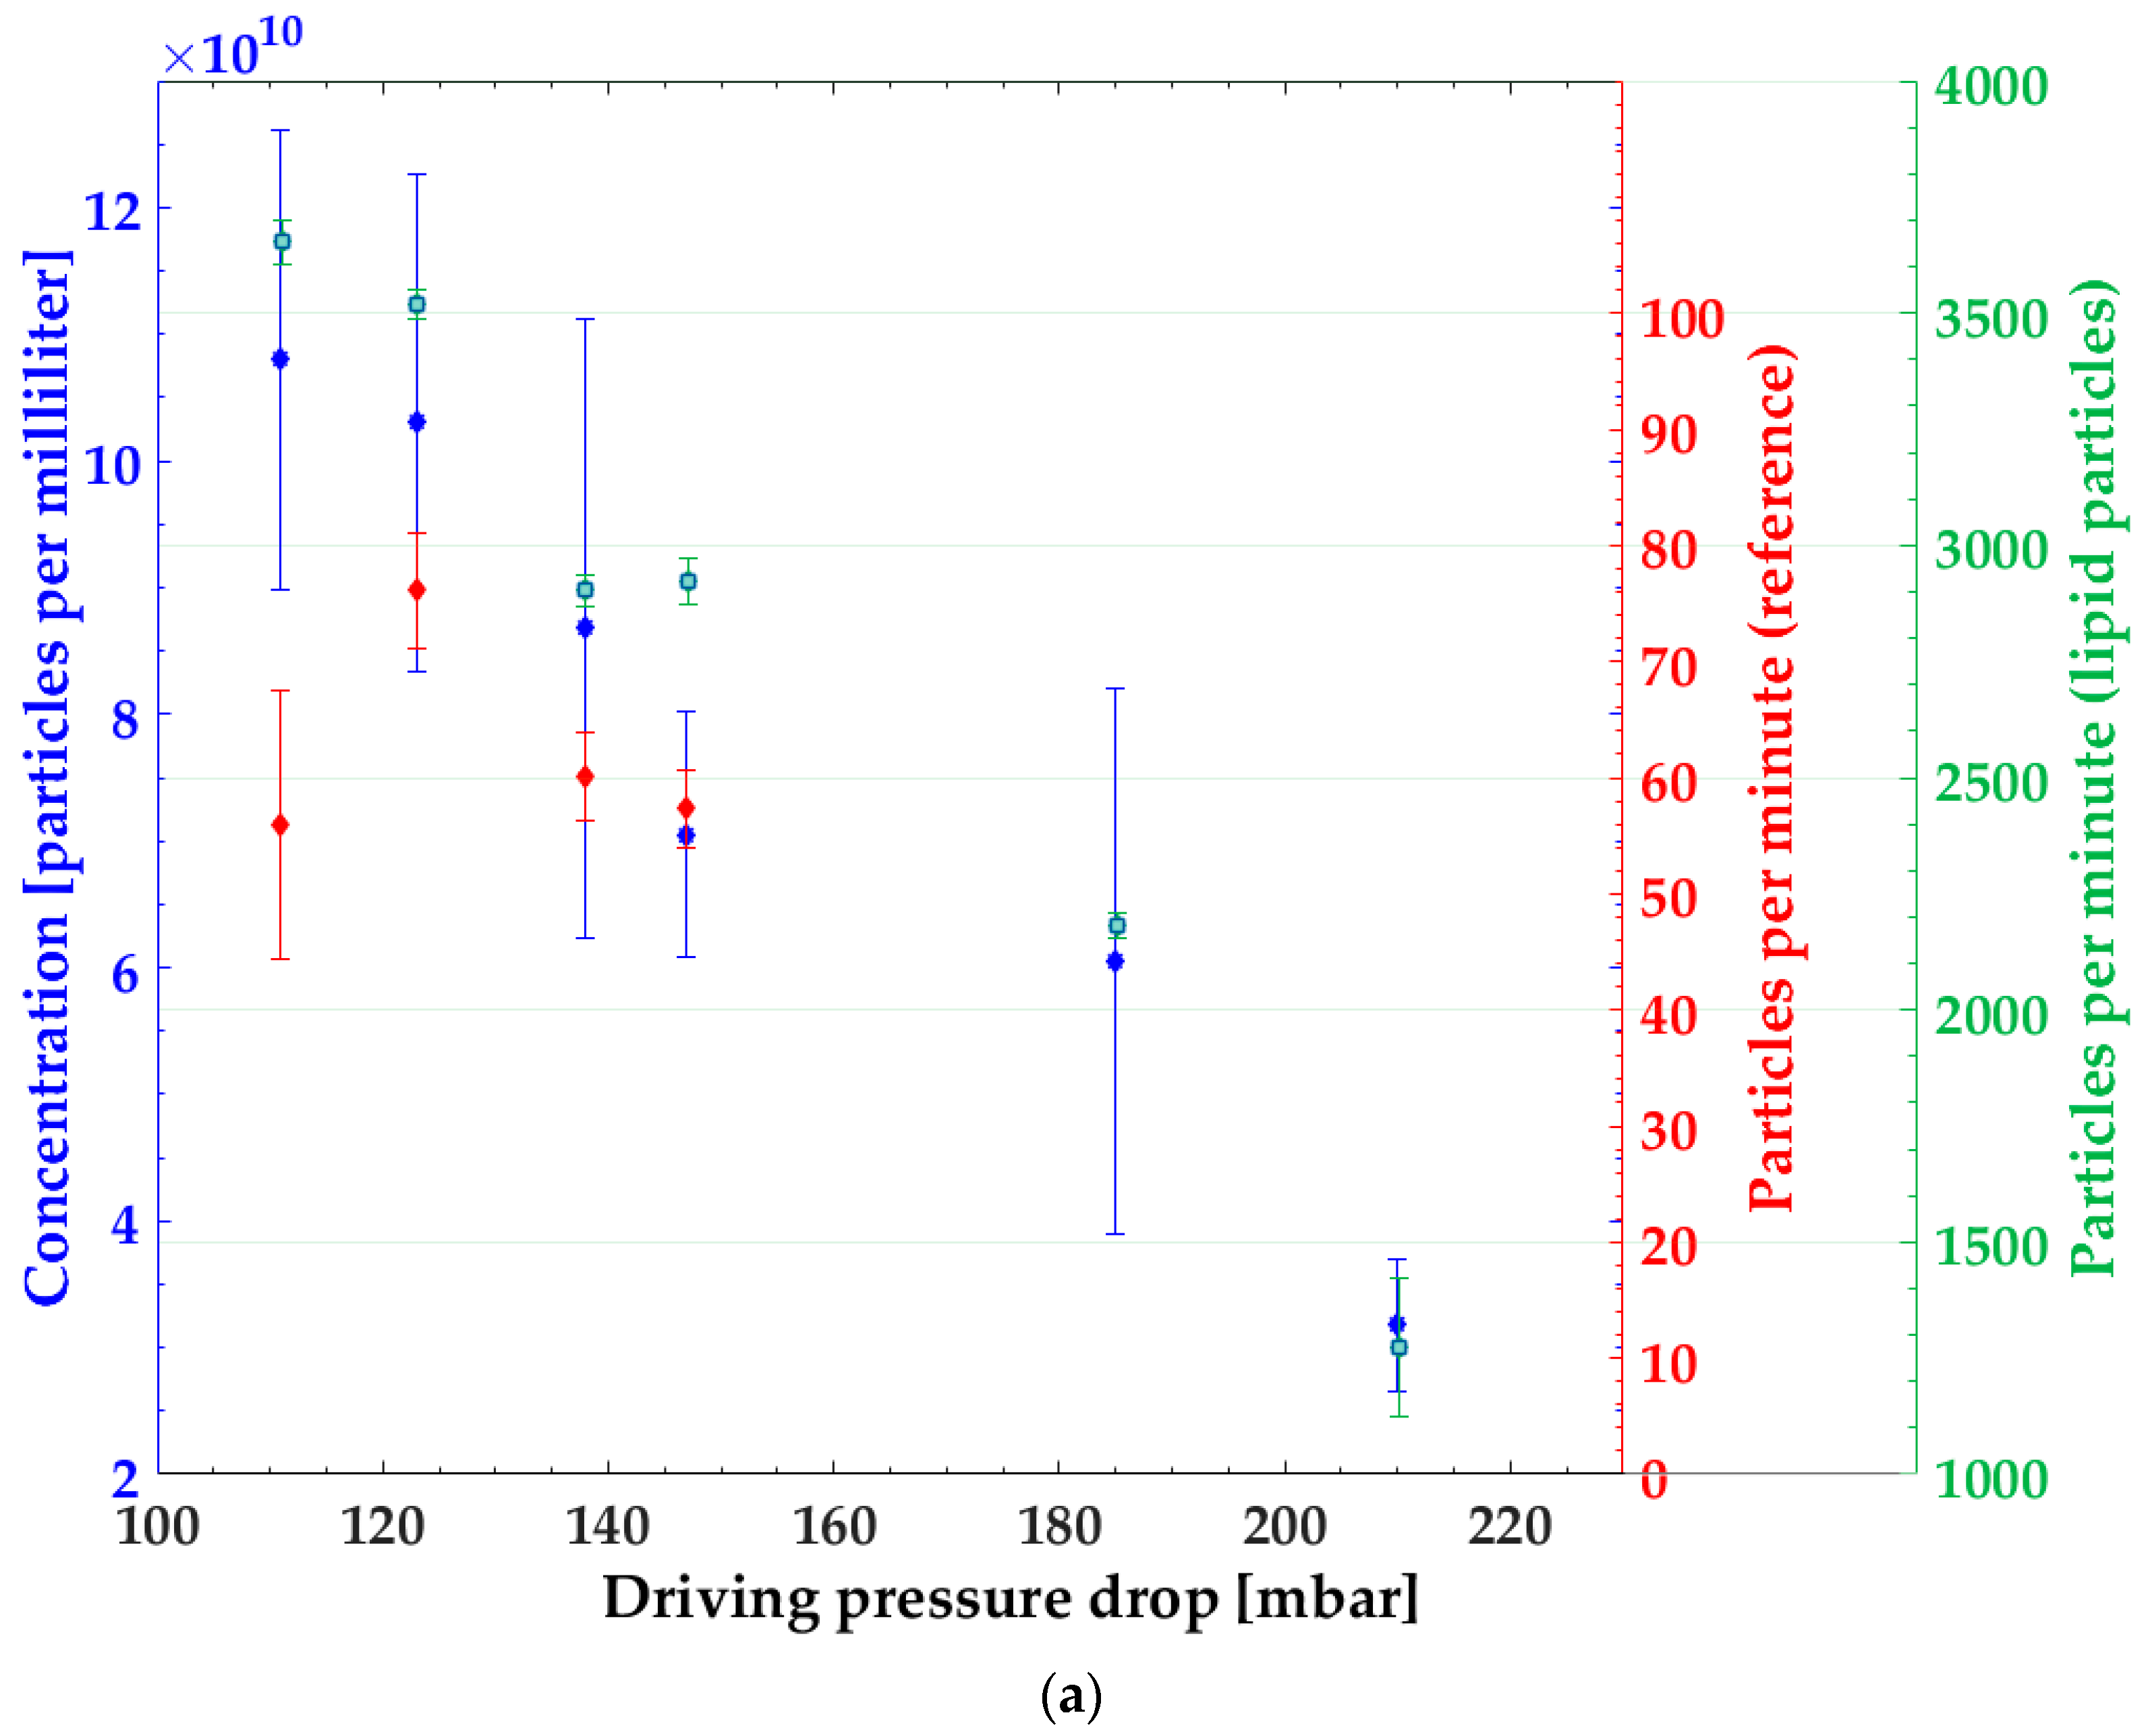
3.1. Particle Concentration
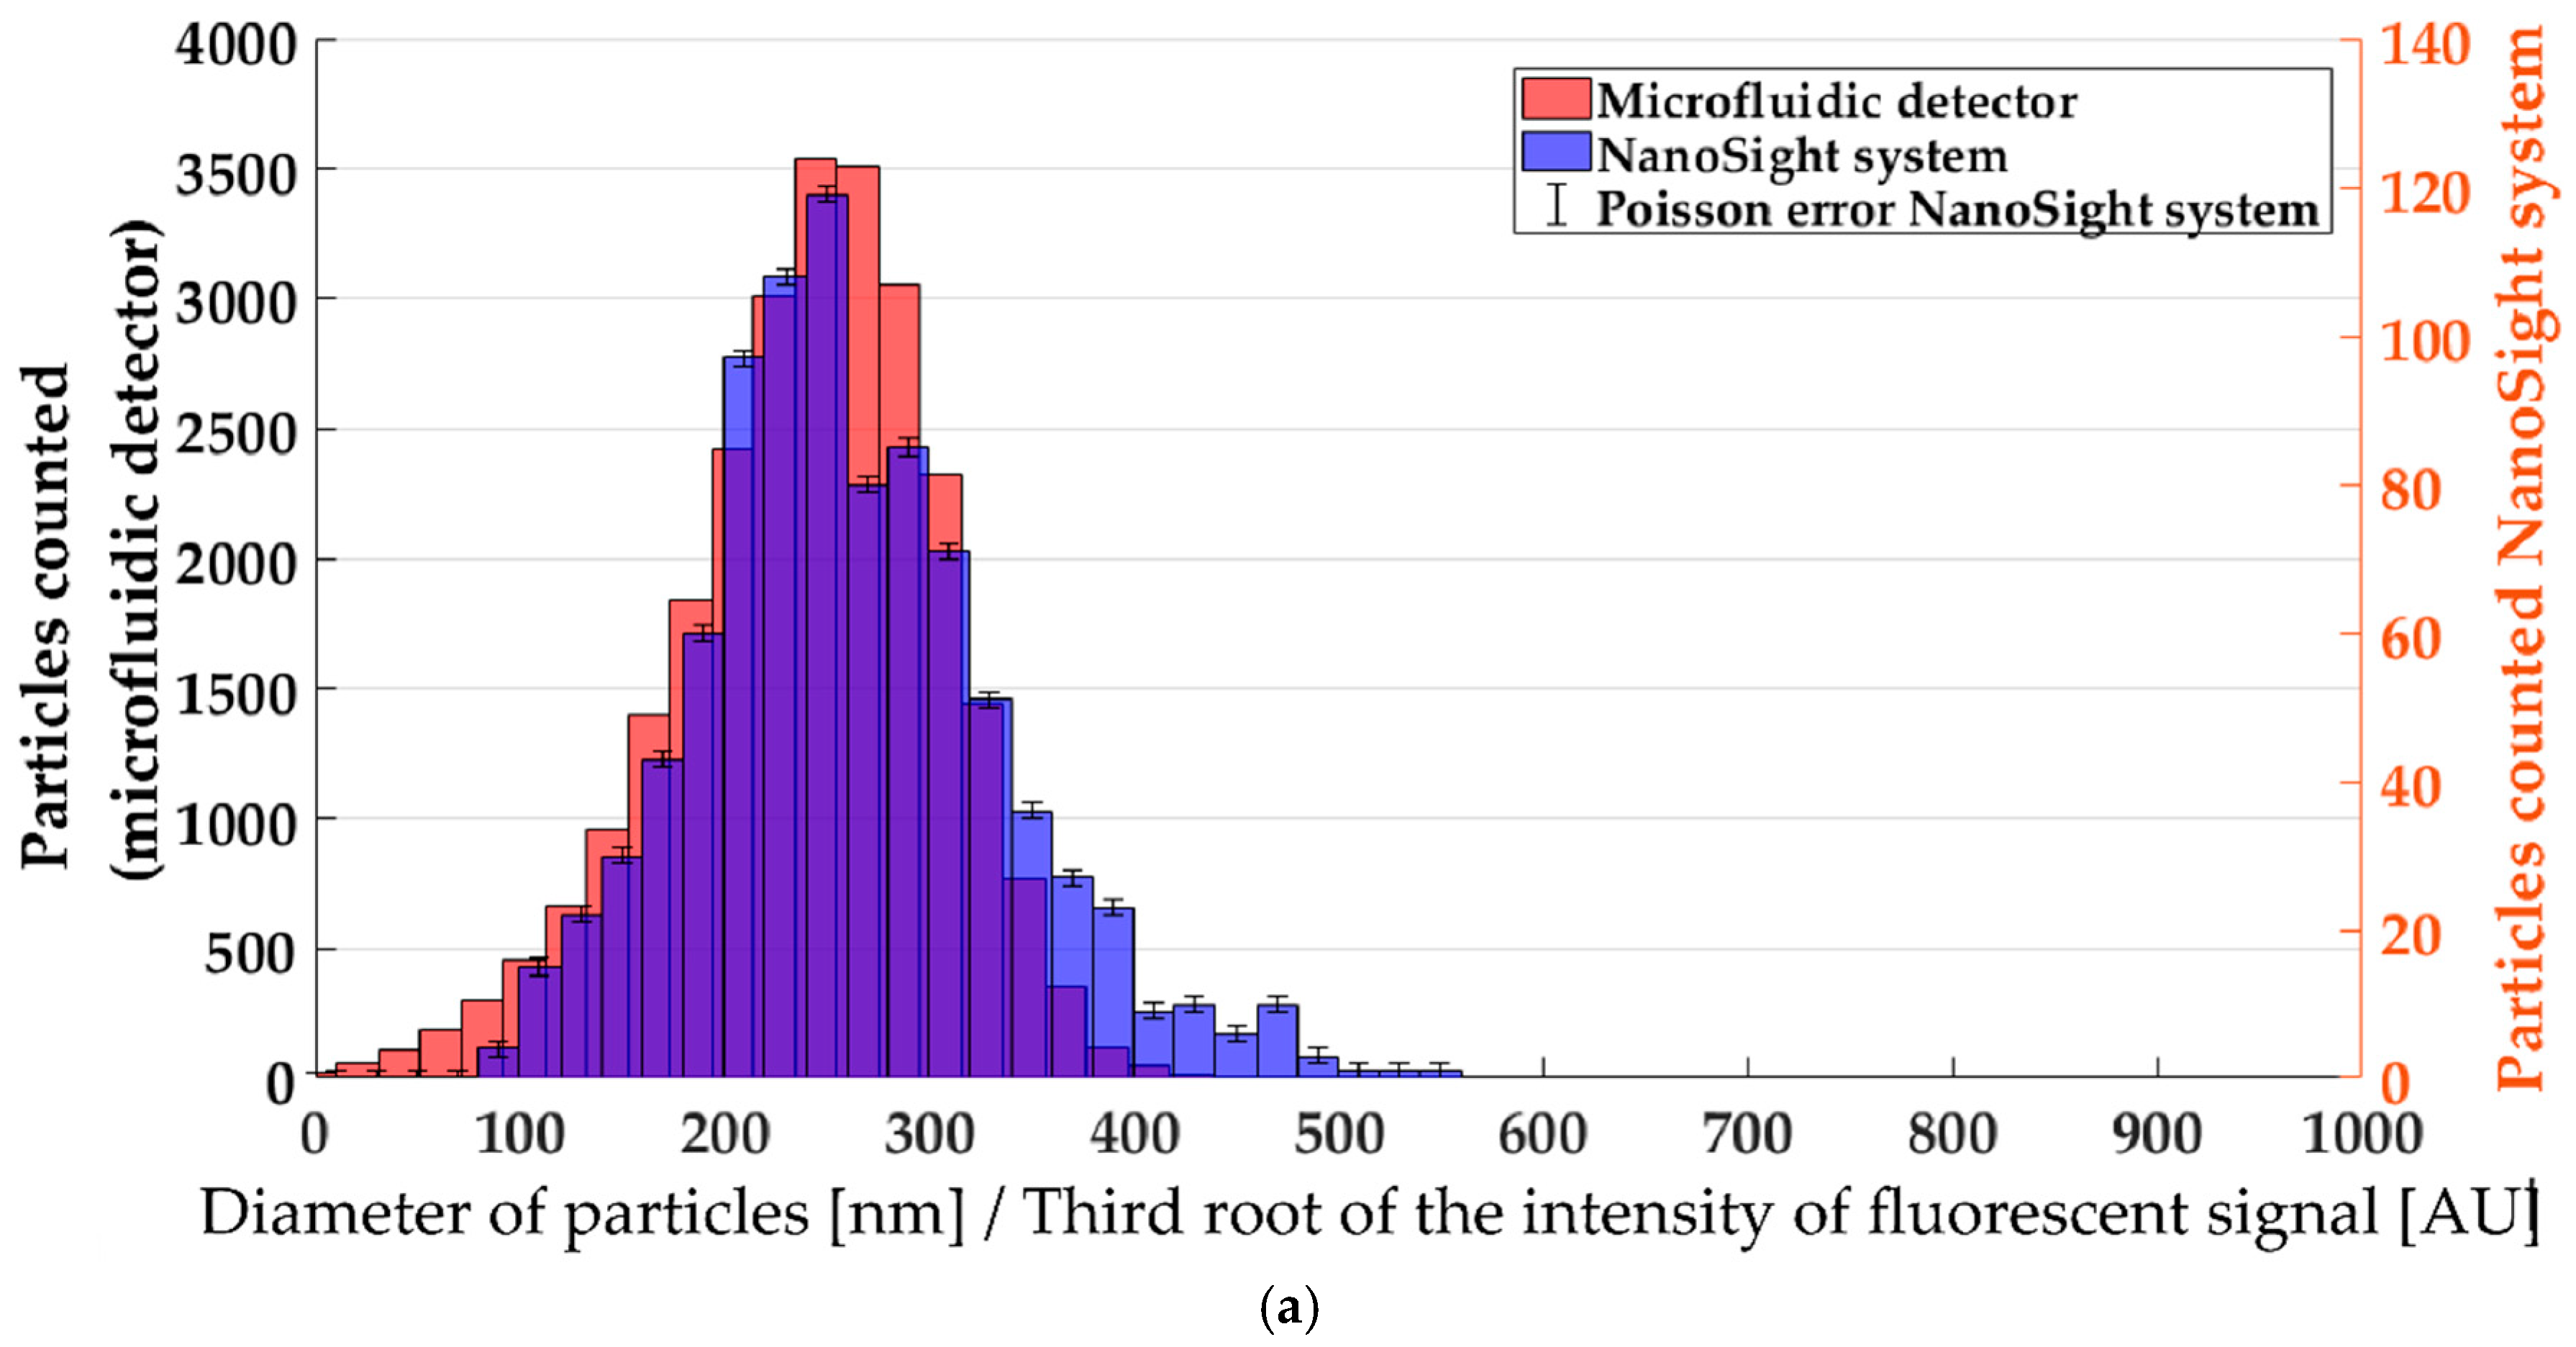
3.2. Single-Particle Analysis by Fluorescence
3.3. Continuous Monitoring to Detect Alterations in Nanoparticle Synthesis
4. Conclusions
Author Contributions
Funding
Acknowledgments
Conflicts of Interest
Appendix A
Mixing Chip

Detection Chip


References
- Malet-Sanz, L.; Susanne, F. Continuous Flow Synthesis. A Pharma Perspective. J. Med. Chem. 2012, 55, 4062–4098. [Google Scholar] [CrossRef] [PubMed]
- Elvira, K.S.; Solvas, X.C.I.; Wootton, R.C.R.; deMello, A.J. The past, present and potential for microfluidic reactor technology in chemical synthesis. Nat. Chem. 2013, 5, 905–915. [Google Scholar] [CrossRef] [PubMed]
- Plutschack, M.B.; Pieber, B.; Gilmore, K.; Seeberger, P.H. The Hitchhikers Guide in Flow Chemistry. Chem. Rev. 2017, 117, 11796–11893. [Google Scholar] [CrossRef] [PubMed]
- Grundemann, L.; Gonschorowski, V.; Fischer, N.; Scholl, S. Cleaning waste minimization for multiproduct plants: Transferring macro batch to micro conti manufacturing. J. Clean Prod. 2012, 24, 92–101. [Google Scholar] [CrossRef]
- Yoshida, J.; Takahashi, Y.; Nagaki, A. Flash chemistry: Flow chemistry that cannot be done in batch. Chem. Commun. 2013, 49, 9896–9904. [Google Scholar] [CrossRef] [PubMed]
- Krishnadasan, S.; Brown, R.J.C.; deMello, A.J.; deMello, J.C. Intelligent routes to the controlled synthesis of nanoparticles. Lab Chip 2007, 7, 1434–1441. [Google Scholar] [CrossRef] [PubMed]
- Toyota, A.; Nakamura, H.; Ozono, H.; Yamashita, K.; Uehara, M.; Maeda, H. Combinatorial Synthesis of CdSe Nanoparticles Using Microreactors. J. Phys. Chem. C 2010, 114, 7527–7534. [Google Scholar] [CrossRef]
- Sugano, K.; Uchida, Y.; Ichihashi, O.; Yamada, H.; Tsuchiya, T.; Tabata, O. Mixing speed-controlled gold nanoparticle synthesis with pulsed mixing microfluidic system. Microfluid. Nanofluid. 2010, 9, 1165–1174. [Google Scholar] [CrossRef]
- Kunal, P.; Roberts, E.J.; Riche, C.T.; Jarvis, K.; Malmstadt, N.; Bruchtchey, R.L.; Humphrey, S.M. Continuous Flow Synthesis of Rh and RhAg Alloy Nanoparticle Catalysts Enables Scalable Production and Improved Morphological. Control. Chem. Mat. 2017, 20, 4341–4350. [Google Scholar] [CrossRef]
- Duraiswamy, S.; Khan, S.A. Dual-Stage Continuous-Flow Seedless Microfluidic Synthesis of Anisotropic Gold Nanocrystals. Part. Part. Syst. Charact. 2014, 31, 429–432. [Google Scholar] [CrossRef]
- Stolzenburg, P.; Lorenz, T.; Dietzel, A.; Garnweithner, G. Microfluidic synthesis of metal oxide nanoparticles via the nonaqueous method. Chem. Eng. Sci. 2018, 191, 500–510. [Google Scholar] [CrossRef]
- Lorenz, T.; Bojko, S.; Bunjes, H.; Dietzel, A. An inert 3D emulsification device for individual precipitation and concentration of amorphous drug nanoparticles. Lab Chip 2018, 18, 627–638. [Google Scholar] [CrossRef] [PubMed]
- Rhee, M.; Valencia, P.M.; Rodriguez, M.I.; Langer, R.; Farokhzad, O.C.; Karnik, R. Synthesis of Size-Tunable Polymeric Nanoparticles Enabled by 3D Hydrodynamic Flow Focusing in Single-Layer Microchannels. Adv. Mater. 2011, 23, H79–H83. [Google Scholar] [CrossRef] [PubMed]
- Kang, X.; Luo, C.; Wei, Q.; Xiong, C.; Chen, Q.; Chen, Y.; Ouyang, Q. Mass production of highly monodisperse polymeric nanoparticles by parallel flow focusing system. Microfluid. Nanofluid. 2013, 15, 337–345. [Google Scholar] [CrossRef]
- Felnerova, D.; Viret, J.F.; Glück, R.; Moser, C. Liposomes and virosomes as delivery systems for antigens, nucleic acids and drugs. Curr. Opin. Biotechnol. 2004, 15, 518–529. [Google Scholar] [CrossRef] [PubMed]
- Westesen, K.; Bunjes, H.; Koch, M.J.H. Physicochemical characterization of lipid nanoparticles and evaluation of their drug loading capacity and sustained release potential. J. Control. Release 1997, 48, 223–236. [Google Scholar] [CrossRef]
- Mehnert, W.; Mäder, K. Solid lipid nanoparticles Production, characterization and application. Adv. Drug Deliv. Rev. 2012, 47, 165–196. [Google Scholar] [CrossRef]
- Hillaireau, H.; Couvreur, P. Nanocarriers’ entry into the cell: Relevance to drug delivery. Cell. Mol. Life Sci. 2009, 66, 2873–2896. [Google Scholar] [CrossRef]
- Zhigaltsev, I.V.; Belliveau, N.; Hafez, I.; Leung, A.K.K.; Huft, J.; Nasen, C.; Cullis, P.R. Bottom-Up Design and Synthesis of Limit Size Lipid Nanoparticle Systems with Aqueous and Triglyceride Cores Using Millisecond Microfluidic Mixing. Langmuir 2012, 28, 3633–3640. [Google Scholar] [CrossRef]
- Lee, J.; Lee, M.G.; Jung, C.; Park, Y.-H.; Song, C.; Coi, M.C.; Park, H.G.; Park, J.K. High-throughput nanoscale lipid vesicle synthesis in a semicircular contraction-expansion array microchannel. BioChip J. 2013, 7, 210–217. [Google Scholar] [CrossRef]
- Xia, H.M.; Sheah, Y.P.; Liu, Y.C.; Wang, W.; Toh, A.G.G.; Wang, Z.P. Anti-solvent precipitation of solid lipid nanoparticles using a microfluidic oscillator mixer. Microfluid. Nanofluid. 2015, 19, 283–290. [Google Scholar] [CrossRef]
- Hood, R.R.; DeVoe, D.L. High-Throughput Continuous Flow Production of Nanoscale Liposomes by Microfluidic Vertical Flow Focusing. Small 2015, 11, 5790–5799. [Google Scholar] [CrossRef] [PubMed]
- Carugo, D.; Bottaro, E.; Owen, J.; Stride, E.; Nastruzzi, C. Liposome production by microfluidics: Potential and limiting factors. Sci. Rep. 2016, 6, 25876. [Google Scholar] [CrossRef] [PubMed]
- Erfle, P.; Riewe, J.; Bunjes, H.; Dietzel, A. Optically monitored segmented flow for controlled ultra-fast mixing and nanoparticle precipitation. Microfluid. Nanofluid. 2017, 21. [Google Scholar] [CrossRef]
- Yurt, A.; Daaboul, G.G.; Connor, J.H.; Goldberg, B.B.; Ünlü, M.S. Single nanoparticle detectors for biological applications. Nanoscale 2012, 4, 715–726. [Google Scholar] [CrossRef]
- Maceiczyk, R.M.; Lignos, I.G.; deMello, A.J. Online detection and automation methods in microfluidic nanomaterial synthesis. Curr. Opin. Chem. Eng. 2015, 8, 29–35. [Google Scholar] [CrossRef]
- Chastek, T.Q.; Iida, K.; Amis, E.J.; Fasolka, M.J.; Beers, K.L. A microfluidic platform for integrated synthesis and dynamic light scattering measurement of block copolymer micelles. Lab Chip 2008, 8, 950–957. [Google Scholar] [CrossRef] [PubMed]
- Destremaut, F.; Salmon, J.-B.; Qi, L.; Chapel, J.P. Microfluidics with on-line dynamic light scattering for size measurements. Lab Chip 2009, 9, 3289–3296. [Google Scholar] [CrossRef]
- Krishnadasan, S.; Tovilla, J.; Vilar, R.; deMello, A.J.; deMello, J.C. On-line analysis of CdSe nanoparticle formation in a continuous flow chip-based microreactor. J. Mater. Chem. 2004, 14, 2655–2660. [Google Scholar] [CrossRef]
- Yue, J.; Falke, F.H.; Schouten, J.C.; Nijhuis, T.A. Microreactors with integrated UV/Vis spectroscopic detection for online process analysis under segmented flow. Lab Chip 2013, 13, 4855–4863. [Google Scholar] [CrossRef]
- Chan, E.M.; Marcus, M.A.; Fakara, S.; EINaggar, M.; Mathies, R.A.; Alivisatos, A.P. Millisecond Kinetics of Nanocrystal Cation Exchange Using Microfluidic X-ray Absorption Spectroscopy. J. Phys. Chem. A 2007, 111, 12210–12215. [Google Scholar] [CrossRef] [PubMed]
- Uehara, M.; Sun, Z.H.; Oyanagi, H.; Yamashita, K.; Fukano, A.; Nakamura, H.; Maeda, H. In situ extended X-ray absorption fine structure study of initial processes in CdSe nanocrystals formation using a microreactor. Appl. Phys. Lett. 2009, 94. [Google Scholar] [CrossRef]
- Huh, D.; Gu, W.; Kamotani, Y.; Grotberg, J.B.; Takayama, S. Microfluidics for flow cytometric analysis of cells and particles. Physiol. Meas. 2005, 26, R73–R98. [Google Scholar] [CrossRef] [PubMed]
- Morgan, H.; Holmes, D.; Green, N.G. High speed simultaneous single particle impedance and fluorescence analysis on a chip. Curr. Appl. Phys. 2006, 6, 367–370. [Google Scholar] [CrossRef]
- Fraikin, J.-L.; Teesalu, T.; McKenney, C.M.; Ruoslathti, E.; Cleland, A.N. A high-throughput label-free nanoparticle analyser. Nat. Nanotechnol. 2011, 6, 308–313. [Google Scholar] [CrossRef] [PubMed]
- Rajauria, S.; Axline, C.; Gottstein, C.; Cleland, N. High-Speed Discrimination and Sorting of Submicron Particles Using a Microfluidic Device. Nano Lett. 2015, 15, 469–475. [Google Scholar] [CrossRef] [PubMed]
- Spencer, D.; Caselli, F.; Bisgena, P.; Morgan, H. High accuracy particle analysis using sheathless microfluidic impedance cytometry. Lab Chip 2016, 16, 2467–2473. [Google Scholar] [CrossRef] [PubMed]
- Carminati, M. Advances in High-Resolution Microscale Impedance Sensors. J. Sens. 2017. [Google Scholar] [CrossRef]
- Cui, L.; Zhang, T.; Morgan, H. Optical particle detection integrated in a dielectrophoretic lab-on-a-chip. J. Micromech. Microeng. 2002, 12, 7–12. [Google Scholar] [CrossRef]
- Ignatovich, F.V.; Novotny, L. Real-Time and Background-Free Detection of Nanoscale Particles. Phys. Rev. Lett. 2006, 96. [Google Scholar] [CrossRef]
- Pagliara, S.; Chimerel, C.; Aarts, D.G.A.L.; Langford, R.; Keyser, U.F. Colloid Flow Control in Microchannels and Detection by Laser Scattering. Prog. Colloid Polym. Sci. 2012, 139, 45–49. [Google Scholar] [CrossRef]
- Zhuang, G.; Jensen, T.G.; Kutter, J.P. Detection of unlabeled particles in the low micrometer size range using light scattering and hydrodynamic 3D focusing in a microfluidic system. Electrophoresis 2012, 33, 1715–1722. [Google Scholar] [CrossRef] [PubMed]
- Zhu, S.; Ma, L.; Wang, S.; Chen, C.; Zhang, W.; Yang, L.; Hang, W.; Nolan, J.P.; Wu, L.; Yan, X. Light-Scattering Detection below the Level of Single Fluorescent Molecules for High-Resolution Characterization of Functional Nanoparticles. ACS Nano 2014, 8, 10998–11006. [Google Scholar] [CrossRef] [PubMed]
- Eyal, S.; Quake, S.R. Velocity-independent microfluidic flow cytometry. Electrophoresis 2002, 23, 2653–2657. [Google Scholar] [CrossRef]
- Dittrich, P.S.; Schwille, P. An Integrated Microfluidic System for Reaction, High-Sensitivity Detection, and Sorting of Fluorescent Cells and Particles. Anal. Chem. 2003, 75, 5767–5774. [Google Scholar] [CrossRef] [PubMed]
- Yang, L.; Zhu, S.; Hang, W.; Wu, L.; Yan, X. Development of an Ultrasensitive Dual-Channel Flow Cytometer for the Individual Analysis of Nanosized Particles and Biomolecules. Anal. Chem. 2009, 81, 2555–2563. [Google Scholar] [CrossRef] [PubMed]
- Spencer, D.; Elliott, G.; Morgan, H. A sheath-less combined optical and impedance micro-cytometer. Lab Chip 2014, 14, 3064–3073. [Google Scholar] [CrossRef] [PubMed]
- Friedrich, R.; Block, S.; Alizadehheidari, M.; Heider, S.; Fritzdche, J.; Esbjörner, E.K.; Westerlund, F.; Bally, M. A nano flow cytometer for single lipid vesicle analysis. Lab Chip 2017, 17, 830–841. [Google Scholar] [CrossRef] [PubMed]
- Golden, J.P.; Kim, J.S.; Erickson, J.S.; Hilliard, L.R.; Howell, P.B.; Anderson, G.P.; Nasir, M.; Logler, S. Multi-wavelength microflow cytometer using groove-generated sheath flow. Lab Chip 2009, 9, 1942–1950. [Google Scholar] [CrossRef]
- Simon, P.; Franckowski, M.; Bock, N.; Neukammer, J. Label-free whole blood cell differentiation based on multiple frequency AC impedance and light scattering analysis in a micro flow cytometer. Lab Chip 2016, 16, 2326–2338. [Google Scholar] [CrossRef]
- Mitra, A.; Ignatovich, F.; Novotny, L. Real-time optical detection of single human and bacterial viruses based on dark-field interferometry. Biosens. Bioelectron. 2012, 31, 499–504. [Google Scholar] [CrossRef] [PubMed]
- Haiden, C.; Wopelka, T.; Jechm, M.; Puchberger-Enengl, D.; Weber, E.; Keplinger, F.; Vellenloop, M.J. A microfluidic system for visualisation of individual sub-micron particles by light scattering. Procedia Eng. 2012, 47, 680–683. [Google Scholar] [CrossRef]
- D’Addio, S.M.; Prud’homme, R.K. Controlling drug nanoparticle formation by rapid precipitation. Adv. Drug Deliv. Rev. 2011, 63, 417–426. [Google Scholar] [CrossRef] [PubMed]
- Pagliara, S.; Chimerel, C.; Langford, R.; Aarts, D.; Keyser, U.F. Parallel sub-micrometre channels with different dimensions for laser scattering detection. Lab Chip 2011, 11, 3365–3368. [Google Scholar] [CrossRef] [PubMed]
- Greenspan, P.; Fowler, S.D. Spectrofluorometric studies of the lipid probe, nile red. J. Lipid Res. 1985, 26, 781–789. [Google Scholar]
- Al-Halhouli, A.; Al-Faqheri, W.; Alhamarneh, B.; Hecht, L.; Dietzel, A. Spiral Microchannels with Trapezoidal Cross Section Fabricated by Femtosecond Laser Ablation in Glass for the Inertial Separation of Microparticles. Micromachines 2018, 9, 171. [Google Scholar] [CrossRef] [PubMed]
- Schulze, T.; Mattern, K.; Fruh, E.; Hecht, L.; Rustenbeck, I.; Dietzel, A. A 3D microfluidic perfusion system made from glass for multiparametric analysis of stimulus-secretioncoupling in pancreatic islets. Biomed. Microdevices 2017, 19, 47. [Google Scholar] [CrossRef] [PubMed]


© 2019 by the authors. Licensee MDPI, Basel, Switzerland. This article is an open access article distributed under the terms and conditions of the Creative Commons Attribution (CC BY) license (http://creativecommons.org/licenses/by/4.0/).
Share and Cite
Bolze, H.; Erfle, P.; Riewe, J.; Bunjes, H.; Dietzel, A.; Burg, T.P. A Microfluidic Split-Flow Technology for Product Characterization in Continuous Low-Volume Nanoparticle Synthesis. Micromachines 2019, 10, 179. https://doi.org/10.3390/mi10030179
Bolze H, Erfle P, Riewe J, Bunjes H, Dietzel A, Burg TP. A Microfluidic Split-Flow Technology for Product Characterization in Continuous Low-Volume Nanoparticle Synthesis. Micromachines. 2019; 10(3):179. https://doi.org/10.3390/mi10030179
Chicago/Turabian StyleBolze, Holger, Peer Erfle, Juliane Riewe, Heike Bunjes, Andreas Dietzel, and Thomas P. Burg. 2019. "A Microfluidic Split-Flow Technology for Product Characterization in Continuous Low-Volume Nanoparticle Synthesis" Micromachines 10, no. 3: 179. https://doi.org/10.3390/mi10030179
APA StyleBolze, H., Erfle, P., Riewe, J., Bunjes, H., Dietzel, A., & Burg, T. P. (2019). A Microfluidic Split-Flow Technology for Product Characterization in Continuous Low-Volume Nanoparticle Synthesis. Micromachines, 10(3), 179. https://doi.org/10.3390/mi10030179