Design of a Dual-Technology Fusion Sensor Chip with a Ring Electrode for Biosensing Application


Abstract
1. Introduction
2. Materials and Methods
2.1. Theory
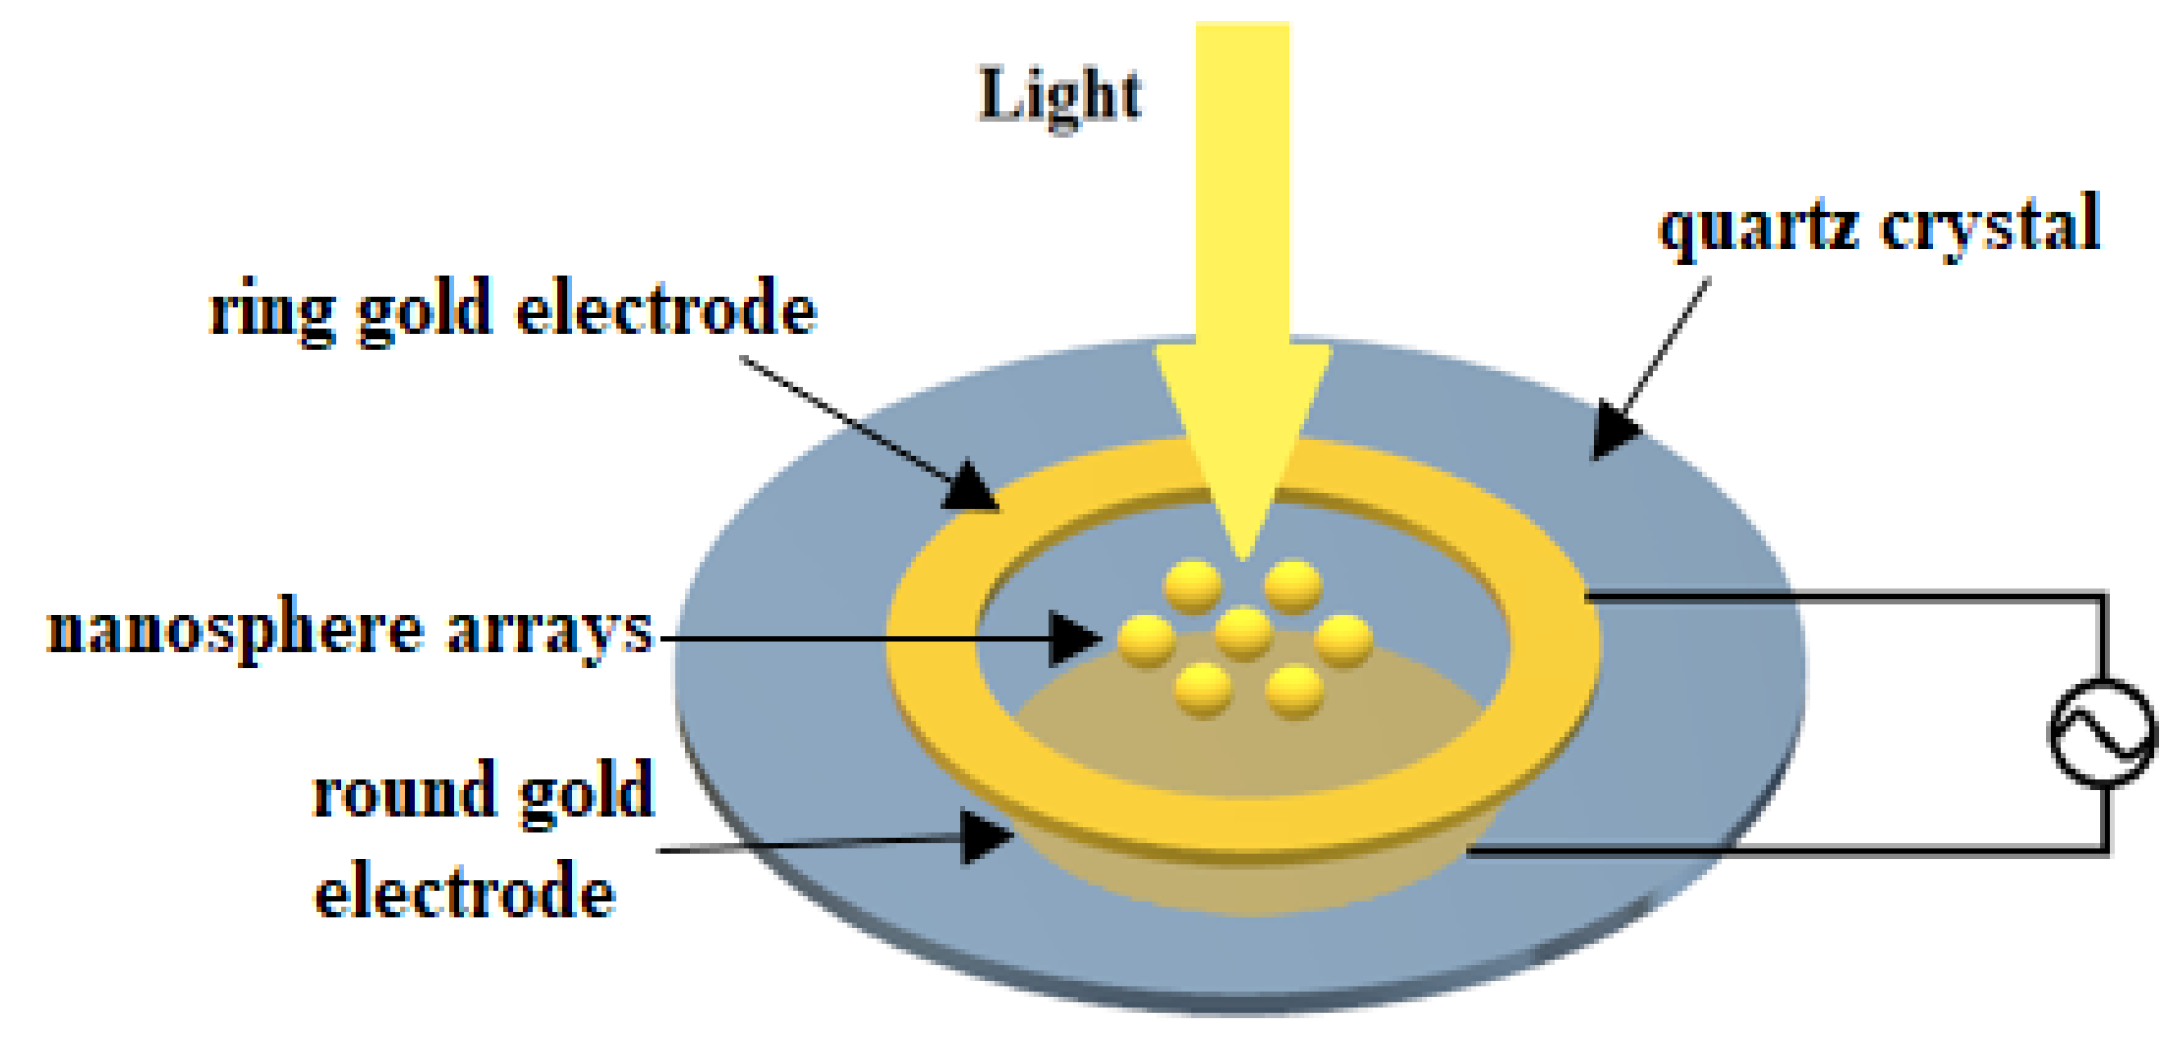
2.2. Structure
3. Procedures
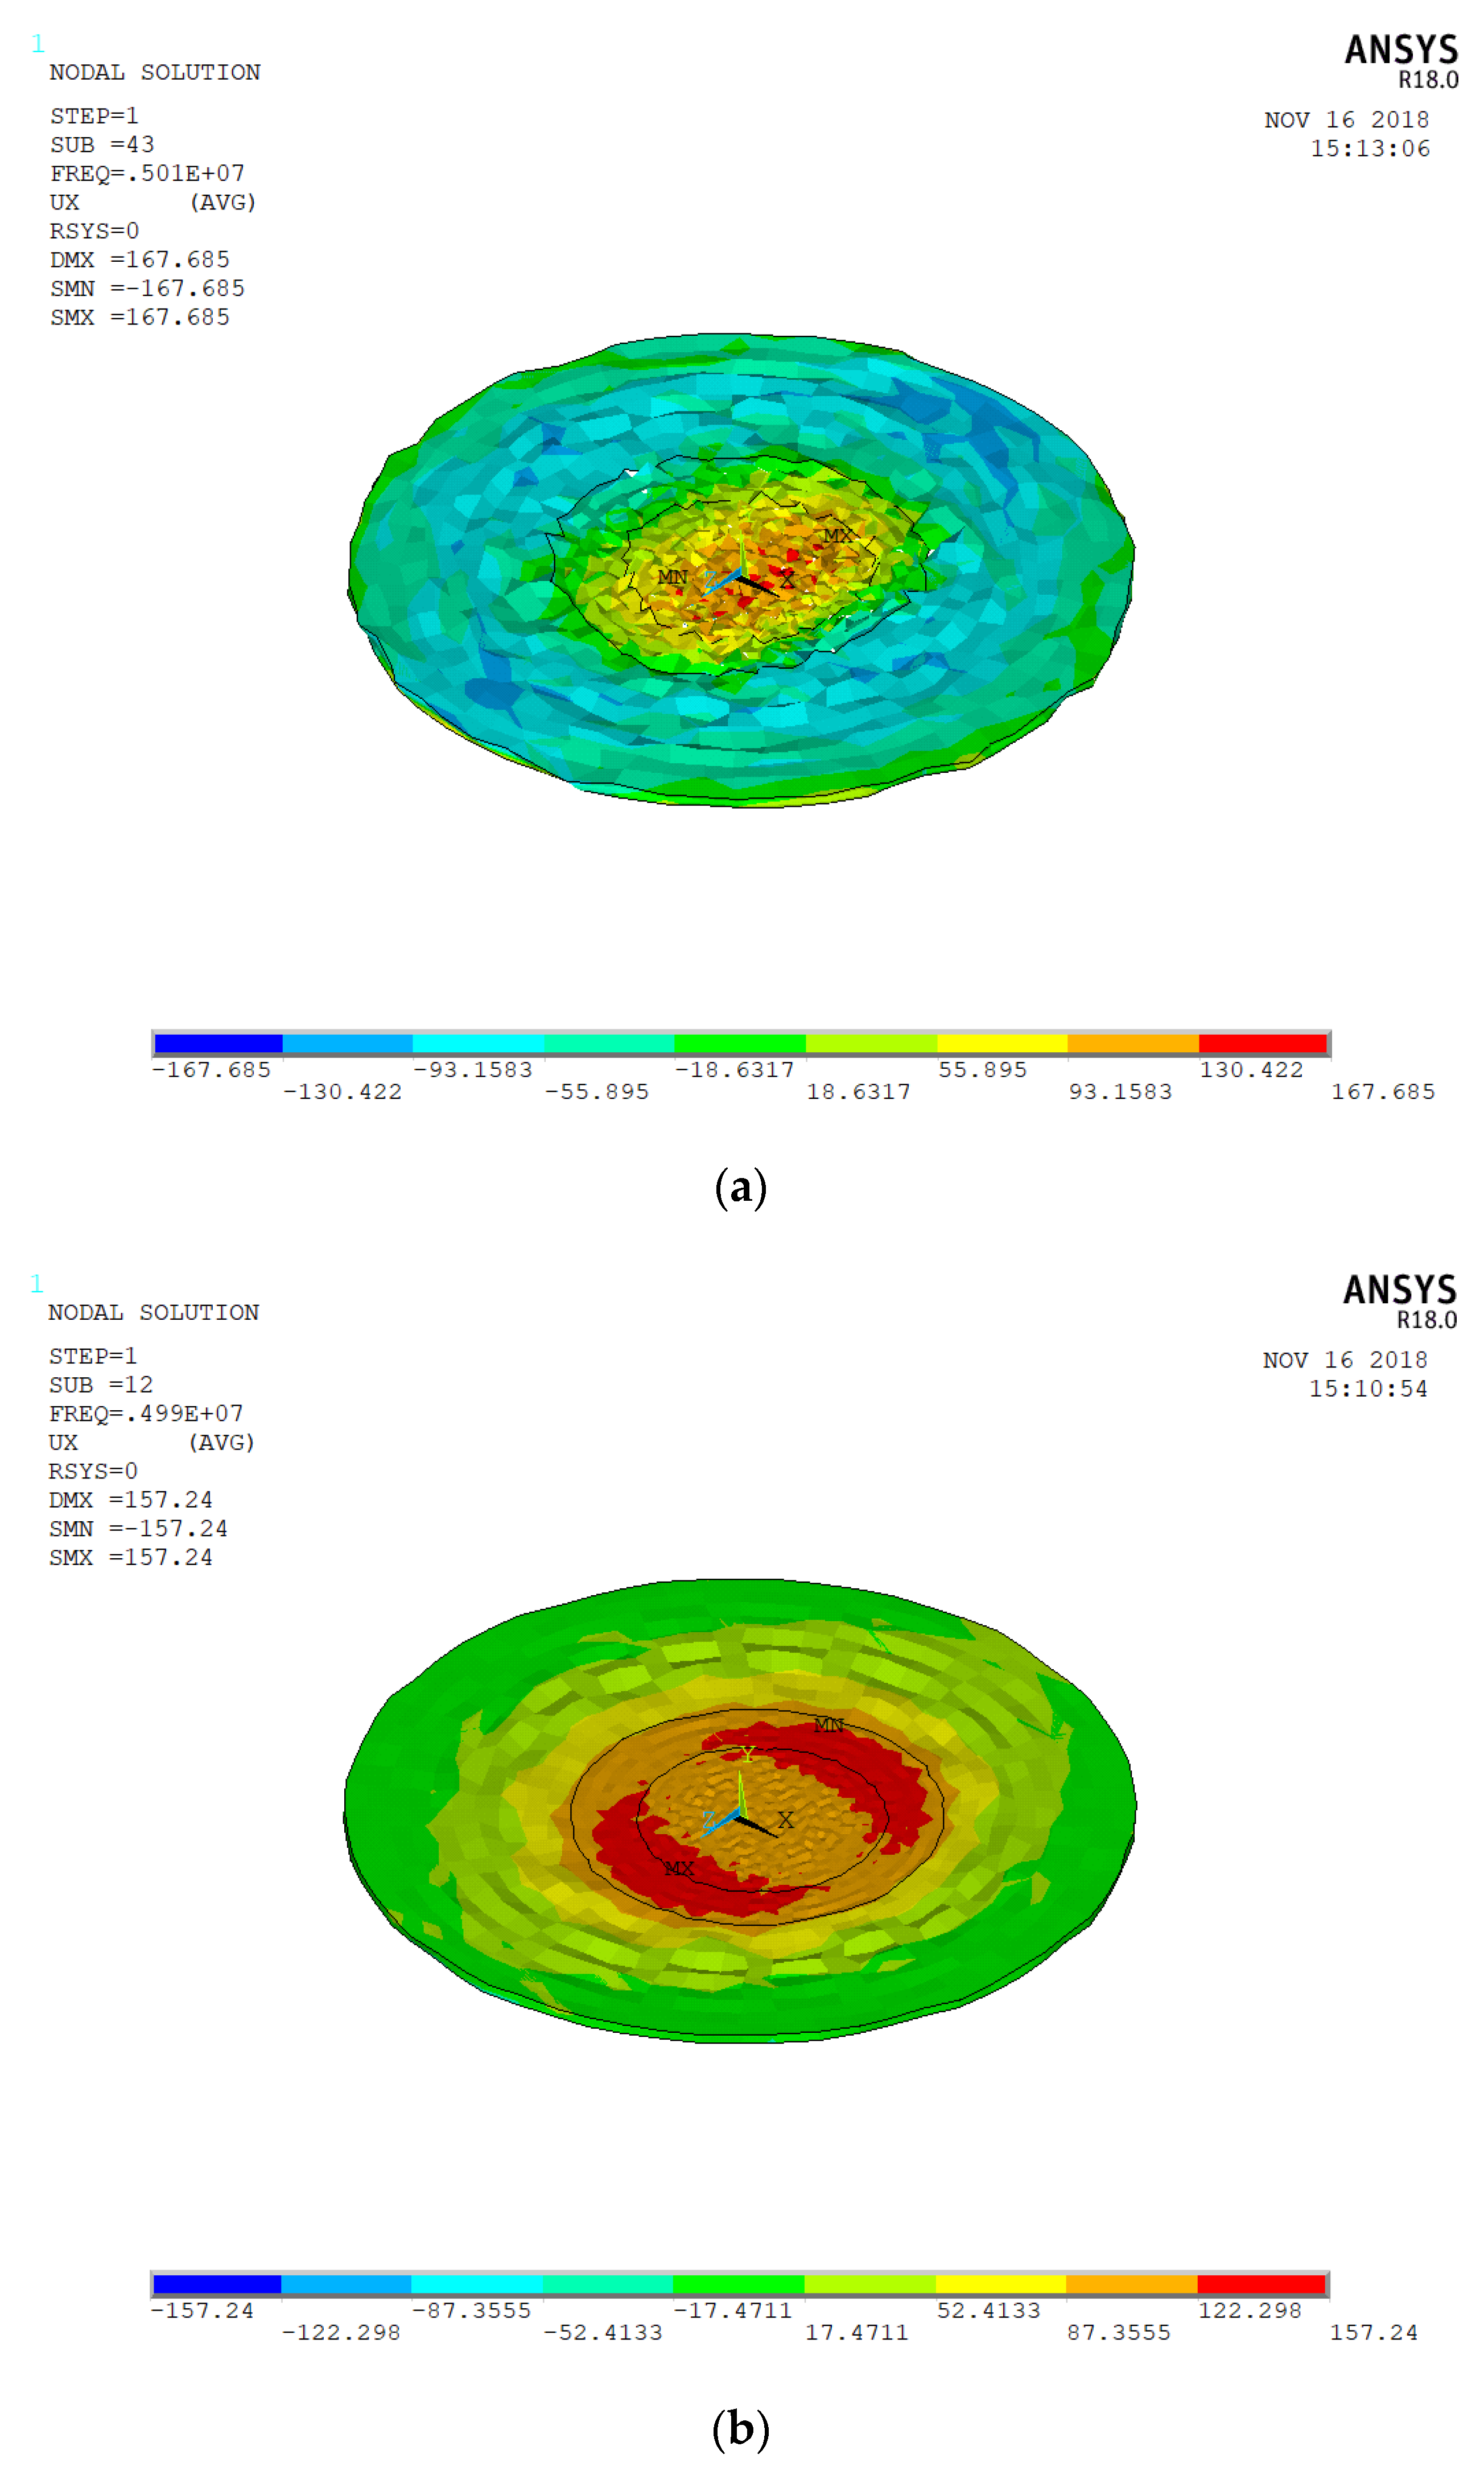
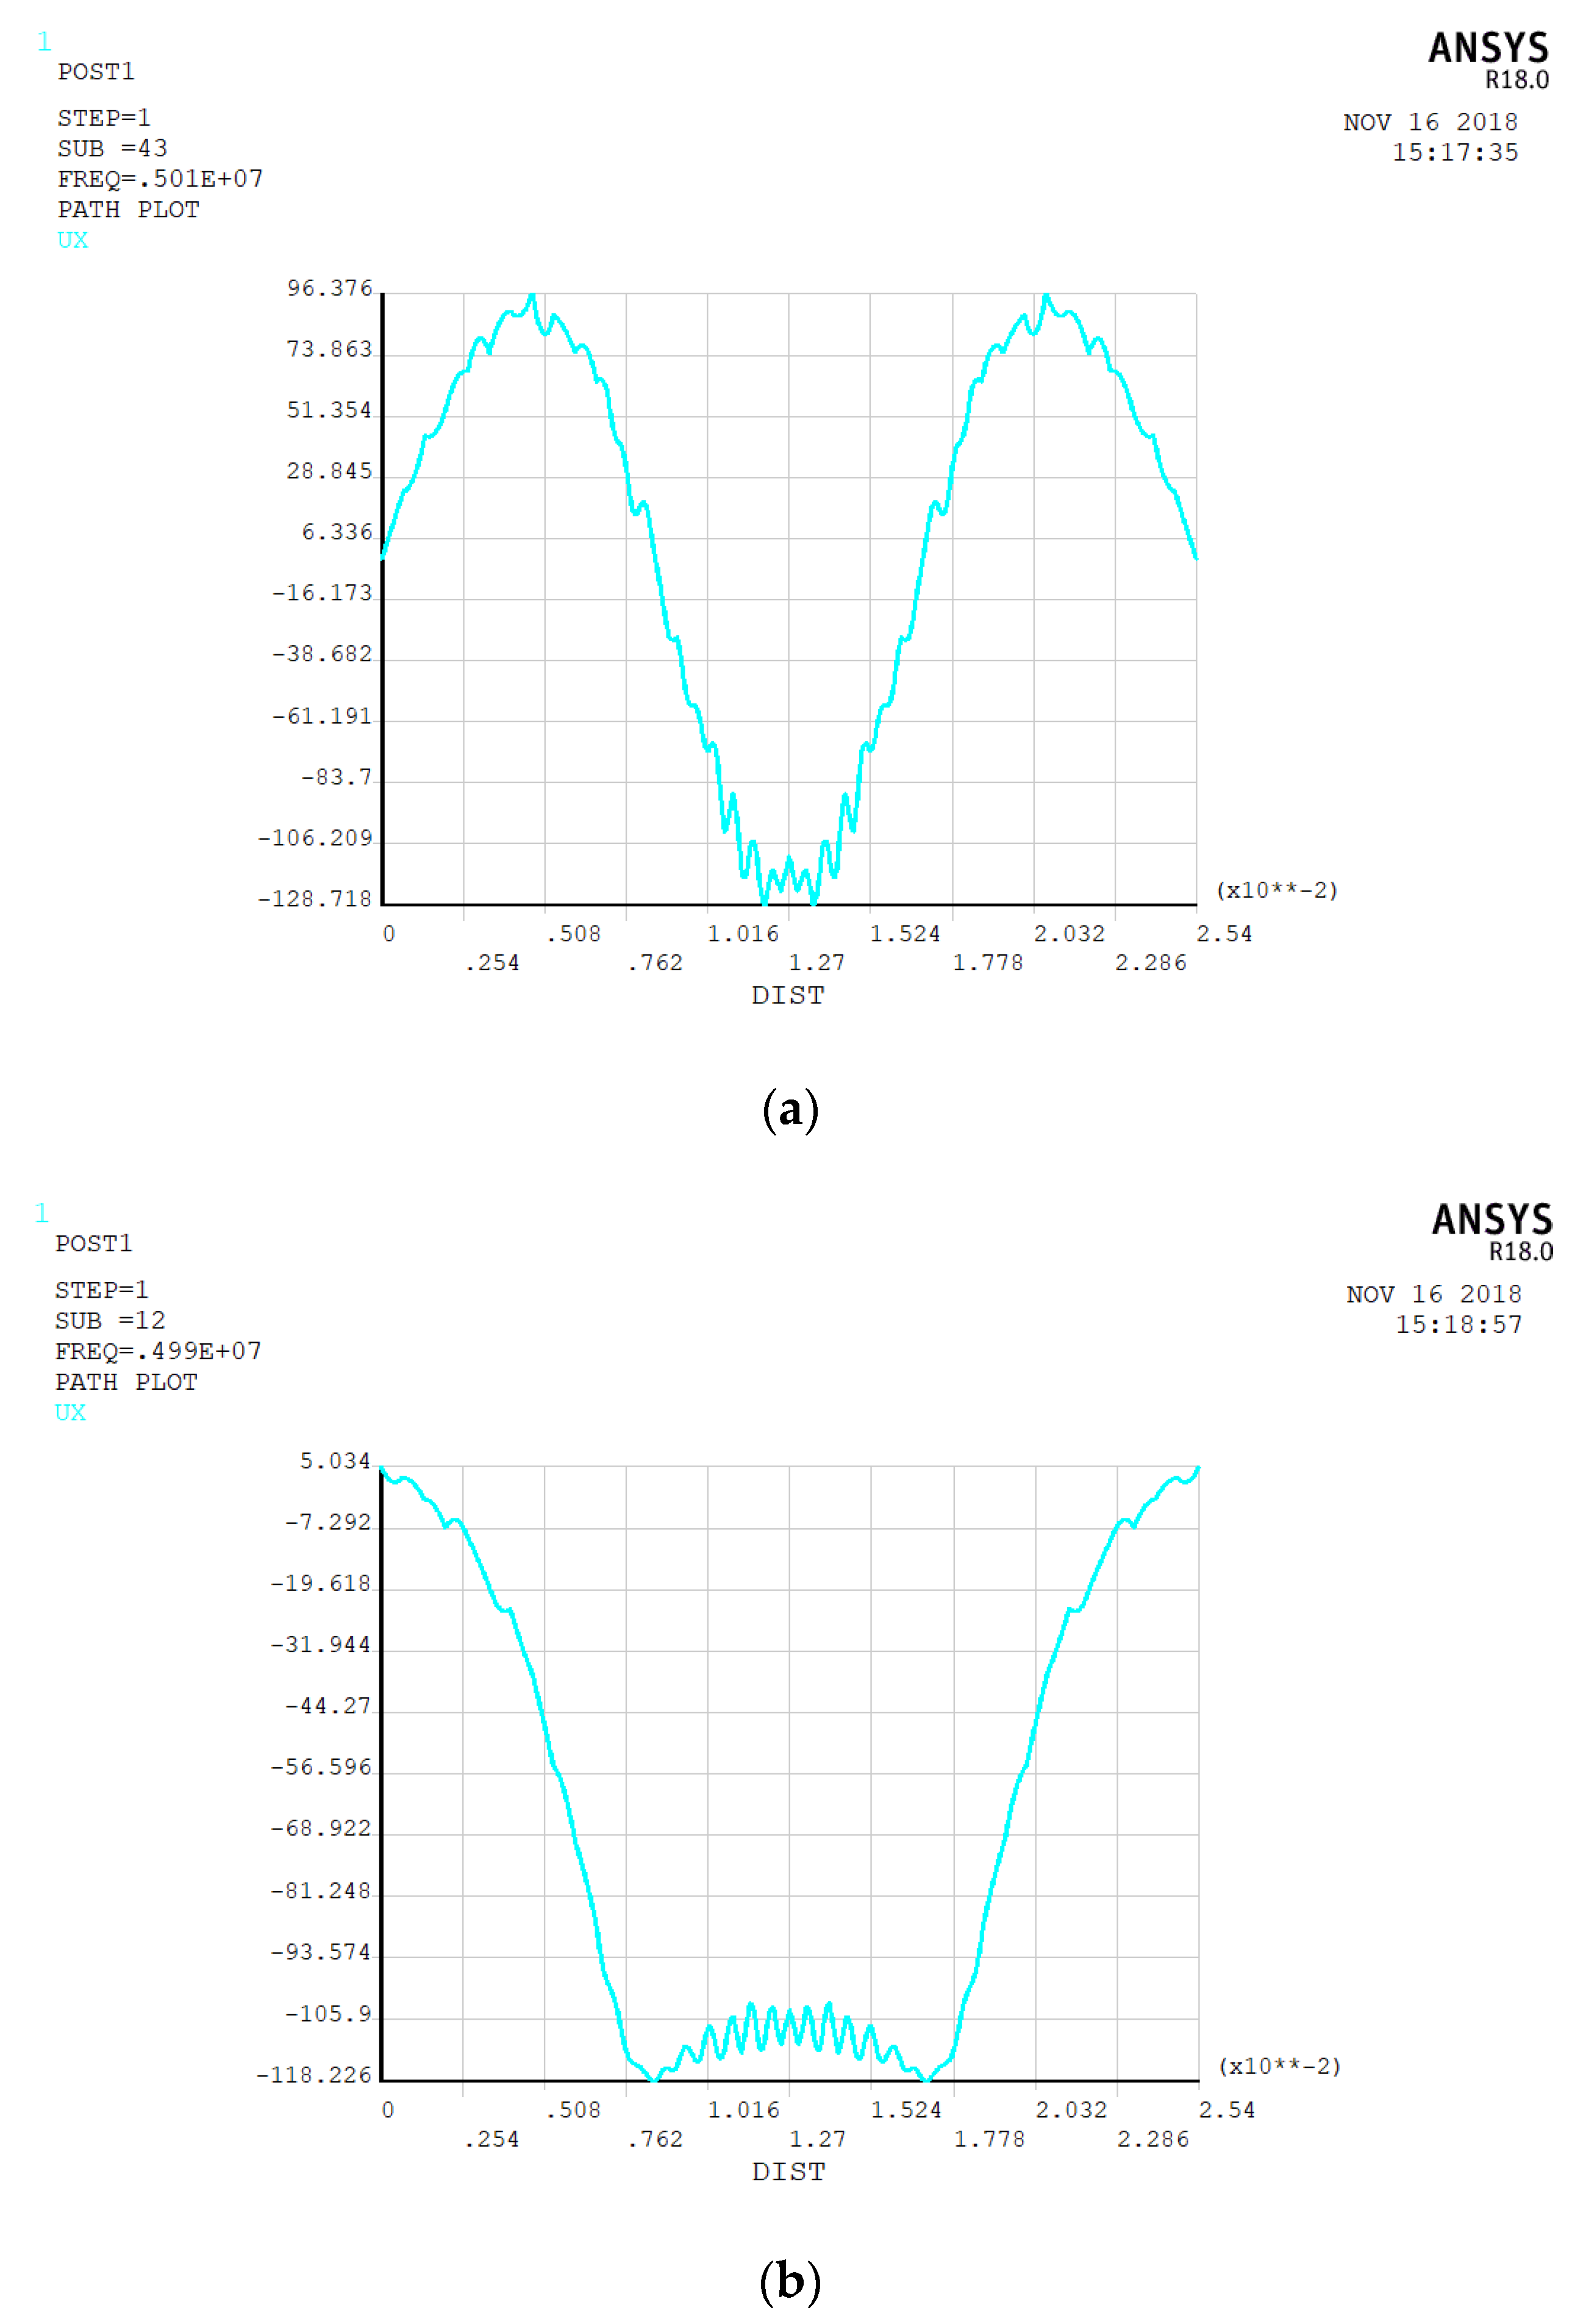
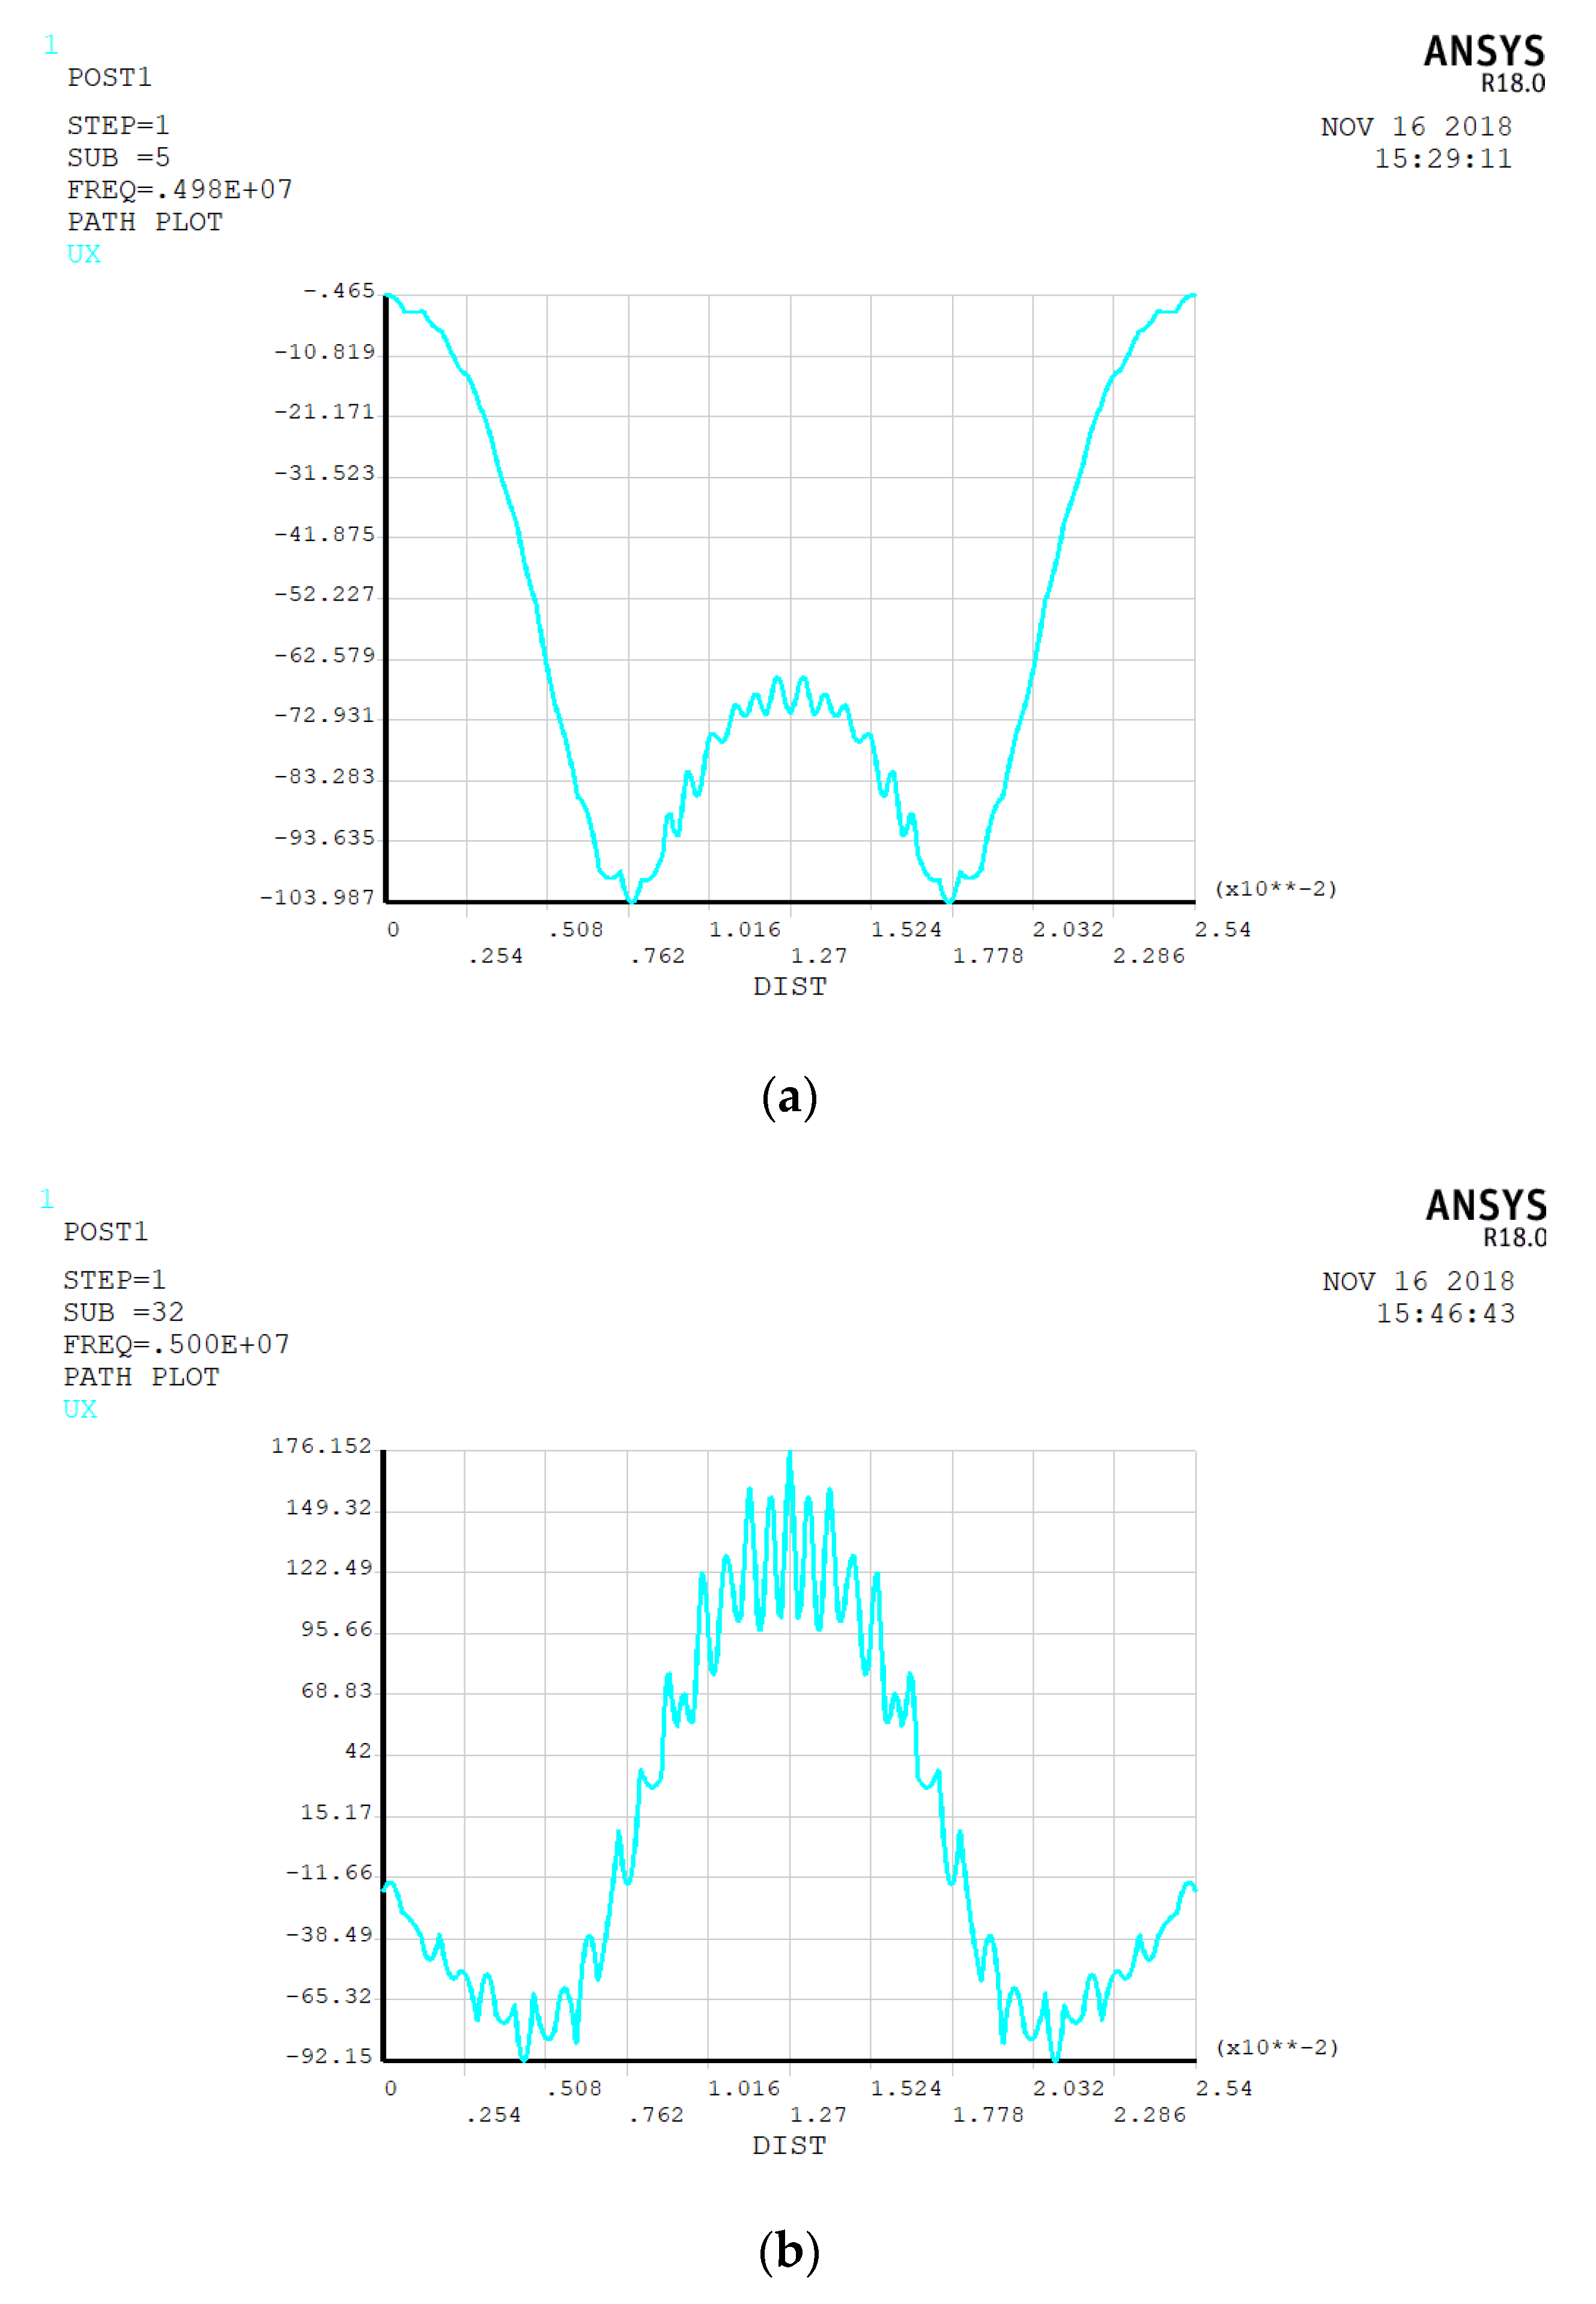
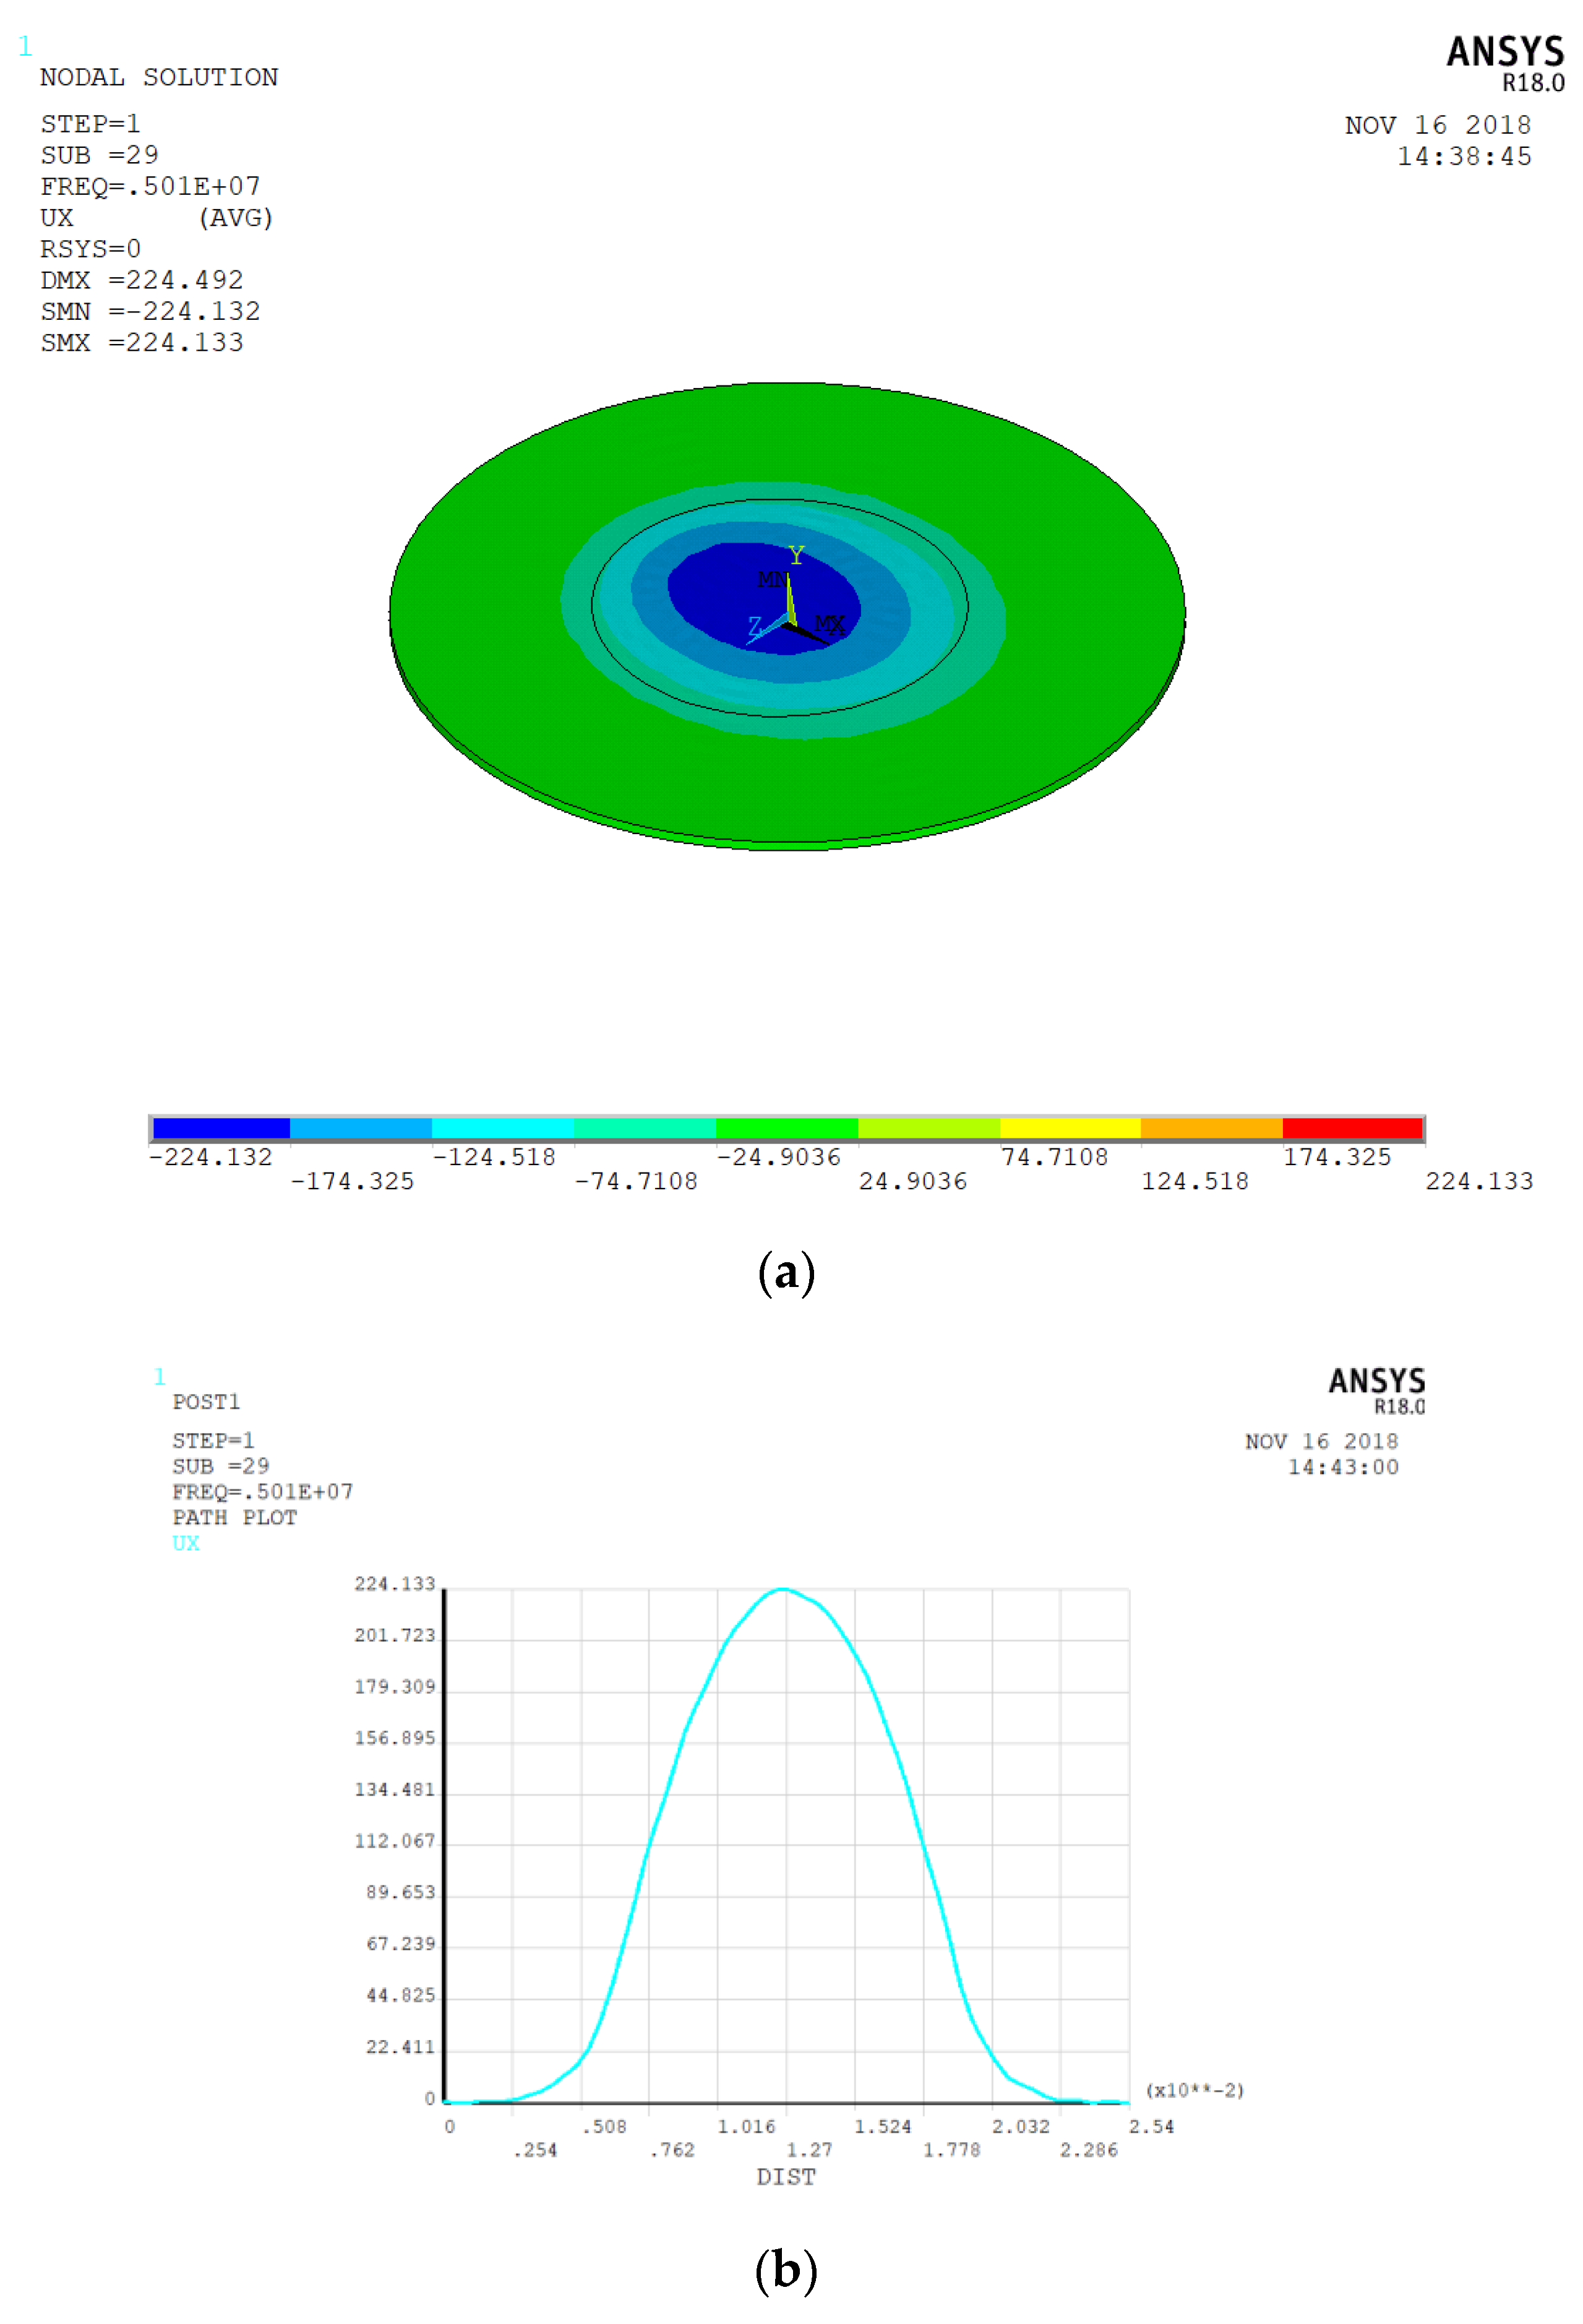
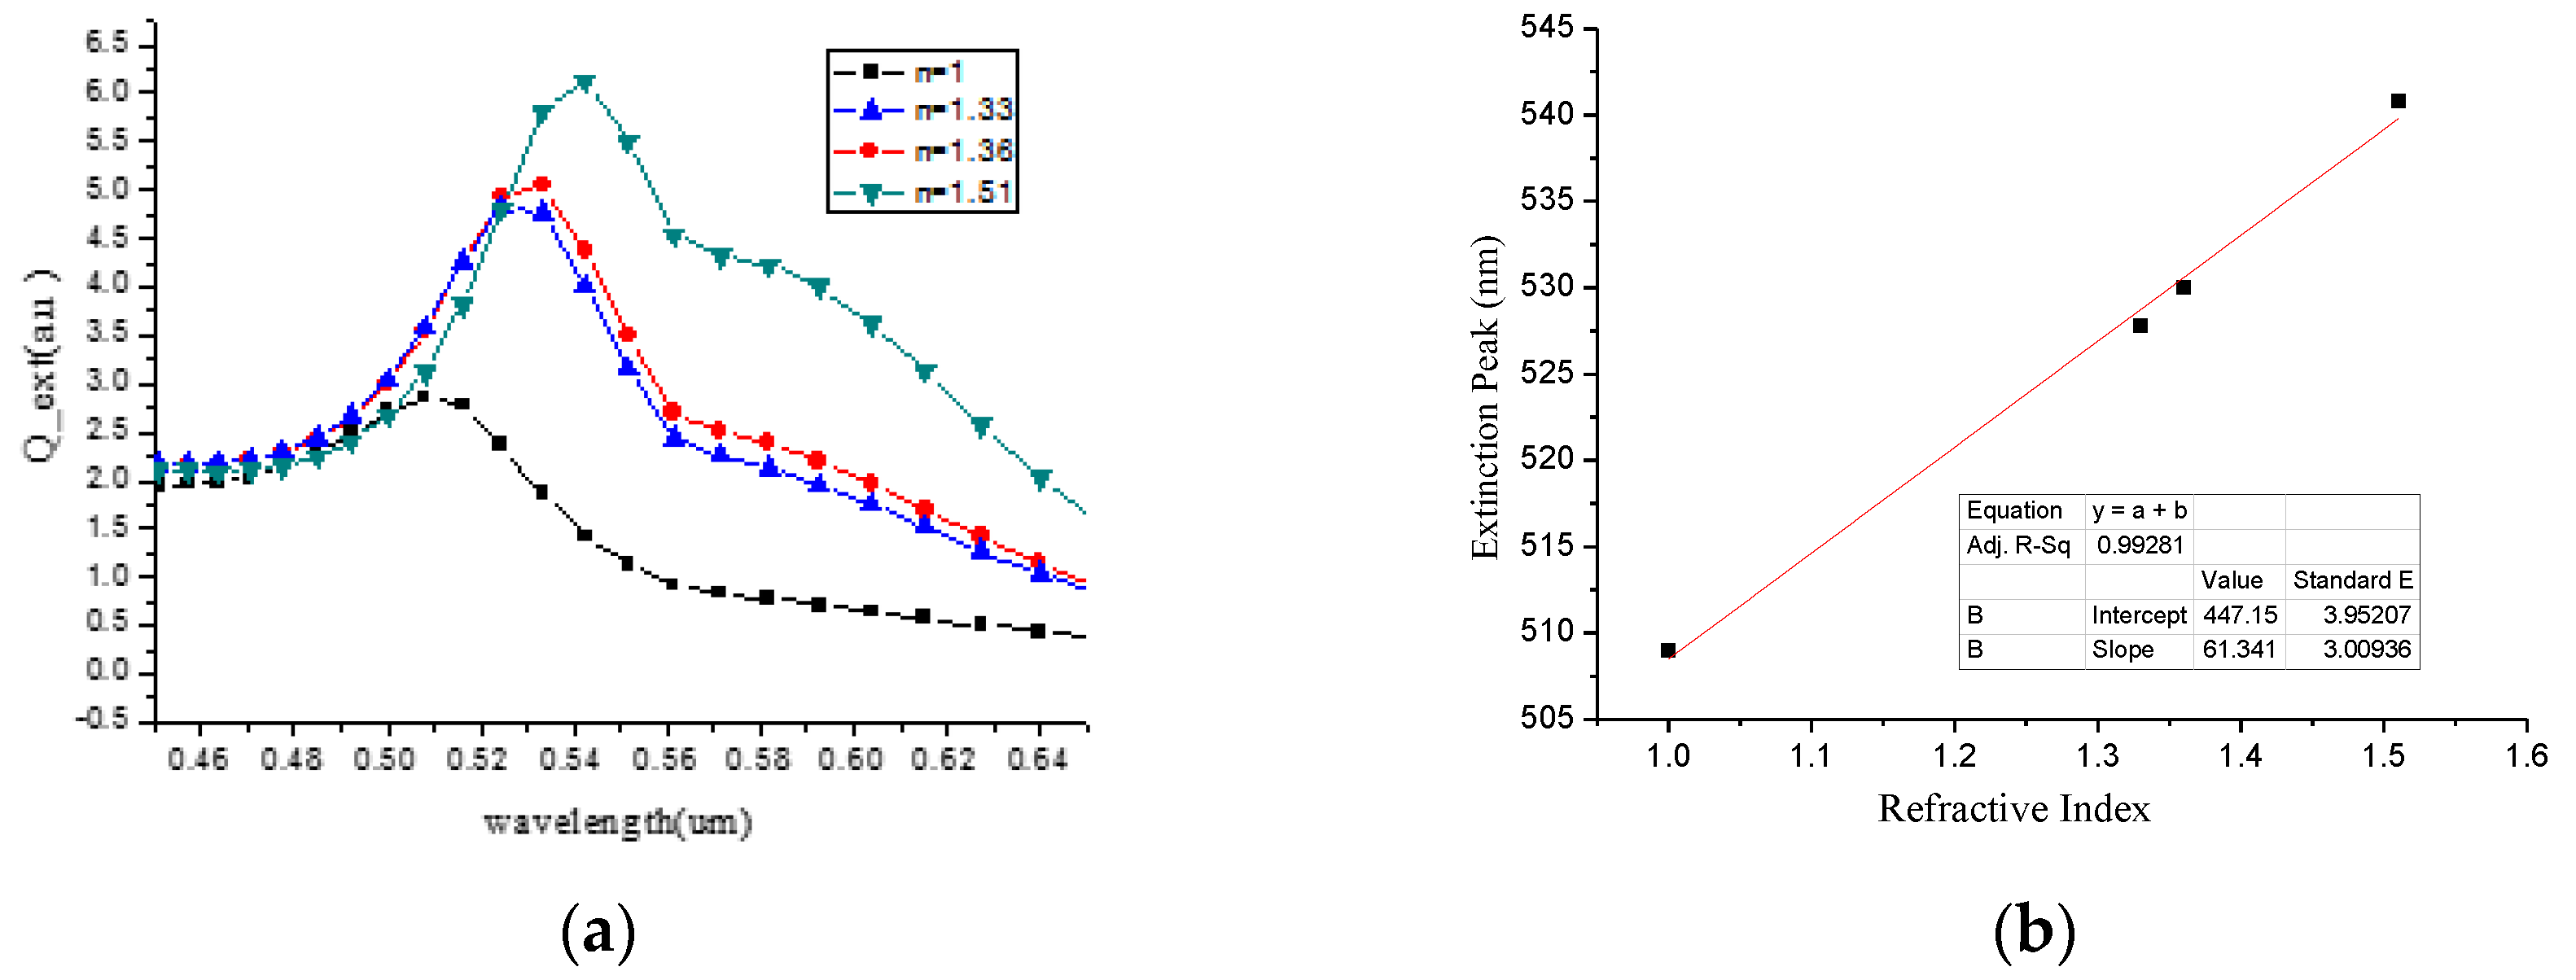
3.1. Electrode Size
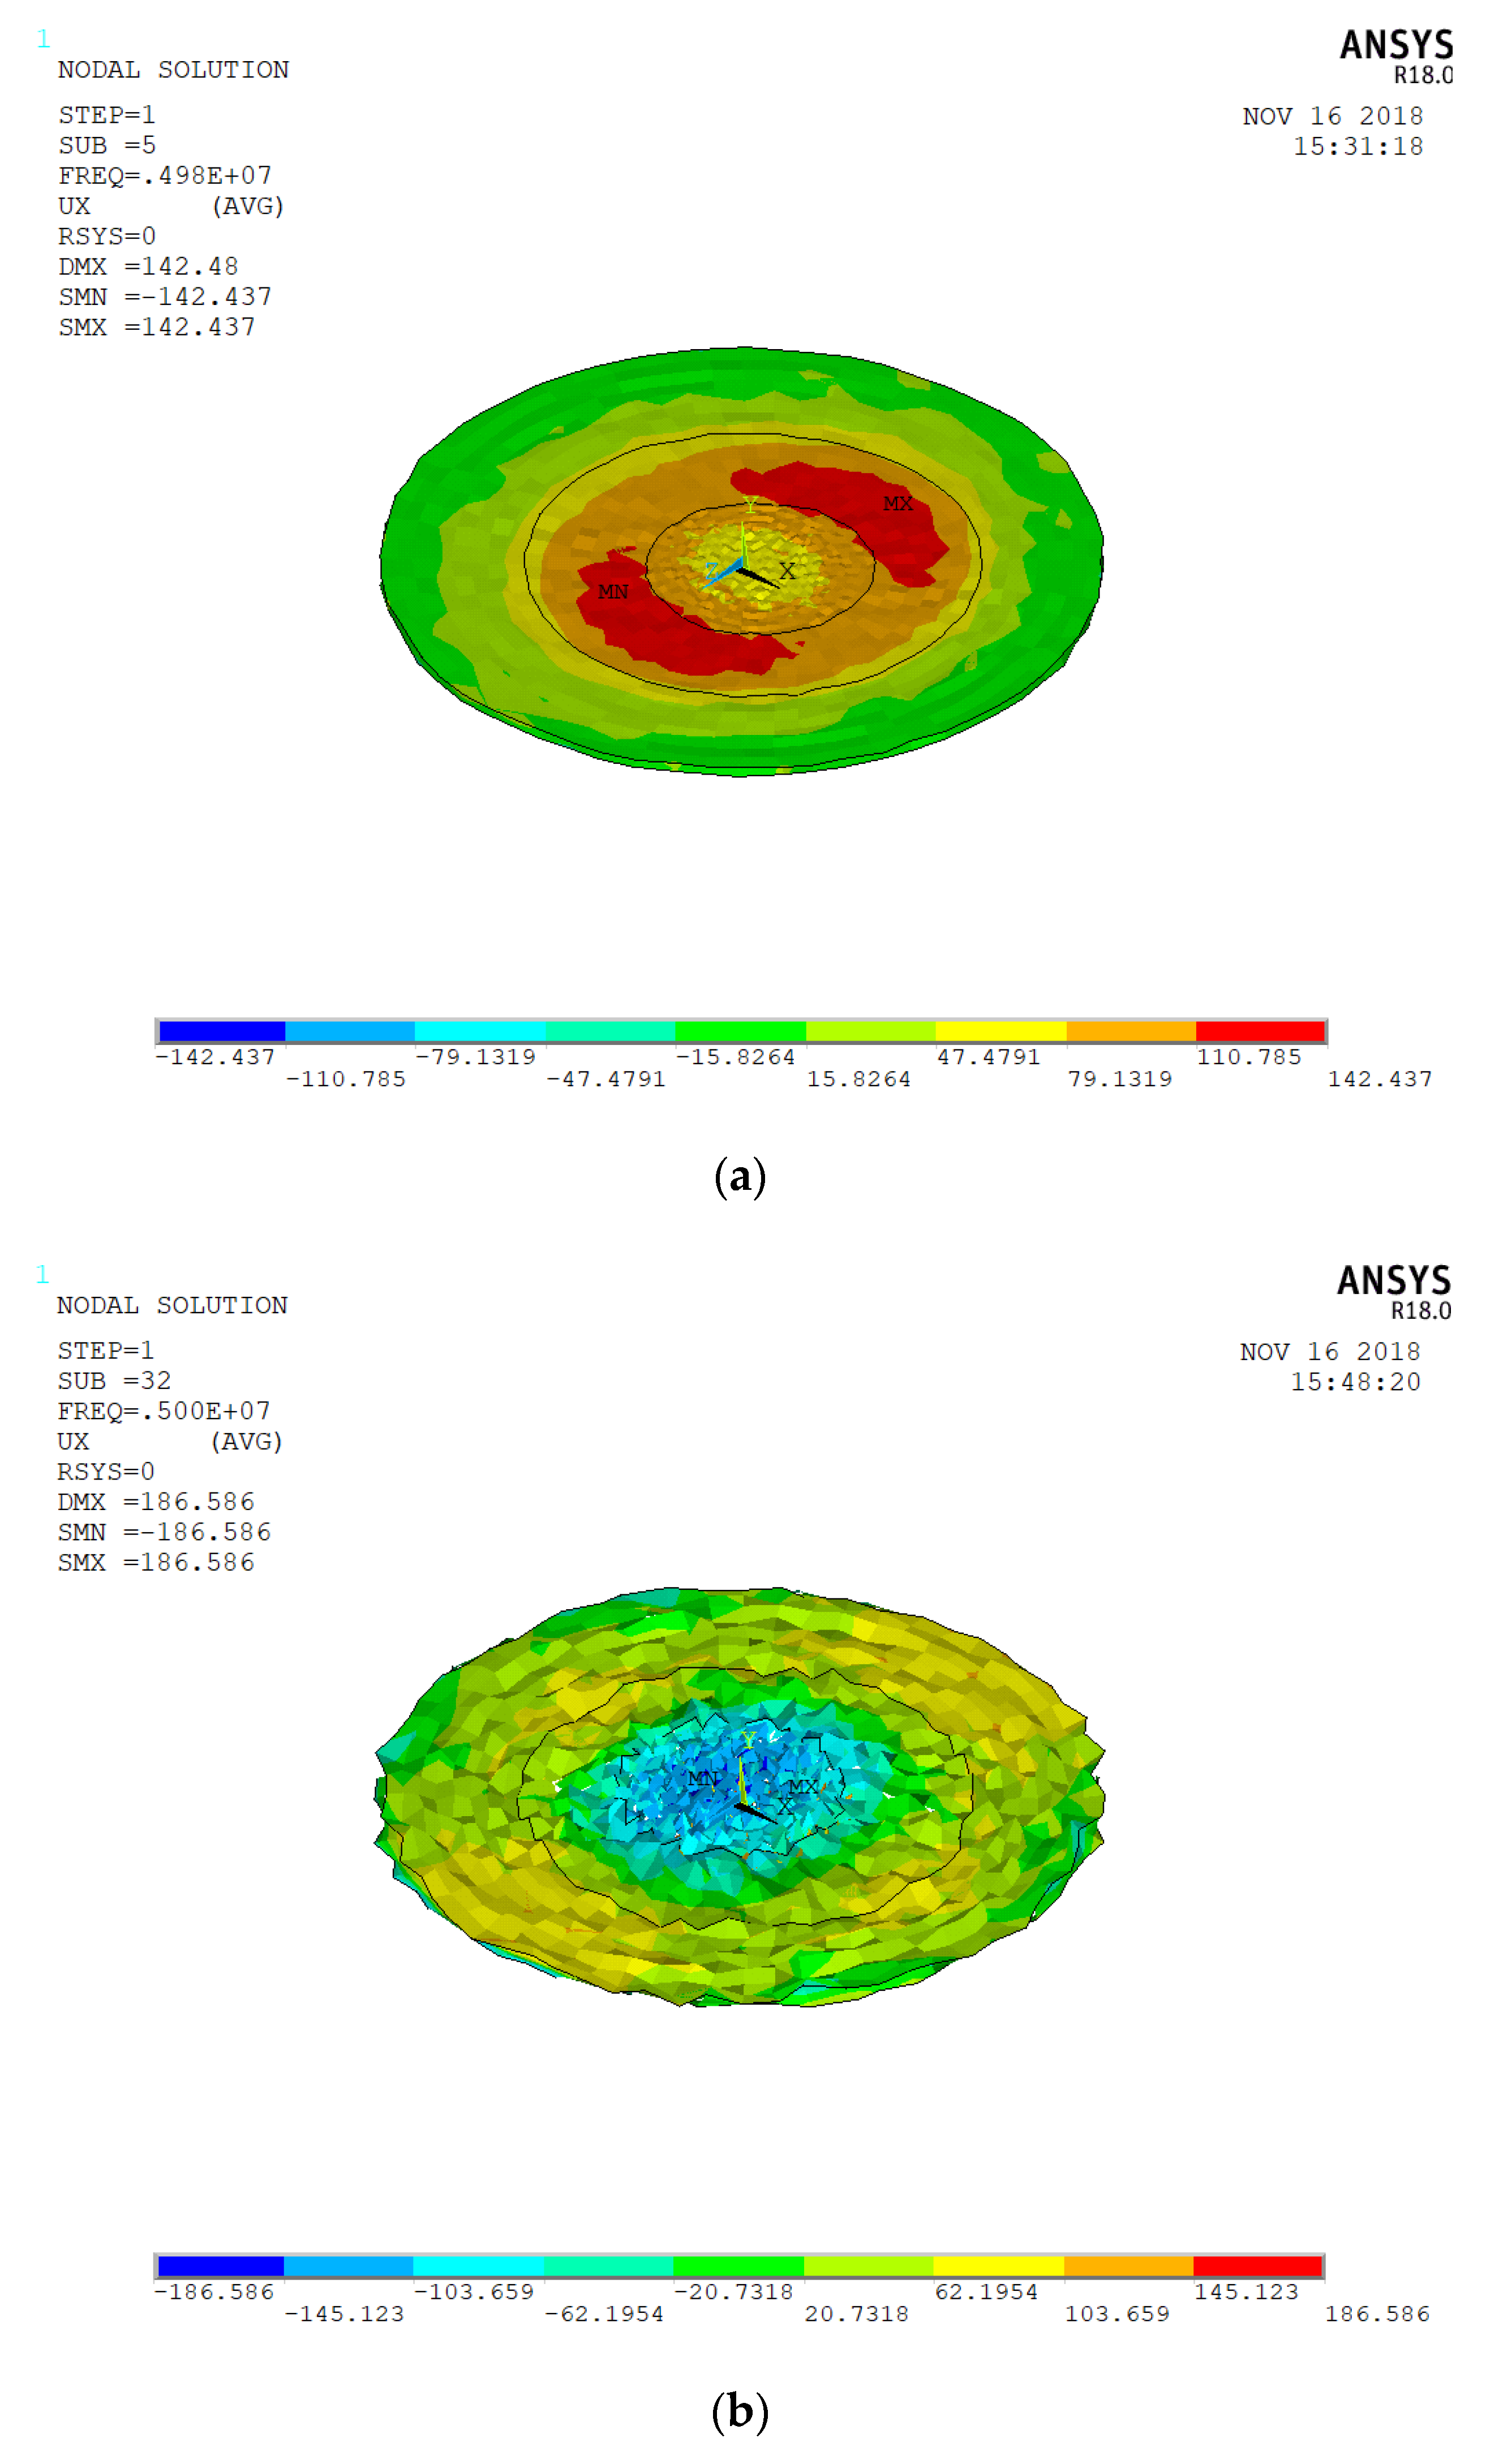
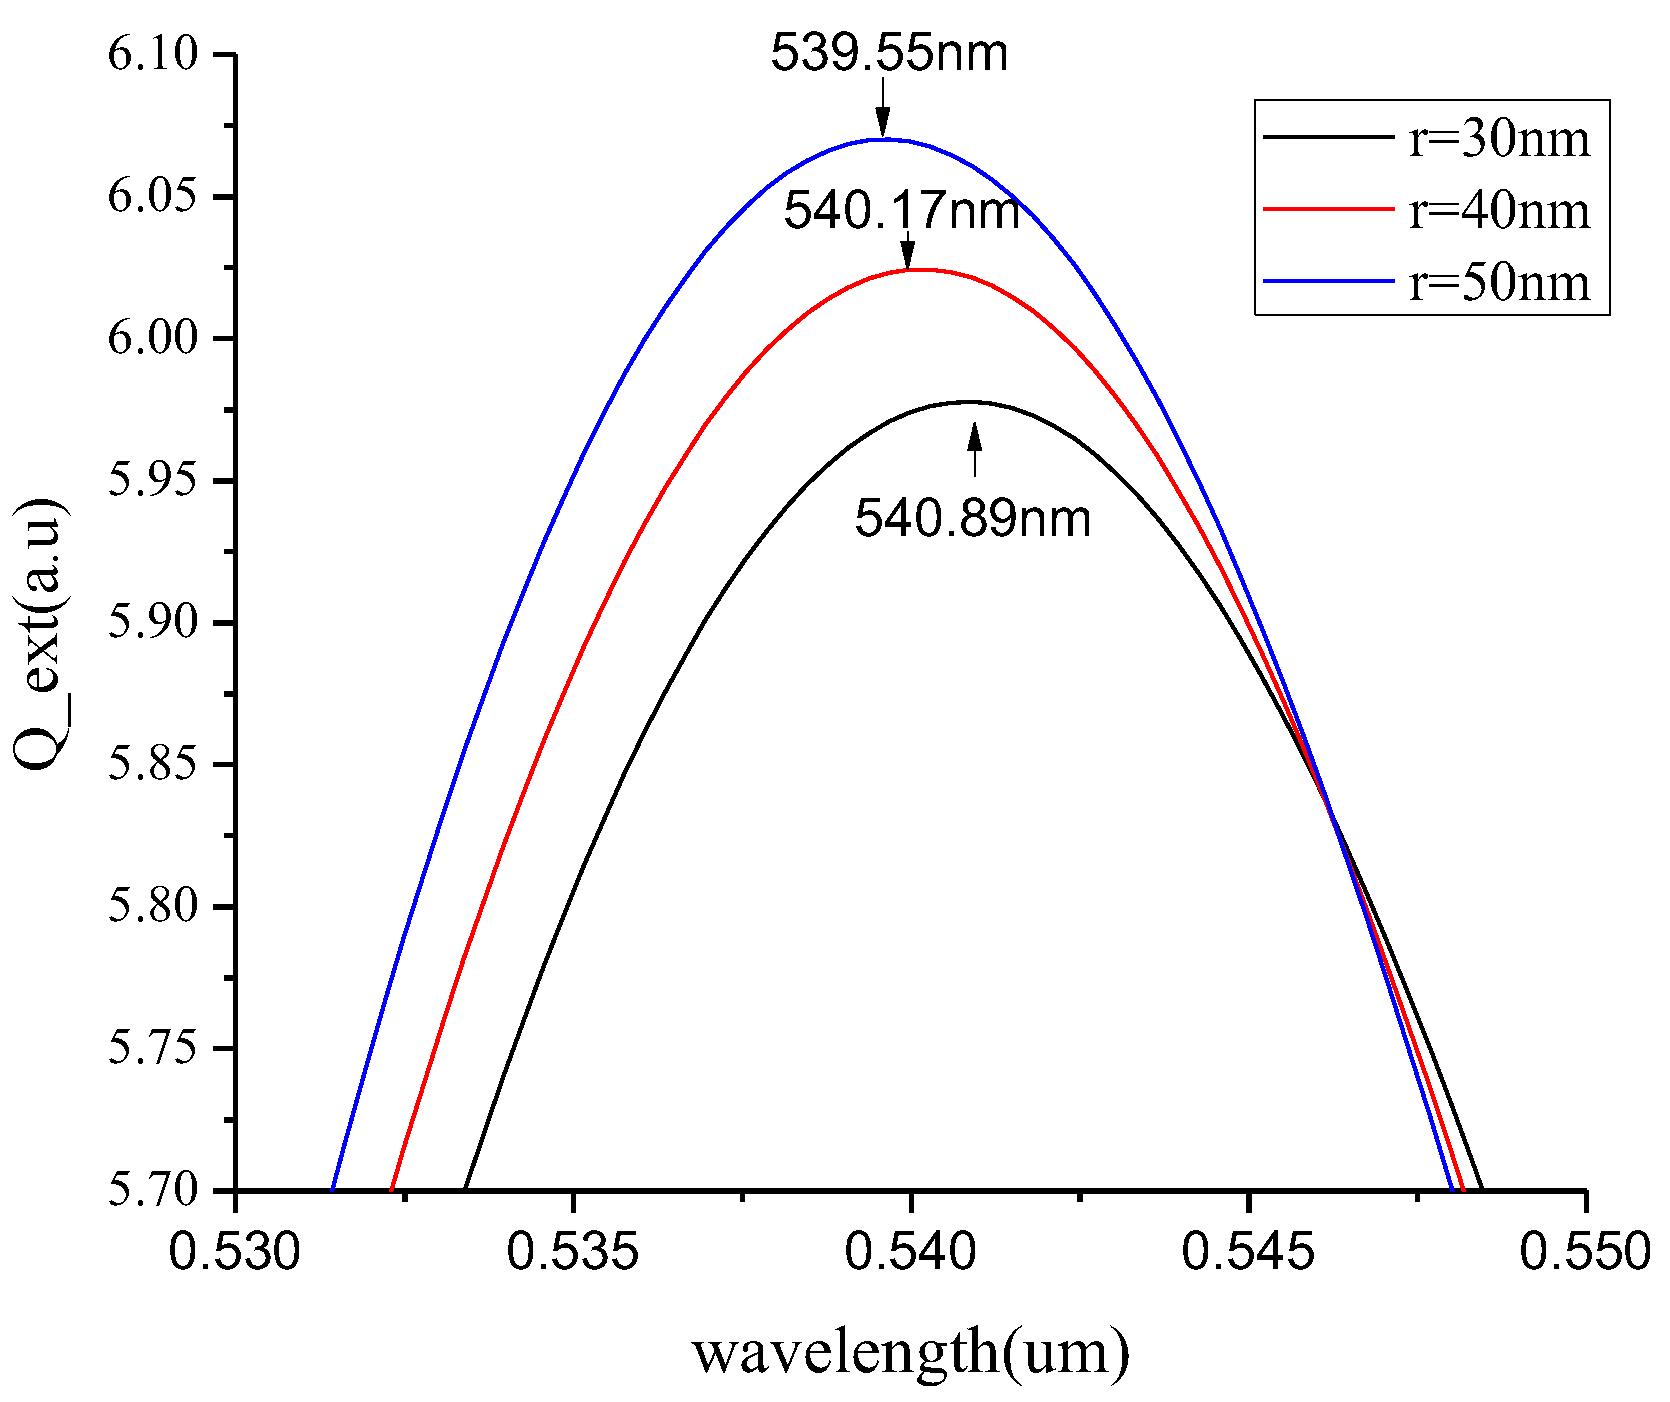
3.2. Spherical Nanoparticles
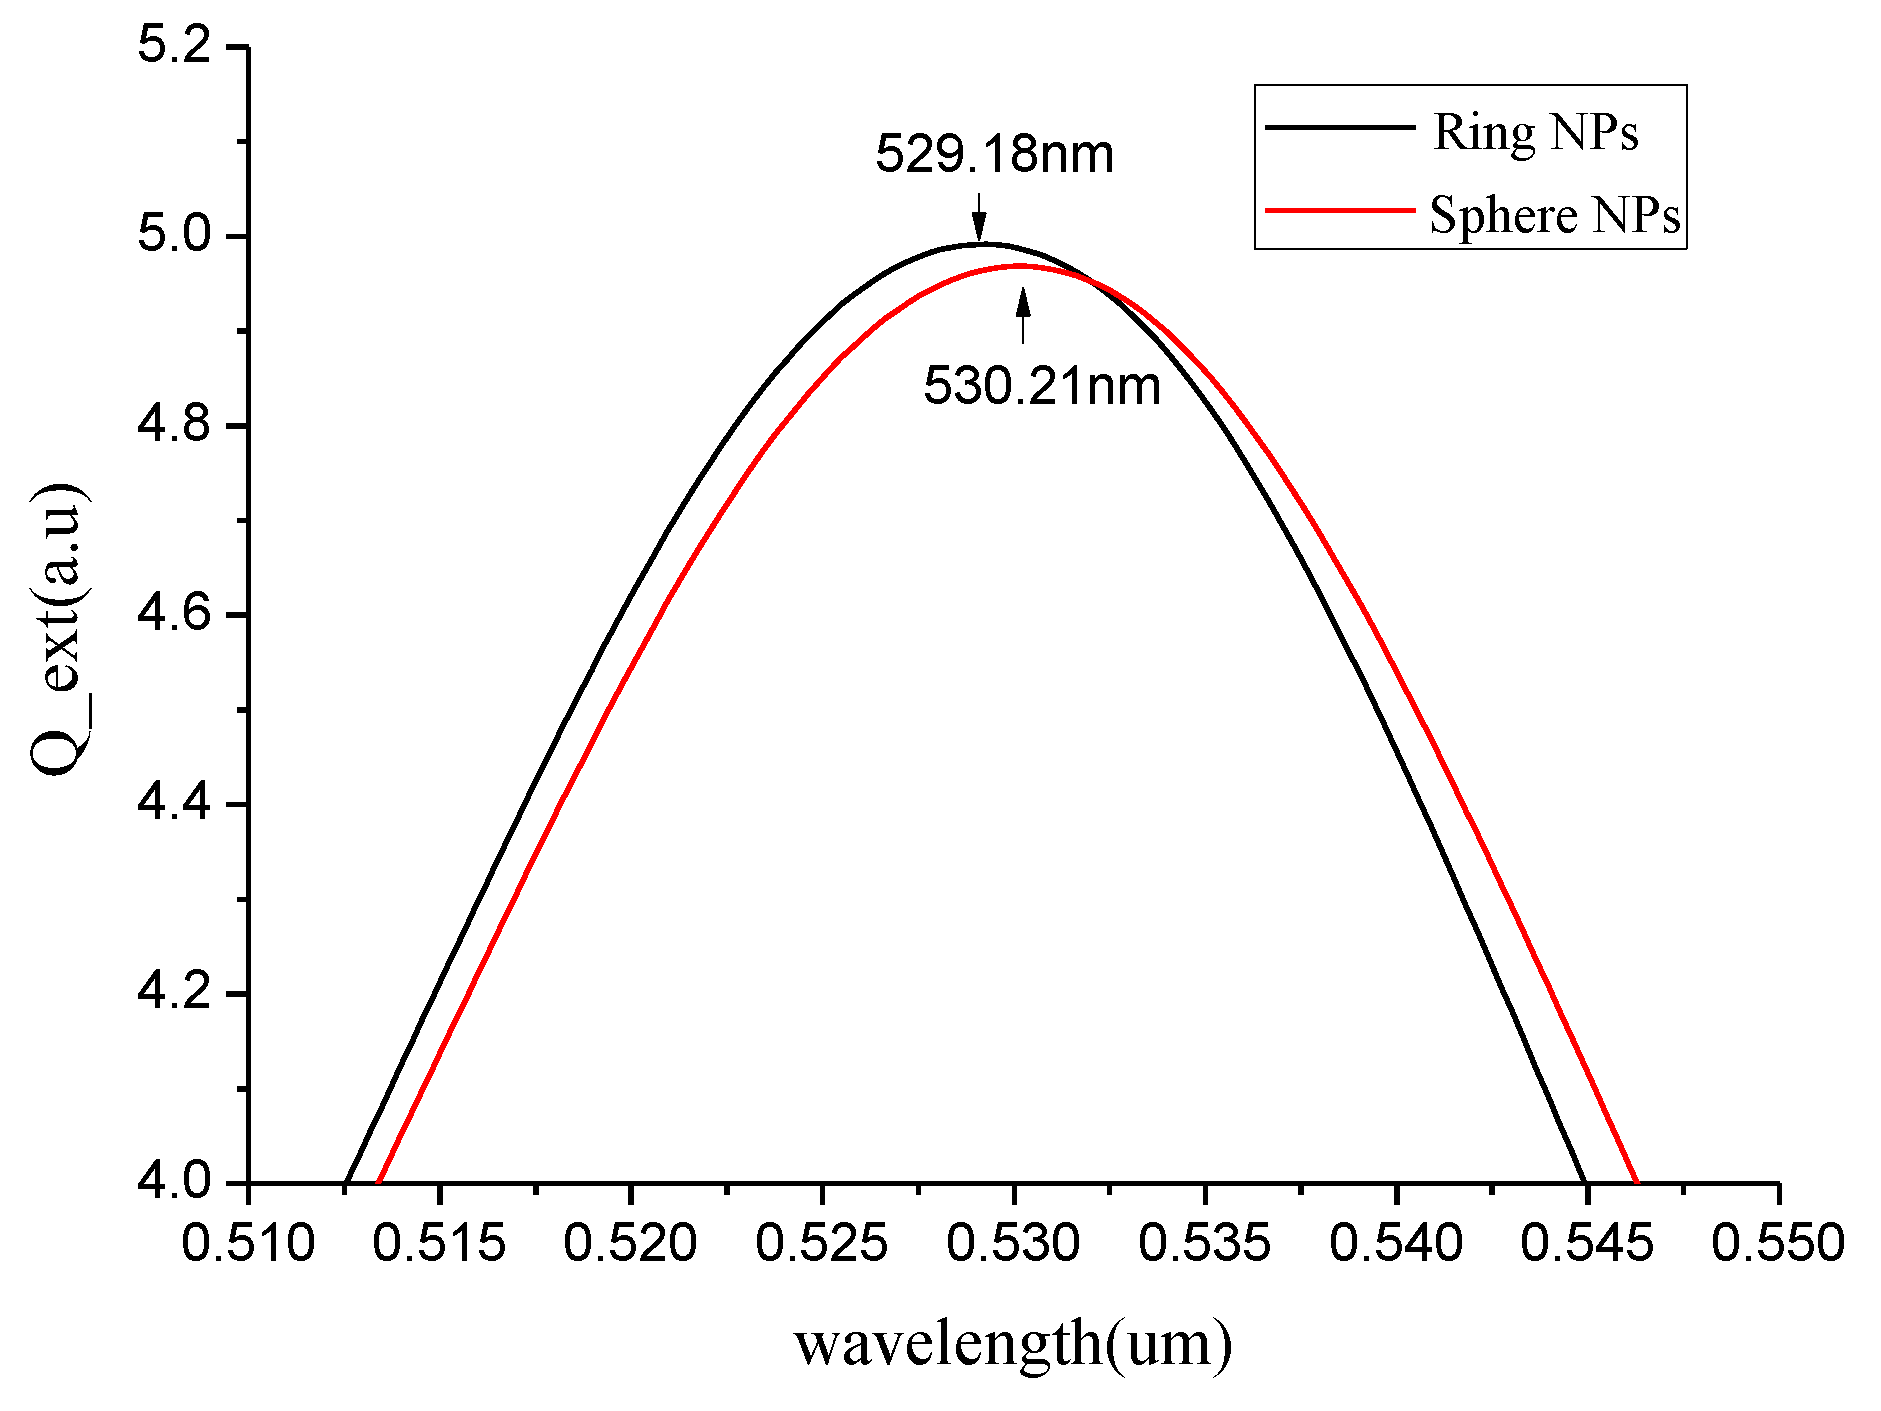
3.3. Effect of Spherical Nanoparticles on the Resonant Base Frequency of the Quartz Crystal ofGold Electrode
4. Results
5. Conclusions
Author Contributions
Acknowledgments
Conflicts of Interest
References
- Huang, X.; Bai, Q.; Hu, J.; Hou, D. A practical model of quartz crystal microbalance in actual applications. Sensors 2017, 17, 1785. [Google Scholar] [CrossRef] [PubMed]
- Mohammadnejad, S.; Noaparast, M.; Hosseini, S.; Aghazadeh, S.; Mousavinezhad, S.; Hosseini, F. Physical Methods and Flotation Practice in the Beneficiation of a Low Grade Tungsten-Bearing Scheelite Ore. Russ. J. Non-Ferrous Met. 2018, 59, 6–15. [Google Scholar] [CrossRef]
- Alassi, A.; Benammar, M.; Brett, D. Quartz Crystal Microbalance Electronic Interfacing Systems: A. Review. Sensors 2017, 17, 2799. [Google Scholar] [CrossRef] [PubMed]
- Lei, O.; Tian, W.; Ma, B. High-sensitivity QCM with multielectrode piezoelectric quartz crystal design. Int. J. Appl. Ceram. Technol. 2018, 15, 751–757. [Google Scholar] [CrossRef]
- Nomura, T.; Okuhara, M. Frequency shifts of piezoelectric quartz crystals immersed in organic liquids. Anal. Chim. Acta 1982, 142, 281–284. [Google Scholar] [CrossRef]
- Kananizadeh, N.; Rice, C.; Lee, J.; Rodenhausen, K.B.; Sekora, D.; Schubert, M.; Schubert, E.; Bartelt-Hunt, S.; Li, Y. Combined quartz crystal microbalance with dissipation (QCM-D) and generalized ellipsometry (GE) to characterize the deposition of titanium dioxide nanoparticles on model rough surfaces. J. Hazard. Mater. 2017, 322, 118–128. [Google Scholar] [CrossRef] [PubMed]
- Kojima, T. Surface Modification Enhanced Reflection Intensity of Quartz Crystal Microbalance Sensors upon Molecular Adsorption. Anal. Sci. 2018, 34, 363–368. [Google Scholar] [CrossRef] [PubMed]
- Huang, G.S.; Wang, M.T.; Hong, M.Y. A versatile QCM matrix system for online and high-throughput bio-sensing. Analyst 2006, 131, 382–387. [Google Scholar] [CrossRef] [PubMed]
- Etchenique, R.; Buhse, T. Anomalous behaviour of the quartz crystal microbalance in the presence of electrolytes. Analyst 2000, 125, 785–787. [Google Scholar] [CrossRef]
- Edvardsson, M.; Svedhem, S.; Wang, G.; Richter, R.; Rodahl, M.; Kasemo, B. QCM-D and reflectometry instrument: Applications to supported lipid structures and their biomolecular interactions. Anal. Chem. 2008, 81, 349–361. [Google Scholar] [CrossRef] [PubMed]
- Cao, Y.; Griffith, B.; Bhomkar, P.; Wishart, D.S.; McDermott, M.T. Functionalized gold nanoparticle-enhanced competitive assay for sensitive small-molecule metabolite detection using surface plasmon resonance. Analyst 2018, 143, 289–296. [Google Scholar] [CrossRef] [PubMed]
- Tang, D.; Li, Q.; Tang, J.; Su, B.; Chen, G. An enzyme-free quartz crystal microbalance biosensor for sensitive glucose detection in biological fluids based on glucose/dextran displacement approach. Anal. Chim. Acta 2011, 686, 144–149. [Google Scholar] [CrossRef] [PubMed]
- Lin, T.Y.; Hu, C.H.; Chou, T.C. Determination of albumin concentration by MIP-QCM sensor. Biosens. Bioelectron. 2004, 20, 75–81. [Google Scholar] [CrossRef] [PubMed]
- Uludağ, Y.; Tothill, I.E. Development of a sensitive detection method of cancer biomarkers in human serum (75%) using a quartz crystal microbalance sensor and nanoparticles amplification system. Talanta 2010, 82, 277–282. [Google Scholar] [CrossRef] [PubMed]
- Chen, J.C.; Sadhasivam, S.; Lin, F.H. Label free gravimetric detection of epidermal growth factor receptor by antibody immobilization on quartz crystal microbalance. Process Biochem. 2011, 46, 543–550. [Google Scholar] [CrossRef]
- Vashist, S.K.; Vashist, P. Recent advances in quartz crystal microbalance-based sensors. J. Sens. 2011. [Google Scholar] [CrossRef]
- Sepúlveda, B.; Angelomé, P.C.; Lechuga, L.M.; Liz-Marzán, L.M. LSPR-based nanobiosensors. Nano Today 2009, 4, 244–251. [Google Scholar] [CrossRef]
- Becker, B.; Cooper, M.A. A survey of the 2006–2009 quartz crystal microbalance biosensor literature. J. Mol. Recognit. 2011, 24, 754–787. [Google Scholar] [CrossRef] [PubMed]
- Hao, D.; Hu, C.; Grant, J.; Glidle, A.; Cumming, D.R. Hybrid localized surface plasmon resonance and quartz crystal microbalance sensor for label free biosensing. Biosens. Bioelectron. 2018, 100, 23–27. [Google Scholar] [CrossRef] [PubMed]
- Ferhan, A.R.; Jackman, J.A.; Cho, N.J. Integration of quartz crystal microbalance-dissipation and reflection-mode localized surface plasmon resonance sensors for biomacromolecular interaction analysis. Anal. Chem. 2016, 88, 12524–12531. [Google Scholar] [CrossRef] [PubMed]
- Ebarvia, B.S.; Ubando, I.E.; Sevilla III, F.B. Biomimetic piezoelectric quartz crystal sensor with chloramphenicol-imprinted polymer sensing layer. Talanta 2015, 144, 1260–1265. [Google Scholar] [CrossRef] [PubMed]
- Sauerbrey, G. Verwendung von Schwingquarzen zur Wägung dünner Schichten und zur Mikrowägung. Zeitschrift für physik. Zeitschrift für physik 1959, 155, 206–222. [Google Scholar] [CrossRef]
- Klosterman, L.; Riley, J.K.; Bettinger, C.J. Control of Heterogeneous Nucleation and Growth Kinetics of Dopamine-Melanin by Altering Substrate Chemistry. Langmuir 2015, 31, 3451–3458. [Google Scholar] [CrossRef] [PubMed]
- Yavas, O.; Svedendahl, M.; Dobosz, P.; Sanz, V.; Quidant, R. On-a-chip biosensing based on all-dielectric nanoresonators. Nano Lett. 2017, 17, 4421–4426. [Google Scholar] [CrossRef] [PubMed]
- Agrawal, A.; Kriegel, I.; Milliron, D.J. Shape-dependent field enhancement and plasmon resonance of oxide nanocrystals. J. Phys. Chem. C 2015, 119, 6227–6238. [Google Scholar] [CrossRef]
- Yan, Q.Q.; Qin, W.J.; Wang, C.; Song, P.F.; Ding, G.; Yang, L.Y.; Yin, S.G. Plasmon-enhanced polymer bulk heterojunction solar cells with solution-processable Ag nanoparticles. Optoelectron. Lett. 2011, 7, 410–414. [Google Scholar] [CrossRef]
- Kelly, K.L.; Coronado, E.; Zhao, L.L.; Schatz, G.C. The optical properties of metal nanoparticles: The influence of size, shape, and dielectric environment. J. Phys. Chem. B 2003, 107, 668–677. [Google Scholar] [CrossRef]
- Zhu, J.; Li, W.; Zhu, M.; Zhang, W.; Niu, W.; Liu, G. Influence of the pH value of a colloidal gold solution on the absorption spectra of an LSPR-assisted sensor. AIP Adv. 2014, 4, 031338. [Google Scholar] [CrossRef]
- Wang, T.; Zhang, J.; Xue, P.; Chen, H.; Ye, S.; Wang, S.; Yang, B. Nanotransfer printing of gold disk, ring and crescent arrays and their IR range optical properties. J. Mater. Chem. C 2014, 2, 2333–2340. [Google Scholar] [CrossRef]
- Luo, Y.; Xu, J.; Li, Y.; Gao, H.; Guo, J.; Shen, F.; Sun, C. A novel colorimetric aptasensor using cysteamine-stabilized gold nanoparticles as probe for rapid and specific detection of tetracycline in raw milk. Food Control 2015, 54, 7–15. [Google Scholar] [CrossRef]
- Oćwieja, M.; Maciejewska-Prończuk, J.; Adamczyk, Z.; Roman, M. Formation of positively charged gold nanoparticle monolayers on silica sensors. J. Colloid Interface Sci. 2017, 501, 192–201. [Google Scholar] [CrossRef] [PubMed]
- Maciejewska-Prończuk, J.; Oćwieja, M.; Adamczyk, Z.; Pomorska, A. Formation of gold nanoparticle bilayers on gold sensors. Colloids Surf. A Physicochem. Eng. Asp. 2019, 560, 393–401. [Google Scholar] [CrossRef]
- Zhu, J.; Li, X.; Zheng, W.; Wang, B.; Tian, Y. Improved localized surface plasmon resonance index sensitivity based on chemically-synthesized gold nanoparticles on Indium Tin Oxide surfaces. Nanotechnology 2018, 29, 055701. [Google Scholar] [CrossRef] [PubMed]
- Larsson, E.M.; Alegret, J.; Käll, M.; Sutherland, D.S. Sensing characteristics of NIR localized surface plasmon resonances in gold nanorings for application as ultrasensitive biosensors. Nano Lett. 2007, 7, 1256–1263. [Google Scholar] [CrossRef] [PubMed]
- Tsai, C.Y.; Lu, S.P.; Lin, J.W.; Lee, P.T. High sensitivity plasmonic index sensor using slablike gold nanoring arrays. Appl. Phys. Lett. 2011, 98, 153108. [Google Scholar] [CrossRef] [PubMed]
- Kumar, S.; Yoon, S.H.; Kim, G.H. Bridging the nanogap electrodes with gold nanoparticles using dielectrophoresis technique. Curr. Appl. Phys. 2009, 9, 101–103. [Google Scholar] [CrossRef]
- Choi, H.M.; Chang, J.Y.; Trinh, L.A.; Padilla, J.E.; Fraser, S.E.; Pierce, N.A. Programmable in situ amplification for multiplexed imaging of mRNA expression. Nat. Biotechnol. 2010, 28, 1208. [Google Scholar] [CrossRef] [PubMed]
- Zhu, J.; Huang, S.; Ye, J.Y.; Zhang, X.Q.; Liu, G.H. Design of a quartz crystal with transparent electrode used for both QCM-D and LSPR technology. Sens. Actuators A Phys. 2015, 229, 141–146. [Google Scholar] [CrossRef]
- Mu, H.; Lv, J.; Liu, C.; Sun, T.; Chu, P.K.; Zhang, J. Localized surface plasmon resonance properties of Ag nanorod arrays on graphene-coated Au substrate. Opt. Commun. 2017, 402, 216–220. [Google Scholar] [CrossRef]
- Lee, H.; Ro, G.; Kim, J.M.; Kim, Y. Discrete-dipole approximation for the optical properties with morphological changes of silver nanoprism and nanosphere via galvanic reaction. Mater. Lett. 2017, 209, 138–141. [Google Scholar] [CrossRef]
- Ren, Y.; Qi, H.; Chen, Q.; Wang, S.; Ruan, L. Localized surface plasmon resonance of nanotriangle dimers at different relative positions. J. Quant. Spectrosc. Radiat. Transf. 2017, 199, 45–51. [Google Scholar] [CrossRef]


| Surrounding Medium | n | ρ (kg/m3) | εr | f (Hz) | Δf (Hz) |
|---|---|---|---|---|---|
| Air | 1 | 1.29 | 1.00 | 4983940 | 0 |
| Water | 1.33 | 1000 | 78.30 | 4981470 | 2470 |
| Ethyl alcohol | 1.36 | 789 | 6.08 | 4977730 | 6210 |
| Benzene | 1.51 | 1880 | 2.27 | 4964690 | 19250 |
© 2019 by the authors. Licensee MDPI, Basel, Switzerland. This article is an open access article distributed under the terms and conditions of the Creative Commons Attribution (CC BY) license (http://creativecommons.org/licenses/by/4.0/).
Share and Cite
Ma, C.; Zhu, J.; Li, X.; Zheng, W. Design of a Dual-Technology Fusion Sensor Chip with a Ring Electrode for Biosensing Application. Micromachines 2019, 10, 153. https://doi.org/10.3390/mi10020153
Ma C, Zhu J, Li X, Zheng W. Design of a Dual-Technology Fusion Sensor Chip with a Ring Electrode for Biosensing Application. Micromachines. 2019; 10(2):153. https://doi.org/10.3390/mi10020153
Chicago/Turabian StyleMa, Cheng, Jin Zhu, Xiaolong Li, and Wei Zheng. 2019. "Design of a Dual-Technology Fusion Sensor Chip with a Ring Electrode for Biosensing Application" Micromachines 10, no. 2: 153. https://doi.org/10.3390/mi10020153
APA StyleMa, C., Zhu, J., Li, X., & Zheng, W. (2019). Design of a Dual-Technology Fusion Sensor Chip with a Ring Electrode for Biosensing Application. Micromachines, 10(2), 153. https://doi.org/10.3390/mi10020153