Communication

Bacterial Concentration Detection using a PCB-based Contactless Conductivity Sensor

1
State Key Laboratory of Urban Water Resource and Environment, Harbin Institute of Technology, Harbin 150090, China
2
Research Institute for Electronic Science, Hokkaido University, Sapporo 001-0021, Japan
3
Department of Applied Chemistry & Institute of Molecular Science, National Chiao Tung University, Hsinchu 30010, Taiwan
*
Author to whom correspondence should be addressed.
Micromachines 2019, 10(1), 55; https://doi.org/10.3390/mi10010055
Submission received: 3 December 2018 / Revised: 10 January 2019 / Accepted: 10 January 2019 / Published: 14 January 2019
(This article belongs to the Special Issue Microfluidics for Cells and Other Organisms)

Abstract

:
Capacitively coupled contactless conductivity detection (C4D) is an improved approach to avoid the problems of labor-intensive, time-consuming and insufficient accuracy of plate count as well as the high-cost apparatus of flow cytometry (FCM) in bacterial counting. This article describes a novel electrode-integrated printed-circuit-board (PCB)-based C4D device, which supports the simple and safe exchange of capillaries and improves the sensitivity and repeatability of the contactless detection. Furthermore, no syringe pump is needed in the detection, it reduces the system size, and, more importantly, avoids the effect on the bacteria due to high pressure. The recovered bacteria after C4D detection at excitation of 25 Vpp and 60–120 kHz were analyzed by flow cytometry, and a survival rate higher than 96% was given. It was verified that C4D detection did not influence the bacterial viability. Moreover, bacteria concentrations from 106 cells/mL to 108 cells/mL were measured in a linear range, and relative standard deviation (RSD) is below 0.2%. In addition, the effects on bacteria and C4D from background solutions were discussed. In contrast to common methods used in most laboratories, this method may provide a simple solution to in situ detection of bacterial cultures.

1. Introduction

Over the past decades, bacteria have been widely used in many fields, including pharmacy [1], chemistry [2], biology [3], environmental science [4], and fermentation [5]. Bacterial counting, as one of the most important indicators, is used to determine the concentration of bacterial culture, to monitor the water quality, to assess pollution level, and to diagnose patients. Although there are many techniques developed to count bacteria, such as plate count and optical density (OD), these techniques are mostly time-consuming, labor-intensive, and unable to provide sufficient accuracy [6]. Some methods based on fluorescent dyes, for example, fluorescence analysis, and flow cytometry (FCM), are advanced in rapidness, technical simplicity, and efficiency, even in distinguishing different physiological states of bacteria at single cell level [7,8,9]. Nevertheless, fluorescent quenching and high cost per test [10] are still limiting it from being widely used. Biosensors have been paid more and more attention with the development of micro electro mechanical system (MEMS) [11], which provide a portable and real-time platform [12,13]. In recent years, by making use of MEMS point-of-care testing, technologies have become an effective and rapid method to detect bacteria through analyzing the image [14,15,16,17,18]. Photoelectrochemical and electrochemical biosensors have been widely used for bioanalytical proposes [19], detecting bacterial strains [20], capturing bacteria [21], and monitoring activity of bacterial fermentation [22,23]. Electrochemical detection has a rapid response speed [24] and has the potential to be a useful tool in low-concentration applications [25,26]. However, this method cannot identify those microbes that rely on specific antibodies [27,28,29,30]. In addition, electrodes used in electrochemical detection are easily contaminated by the sample, which influences the results. Surface Enhanced Raman Scattering (SERS) avoid these shortcomings, and it can detect microorganisms without specific antibodies [31,32,33]; however, the weak signal is still a problem to be solved.
Capacitively coupled contactless conductivity detection (C4D), by analyzing and testing the conductivity change of sample [34], could simply and sensitively detect metal cations, amino acids, and organic ions in beer, wine, milk, potable water, and juice [35,36,37,38]. The electrodes of C4D contain three electrodes, the excitation electrode to which AC signal is applied, the shield electrode, and the pick-up electrode, which measured the detection signal. Two metal needles, with capillary passing through, were used as excitation electrode and pick-up electrode in early C4D devices; at the same time, to improve the sensitivity of detection, silver conductive adhesive was used to narrow the gap between capillary and needle. To improve the signal-to-noise ratio (S/N) and integration, a printed-circuit-board (PCB) based C4D with shorter electrical connection of the electrodes to the current/voltage operational amplifier was introduced to connect capillaries and microfluidic chips [39,40,41]. Silva et al. integrated the circuit and the wire-wrapped electrodes on a 18 × 18 mm2 PCB, and optimized amplitude and frequency for each column diameter and electrophoretic buffer [42,43]. Jaanus et al. also integrated electrodes on the PCB and improve detection sensitivity by using an idle capillary for compensation [44].
The application of C4D was mainly for detecting ions, while there are still some researchers focusing on counting cell by it. Emaminejad et al. [45] was the first to count cells from sheet whole blood based on contactless conductivity. Chen et al. [46] succeeded in counting 9-μm MCF-7 and 15-μm HCM cancer cells on a C4D integrated chip. They both achieved label-free counting. Although electrical impedance spectroscopy has been used for detection of bacteria counting, there have been few studies focusing on the bacterial counting by C4D [47]. This is because bacteria are smaller organisms with single cell volume in the range of 0.1–1 µm3/cell, which is only one tenth of a cell. To detect bacteria by C4D is much more difficulty comparing to the cells.
In this paper, we developed a type of novel C4D device with both electrodes and amplifiers integrated on the PCB. Copper via holes of PCB with 400-µm inner diameter were used as C4D electrodes through which a 360-μm OD capillary passes exactly. The fabrication of the via holes on PCB could provide the inner-diameter (ID) of 300-μm minimum with the tolerance less than 50 μm, which confirms better accuracy and repeatability. The bacterial suspension was dragged into the capillary manually by a syringe, without a syringe pump. The detection is very fast because of the concentration detection mechanisms instead of peak counting. Although the proposed method is not able to distinguish different populations of bacteria, this is a simple, inexpensive, rapid, contactless, and label-free method that enables bacterial counting without damage to the cells.

2. Materials and Methods

2.1. Materials and Reagents

Standard broth was used as a bacterial growth medium, and phosphate-buffered saline (PBS, pH = 7.4, NaCl 8.0 g/L, KCl 0.2 g/L, Na2HPO4 1.42 g/L, KH2PO4 0.24 g/L) was prepared in the laboratory. SYBR Green I (Invitrogen, Eugene, OR, USA) was diluted in dimethylsulfoxide (DMSO) to a ratio of 1:100 and then stored at −20 °C prior to use. Propidium iodide (PI) and albumin from bovine serum (BSA) was from Sigma (shanghai, China) and was stored at 4 °C. All samples were incubated in 1 mg/mL PI for 15 min in the dark before flow cytometry (BD, Becton, Dickinson and Company, Franklin Lakes, NJ, USA) measurement. Glutaraldehyde, paraformaldehyde, ethyl alcohol, and isoamyl acetate were from TCI (Tokyo, Japan). All dilutions were carried out in deionized water from a Millipore system.

2.2. Bacterial Culture and Sample Preparation

Escherichia coli (CGMCC 1.2385, China General Microbiological Culture Collection Center, Beijing, China) was cultured in the broth medium at 37 °C for 17 h in an incubator to achieve 107 cells/mL. The bacteria were then centrifuged at 4000 rpm for 5 min to remove the broth medium and were re-suspended in PBS followed by centrifuging again. Prior to the experiment, the capillary was flushed with 20 mg/L BSA solution to avoid the non-specific cell adhesion to the surface. To ensure that the bacteria was successfully injected into the capillary, which passed through the detection cell (Figure 1A), a concentration of 1.0 × 10⁷ cells/mL sample was stained by SYBR Green I and was observed under the microscope with a charge-coupled device (CCD) camera (IX-73x microscope and DP80 camera, Olympus, Japan). The polyimide coating of the capillary was peeled off to eliminate fluorescent interference before observation. It can be seen clearly that the stained bacteria with green fluorescence pass through, and there was no aggregation found in the capillary (Figure 1B).

2.3. E.coli Preparation for SEM

Moreover, E. coli was characterized by SEM (Figure 1D). It shows that the E. coli is approximately 2–3 μm long and 0.5 μm wide. E. coli preparation for SEM observation includes the flowing steps. After incubation in nutrient broth for 17 h at 37 °C, E. coli was washed by PBS three times to remove the broth and then soaked in 4% glutaraldehyde for 2 h, immersed in 3% paraformaldehyde for 1 h, successively dehydrated in 30%, 50%, 75%, and 80% ethyl alcohol for 10 min and in 95% for 20 min, stored in isoamyl acetate for 30 min, and dried out overnight. The samples should be washed by PBS three times in each step and deposited onto a clean silicon wafer.

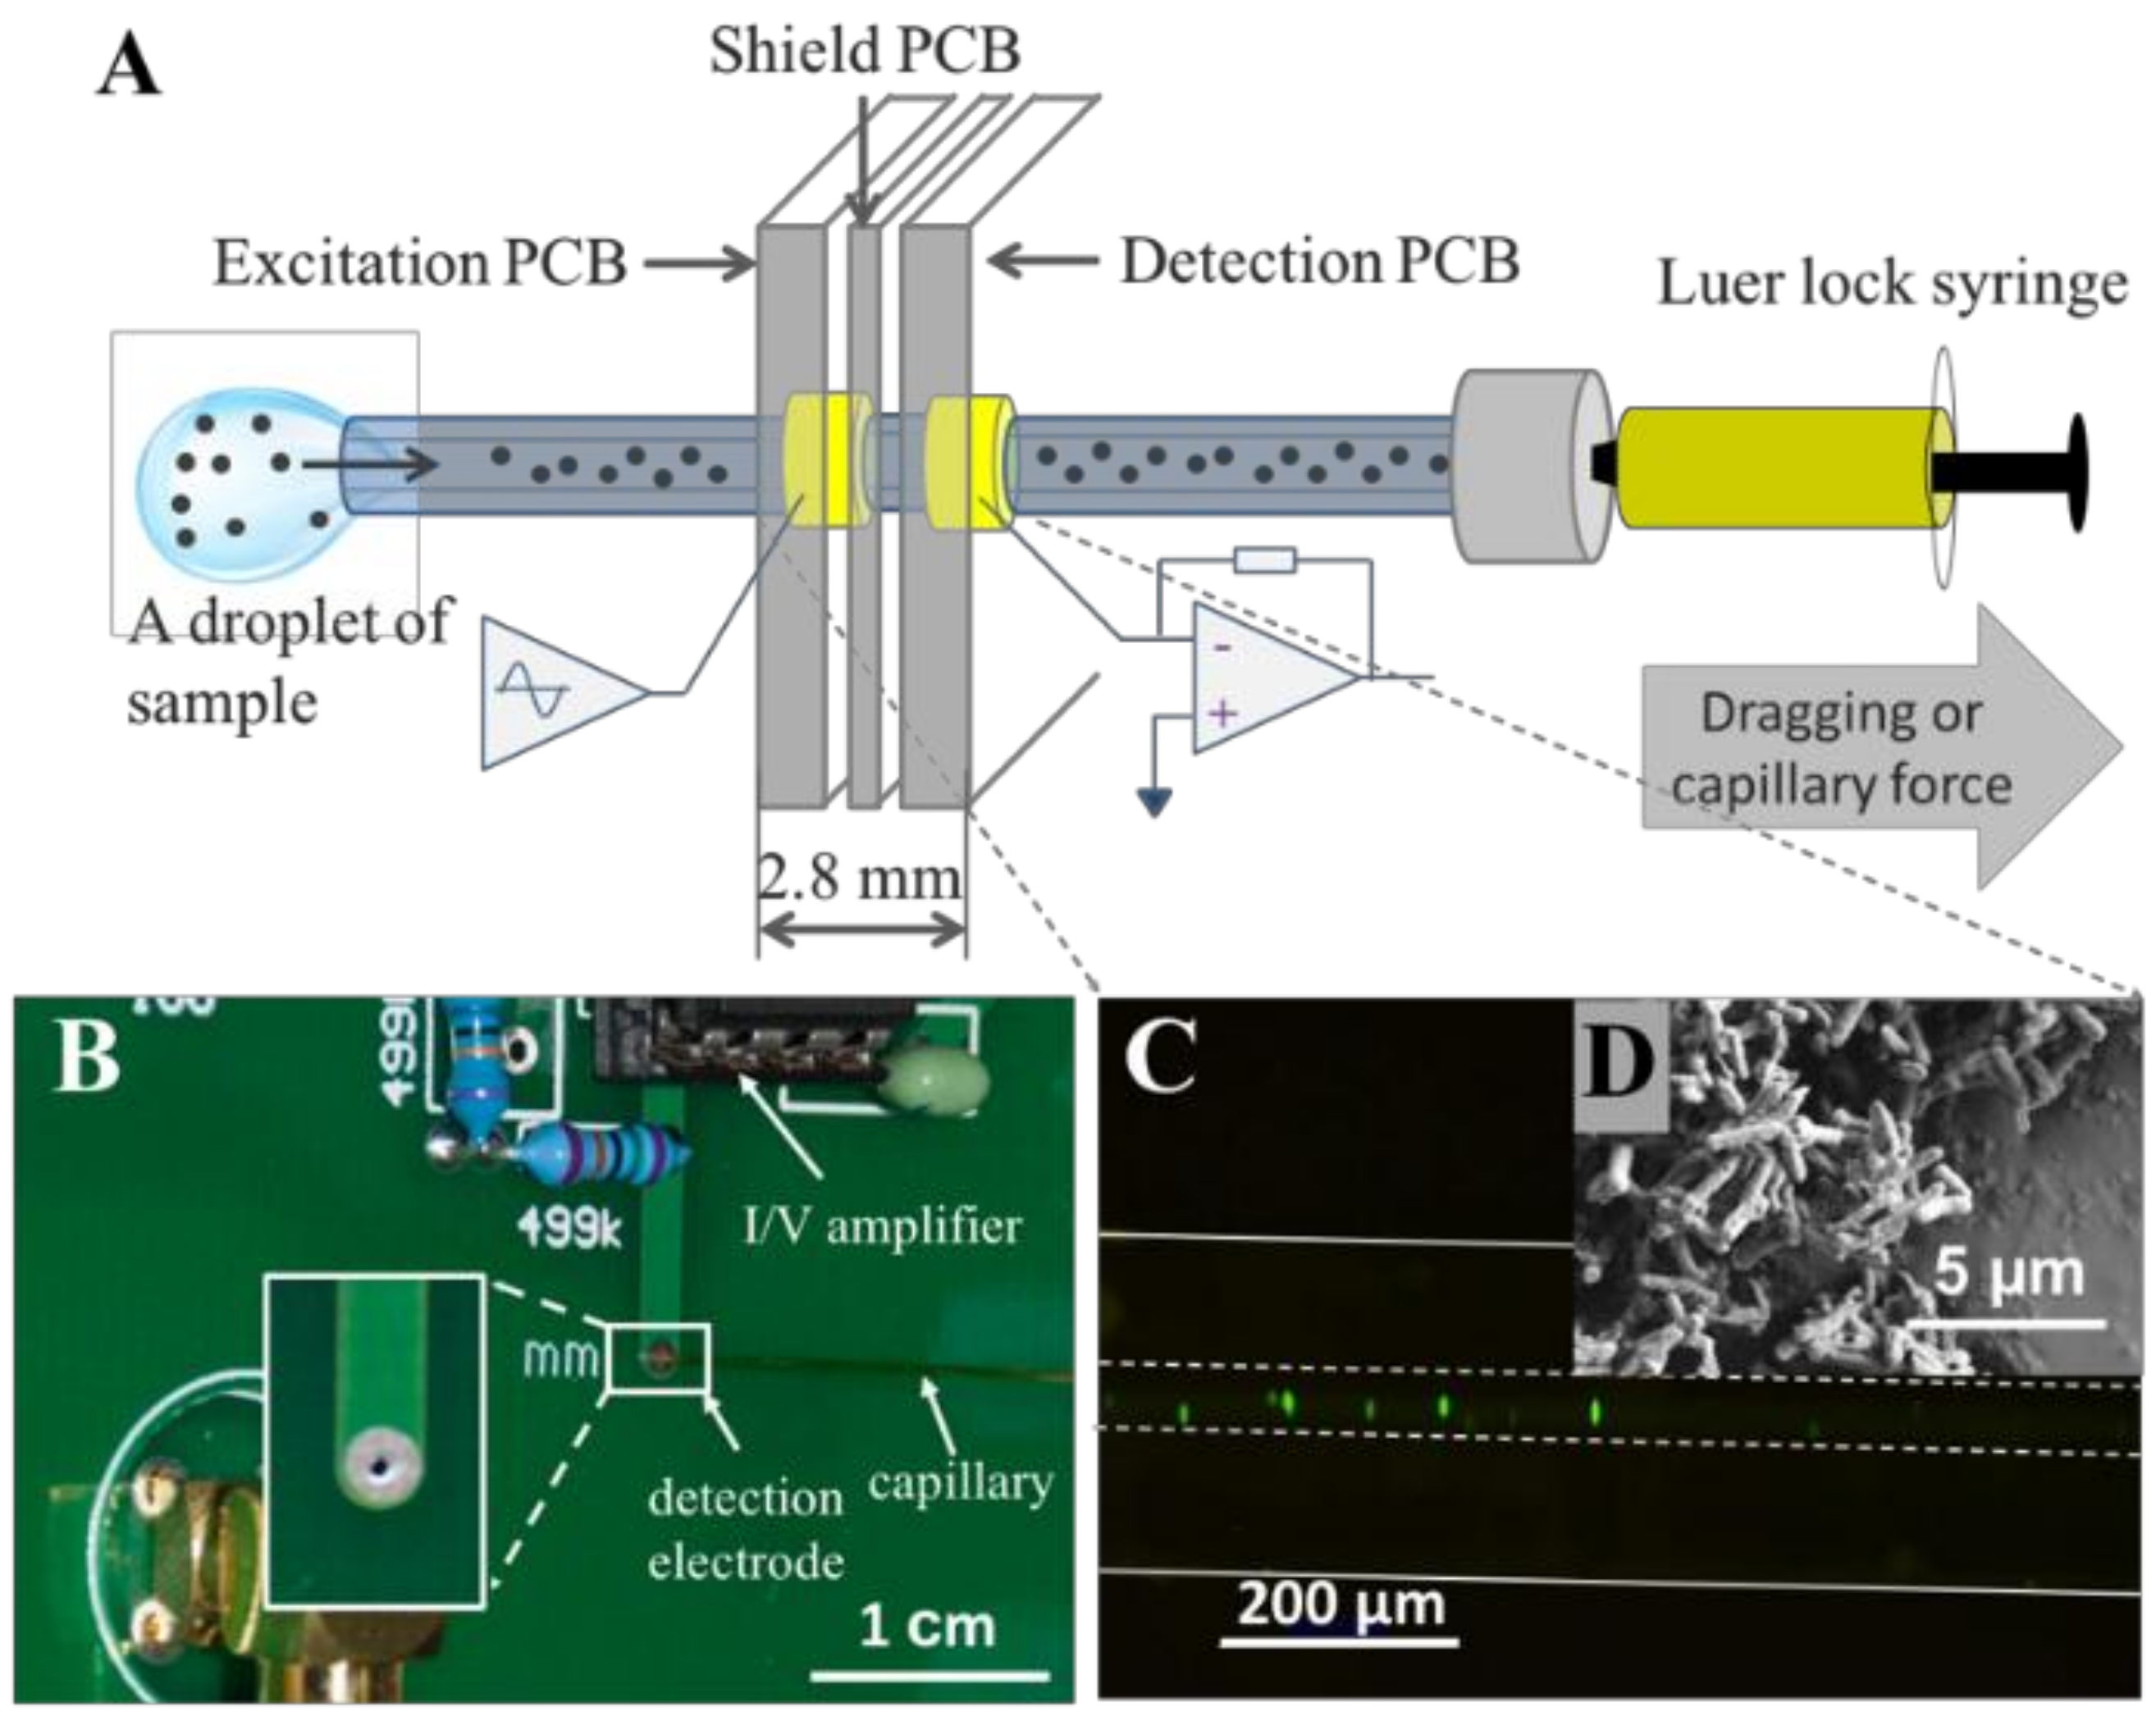
2.4. Bacteria Loading

For C4D detection, different concentrations of the samples were loaded into 200-μL tubes and were then injected into a 150-μm-ID and 10-cm-long capillary (Yongnian Optic Fiber Plant, Yongnian, Hebei, China) for 5 s by pulling back a syringe manually instead of a syringe pump. The outlet diameter of untreated polyimide coated fused silicon capillary is 360 μm. The output voltage signal was then recorded after stopping the injection. This rapid injection method could avoid the contamination from the syringe and the Luer lock. Furthermore, pump-free injection could avoid the destruction of the sample and conductivity changing due to high pressure in the capillary from the pump’s pushing.

3. Results and Discussion

3.1. Design Strategy and Instrumentation

The experimental setup comprised a home-made C4D and a data acquisition system. A block diagram of the C4D circuitry, which contains an excitation PCB, a detection PCB, and a shielding PCB, is given in Figure 1A. Two solder pads, working as an excitation electrode and pick-up electrode, were located in the corresponding PCBs. The ID of the electrodes was 400 µm, which was decided by the 360-μm OD of the capillary used in the following experiments. The width of both the excitation and detection electrodes was 1.0 mm which was decided by the thickness of the excitation and detection PCBs. The thickness of the shielding PCB is 0.8 mm, which served as the gap between the two electrodes. Hence, the detection cell size was 2.8 mm (shown in Figure 1A). The capillary was washed with deionized (DI) water, PBS, and BSA in turn prior to use, then passed the excitation, shielding, and detection PCBs in sequence. The three PCBs were assembled with quite accurate alignment holes. The shielding PCB could effectively lower the noise and could control the gap between two electrodes, which could avoid the shortcut problem. Hence, the above design supported a smooth, safe, and simple exchange of capillaries and improved the sensitivity and repeatability of the contactless detection. A field programmable gate array (FPGA) was used to generate a sine-wave excitation signal with the designed frequency. The sinusoidal signal with 100 kHz frequency and 25 Vpp (peak-to-peak) amplitude was applied to the excitation electrode after optimization. The pick-up amplifier consisted of two cheap (unction Field-Effect Transistor) JFET-input operational amplifiers (LF-357, Texas Instruments, Austin, TX, USA) as the transimpedance amplifier and voltage follower. The signal was then rectified with a lock-in synchronous amplifier (AD630, Analog Devices, Norwood, MA, USA), two-order Chebyshev low-pass filtered, and programmable gain amplified (PGA205, Burr-Brown, Austin, TX, USA). The output was finally fed via a coaxial cable to a 16-bit data acquisition system (NI 6229, National Instruments, Austin, TX, USA). The system was controlled under LabVIEW software. Figure 1B shows the photograph of the prototype C4D system. The signal-to-noise (S/N) of this system was detected by the different concentrations of the potassium chloride solution from 1 to 10 μM (Figure S1). The detection at the level of 1 μM is illustrated, and a linear relationship (R2 = 0.9885) was obtained at this low concentration. Figure S2 shows the detection limit of 0.1 μM potassium salt solution, the S/N of which is higher than 9.

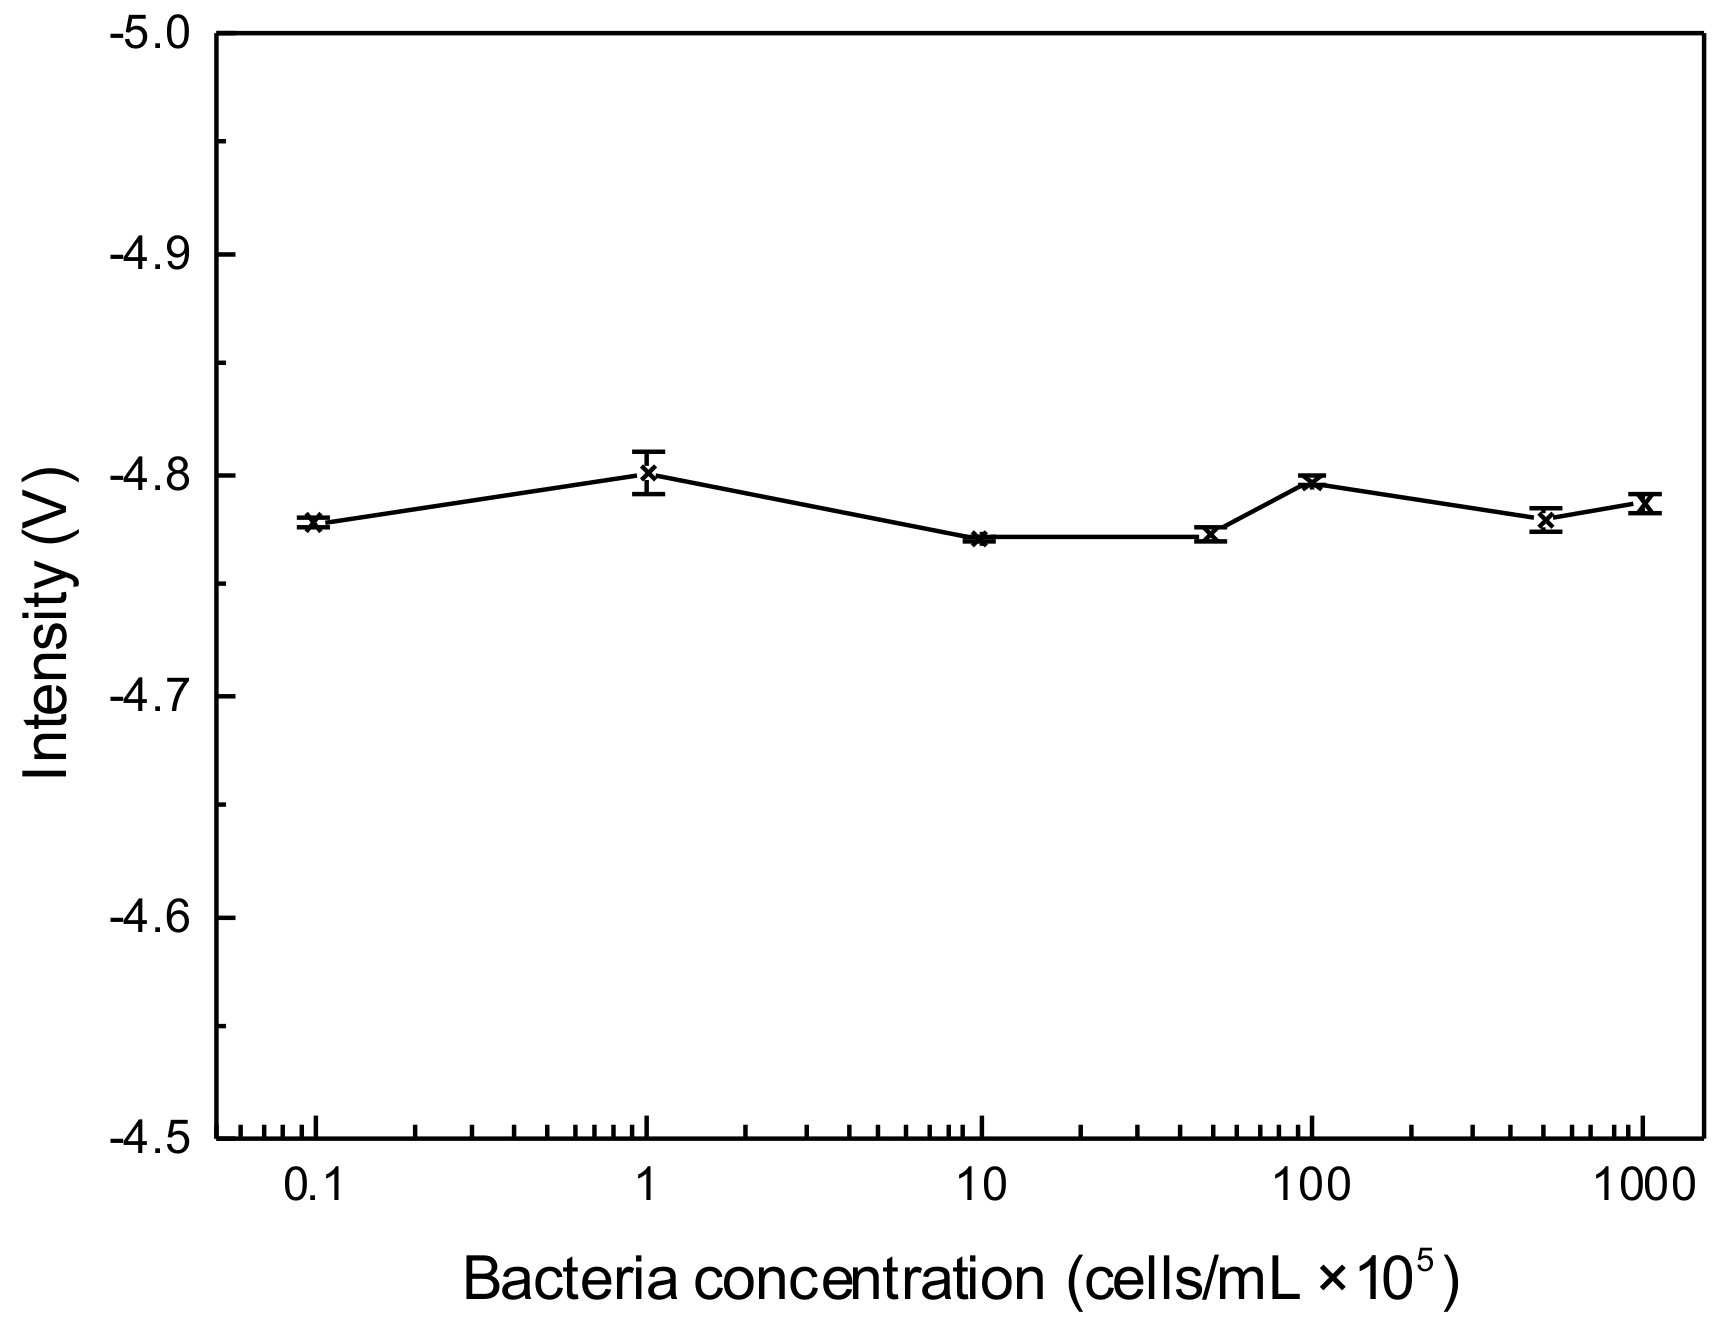
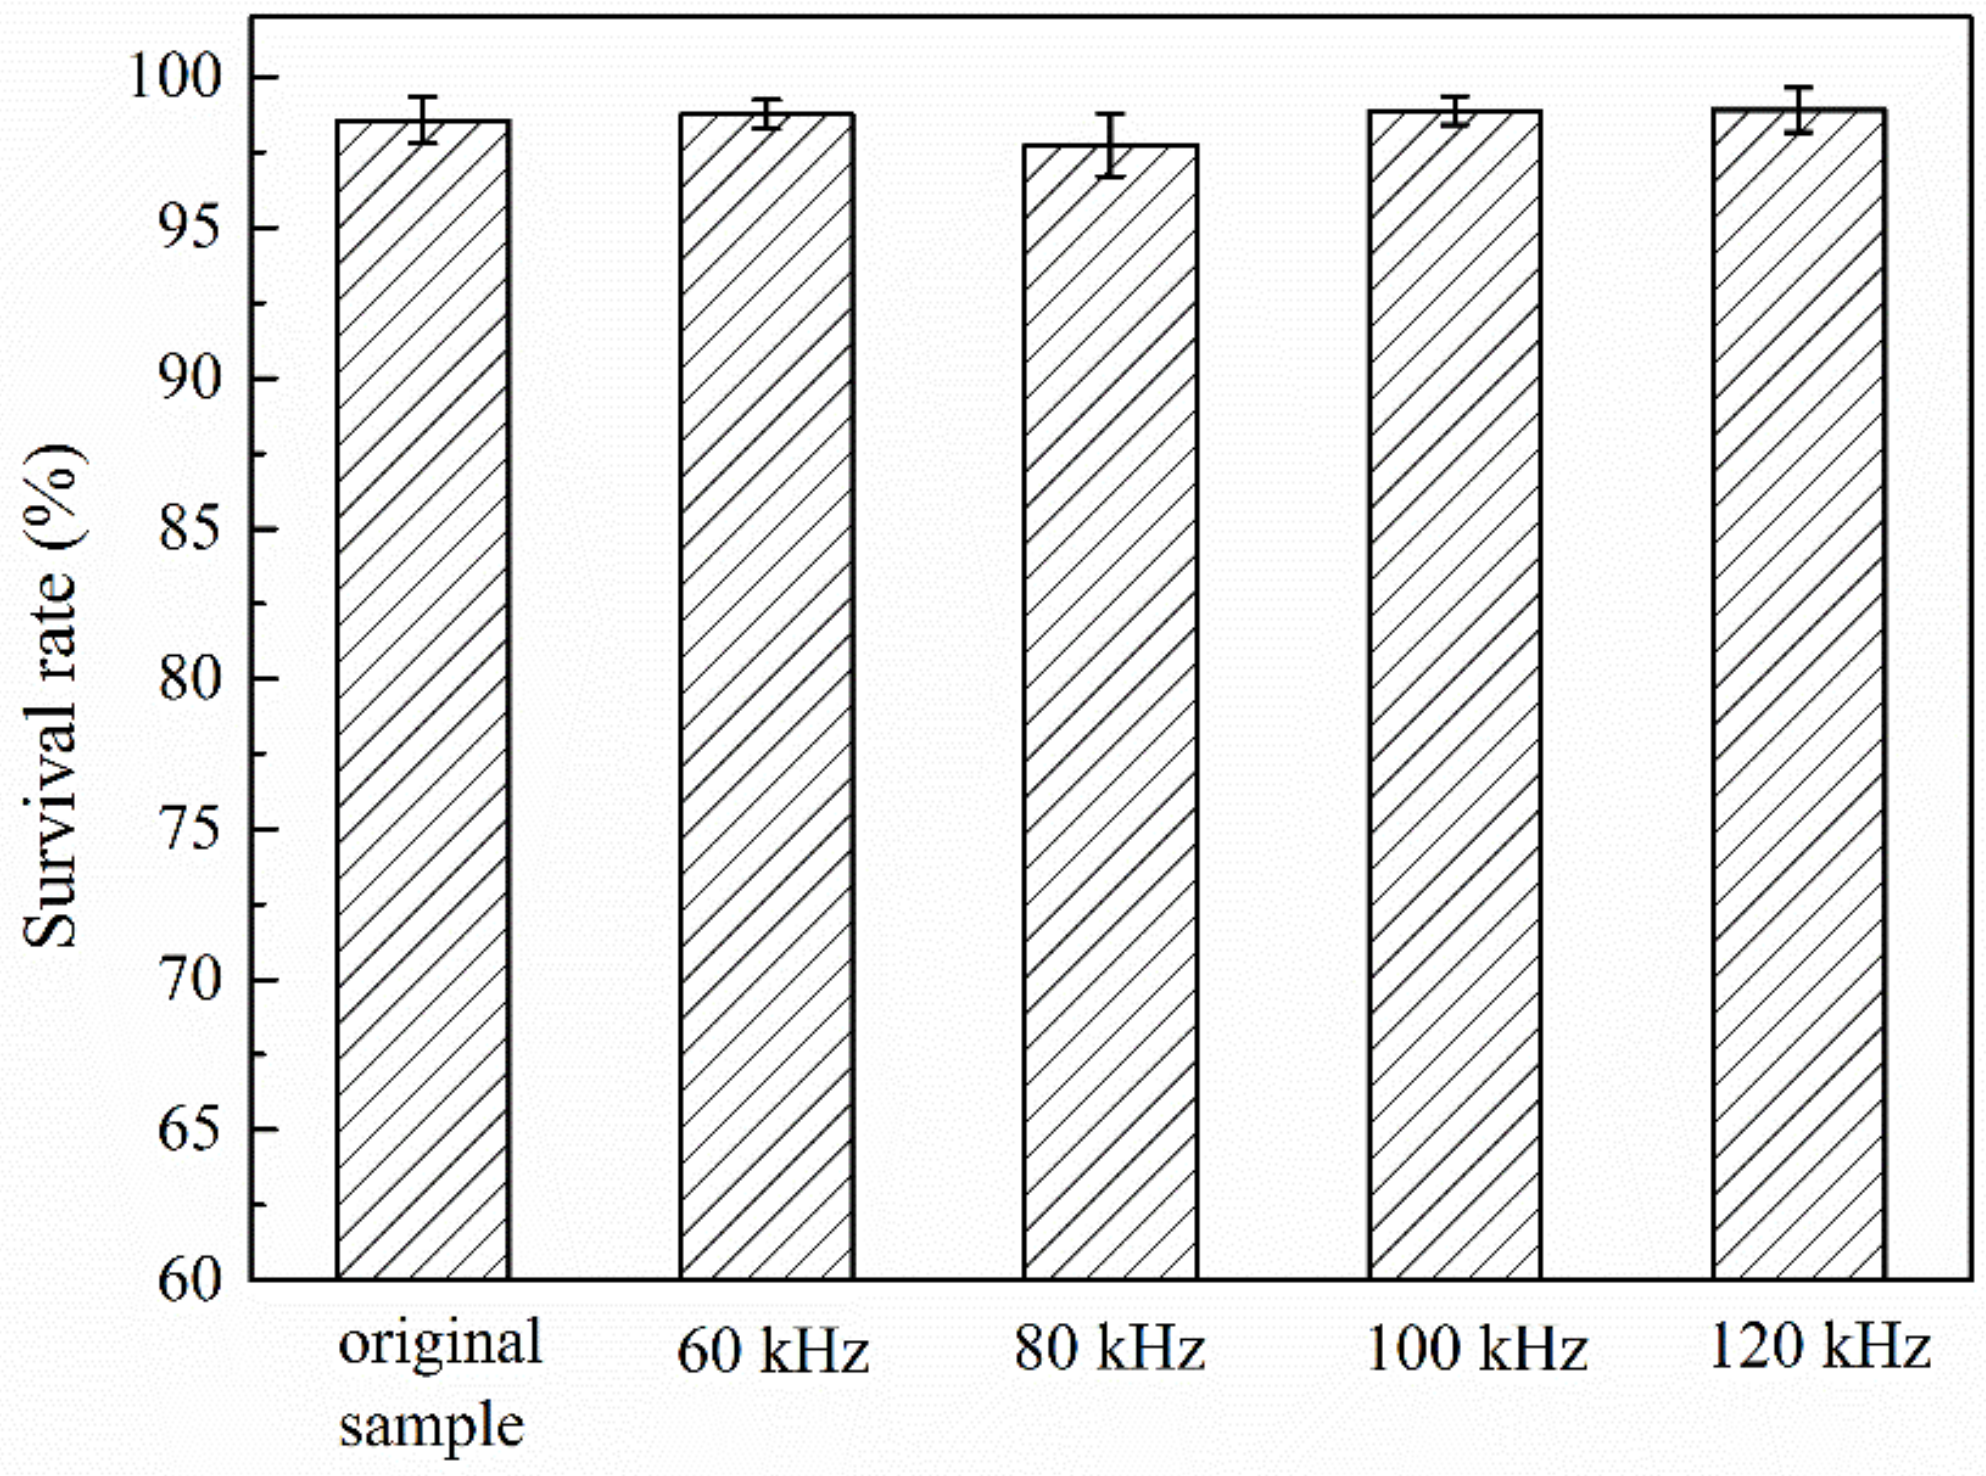
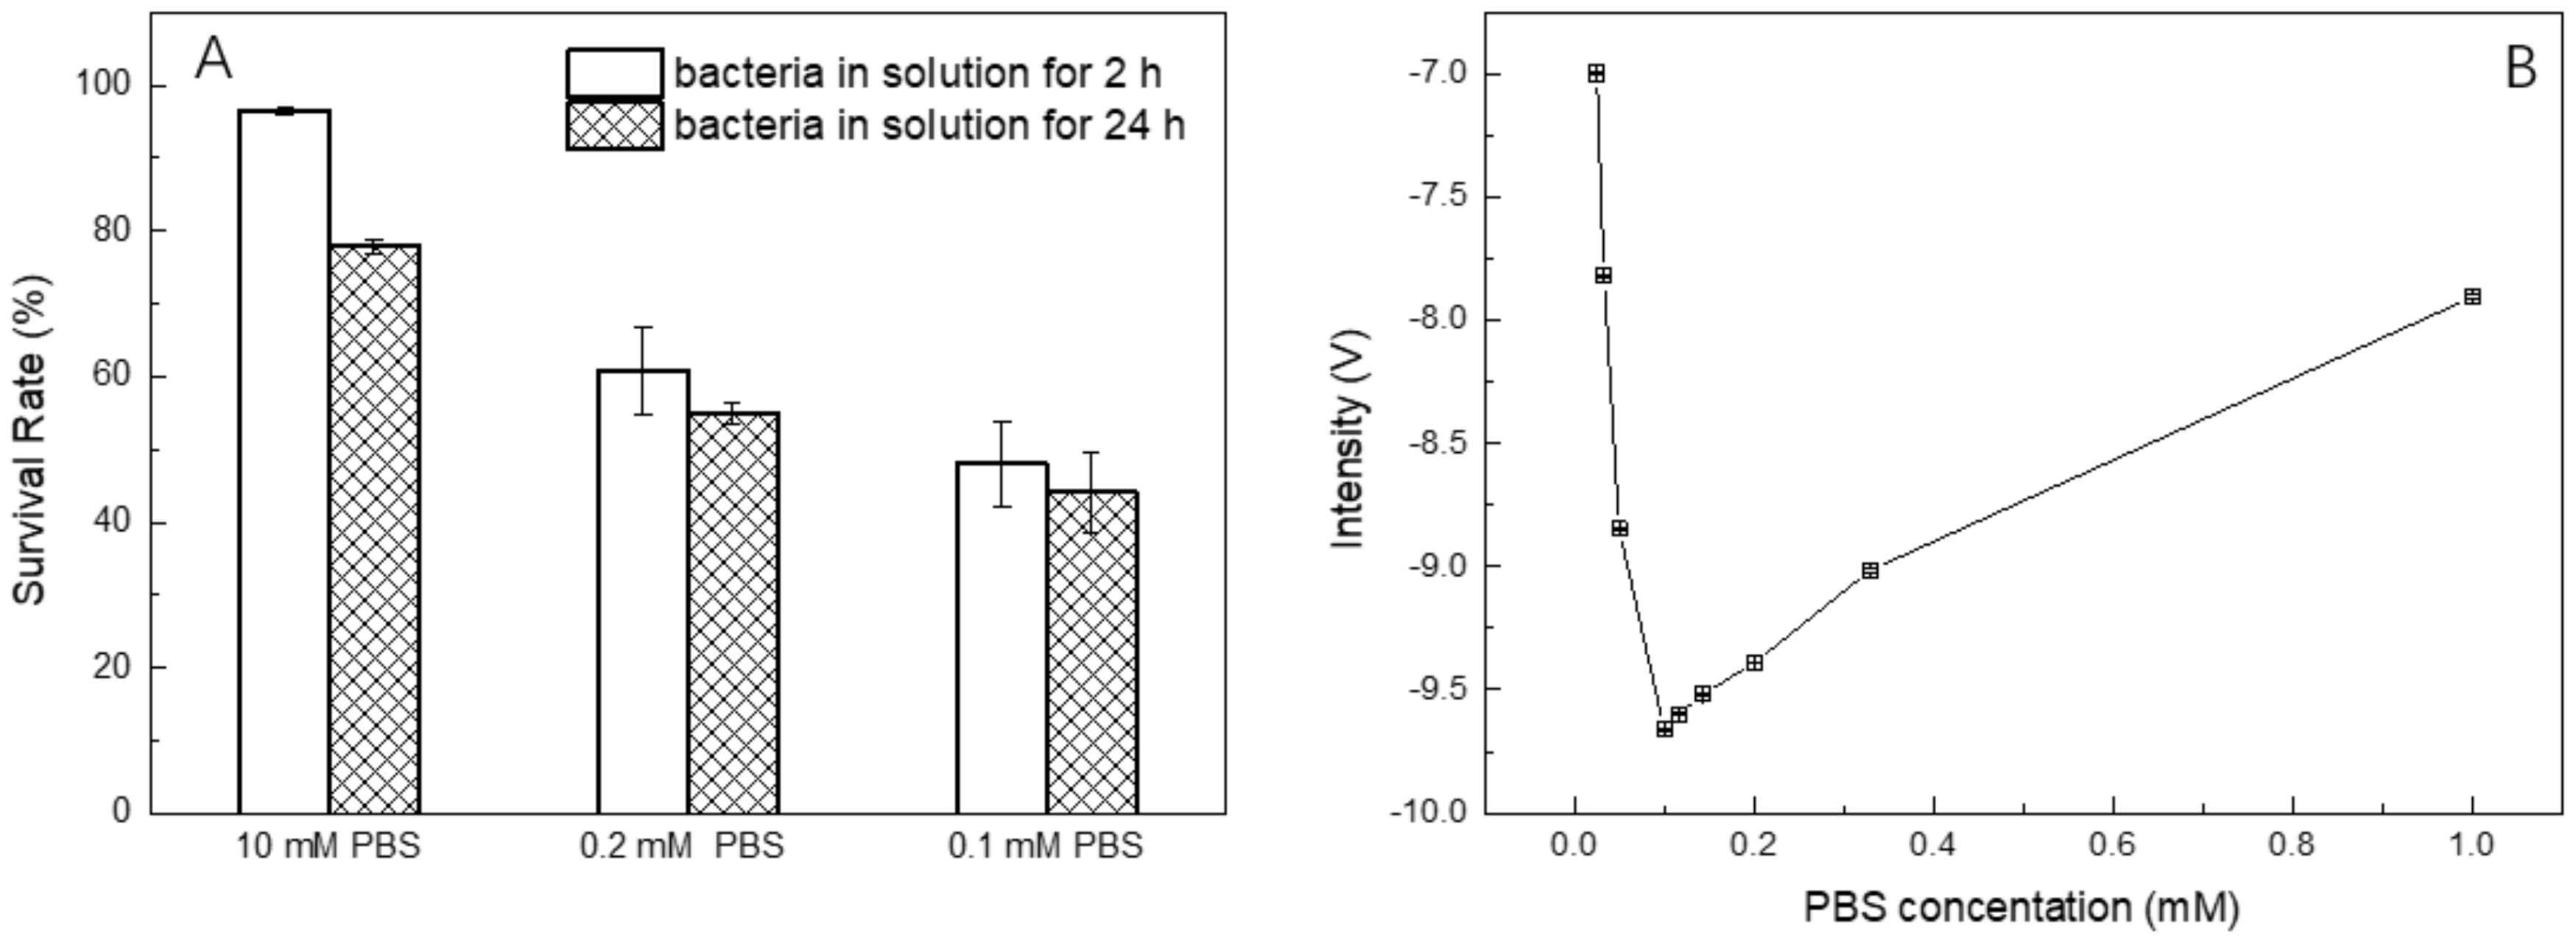
3.2. Electrical Effect of C4D on Bacteria Viability

Bacteria can be killed when placed to voltage pulses of high strength for sufficient time, thus, there is a risk of bacteria damage or viability affection by the electrical detection. Especially for some rare uncultured bacteria, which are difficult to culture because of their complex growing conditions and long growing period, the risk may lead to unexpected loss. Hence, it is very important to discuss the bacterial viability before and after detection [48]. C4D is an electrical detection method that measures conductivity corresponding to bacteria concentrations; thus, the influence of voltage amplitude and frequency of the wave on bacteria viability will be discussed. Wang et al. reported that the cell membrane would be disintegrated by the stimulation over 1000 V/cm of the electric field strength, which resulted in nearly 100% cell death; however, low field strength less than 300 V/cm did not affect the cell viability in the exposure period of 30–40 s [49,50]. In addition, the membrane potential induced by an external field is another factor need to be considered in detection. The membrane potential of bacteria is the difference in and out of cell. The critical valve is 1.1 Vm for bacteria to be in stationary growth phase [51]. The permeabiltization of cell membrane would increase when the external field was applied, which would lead to bacterial lysis and death. In our C4D system, the measured current through the media in the capillary was less than 1 μA at the excitation of 25 Vpp, though the voltage was larger than the one used in electric double layer [52,53,54]. The maximum conductivity of the media was 0.286 mS/cm measured by METTLER TOLEDOLE 740 (METTLER TOLEDO, Shanghai, China), that is, the resistivity is 416.7 Ω·cm. The length of the C4D cell is 2.8 mm (shown in Figure 1A); and the diameter of C4D cell is 150 μm, which is the ID of capillary. Hence, the electric field strength in the capillary was about 2.36 V/cm, which is far below 300 V/cm. According to the theoretical equation [51], the membrane potential of 0.288 mV for E. coli cell at the excitation of 25 Vpp is revealed. It is far below the critical membrane potential of 1.1 Vm, which is only 0.1% of the Vm.
Frequency is another electrical parameter that will influence the bacterial viability. Shawki [55] recently reported that the current with low frequency less than 100 Hz (about 10 V/cm, 130 s exposure) can be used as a physical method to kill bacteria, with a death rate over 40%, however, bacteria exposure to higher frequencies showed insignificant lethal effect; the death rate at 100 kHz was less than 1%. 100 kHz is the working frequency of C4D. In our assessment experiment, the E. coli samples with the concentration of 107 cells/mL in PBS buffer were exposed in the capillary with external sinusoidal excitation of 25 Vpp and 60–120 kHz. The viability of bacteria before and after conductivity detection was analyzed using FCM after being fluorescent-labeled by Propidium Iodide (PI). This essay is a commonly used method to analyze the cell viability [56]. PI is unable to pass through the membrane of live bacteria, thus, the damaged bacteria will be labeled by PI. Figure 2 shows that the survival rate after exposure at the frequencies of 60 kHz, 80 kHz, 100 kHz, and 120 kHz were all above 96%, with very small error bars. It can be concluded that the working frequency in range from 60–120 kHz of C4D may not influence the viability of the bacteria obviously. Additionally, numerous studies have provided evidence that alternating current (AC) frequency of 5 kHz–10 MHz [57] can been used in the application of dielectrophoretic cell separation. Cells could be successfully cultured after dielectrophoretic separation.

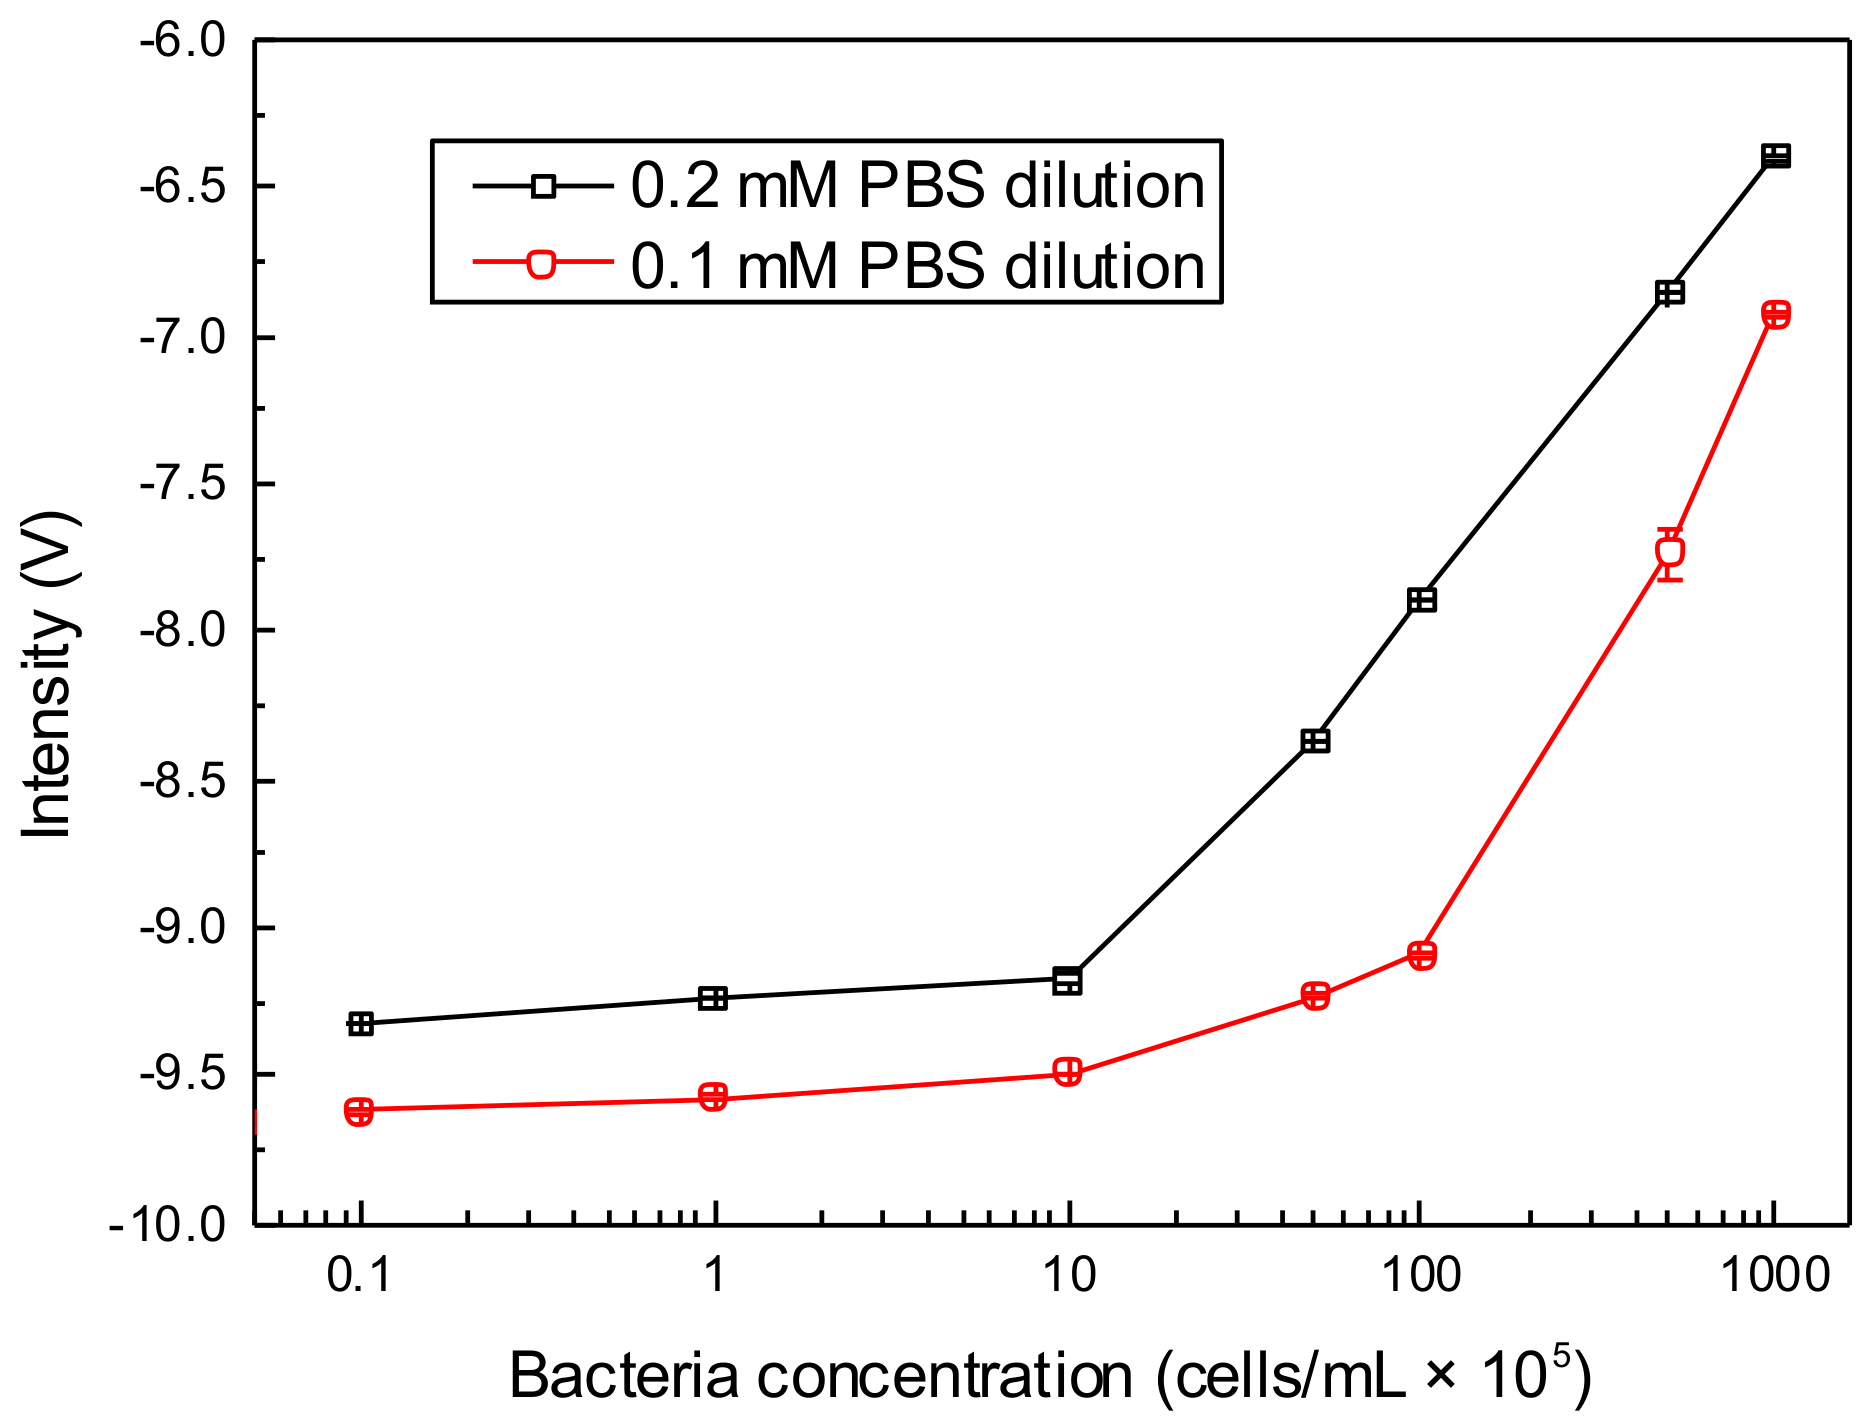
3.3. Optimization of PBS Concentration for Bacteria Counting

The conductivity of the membrane of live bacteria is only ~10−3 μS/cm, thus, bacterial membrane is highly insulated [58]. The conductivity of bacteria’s interior can be as high as ~10 μS/cm, which is much higher than 0.055 μS/cm of DI water. Thus, when live bacteria are suspended in DI water, ions will release from the E. coli and generate osmotic shock. At the same time, water will enter into the bacteria, and cause death of most bacteria due to the bacterial membrane broken [47]. Therefore, PBS buffer is widely used for substance solution and cell container rinsing, which is able to balance pH for better bacterial viability and provide same ion concentration. Electrical impedance spectroscopy makes use of this characteristic to detect bacteria; however, the electrodes are easily contaminated and corroded due to direct sample contacting [47].
The osmolality and ion concentrations of PBS solutions are equal to those of bacteria. However, because the conductivity of PBS buffer is also roughly the same as the bacterial interior, it is hard to detect the conductivity change after suspending the bacteria with the concentration from 104 cells/mL to 108 cells/mL in the 10 mM PBS buffer (see Figure 3). Hence, it is essential to reduce the conductivity of background solution. It was reported that bacteria could survive in the solution, in which the concentration of sodium chloride is higher than the critical value of 1.7 mM [59]. To understand the effect of salt concentration on the bacteria, the bacteria survival rate in the original PBS buffer and different diluted PBS buffer were measured by FCM. Figure 4A shows that the survival rate of bacteria in 10 mM PBS buffer for 2 h was 96%, and decreased with the descent of the PBS concentration. Variation between 2 h and 24 h detection for 0.2 mM and 0.1 mM PBS dilution was less than 10%.
The 10 mM PBS buffer was then diluted to different concentrations to measure corresponding C4D intensities (shown in Figure 4B). It is noted that the C4D intensities indicate a negative correlation in case of the PBS concentration higher than 0.1 mM dilution, however, a strong positive correlation from 0.1 mM to 0.025 mM. It could be explained that in the case of low conductivity detection the C4D impedance is essentially a function of the capillary inner solution conductivity, while at high conductivities, impedance is mainly determined by capacitances of the capillary wall [60]. Low concentrations, less than 0.1 mM PBS solution, exhibit a high quality of linearity, whereas the ion concentration of sodium chloride is much lower than the critical value. Hence, we finally selected 0.2 mM and 0.1 mM PBS dilution as C4D background for discussion.
Figure 5 shows the relationship between the C4D intensity and different bacteria concentrations from 104 to 108 cells/mL in 0.2 mM and 0.1 mM PBS dilutions. In both PBS dilutions, C4D intensities increase with the increase of bacteria concentration, and give higher sensitivities when detecting bacteria in the range of 106–108 cells/mL in contrast with the concentration less than 106 cells/mL. It seems that the detection in 0.2 mM PBS indicates a little better response than that in 0.1 mM PBS in the case of low bacterial concentration. The S/N of 104 and 105 cells/mL bacteria in 0.2 mM PBS is 55.7 and 124.3, respectively.

4. Conclusions

In summary, we designed and fabricated a novel C4D device to count E. coli. The electrodes and the circuits were integrated on three PCBs. Thus, the design supports a simple and safe change of capillaries to improve the sensitivity and repeatability comparing to traditional C4D methods. Firstly, we discussed the electric field strength and the frequency effect on the bacteria after the C4D detection; results indicate that the survival rate is above 96% at the excitation of 25 Vpp and 100 kHz. Secondly, the background solutions for C4D detection of bacteria were discussed. For the in situ detection of bacteria culture, we suggest 0.2 mM PBS solution as the C4D background, which adapts to detecting the bacteria concentration in the range of 106–108 cells/mL. In addition, the consumption solution is nanoliter scale, and no syringe pump is needed, which avoids the high pressure effect on the bacteria. Hence, this method may provide a good technical solution for many applications and the comparison of developed devices and this work is in Table A1. Reasonable direction for further research is to improve the detection range by increasing the ID of capillary, which can enlarge the volume of detection cells. In addition, narrow-ID-capillary array or holey fibers can be used to improve the detection limit by lower the background from the PBS buffer.

Supplementary Materials

The following are available online at https://www.mdpi.com/2072-666X/10/1/55/s1, Figure S1: The C4D detection of different concentrations of the potassium chloride solution from 1 to 10 μM (R2 = 0.9885), Figure S2: Response to the injection of 0.1 μM KCl solution. The flow velocity is 3 μL/min of DI water, and the injection volume of sample is 1 nL.

Author Contributions

Conceptualization, K.S. and X.-Y.Z.; methodology, X.-Y.Z.; software, K.S.; validation, Z.-Y.L., and X.-Q.Z.; formal analysis, X.-Y.Z. and Z.-Y.L.; investigation, X.-Y.Z.; resources, K.S. and H.M.; data curation, X.-Y.Z.; writing—original draft preparation, X.-Y.Z.; writing—review and editing, K.U. and K.S.; visualization, Y.Z.; supervision, K.S.; project administration, K.S.; funding acquisition, K.S. and H.M.

Funding

This research was funded by the National Natural Science Foundation of China (grant number 61674046); State Key Laboratory of Urban Water Resource and Environment (Harbin Institute of Technology), grant number 2017TS04.

Acknowledgments

The authors acknowledge the Research Institute for Electronic Science (RIES) International Exchange Program of “Dynamic Alliance for Open Innovation Bridging Human, Environment and Materials” from the Ministry of Education, Culture, Sports, Science and Technology of Japan (MEXT), Hokkaido University Program for Invitation of International Faculty.

Conflicts of Interest

The authors declare no conflict of interest.

Appendix A

Table A1. The comparison of developed devices and this work.
MethodOperationRecordingLabelAccuracyReference
Optical density (OD)simpleautomatic monitoringnoproviding the growth trend[6]
Plate countsimplemanual readingnodepending on labor[6]
Flow cytometryskilled operator neededautomatic monitoringfluorescencegood[7,8,9]
This worksimpleautomatic monitoringnoBetter than OD in range of 106–108 cells/ml

References

  1. Bergeron, S.; Boopathy, R.; Nathaniel, R.; Corbin, A.; LaFleur, G. Presence of antibiotic resistant bacteria and antibiotic resistance genes in raw source water and treated drinking water. Int. Biodeterior. Biodegrad. 2015, 102, 370–374. [Google Scholar] [CrossRef]
  2. Chen, C.W.; Hsu, C.Y.; Lai, S.M.; Syu, W.J.; Wang, T.Y.; Lai, P.S. Metal nanobullets for multidrug resistant bacteria and biofilms. Adv. Drug Deliv. Rev. 2014, 78, 88–104. [Google Scholar] [CrossRef] [PubMed]
  3. Huang, X.; Zou, X.; Zhao, J.; Shi, J.; Zhang, X.; Li, Z.; Shen, L. Sensing the quality parameters of Chinese traditional Yao-meat by using a colorimetric sensor combined with genetic algorithm partial least squares regression. Meat Sci. 2014, 98, 203–210. [Google Scholar] [CrossRef] [PubMed]
  4. Hammes, F.; Berney, M.; Wang, Y.Y.; Vital, M.; Koster, O.; Egil, T. Flow-cytometric total bacterial cell counts as a descriptive microbiological parameter for drinking water treatment processes. Water Res. 2008, 42, 269–277. [Google Scholar] [CrossRef] [PubMed]
  5. Li, Z.H.; Hu, X.T.; Shi, J.Y.; Zou, X.B.; Huang, X.W.; Zhou, X.C.; Haroon, E.T.; Mel, H.; Malcolm, P. Bacteria counting method based on polyaniline/bacteria thin film. Biosens. Bioelectron. 2016, 81, 75–79. [Google Scholar] [CrossRef] [PubMed]
  6. Song, Y.X.; Zhang, H.P.; Chon, C.H.; Chen, S.; Pan, X.X.; LI, D.Q. Counting bacteria on a microfluidic chip. Anal. Chim. Acta 2010, 681, 82–86. [Google Scholar] [CrossRef] [PubMed]
  7. Liu, G.; Van der Mark, E.J.; Verberk, J.Q.; Van Dijk, J.C. Flow cytometry total cell counts: A field study assessing microbiological water quality and growth in unchlorinated drinking water distribution systems. BioMed Res. Int. 2013, 2013. [Google Scholar] [CrossRef]
  8. Czechowska, K.; Johnson, D.R.; van der Meer, J.R. Use of flow cytometric methods for single-cell analysis in environmental microbiology. Curr. Opin. Microbiol. 2008, 11, 205–212. [Google Scholar] [CrossRef]
  9. Lepowsky, E.; Amin, R.; Tasoglu, S. Assessing the reusability of 3D-printed photopolymer microfluidic chips for urine processing. Mciromachines 2018, 9, 520. [Google Scholar] [CrossRef]
  10. Chen, Y.C.; Nawaz, A.A.; Zhao, Y.H.; Huang, P.H.; McCoy, J.P.; Levine, S.J.; Wang, L.; Huang, T.J. Standing surface acoustic wave (SSAW)-based microfluidic cytometer. Lab Chip 2014, 10, 916–923. [Google Scholar] [CrossRef]
  11. Steil, D.; Pohlentz, G.; Legros, N.; Mormann, M.; Mellmann, A.; Karch, H.; Müthing, J. Combining Mass Spectrometry, Surface Acoustic Wave Interaction Analysis, and Cell Viability Assays for Characterization of Shiga Toxin Subtypes of Pathogenic Escherichia coli Bacteria. Anal. Chem. 2018, 90, 8989–8997. [Google Scholar] [CrossRef] [PubMed]
  12. Duarte, C.; Costa, T.; Carneiro, C.; Soares, R.; Jitariu, A.; Cardoso, S.; Piedade, M.; Bexiga, R.; Freitas, P. Semi-quantitative method for streptococci magnetic detection in raw milk. Biosensors 2016, 6, 19. [Google Scholar] [CrossRef] [PubMed]
  13. Ghali, H.; Chibli, H.; Nadeau, J.; Bianucci, P.; Peter, Y.A. Real-time detection of staphylococcus aureus using whispering gallery mode optical microdisks. Biosensors 2016, 6, 20. [Google Scholar] [CrossRef] [PubMed]
  14. Hu, L.; Ge, A.; Wang, X.; Wang, S.; Yue, X.; Wang, J.; Feng, X.; Du, W.; Liu, B.F. Real-time monitoring of immune responses under pathogen invasion and drug interference by integrated microfluidic device coupled with worm-based biosensor. Biosens. Bioelectron. 2018, 110, 233–238. [Google Scholar] [CrossRef] [PubMed]
  15. Khan, S.M.; Misra, K.S.; Schwartz-Duval, S.A.; Daza, E.; Ostadhossein, F.; Bowman, M.; Jain, A.; Taylor, G.; McDonagh, D.; Labriola, T.L.; et al. Real-time monitoring of post-surgical and post-traumatic eye injuries using multilayered electrical biosensor chip. Appl. Mater. Interfaces 2017, 9, 8609–8622. [Google Scholar] [CrossRef] [PubMed]
  16. Liu, L.; Xu, Y.; Cui, F.; Xia, Y.; Chen, L.; Mou, X.; Lv, J. Monitoring of bacteria biofilms forming process by in-situ impedimetric biosensor chip. Biosens. Bioelectron. 2018, 112, 86–92. [Google Scholar] [CrossRef]
  17. Xu, D.; Huang, X.; Guo, J.; Ma, X. Automatic smartphone-based microfluidic biosensor system at the point of care. Biosens. Bioelectron. 2018, 110, 78–88. [Google Scholar] [CrossRef]
  18. Saucedo, M.N.; Gao, Y.; Pham, T.; Mulchandani, A. Lectin- and saccharide-functionalized nano-chemiresistor arrays for detection and identification of pathogenic bacteria infection. Biosensors 2018, 8, 63. [Google Scholar] [CrossRef]
  19. Zhang, N.; Ruan, Y.F.; Zhang, L.B.; Zhao, W.W.; Xu, J.J.; Chen, H.Y. Nanochannels photoelectrochemical biosensor. Anal. Chem. 2017, 90, 2341–2347. [Google Scholar] [CrossRef]
  20. Khan, S.M.; Misra, S.K.; Dighe, K.; Wang, Z.; Schwartz-Duval, A.S.; Sar, D.; Pan, D. Electrically-receptive and thermally-responsive paper-based sensor chip for rapid detection of bacterial cells. Biosens. Bioelectron. 2018, 110, 132–140. [Google Scholar] [CrossRef]
  21. Liebana, S.; Spricigo, A.D.; Cortes, M.P.; Barbe, J.; Llagostera, M.; Alegret, S.; Pividori, M.I. Phagomagnetci separation and electrochemical magneto-genosensing of pathogenic bacteria. Anal. Chem. 2013, 85, 3079–3086. [Google Scholar] [CrossRef] [PubMed]
  22. Chistyako, V.A.; Prazdnova, E.V.; Mazanko, M.S.; Bren, A.B. The use of biosensors to explore the potential of probiotic strains to reduce the SOS response and mutagenesis in bacteria. Biosensors 2018, 8, 25. [Google Scholar] [CrossRef] [PubMed]
  23. Le, D.Q.; Takai, M.; Suekuni, S.; Tokonami, S.; Nishino, T.; Shiigi, H.; Nagaoka, T. Development of an observation platform for bacterial activity using polypyrrole films doped with bacteria. Anal. Chem. 2015, 87, 4047–4052. [Google Scholar] [CrossRef] [PubMed]
  24. Wang, R.; Lum, J.; Callaway, Z.; Lin, J.; Bottje, W.; Li, Y. A label-free impedance immunosensor using screen-printed interdigitated electrodes and magnetic nanobeads for the detection of E. coli O157:H7. Biosensors 2015, 5, 791–803. [Google Scholar] [CrossRef] [PubMed]
  25. Ward, A.C.; Hannah, A.J.; Kendrick, S.L.; Tucker, N.P.; MacGregor, G.; Connolly, P. Identification and characterisation of Staphylococcus aureus on low cost screen printed carbon electrodes using impedance spectroscopy. Biosens. Bioelectron. 2018, 110, 65–70. [Google Scholar] [CrossRef] [PubMed]
  26. Ma, F.; Rehman, A.; Sims, M.; Zeng, X. Antimicrobial susceptibility assays based on the quantification of bacterial lipopolysaccharides via a label free lectin biosensor. Anal. Chem. 2015, 87, 4385–4393. [Google Scholar] [CrossRef] [PubMed]
  27. Zhang, D.; Bi, H.; Liu, B.; Qiao, L. Detection of pathogenic microorganisms by microfluidics based analytical methods. Anal. Chem. 2018, 90, 5512–5520. [Google Scholar] [CrossRef]
  28. Thakur, B.; Zhou, G.; Chang, J.; Pu, H.; Jin, B.; Sui, X.; Yuan, X.; Yang, C.H.; Magruder, M.; Chen, J. Rapid detection of single E. coli bacteria using a graphene-based field-effect transistor device. Biosens. Bioelectron. 2018, 110, 16–22. [Google Scholar] [CrossRef]
  29. Braiek, M.; Rokbani, K.B.; Chrouda, A.; Mrabet, B.; Bakhrouf, A.; Maaref, A.; Jaffrezic-Renault, N. An electrochemical immunosensor for detection of staphylococcus aureus bacteria based on immobilization of antibodies on self-assembled monolayers-functionalized gold electrode. Biosensors 2012, 2, 417–426. [Google Scholar] [CrossRef]
  30. Miyajima, K.; Koshida, T.; Arakawa, T.; Kudo, H.; Saito, H.; Yano, K.; Mitsubayashi, K. Fiber-optic fluoroimmunoassay system with a flow-through cell for rapid on-site determination of Escherichia coli O157:H7 by monitoring fluorescence dynamics. Biosensors 2013, 3, 120–131. [Google Scholar] [CrossRef]
  31. Xiao, N.; Wang, C.; Yu, C. A self-referencing detection of microorganisms using surface enhanced raman scattering nanoprobes in a test-in-a-tube platform. Biosensors 2013, 3, 312–326. [Google Scholar] [CrossRef] [PubMed]
  32. Mosier-Boss, A.P. Review on SERS of bacteria. Biosensors 2017, 7, 51. [Google Scholar] [CrossRef] [PubMed]
  33. Wang, Y.; Knoll, W.; Dostalek, J. Bacterial pathogen surface plasmon resonance biosensor advanced by long range surface plasmons and magnetic nanoparticle assays. Anal. Chem. 2012, 84, 8345–8350. [Google Scholar] [CrossRef] [PubMed]
  34. Lyu, Y.C.; Ji, H.F.; Yang, S.J.; Huang, Z.Y.; Wang, B.L.; Li, H.Q. New C4D sensor with a simulated inductor. Sensors 2018, 16, 165. [Google Scholar] [CrossRef] [PubMed]
  35. Gao, L.D.; Li, X.H.; Fan, L.; Zheng, L.; Wu, M.M.; Zhang, S.X.; Huang, Q.L. Determination of inorganic cations and anions in chitooligosaccharides by ion chromatography with conductivity detection. Mar. Drugs 2017, 15, 51–59. [Google Scholar]
  36. Gubartallah, E.A.; Makahleh, A.; Quirino, J.P.; Saad, B. Determination of biogenic amines in seawater using capillary electrophoresis with capacitively coupled contactless conductivity cetection. Molecules 2018, 23, 1112. [Google Scholar] [CrossRef] [PubMed]
  37. Kaml, I.; Vcelakova, K.; Kenndler, E. Characterisation and identification of proteinaceous binding media (animal glues) from their amino acid profile by capillary zone electrophoresis. J. Sep. Sci. 2004, 27, 161–166. [Google Scholar] [CrossRef] [PubMed]
  38. Kuban, P.; Hauser, P.C. Application of an external contactless conductivity detector for the analysis of beverages by microchip capillary electrophoresis. Electrophoresis 2005, 26, 3169–3178. [Google Scholar] [CrossRef]
  39. Guijit, M.R.; Armstrong, P.J.; Candish, E.; Lefleur, V.; Percey, J.W.; Shabala, S.; Hauser, C.P.; Breadmore, C.M. Microfluidic chips for capillary electrophoresis with integrated electrodes for capacitively coupled conductivity detection based on printed circuit board technology. Sens. Actuator B Chem. 2011, 159, 307–313. [Google Scholar] [CrossRef]
  40. Coltro, W.K.T.; Da Silva, J.A.F.; Carrilho, E. Rapid prototyping of polymeric electrophoresis microchips with integrated copper electrodes for contactless conductivity detection. Anal. Methods 2011, 3, 168–172. [Google Scholar] [CrossRef]
  41. Vazquez, M.; Frankenfeld, C.; Coltro, W.K.T.; Carrilho, E.; Diamond, D.; Lunte, S.M. Dual contactless conductivity and amperometric detection on hybrid PDMS/glass electrophoresis microchips. Analyst 2010, 1, 96–103. [Google Scholar] [CrossRef]
  42. Da Silva, J.A.F.; Guzman, N.; do Lago, L.C. Contactless conductivity detection for capillary electrophoresis Hardware improvements and optimization of the input-signal amplitude and frequency. J. Chromatogr. A 2002, 942, 249–258. [Google Scholar] [CrossRef]
  43. Francisco, K.J.M.; do Lago, C.L. A compact and high-resolution version of a capacitively coupled contactless conductivity detector. Electrophoresis 2009, 30, 3458–3464. [Google Scholar] [CrossRef] [PubMed]
  44. Jaanus, M.; Udal, A.; Kukk, V.; Umbleja, K.; Gorbatsova, J.; Molder, L. Improved C5D electronic realization of conductivity detector for capillary electrophoresis. Electron. Elektrotech. 2016, 22, 29–32. [Google Scholar] [CrossRef]
  45. Emaminejad, S.; Javanmard, M.; Dutton, R.W.; Davis, R.W. Microfluidic diagnostic tool for the developing world: Contactless impedance flow cytometry. Lab Chip 2012, 12, 4499–4507. [Google Scholar] [CrossRef]
  46. Sun, D.P.; Lu, J.; Chen, Z.G. Microfluidic contactless conductivity cytometer for electrical cell sensing and counting. RSC Adv. 2015, 5, 59306–59313. [Google Scholar] [CrossRef]
  47. Yang, L. Electrical impedance spectroscopy for detection of bacterial cells in suspensions using interdigitated microelectrodes. Talanta 2004, 74, 1621–1629. [Google Scholar] [CrossRef]
  48. Coates, J.D.; Ellis, D.J.; Blunt-Harris, E.L.; Gaw, G.V.; Roden, E.E.; Lovley, D.R. Recovery of humic-reducing bacteria from a diversity of environments. Appl. Environ. Microbiol. 1998, 61, 1504–1509. [Google Scholar]
  49. Wang, H.Y.; Bhunia, A.K.; Lu, C. A microfluidic flow-through device for high throughput electrical lysis of bacterial cells based on continuous dc voltage. Biosens. Bioelectron. 2006, 22, 582–588. [Google Scholar] [CrossRef]
  50. Islam, M.S.; Shahid, A.; Kuryllo, K.; Li, Y.F.; Deen, M.J.; Selvaganapathy, P.R. Electrophoretic concentration and electrical lysis of bacteria in a microfluidic device using a nanoporous membrane. Micromachines 2017, 8, 45. [Google Scholar] [CrossRef]
  51. Hulsheger, H.; Potel, J.; Niemann, E.G. Electric field effects on bacteria and yeast cells. Radiat. Environ. Biophys. 1983, 22, 149–162. [Google Scholar] [CrossRef] [PubMed]
  52. Khan, M.S.; Dosoky, N.S.; Mustafa, G.; Patel, D.; Berdiev, B.; Williams, J.D. Electrophysiology of epithelial sodium channel (ENaC) embedded in supported lipid bilayer using a single nanopore chip. Langmuir 2017, 33, 13680–13688. [Google Scholar] [CrossRef] [PubMed]
  53. Zhu, Z.W.; Wang, Y.; Zhang, X.; Sun, C.F.; Li, M.G.; Yan, J.W.; Mao, B.W. Electrochemical impedance spectroscopy and atomic force microscopic studies of electrical and mechanical properties of nano-black lipid membranes and size dependence. Langmuir 2012, 28, 14739–14746. [Google Scholar] [CrossRef] [PubMed]
  54. Khan, M.S.; Dosoky, N.S.; Patel, D.; Weimer, J.; Williams, J.D. Lipid bilayer membrane in a silicon based micron sized cavity accessed by atomic force microscopy and electrochemical impedance spectroscopy. Biosensors 2017, 7, 26. [Google Scholar] [CrossRef] [PubMed]
  55. Shawki, M.M.; Gaballah, A. The effect of low AC electric field on bacterial cell death. Rom. J. Biophys. 2015, 25, 163–172. [Google Scholar]
  56. Syed, M.S.; Rafeie, M.; Vandamme, D.; Asadnia, M.; Henderson, R.; Taylor, R.A.; Warkiani, M.E. Selective separation of microalgae cells using inertial microfluidics. Bioresour. Technol. 2018, 252, 91–99. [Google Scholar] [CrossRef]
  57. Liu, W.; Wang, C.; Ding, H.; Shao, J.; Ding, Y. AC electric field induced dielectrophoretic assembly behavior of gold nanoparticles in a wide frequency range. Appl. Surf. Sci. 2016, 370, 184–192. [Google Scholar] [CrossRef]
  58. Lapizco-Encinas, B.H.; Simmons, B.A.; Cummings, E.B.; Fintschenko, Y. Dielectrophoretic concentration and separation of live and dead bacteria in an array of insulators. Anal. Chem. 2004, 76, 1571–1579. [Google Scholar] [CrossRef]
  59. Rojas, E.; Theriot, A.J.; Huang, K.C. Response of Escherichia coli growth rate to osmotic shock. Proc. Natl. Acad. Sci. USA 2014, 111, 7807–7812. [Google Scholar] [CrossRef]
  60. Brito-Neto, J.G.A.; da Silva, J.A.F.; do Lago, L.; Blanes, C.L. Understanding Capacitively Coupled Contactless Conductivity Detection in Capillary and Microchip Electrophoresis. Part 1. Fundamentals. Electroanalysis 2005, 17, 1198–1206. [Google Scholar] [CrossRef]
Figure 1. (A) Schematic illustration of capacitively coupled contactless conductivity detection (C4D) device on detecting bacterial concentration. (B) The printed-circuit-board (PCB) based electrodes. (C) Fluorescence-labeled Escherichia coli in capillary. (D) Scanning electron microscope (SEM) image of E. coli, the length of which on average is about 2 μm.
Micromachines 10 00055 g001
Figure 2. Influence on bacteria viability due to C4D detection by analyzing the ratio of live to dead cells. The recovered bacteria were labeled with Propidium Iodide (PI) and analyzed by flow cytometry (FCM). Error bars are standard deviations of four measurements.
Micromachines 10 00055 g002
Figure 3. The C4D response to the bacteria suspended in original phosphate-buffered saline (PBS) buffer with concentrations from 104 to 108 cells/mL. Error bars are standard deviations of four measurements.
Micromachines 10 00055 g003
Figure 4. (A) Bacteria survival rate in 10 mM PBS solution, 0.2 mM PBS dilution, 0.1 mM PBS dilution and water after 2 h and 24 h were detected by FCM. Bacteria were dyed by PI for 10 min. Error bars are standard deviations of 3 measurements. (B) The relationship between PBS dilution and C4D intensity. Error bars are standard deviations of 4 measurements.
Micromachines 10 00055 g004
Figure 5. The C4D response to the bacteria suspended in 0.2 mM PBS dilution and 0.1 mM PBS dilution with the different concentrations of 104–108 cells/mL. Error bars are standard deviations of four measurements.
Micromachines 10 00055 g005

