Article

Aflatoxin M1 Analysis in Urine of Mill Workers in Bangladesh: A Pilot Study

1
Department of Biochemistry and Molecular Biology, Shahjalal University of Science and Technology, Sylhet 3114, Bangladesh
2
Leibniz-Research Centre for Working Environment and Human Factors (IfADo) at the TU Dortmund, Ardeystr. 67, D-44139 Dortmund, Germany
*
Authors to whom correspondence should be addressed.
Toxins 2024, 16(1), 45; https://doi.org/10.3390/toxins16010045
Submission received: 20 December 2023 / Revised: 8 January 2024 / Accepted: 12 January 2024 / Published: 14 January 2024
(This article belongs to the Special Issue Mycotoxins: Risk Assessment, Biomonitoring and Toxicology)

Abstract

:
Presence of aflatoxin B1 (AFB1) in food and feed is a serious problem, especially in developing countries. Human exposure to this carcinogenic mycotoxin can occur through dietary intake, but also through inhalation or dermal contact when handling and processing AFB1-contaminated crops. A suitable biomarker of AFB1 exposure by all routes is the occurrence of its hydroxylated metabolite aflatoxin M1 (AFM1) in urine. To assess mycotoxin exposure in mill workers in Bangladesh, we analyzed AFM1 levels in urine samples of this population group who may encounter both dietary and occupational AFB1 exposure. In this pilot study, a total of 76 participants (51 mill workers and 25 controls) were enrolled from the Sylhet region of Bangladesh. Urine samples were collected from people who worked in rice, wheat, maize and spice mills and from controls with no occupational contact to these materials. A questionnaire was used to collect information on basic characteristics and normal food habits of all participants. Levels of AFM1 in the urine samples were determined by a competitive enzyme linked immunosorbent assay. AFM1 was detected in 96.1% of mill workers’ urine samples with a range of LOD (40) of 217.7 pg/mL and also in 92% of control subject’s urine samples with a range of LOD of 307.0 pg/mL). The mean level of AFM1 in mill workers’ urine (106.5 ± 35.0 pg/mL) was slightly lower than that of the control group (123.3 ± 52.4 pg/mL), whilst the mean AFM1 urinary level adjusted for creatinine was higher in mill workers (142.1 ± 126.1 pg/mg crea) than in the control group (98.5 ± 71.2 pg/mg crea). Yet, these differences in biomarker levels were not statistically significant. Slightly different mean urinary AFM1 levels were observed between maize mill, spice mill, rice mill, and wheat mill workers, yet biomarker values are based on a small number of individuals in these subgroups. No significant correlations were found between the study subjects’ urine AFM1 levels and their consumption of some staple food items, except for a significant correlation observed between urinary biomarker levels and consumption of groundnuts. In conclusion, this pilot study revealed the frequent presence of AFM1 in the urine of mill workers in Bangladesh and those of concurrent controls with dietary AFB1 exposure only. The absence of a statistical difference in mean biomarker levels for workers and controls suggests that in the specific setting, no extra occupational exposure occurred. Yet, the high prevalence of non-negligible AFM1 levels in the collected urines encourage further studies in Bangladesh regarding aflatoxin exposure.
Key Contribution: There was a frequent presence of AFM1 biomarker in the urine of mill workers and control individuals, yet data suggest that in this specific setting, no extra occupational AFB1 exposure occurred.

1. Introduction

Cereal grains play an important role in both the human diet and in livestock feed due to their valuable nutrient contents, such as proteins, carbohydrates, fatty acids, vitamins and minerals [1,2]. However, these agricultural products can be contaminated by various fungi in the field or during harvest and storage. Fungal infestation and mycotoxin production in crops depend on storage conditions, climate, temperature, insects and drought [3,4].
Mycotoxin contamination of cereals and grain-based food products is a significant global issue, with aflatoxins, produced by fungi of the Aspergillus genus, being the most toxic contaminants in a large portion of the world’s food supply [5,6,7]. Humans are exposed to aflatoxins through contaminated dietary staples, including maize, peanuts, rice and various cereal-based products [8,9,10]. Regions in Africa and Southeast Asia with climatic conditions favorable for fungal growth often experience greater contamination of feed and food due to poor storage conditions for crops [10,11].
It is well known that aflatoxins are harmful to animals and humans, causing severe toxicities at acute high or chronic low doses [12,13,14]. Aflatoxin B1 (AFB1) is the most potent of the aflatoxins, all classified by the IARC as human carcinogens [15]. There are strong correlations between chronic AFB1 exposure and the risk of developing hepatocellular carcinoma, the third leading cause of cancer deaths worldwide [16]. Thus, regulations exist on maximal levels of aflatoxins, including AFB1, AFG2, AFB2 and AFG2, for food crops and for AFM1 in milk [6,17]. Bangladesh now also has specific regulatory limits for contamination of certain food items [18].
AFB1 and its hydroxylated metabolite AFM1 have similar toxic properties, including carcinogenic and hepatotoxic effects [17,19,20]. Ingested AFB1 is partly converted in the organism to AFM1 and then excreted with urine and breast milk, commonly used matrices for analysis in human biomonitoring studies, with urinary AFM1 serving as a valid short-term biomarker of AFB1 exposure [21,22].
Biomonitoring is an effective method of assessing human exposure, as illustrated by results of earlier studies conducted in various populations that indicate common dietary exposure to major mycotoxins, albeit at different levels [23,24,25]. Analysis of suitable biomarkers in human body fluids provides useful insights into dietary exposure when food contaminant data are sparse or insufficient, as is often the case in developing countries [8,26,27]. Furthermore, toxigenic fungi and mycotoxins present in occupational and residential settings may lead to an extra exposure by inhalation or by dermal contact [28,29]. During the handling and processing of contaminated crops, spores and small particles of raw materials can give rise to mycotoxin exposures through organic dusts at certain workplaces [30,31,32]. Therefore, it is worthwhile to investigate whether workplace-related mycotoxin exposures will add significantly to those resulting from oral intake of contaminated food by analyzing mycotoxins and/or metabolites in biofluids of workers in ’risky’ settings and comparing the levels with those of control subjects [28,33,34]. A systematic review of studies with such a design, using a biomarker analysis of blood or urine samples, revealed that feed mill workers had the greatest exposure to mycotoxins, especially to aflatoxins [32]. This may be due to the usually poorer quality of raw materials for animal feeds than grains processed for human food.
In Bangladesh, data on AFB1 contamination of foods and feeds are sparse. An early survey found variable incidences of contamination in different commodities (e.g., 8% in rice and 67% in maize) and notably higher AFB1 levels in maize, groundnuts and poultry feed than in rice and pulses [35]. Aflatoxin analysis of crop samples from six districts of Bangladesh revealed also variable incidence rates and levels for maize, wheat and rice, with the highest values for maize [36]. A study of eight food commodities (rice, lentils, wheat flour, dates, betelnut, red chili powder, ginger, groundnuts) reported the highest aflatoxin levels in dates and groundnuts, and concentrations exceeded the US regulatory maximum regulatory limits in five of the eight commonly ingested food commodities tested [37]. In line with such findings, our biomonitoring studies on occurrence of AFM1 in the urine of adults and pregnant women and in milk of nursing mothers document widespread exposure to the mycotoxin AFB1 in the general population [8,38,39]. But there is currently no such data available for mill workers. Therefore, this study has determined the presence of AFM1 in the urine samples of cereal grain and spice mill workers in the Sylhet region in Bangladesh and compared the results with those obtained for control subjects in the same region. Correlating biomarker data with information collected on food habits aimed to identify major sources of AFB1 intake.

2. Results

2.1. Characteristics of the Study Groups

The group of mill workers comprises employees of three grain mills where rice, wheat and maize are processed and one spice mill (for chili peppers, turmeric, garam masala). The control group consisted of individuals recruited from the same region, including day laborers in other professions, rickshaw pullers, housewives, teachers, and businessmen (Table 1). Among the total of 76 participants, 51 were mill workers (37 men and 14 women), and 25 were controls (17 men and 8 women).
The average age was 38.76 years for mill workers and 38.64 years for the control group. The control group had a higher mean body mass index (BMI, 24.94 ± 3.45 kg/m2) compared to the mill workers (21.74 ± 3.07 kg/m2) (p < 0.001). This may be a chance finding as BMI ranges indicate that in both groups there were underweight and overweight people. There was no significant difference in the mean level of urinary creatinine between the mill workers (1.34 ± 0.91 mg/mL) and control group (1.78 ± 1.07 mg/mL). The majority of participants in both groups belonged to the low socioeconomic status group (82.4% vs. 88%) and had a primary or elementary level of education (over 70%).

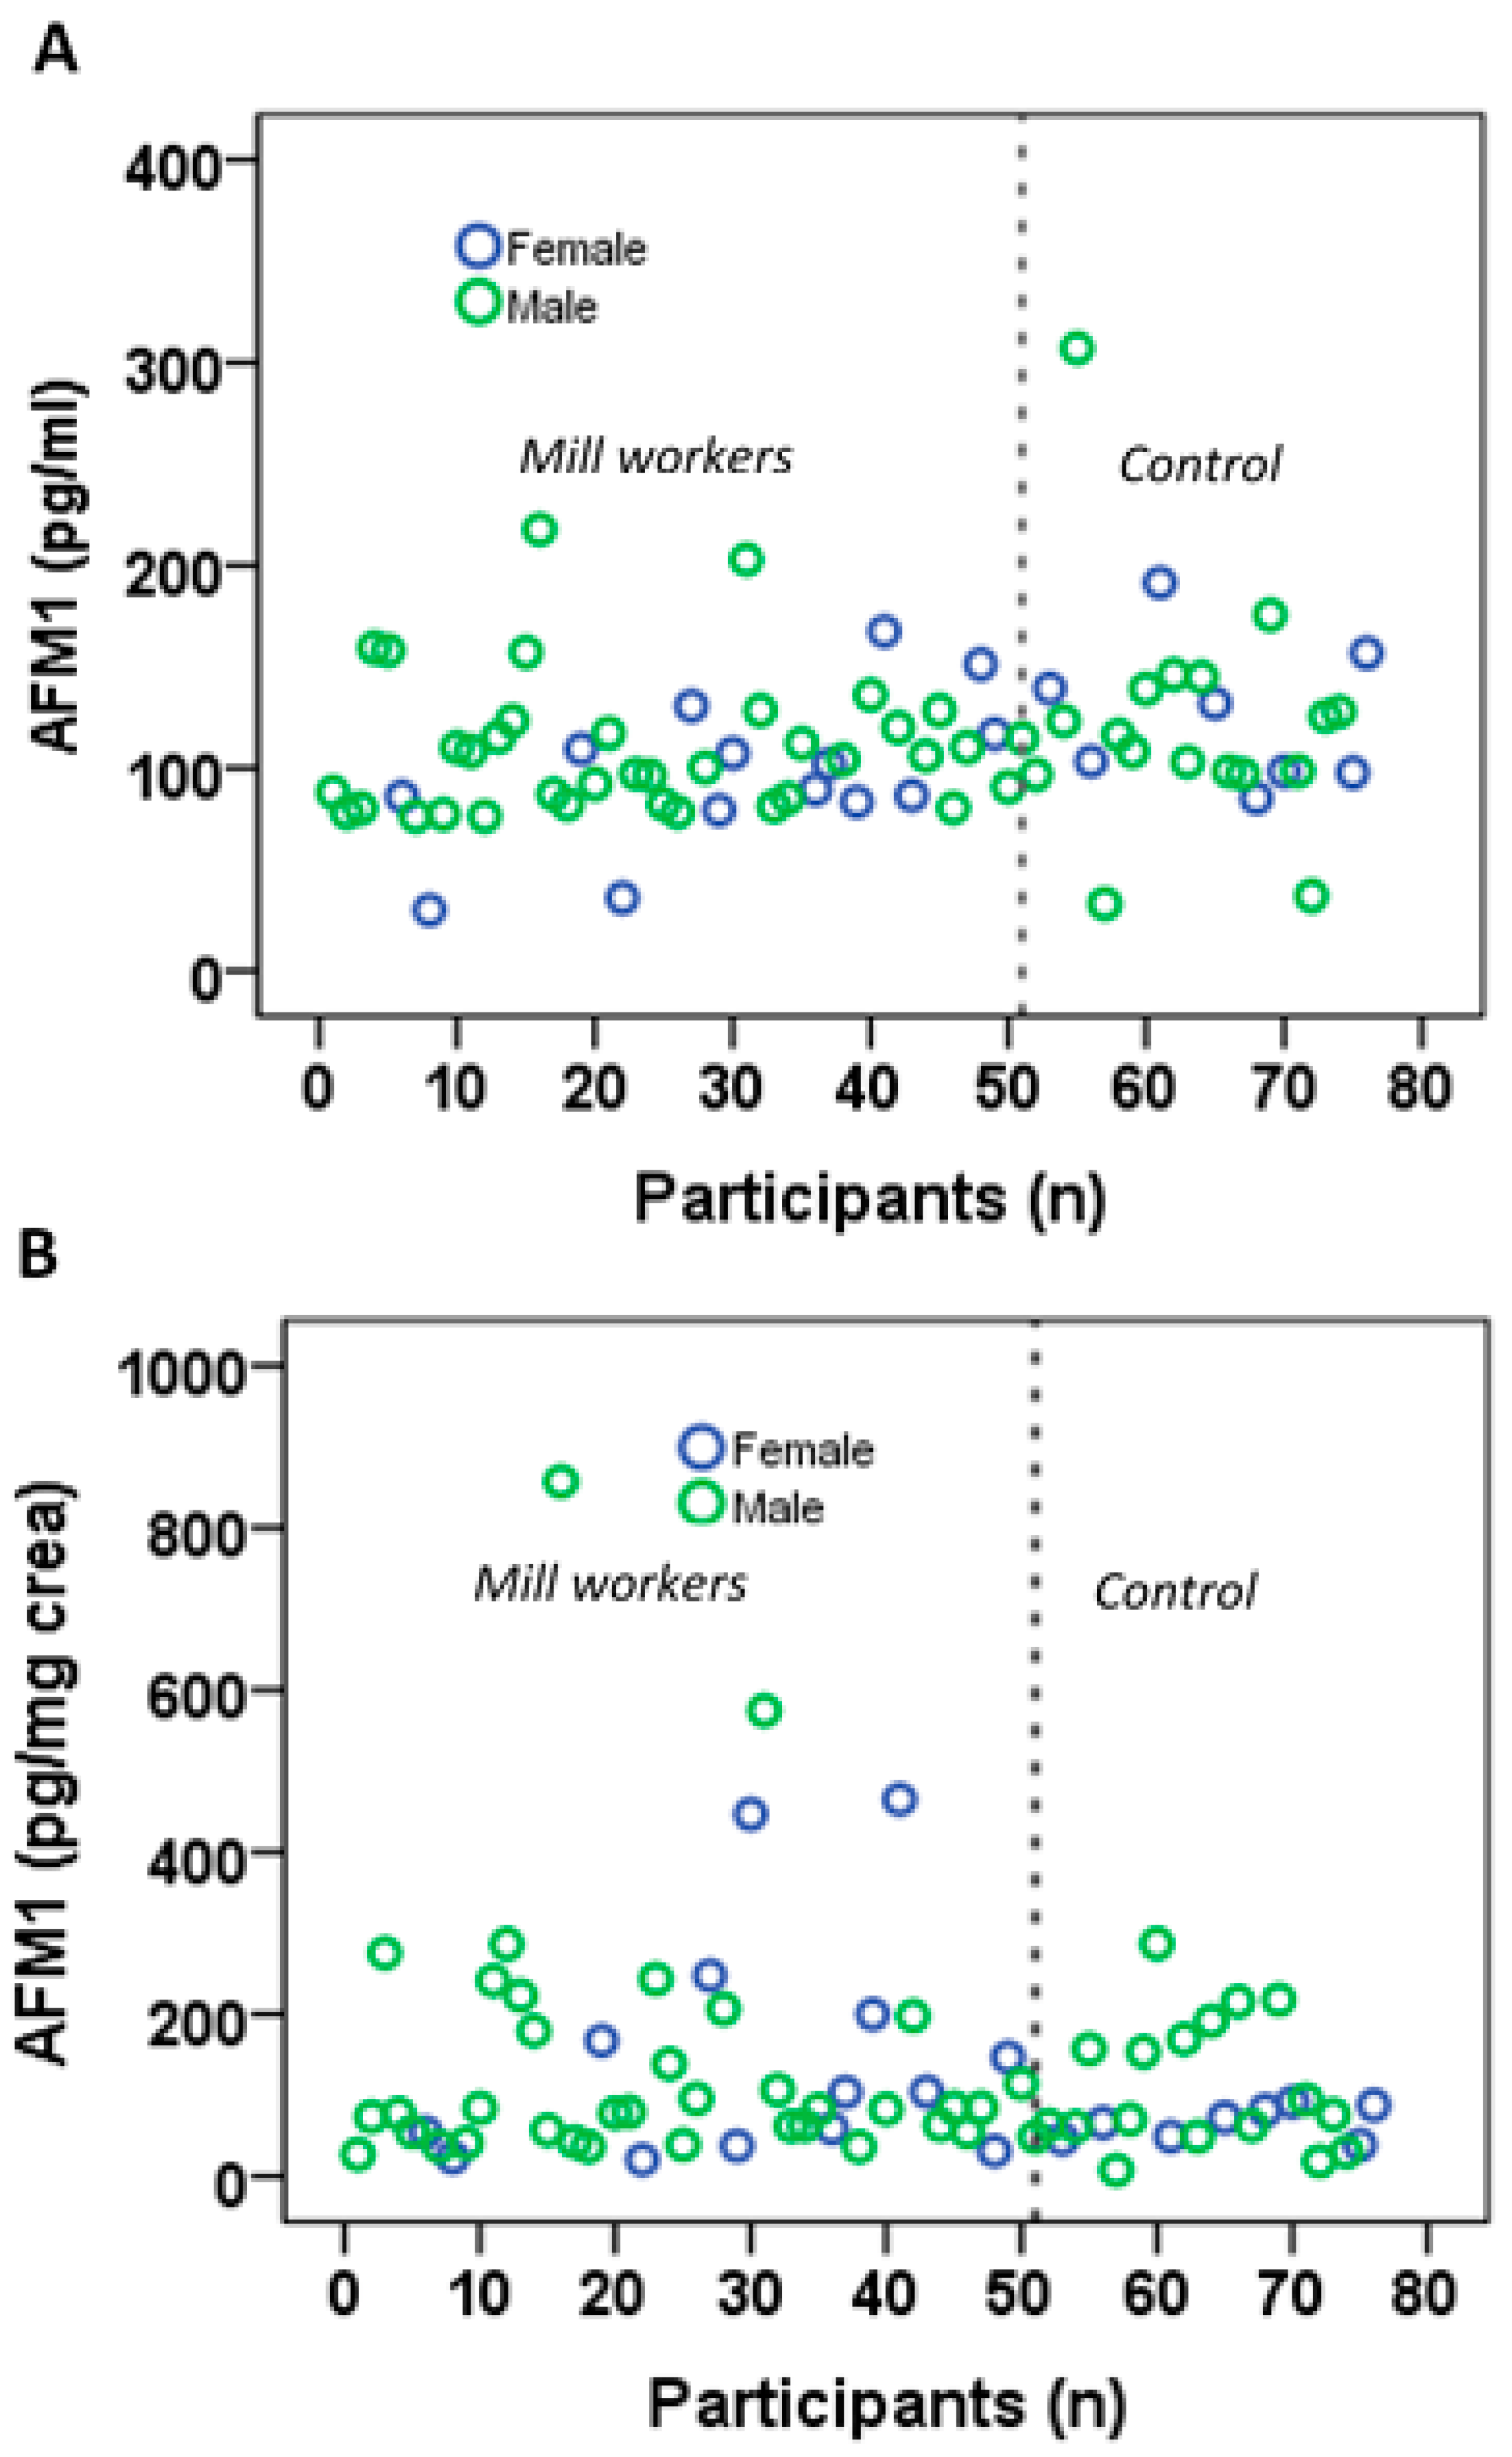
2.2. Levels of AFM1 in Urine of Mill Workers and Control Group

The detection frequency, levels and distribution of AFM1 in mill workers and controls are presented in Table 2 and Figure 1. AFM1 was found in 96.1% of mill workers’ urine samples with a range of LOD of 217.7 pg/mL and also in 92% of control group urine with a range of LOD of 307.0 pg/mL. The mean urinary AFM1 concentration in mill workers (106.5 ± 35.0 pg/mL) was slightly lower than in the control group (123.3 ± 52.4 pg/mL), whereas the mean AFM1 urinary level adjusted for creatinine was higher in mill workers (142.1 ± 126.1 pg/mg crea) than in the control group (98.5 ± 71.2 pg/mg crea). These and differences in the median AFM1 levels between groups did not reach statistical significance. Also, gender had no effect on AFM1 and creatinine-adjusted AFM1 levels, which is not surprising in light of the inter-individual variability in both groups (Figure 1).
In Table 3, the mill workers were grouped according to the different materials processed at the mills. All participants working in maize and spice mills had measurable levels of AFM1 in their urine (100%); % positive detects in rice mill (95%) and wheat mill (89%) workers were a bit lower. The mean AFM1 urine concentration was higher in workers from spice (116.3 ± 40.4 pg/mL) and maize (115.7 ± 26.4 pg/mL) mills compared to those working in rice (102.4 ± 32.7 pg/mL) and in wheat (92.6 ± 41.2 pg/mL) mills. After adjusting for creatinine, mean AFM1 levels were found to be higher in spice (205.0 ± 192.9 pg/mg crea) and in rice (146.5 ± 123.4 pg/mg crea) mill workers than in the other workers’ urine. Yet, it has to be noted that this comparison is based on a small number of subjects.

2.3. Relationship between AFM1 Biomarker Levels and Food Consumption

We classified all participants based on information in the questionnaires for ’regular’ rice consumption and rice consumption in the 2 days prior to urine collection (Table 4). We found that those who consumed rice more often (3 times/day or 5–6 times in 2 days) had higher mean AFM1 urine levels than those who consumed rice less frequently (1–2 times/day or 2–4 times in 2 days), a difference only significant for crea-adjusted AFM1 (p < 0.05) in the last two days before sampling. Then, possible correlations were assessed between individual food consumption patterns (regular and two days prior to sample collection) and the AFM1 levels found in urine samples. We compared consumption frequencies of major food items such as rice, wheat/maize, milk, pulses and groundnuts using Spearman correlation analysis (Table 5). The analysis showed a significant correlation between AFM1 levels and consumption of ground nuts in the regular and last two days food consumption groups (p < 0.01 and p < 0.05, respectively). Yet, no significant correlations were found between AFM1 levels and consumption frequency of rice, wheat/maize, milk and pulses.

3. Discussion

As outlined in the Introduction, dietary exposure to mycotoxins, in particular aflatoxins, is an issue of significant concern due to the widespread contamination of major food and feed commodities [6,9,11]. Moreover, there is also growing interest in the role of mycotoxins as health hazards in occupational settings, e.g., agricultural and food processing facilities, or the waste management sector [28,40]. The general population ingests mycotoxins mainly with contaminated foods, whilst workers in certain settings may have additional exposure by inhalation of mycotoxins with organic dusts when handling crops intended for human consumption or other materials such as animal feed [30]. Analysis of settled dust and ambient air monitoring attest the presence of toxigenic fungi and major mycotoxins, including aflatoxins, at various workplaces (references in [31,32]. Yet, assessing risks from workplace-related mycotoxin exposures is a challenging task due to uncertainties regarding the possible impact of a respiratory intake and/or by dermal contact [28]. To reduce these uncertainties, biomonitoring has been applied to investigate and compare biomarker levels in human fluids obtained from workers and from controls, i.e., non-occupationally exposed people. So far, studies on aflatoxins have used biomarker analysis (free or albumin-bound AFB1) of blood serum samples, reviewed in [31,32], whilst others have analyzed AFM1 in urine samples [34,41,42,43]. Studies conducted in different settings reported a higher proportion of positive samples and/or higher biomarker levels in workers than in controls, whilst others did not find a significant group difference.
The present biomarker-based study is the first one to investigate workplace-related exposure to aflatoxins in Bangladesh, namely in employees of grain and spice mills from the Sylhet city region, and in a local control group with only dietary mycotoxin exposure. The study results did not reveal significant differences in AFM1 biomarker concentrations between the mill workers and control subjects (Table 2). On the other hand, urine of the mill worker groups contained higher mean and maximal levels of crea-adjusted AFM1, indicative of a possible workplace exposure. When mill workers were grouped by the material processed (Table 3), workers of the spice mill had the highest average level of AFM1 (116.3 ± 40.4 pg/mL or 205.0 ± 192.9 pg/mg crea); workers of wheat mills presented the lowest biomarker levels (92.6 ± 41.2 pg/mL or 77.9 ± 26.0 pg/mg crea). Of note, studies in some Asian countries have reported the presence of aflatoxins in different spices [44,45,46,47], yet in Bangladesh, data on AFB1 contamination of spices and other food commodities are scarce.
Recent studies by others on workplace-related exposure to aflatoxins in Europe found overall clearly lower AFM1 biomarker levels than in our Bangladeshi mill workers. A study conducted in Italy measured a mean urinary AFM1 concentration of 35 pg/mL in feed mill workers and 27 pg/mL in controls [41]. A follow-up study in the same feedstuff plant with a refined analytical method for samples collected later on, detected AFM1 concentrations ranging from 1.9 to 10.5 pg/mL in 13% of the workers’ urine, yet they were not significantly different from values in concurrent controls [42]. A pilot study in France of nine workers during cleaning of a grain elevator detected AFM1 in four of nine urine samples at a mean level of 316 pg/mL and 413 pg/mg crea, indicative of an occupational exposure, which was probably due to rather high levels of AFB1 found in airborne dust samples [43].
The present biomarker data on mycotoxin exposure for our cohort from the Sylhet district may be further compared to results of a previous study conducted in Bangladesh which also used the ELISA technique to detect AFM1 in urine samples collected from rural and urban residents of the Rajshahi district [38]. In that study, AFM1 was detected in 46% of urine samples, at concentrations ranging from 31 to 348 pg/mL, with a mean AFM1 level of 80 ± 60 pg/mL and a crea-adjusted mean value of 130 ± 90 pg/mg crea. Two other studies in Bangladesh which used HPLC-FD reported similar and lower AFM1 levels in the urine of adults, a pregnant women cohort and in children that indicate widespread dietary mycotoxin exposure [8,26]. Considering this, we looked for a possible correlation between the individual biomarker levels and the consumption frequency of certain food categories in the present cohort. We found no significant correlation between urinary biomarker levels and the consumption of main staple food items ingested two days prior to urine sampling and regular food habits. However, we observed a significant correlation between the AFM1 biomarker levels and the consumption of groundnut, a finding in accord with previous reports on aflatoxin contamination of groundnuts in Bangladesh [35,37]. When rice consumption was categorized as low or high, higher levels of crea-adjusted mean AFM1 were observed in the high consumption group. Rice, being a primary food source in many Asian countries, can be contaminated with aflatoxins [48]. But rice is commonly consumed with curries prepared with various spices which may also be a source of AFB1 intake in the Bangladeshi population [8] since mycotoxin contamination of spices is known to occur in several Asian countries [44,45,46,47].
Our study had some limitations: There was evidence for a dusty environment at the workplaces, yet due to limited resources, we could not establish ambient monitoring for mycotoxins. We also could not collect information on occupational exposure variables (e.g., workspace volume, ventilation rate, humidity, temperature and working hours) that may affect the biomarker concentration. Furthermore, we used ELISA for the AFM1 analysis, which is less sensitive than HPLC-FD or LC-MS/MS analysis and may lead to a slight overestimation of biomarker values. Yet, a strength of our study is that we have detected AFM1 levels in a high percentage of both workers and control subjects. Even with a small number of participants, the biomarker results showed that both groups encountered widespread AFB1 exposure.

4. Conclusions

This pilot study revealed frequent presence of AFM1 in the urine of mill workers in Bangladesh and those of concurrent controls with dietary AFB1 exposure only. The absence of a statistical difference in mean biomarker levels for workers and controls suggests that in the specific setting, no extra occupational exposure occurred. Yet, the high prevalence of non-negligible AFM1 levels in the collected urine should trigger further biomonitoring studies at workplaces in the food and feed industry of Bangladesh.

5. Materials and Methods

5.1. Study Subjects and Sampling

A total of 76 participants were enrolled for this study, of which 51 were mill workers and 25 were healthy controls. The study was conducted in the Sylhet city region of Bangladesh between June 2021 and December 2021. The mill workers were selected from three different grain mills, including rice, wheat and maize mills, as well as a mill for spices (chili peppers, turmeric, mixed masala), where such items are processed for human food. The healthy control subjects were housewives, daily labor-based workers, rickshaw pullers, businessmen, and other people from the same region with no occupational contact to grains. Each participant provided about 50 mL morning urine sample in a non-sterile disposable container which was stored at −20 °C at the Department of Biochemistry and Molecular Biology of Shahjalal University of Science and Technology, Bangladesh. Urinary creatinine concentrations were measured to account for differences in urine dilution between individual spot urines [49]. Urine creatinine was measured with a colorimetric method according to the protocol provided by the manufacturer (HUMAN Gesellschaft für Biochemica und Diagnostica mbH, Wiesbaden, Germany) using a semi-automatic biochemistry analyzer (Humalyzer 3000, Medicon Services, Tuttlingen, Germany). All participants were asked to fill out a questionnaire providing anthropometric and demographic information as well as their food consumption habits. Written consent was obtained from all participants before they were included in the study. This study was approved by the Internal Ethics Review Board at the Department of Biochemistry and Molecular Biology, School of Life Sciences, Shahjalal University of Science and Technology, Sylhet, Bangladesh (Reference number: 01/BMB/2020).

5.2. Food Consumption Data

The food frequency questionnaire (FFQ) included questions on regular food consumption habits, as well as what participants had eaten in the past two days. It listed common food items typically consumed by the Bangladeshi population, such as rice, wheat, maize, pulses, milk and ground nuts. The questionnaire did not ask for information about the consumption of spices. The frequency of food consumption was graded 0 to 3, as shown in the footnote of Table 4. The only food item that the majority of participants consumed up to three times a day was rice.

5.3. Sample Preparation and AFM1 Analysis

Urinary AFM1 levels were measured using an enzyme-linked immunosorbent assay (ELISA) as described elsewhere [38]. The ELISA kits for aflatoxin M1 (Catalog #991AFLM01U-96) were purchased from Helica Biosystems Inc., Santa Ana, CA 92704, USA. The urine samples were centrifuged at 3200× g for 5 min, and the supernatant was used for AFM1 determination following the procedure specified in the method protocol. To summarize the procedure, both the AFM1 standards and urine samples were diluted with distilled water (1:20 v/v), and 100 μL of each was mixed with 200 μL assay buffer. Then, 100 μL of this mixture was transferred to an antibody-coated microtiter well, and the plate was incubated at room temperature (RT) for 1 h. The plate was washed with the wash buffer using an automated microplate washer (Wellwash™ Microplate Washer, Thermo Scientific, Waltham, MA, USA). In each well, 100 μL of AFM1 conjugate was added and incubated at RT for 15 min. After that, the plate was washed to remove the unbound conjugate. Then, 100 μL of substrate reagent was added to each well, and the color reaction was allowed to proceed for 15 min in the dark at RT. Later, 100 μL of stop solution was added to the wells to terminate the enzyme reaction. Within 15 min, absorbance was measured at 450 nm in a microplate reader (Apollo 11 LB 913, Berthold Technologies, Bad Wildbad, Germany). The absorption intensity is inversely proportional to the concentration of AFM1 in the samples. The level of AFM1 in the samples was calculated from the concurrent standard curves. To validate the method, two different concentrations (60 and 100 pg/mL) of AFM1 standard were added to blank urine samples, and the recovery rate was found to be in the range of 85–105%. The method detection limit (LOD) was determined to be 40 pg/mL.

5.4. Statistical Analysis

The data were analyzed using IBM SPSS Statistics version 22. Descriptive analysis was performed to determine the mean, median and interquartile range of the analyte. The baseline characteristics and analyte concentration differences between the mill workers and control group or gender were analyzed using an independent sample t-test. Chi-square test was applied for categorical variables. AFM1 levels within the mill worker groups were compared using ANOVA test. The Spearman correlation coefficient (two-tailed) was used to assess correlations between food consumption and urinary AFM1 concentration. A statistical significance level of alpha p < 0.05 was assigned.

Author Contributions

Conceptualization, N.A.; data curation, A.H., F.M. and H.R.T.; formal analysis, N.A. and A.H.; funding acquisition, N.A.; investigation, N.A.; methodology, A.H. and F.M.; software, N.A. and A.H.; supervision, N.A.; validation, G.H.D.; writing—original draft, N.A.; writing—review and editing, N.A. and G.H.D. All authors have read and agreed to the published version of the manuscript.

Funding

This study was not externally funded but supported by an internal grant.

Institutional Review Board Statement

This study was approved by the Internal Ethics Review Board at the Department of Biochemistry and Molecular Biology, School of Life Sciences, Shahjalal University of Science and Technology, Sylhet, Bangladesh (Reference number: 01/BMB/2020).

Informed Consent Statement

Written consent was obtained from all participants before they were included in the study.

Data Availability Statement

Data are available from the corresponding author upon reasonable request.

Acknowledgments

The authors would like to express their gratitude towards all the study participants for their active participation. We are also grateful for helpful comments from two referees on an earlier version of the manuscript.

Conflicts of Interest

The authors declare no conflicts of interest.

References

  1. Zhu, Y.; Sang, S. Phytochemicals in Whole Grain Wheat and Their Health-promoting Effects. Mol. Nutr. Food Res. 2017, 61, 1600852. [Google Scholar] [CrossRef] [PubMed]
  2. Tieri, M.; Ghelfi, F.; Vitale, M.; Vetrani, C.; Marventano, S.; Lafranconi, A.; Godos, J.; Titta, L.; Gambera, A.; Alonzo, E.; et al. Whole Grain Consumption and Human Health: An Umbrella Review of Observational Studies. Int. J. Food Sci. Nutr. 2020, 71, 668–677. [Google Scholar] [CrossRef] [PubMed]
  3. Paterson, R.R.M.; Lima, N. How Will Climate Change Affect Mycotoxins in Food? Food Res. Int. 2010, 43, 1902–1914. [Google Scholar] [CrossRef]
  4. Pitt, J.I.; Taniwaki, M.H.; Cole, M.B. Mycotoxin Production in Major Crops as Influenced by Growing, Harvesting, Storage and Processing, with Emphasis on the Achievement of Food Safety Objectives. Food Control 2013, 32, 205–215. [Google Scholar] [CrossRef]
  5. Van Der Fels-Klerx, H.J.; Klemsdal, S.; Hietaniemi, V.; Lindblad, M.; Ioannou-Kakouri, E.; Van Asselt, E.D. Mycotoxin Contamination of Cereal Grain Commodities in Relation to Climate in North West Europe. Food Addit. Contam. Part A 2012, 29, 1581–1592. [Google Scholar] [CrossRef]
  6. Eskola, M.; Kos, G.; Elliott, C.T.; Hajšlová, J.; Mayar, S.; Krska, R. Worldwide Contamination of Food-Crops with Mycotoxins: Validity of the Widely Cited ‘FAO Estimate’ of 25%. Crit. Rev. Food Sci. Nutr. 2020, 60, 2773–2789. [Google Scholar] [CrossRef]
  7. Loi, M.; Logrieco, A.F.; Pusztahelyi, T.; Leiter, É.; Hornok, L.; Pócsi, I. Advanced Mycotoxin Control and Decontamination Techniques in View of an Increased Aflatoxin Risk in Europe Due to Climate Change. Front. Microbiol. 2023, 13, 1085891. [Google Scholar] [CrossRef]
  8. Ali, N.; Blaszkewicz, M.; Hossain, K.; Degen, G.H. Determination of Aflatoxin M1 in Urine Samples Indicates Frequent Dietary Exposure to Aflatoxin B1 in the Bangladeshi Population. Int. J. Hyg. Environ. Health 2017, 220, 271–281. [Google Scholar] [CrossRef]
  9. Food and Agriculture Organization of the United Nations (FAO); World Health Organization (WHO). Aflatoxins. Safety Evaluation of Certain Contaminants in Food: Prepared by the 83rd Meeting of the Joint FAO/WHO Expert Committee on Food Additives (JECFA). WHO Addit. Ser. 2018, 2, 280. [Google Scholar]
  10. Rushing, B.R.; Selim, M.I. Aflatoxin B1: A Review on Metabolism, Toxicity, Occurrence in Food, Occupational Exposure, and Detoxification Methods. Food Chem. Toxicol. 2019, 124, 81–100. [Google Scholar] [CrossRef]
  11. IARC. Working Group Report No. 9, Mycotoxin Control in Lowand Middle Income Countries; Wild, C.P., Miller, J.D., Groopman, J.D., Eds.; IARC Publicationlyon: Lyon, France, 2015. [Google Scholar]
  12. Wild, C.P.; Turner, P.C. The Toxicology of Aflatoxins as a Basis for Public Health Decisions. Mutagenesis 2002, 17, 471–481. [Google Scholar] [CrossRef] [PubMed]
  13. Kensler, T.W.; Roebuck, B.D.; Wogan, G.N.; Groopman, J.D. Aflatoxin: A 50-Year Odyssey of Mechanistic and Translational Toxicology. Toxicol. Sci. 2011, 120, S28–S48. [Google Scholar] [CrossRef]
  14. Saha Turna, N.; Comstock, S.S.; Gangur, V.; Wu, F. Effects of Aflatoxin on the Immune System: Evidence from Human and Mammalian Animal Research. Crit. Rev. Food Sci. Nutr. 2023, 1–19. [Google Scholar] [CrossRef] [PubMed]
  15. IARC International Agency for Research on Cancer. Aflatoxins. In Chemical Agents and Related Occupations; IARC Monographs on the Evaluation of Carcinogenic Risks to Humans, No. 100F; IARC Press: Lyon, France, 2012; pp. 225–248. [Google Scholar]
  16. Liu, Y.; Wu, F. Global Burden of Aflatoxin-Induced Hepatocellular Carcinoma: A Risk Assessment. Environ. Health Perspect. 2010, 118, 818–824. [Google Scholar] [CrossRef]
  17. Giovati, L.; Magliani, W.; Ciociola, T.; Santinoli, C.; Conti, S.; Polonelli, L. AFM1 in Milk: Physical, Biological, and Prophylactic Methods to Mitigate Contamination. Toxins 2015, 7, 4330–4349. [Google Scholar] [CrossRef] [PubMed]
  18. BFSA Bangladesh Food Safety Authority. Food Safety Regulations. 2017. Available online: https://apps.fas.usda.gov/newgainapi/api/Report/DownloadReportByFileName?fileName=Bangladesh%20issues%20Regulation%20on%20Food%20Safety%202017%20_Dhaka_Bangladesh_03-06-2021 (accessed on 10 December 2023).
  19. Marchese, S.; Polo, A.; Ariano, A.; Velotto, S.; Costantini, S.; Severino, L. Aflatoxin B1 and M1: Biological Properties and Their Involvement in Cancer Development. Toxins 2018, 10, 214. [Google Scholar] [CrossRef]
  20. Panel, E.C. Scientific Opinion—Risk Assessment of Aflatoxins in Food. EFSA J. 2020, 18, e06040. [Google Scholar] [CrossRef]
  21. Turner, P.C.; Flannery, B.; Isitt, C.; Ali, M.; Pestka, J. The Role of Biomarkers in Evaluating Human Health Concerns from Fungal Contaminants in Food. Nutr. Res. Rev. 2012, 25, 162–179. [Google Scholar] [CrossRef]
  22. Vidal, A.; Mengelers, M.; Yang, S.; De Saeger, S.; De Boevre, M. Mycotoxin Biomarkers of Exposure: A Comprehensive Review. Comp. Rev. Food Sci. Food Safe 2018, 17, 1127–1155. [Google Scholar] [CrossRef]
  23. Gerding, J.; Ali, N.; Schwartzbord, J.; Cramer, B.; Brown, D.L.; Degen, G.H.; Humpf, H.-U. A Comparative Study of the Human Urinary Mycotoxin Excretion Patterns in Bangladesh, Germany, and Haiti Using a Rapid and Sensitive LC-MS/MS Approach. Mycotoxin Res. 2015, 31, 127–136. [Google Scholar] [CrossRef]
  24. Solfrizzo, M.; Gambacorta, L.; Visconti, A. Assessment of Multi-Mycotoxin Exposure in Southern Italy by Urinary Multi-Biomarker Determination. Toxins 2014, 6, 523–538. [Google Scholar] [CrossRef] [PubMed]
  25. Heyndrickx, E.; Sioen, I.; Huybrechts, B.; Callebaut, A.; De Henauw, S.; De Saeger, S. Human Biomonitoring of Multiple Mycotoxins in the Belgian Population: Results of the BIOMYCO Study. Environ. Int. 2015, 84, 82–89. [Google Scholar] [CrossRef] [PubMed]
  26. Ali, N.; Manirujjaman, M.; Rana, S.; Degen, G.H. Determination of Aflatoxin M1 and Deoxynivalenol Biomarkers in Infants and Children Urines from Bangladesh. Arch. Toxicol. 2020, 94, 3775–3786. [Google Scholar] [CrossRef] [PubMed]
  27. Abdallah, M.F.; Gado, M.; Abdelsadek, D.; Zahran, F.; El-Salhey, N.N.; Mehrez, O.; Abdel-Hay, S.; Mohamed, S.M.; De Ruyck, K.; Yang, S.; et al. Mycotoxin Contamination in the Arab World: Highlighting the Main Knowledge Gaps and the Current Legislation. Mycotoxin Res. 2023. [Google Scholar] [CrossRef] [PubMed]
  28. Degen, G. Tools for Investigating Workplace-Related Risks from Mycotoxin Exposure. WMJ 2011, 4, 315–327. [Google Scholar] [CrossRef]
  29. Fromme, H.; Gareis, M.; Völkel, W.; Gottschalk, C. Overall Internal Exposure to Mycotoxins and Their Occurrence in Occupational and Residential Settings—An Overview. Int. J. Hyg. Environ. Health 2016, 219, 143–165. [Google Scholar] [CrossRef]
  30. Straumfors, A.; Uhlig, S.; Eriksen, G.S.; Heldal, K.K.; Eduard, W.; Krska, R.; Sulyok, M. Mycotoxins and Other Fungal Metabolites in Grain Dust from Norwegian Grain Elevators and Compound Feed Mills. WMJ 2015, 8, 361–373. [Google Scholar] [CrossRef]
  31. Viegas, S.; Viegas, C.; Oppliger, A. Occupational Exposure to Mycotoxins: Current Knowledge and Prospects. Ann. Work Expo. Health 2018, 62, 923–941. [Google Scholar] [CrossRef]
  32. Franco, L.T.; Ismail, A.; Amjad, A.; de Oliveira, C.A.F. Occurrence of Toxigenic Fungi and Mycotoxins in Workplaces and Human Biomonitoring of Mycotoxins in Exposed Workers: A Systematic Review. Toxin Rev. 2021, 40, 576–591. [Google Scholar] [CrossRef]
  33. Föllmann, W.; Ali, N.; Blaszkewicz, M.; Degen, G.H. Biomonitoring of Mycotoxins in Urine: Pilot Study in Mill Workers. J. Toxicol. Environ. Health Part A 2016, 79, 1015–1025. [Google Scholar] [CrossRef]
  34. Viegas, S.; Assunção, R.; Martins, C.; Nunes, C.; Osteresch, B.; Twarużek, M.; Kosicki, R.; Grajewski, J.; Ribeiro, E.; Viegas, C. Occupational Exposure to Mycotoxins in Swine Production: Environmental and Biological Monitoring Approaches. Toxins 2019, 11, 78. [Google Scholar] [CrossRef]
  35. Dawlatana, M.; Coker, R.D.; Nagler, M.J.; Wild, C.P.; Hassan, M.S.; Blunden, G. The Occurrence of Mycotoxins in Key Commodities in Bangladesh: Surveillance Results from 1993 to 1995. J. Nat. Toxins 2002, 11, 379–386. [Google Scholar] [PubMed]
  36. Bhuiyan, M.N.H.; Hassan, M.T.; Begum, M.; Ahan, M.; Rahim, M. Occurrence and Seasonal Trends of Aflatoxin in Rice, Maize and Wheat in Bangladesh. Int. J. Sustain. Agril. Tech. 2013, 9, 8–14. [Google Scholar]
  37. Roy, M.; Harris, J.; Afreen, S.; Deak, E.; Gade, L.; Balajee, S.A.; Park, B.; Chiller, T.; Luby, S. Aflatoxin Contamination in Food Commodities in Bangladesh. Food Addit. Contam. Part B 2013, 6, 17–23. [Google Scholar] [CrossRef] [PubMed]
  38. Ali, N.; Hossain, K.; Blaszkewicz, M.; Rahman, M.; Mohanto, N.C.; Alim, A.; Degen, G.H. Occurrence of Aflatoxin M1 in Urines from Rural and Urban Adult Cohorts in Bangladesh. Arch. Toxicol 2016, 90, 1749–1755. [Google Scholar] [CrossRef] [PubMed]
  39. Islam, F.; Das Trisha, A.; Hafsa, J.M.; Hasan, A.; Degen, G.H.; Ali, N. Occurrence of Aflatoxin M1 in Human Breast Milk in Bangladesh. Mycotoxin Res. 2021, 37, 241–248. [Google Scholar] [CrossRef]
  40. Mayer, S.; Engelhart, S.; Kolk, A.; Blome, H. The Significance of Mycotoxins in the Framework of Assessing Workplace Related Risks. Mycotox. Res. 2008, 24, 151–164. [Google Scholar] [CrossRef]
  41. Ferri, F.; Brera, C.; De Santis, B.; Fedrizzi, G.; Bacci, T.; Bedogni, L.; Capanni, S.; Collini, G.; Crespi, E.; Debegnach, F.; et al. Survey on Urinary Levels of Aflatoxins in Professionally Exposed Workers. Toxins 2017, 9, 117. [Google Scholar] [CrossRef]
  42. Debegnach, F.; Brera, C.; Mazzilli, G.; Sonego, E.; Buiarelli, F.; Ferri, F.; Rossi, P.G.; Collini, G.; De Santis, B. Optimization and Validation of a LC-HRMS Method for Aflatoxins Determination in Urine Samples. Mycotoxin Res. 2020, 36, 257–266. [Google Scholar] [CrossRef]
  43. Ndaw, S.; Jargot, D.; Antoine, G.; Denis, F.; Melin, S.; Robert, A. Investigating Multi-Mycotoxin Exposure in Occupational Settings: A Biomonitoring and Airborne Measurement Approach. Toxins 2021, 13, 54. [Google Scholar] [CrossRef]
  44. Abrar, M.; Ahsan, S.; Nadeem, M.; Liaqat, A.; Chughtai, M.F.J.; Farooq, M.A.; Mehmood, T.; Khaliq, A.; Siddiqa, A. Detection and Quantification of Aflatoxins in Spices Stored in Different Food Packaging Materials. J. Stored Prod. Res. 2023, 101, 102081. [Google Scholar] [CrossRef]
  45. Zhao, X.; Schaffner, D.W.; Yue, T. Quantification of Aflatoxin Risk Associated with Chinese Spices: Point and Probability Risk Assessments for Aflatoxin B1. Food Control 2013, 33, 366–377. [Google Scholar] [CrossRef]
  46. Yogendrarajah, P.; Jacxsens, L.; De Saeger, S.; De Meulenaer, B. Co-Occurrence of Multiple Mycotoxins in Dry Chilli (Capsicum Annum L.) Samples from the Markets of Sri Lanka and Belgium. Food Control 2014, 46, 26–34. [Google Scholar] [CrossRef]
  47. Zareshahrabadi, Z.; Bahmyari, R.; Nouraei, H.; Khodadadi, H.; Mehryar, P.; Asadian, F.; Zomorodian, K. Detection of Aflatoxin and Ochratoxin A in Spices by High-Performance Liquid Chromatography. J. Food Qual. 2020, 2020, e8858889. [Google Scholar] [CrossRef]
  48. Ali, N. Aflatoxins in Rice: Worldwide Occurrence and Public Health Perspectives. Toxicol. Rep. 2019, 6, 1188–1197. [Google Scholar] [CrossRef]
  49. UBA (Umweltbundesamt). Normierung von Stoffgehalten im Urin—Kreatinin: Stellungnahme der Kommission “Human-Biomonitoring“ des Umweltbundesamtes. Bundesgesundheitsbl. Gesundheitsf. Gesundheitsschutz 2005, 48, 616–618. [Google Scholar] [CrossRef]
Figure 1. Distribution of normal (A) and creatinine-adjusted (B) AFM1 in urine of the participants (n 1–51 are mill workers, and n 52–76 are control subjects).
Toxins 16 00045 g001
Table 1. Baseline characteristics of the participants.
VariablesMill WorkersControl Groupp-Value
Subjects (n)5125-
Mill-based workers (n)
Rice20--
Wheat9--
Maize 11--
Spices11
Gender (m/f)37/1417/80.439
Age (years)38.76 ± 10.9238.64 ± 10.210.961
BMI (kg/m2)
  Mean ± SD21.74 ± 3.0724.94 ± 3.45<0.001
  Range16.69–30.4719.38–29.76-
Creatinine (mg/mL) 1.34 ± 0.911.78 ± 1.070.086
Socioeconomic status (n, %) 0.170
  Low42 (82.4)22 (88.0)
  Medium8 (15.7)1 (4.0)
  Upper medium1 (2.0)2 (8.0)
Education level (n, %) 0.347
  Primary37 (72.5)18 (72.0)
  Secondary12 (23.5)4 (16.0)
  Above secondary2 (3.9)3 (12.0)
Values are presented as mean ± standard deviation or n (%). p-values are obtained from independent sample t-test for continuous variable and chi square test for categorical variables.
Table 2. Occurrence and levels of AFM1 in the mill workers and control groups.
GroupnPositive
n (%)
Mean ± SDMedianMaximum
pg/mLpg/mg Creapg/mLpg/mg Creapg/mLpg/mg Crea
Mill workersMale3737 (100.0)109.7 ± 33.9138.8 ± 131.3104.182.5217.7857.1
Female1412 (85.7)98.2 ± 37.9150.8 ± 126.995.7104.3167.4465.1
Total5149 (96.1)106.5 ± 35.0142.1 ± 126.1102.083.1217.7857.1
ControlsMale1715 (88.2)122.2 ± 59.5113.3 ± 81.8116.476.2307.0287.3
Female88 (100.0)125.5 ± 36.2 66.8 ± 20.1117.569.4191.491.6
Total2523 (92.0)123.3 ± 52.4 98.5 ± 71.2116.4 72.6307.0287.3
Positive samples refer to urine containing the analyte ≥ limit of detection (LOD: 40 pg/mL). Samples below LOD were assigned half of LOD during calculation of mean and median values.
Table 3. Occurrence and levels of AFM1 in urine of different subgroups of mill workers.
SamplesnPositive
n (%)
Mean ± SDMedianMax
pg/mLpg/mg Creapg/mLpg/mg Creapg/mLpg/mg Crea
Rice mill workers2019 (95.0)102.4 ± 32.7146.5 ± 123.498.789.6202.8574.5
Wheat mill workers98 (88.9)92.6 ± 41.273.9 ± 57.980.254.6159.3275.5
Maize mill workers1111 (100.0)115.7 ± 26.4127.0 ± 111.8114.784.9167.4465.1
Spices mill workers1111 (100.0)116.3 ± 40.4205.0 ± 192.9109.3167.7217.7857.1
Positive samples refer to urine containing the analyte ≥ limit of detection (LOD: 40 pg/mL). Samples below LOD were assigned half of LOD during calculation of mean and median values.
Table 4. Urinary AFM1 biomarker levels and regular or last two days of rice consumption prior to urine donation of all study participants.
NAFM1 (pg/mL)AFM1 (pg/mg Crea)
Mean ± SDMaxMean ± SDMax
Regular rice consumption
    1–2 times/day17117.5 ± 26.0159.3103.0 ± 60.8247.8
    3 times/day59110.5 ± 45.6307.0134.9 ± 129.7857.1
Last 2 days rice consumption
    2–4 times/2 days17114.7 ± 27.1159.390.7 ± 49.7198.0
    5–6 times/2 days59111.3 ± 45.5307.0138.5 ± 129.9 *857.1
* p < 0.05 when compared to 2–4 times/day in the last 2 days rice consumption group. p-value is derived from independent sample t-test.
Table 5. Correlation of urinary AFM1 concentrations and food consumption frequency #.
Food ItemsRegular Food Consumption HabitsLast 2 Days Food Consumption
Correlation (r)p-ValueCorrelation (r)p-Value
Rice0.0350.7620.0380.725
Wheat/maize0.1440.2140.1860.108
Milks0.1360.2430.2080.071
Pulses0.0830.4740.0150.898
Ground nuts0.3040.0080.2590.024
# Assessment of food consumption frequency was carried out using numerical scores for the following food items; for rice: 1 = 1 time/day, 2 = 2 times/day, 3 = 3 times/day; wheat/maize: 0 = 0 time/day, 1 = 1 time/day, 2 = 2 times/day; milk: 0 = 0 time/day, 1 = 1 time/day; pulses: 0 = 0 time/day, 1 = 1 time/day, 2 = 2 times/day; groundnut: 0 = 0 time/day, 1 = 1 time/day, 2 = 2 times/day. p-values are obtained from Spearman’s correlation coefficient (two-tailed).
Disclaimer/Publisher’s Note: The statements, opinions and data contained in all publications are solely those of the individual author(s) and contributor(s) and not of MDPI and/or the editor(s). MDPI and/or the editor(s) disclaim responsibility for any injury to people or property resulting from any ideas, methods, instructions or products referred to in the content.

