Article

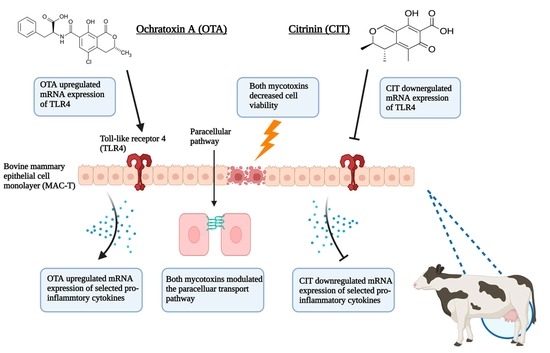
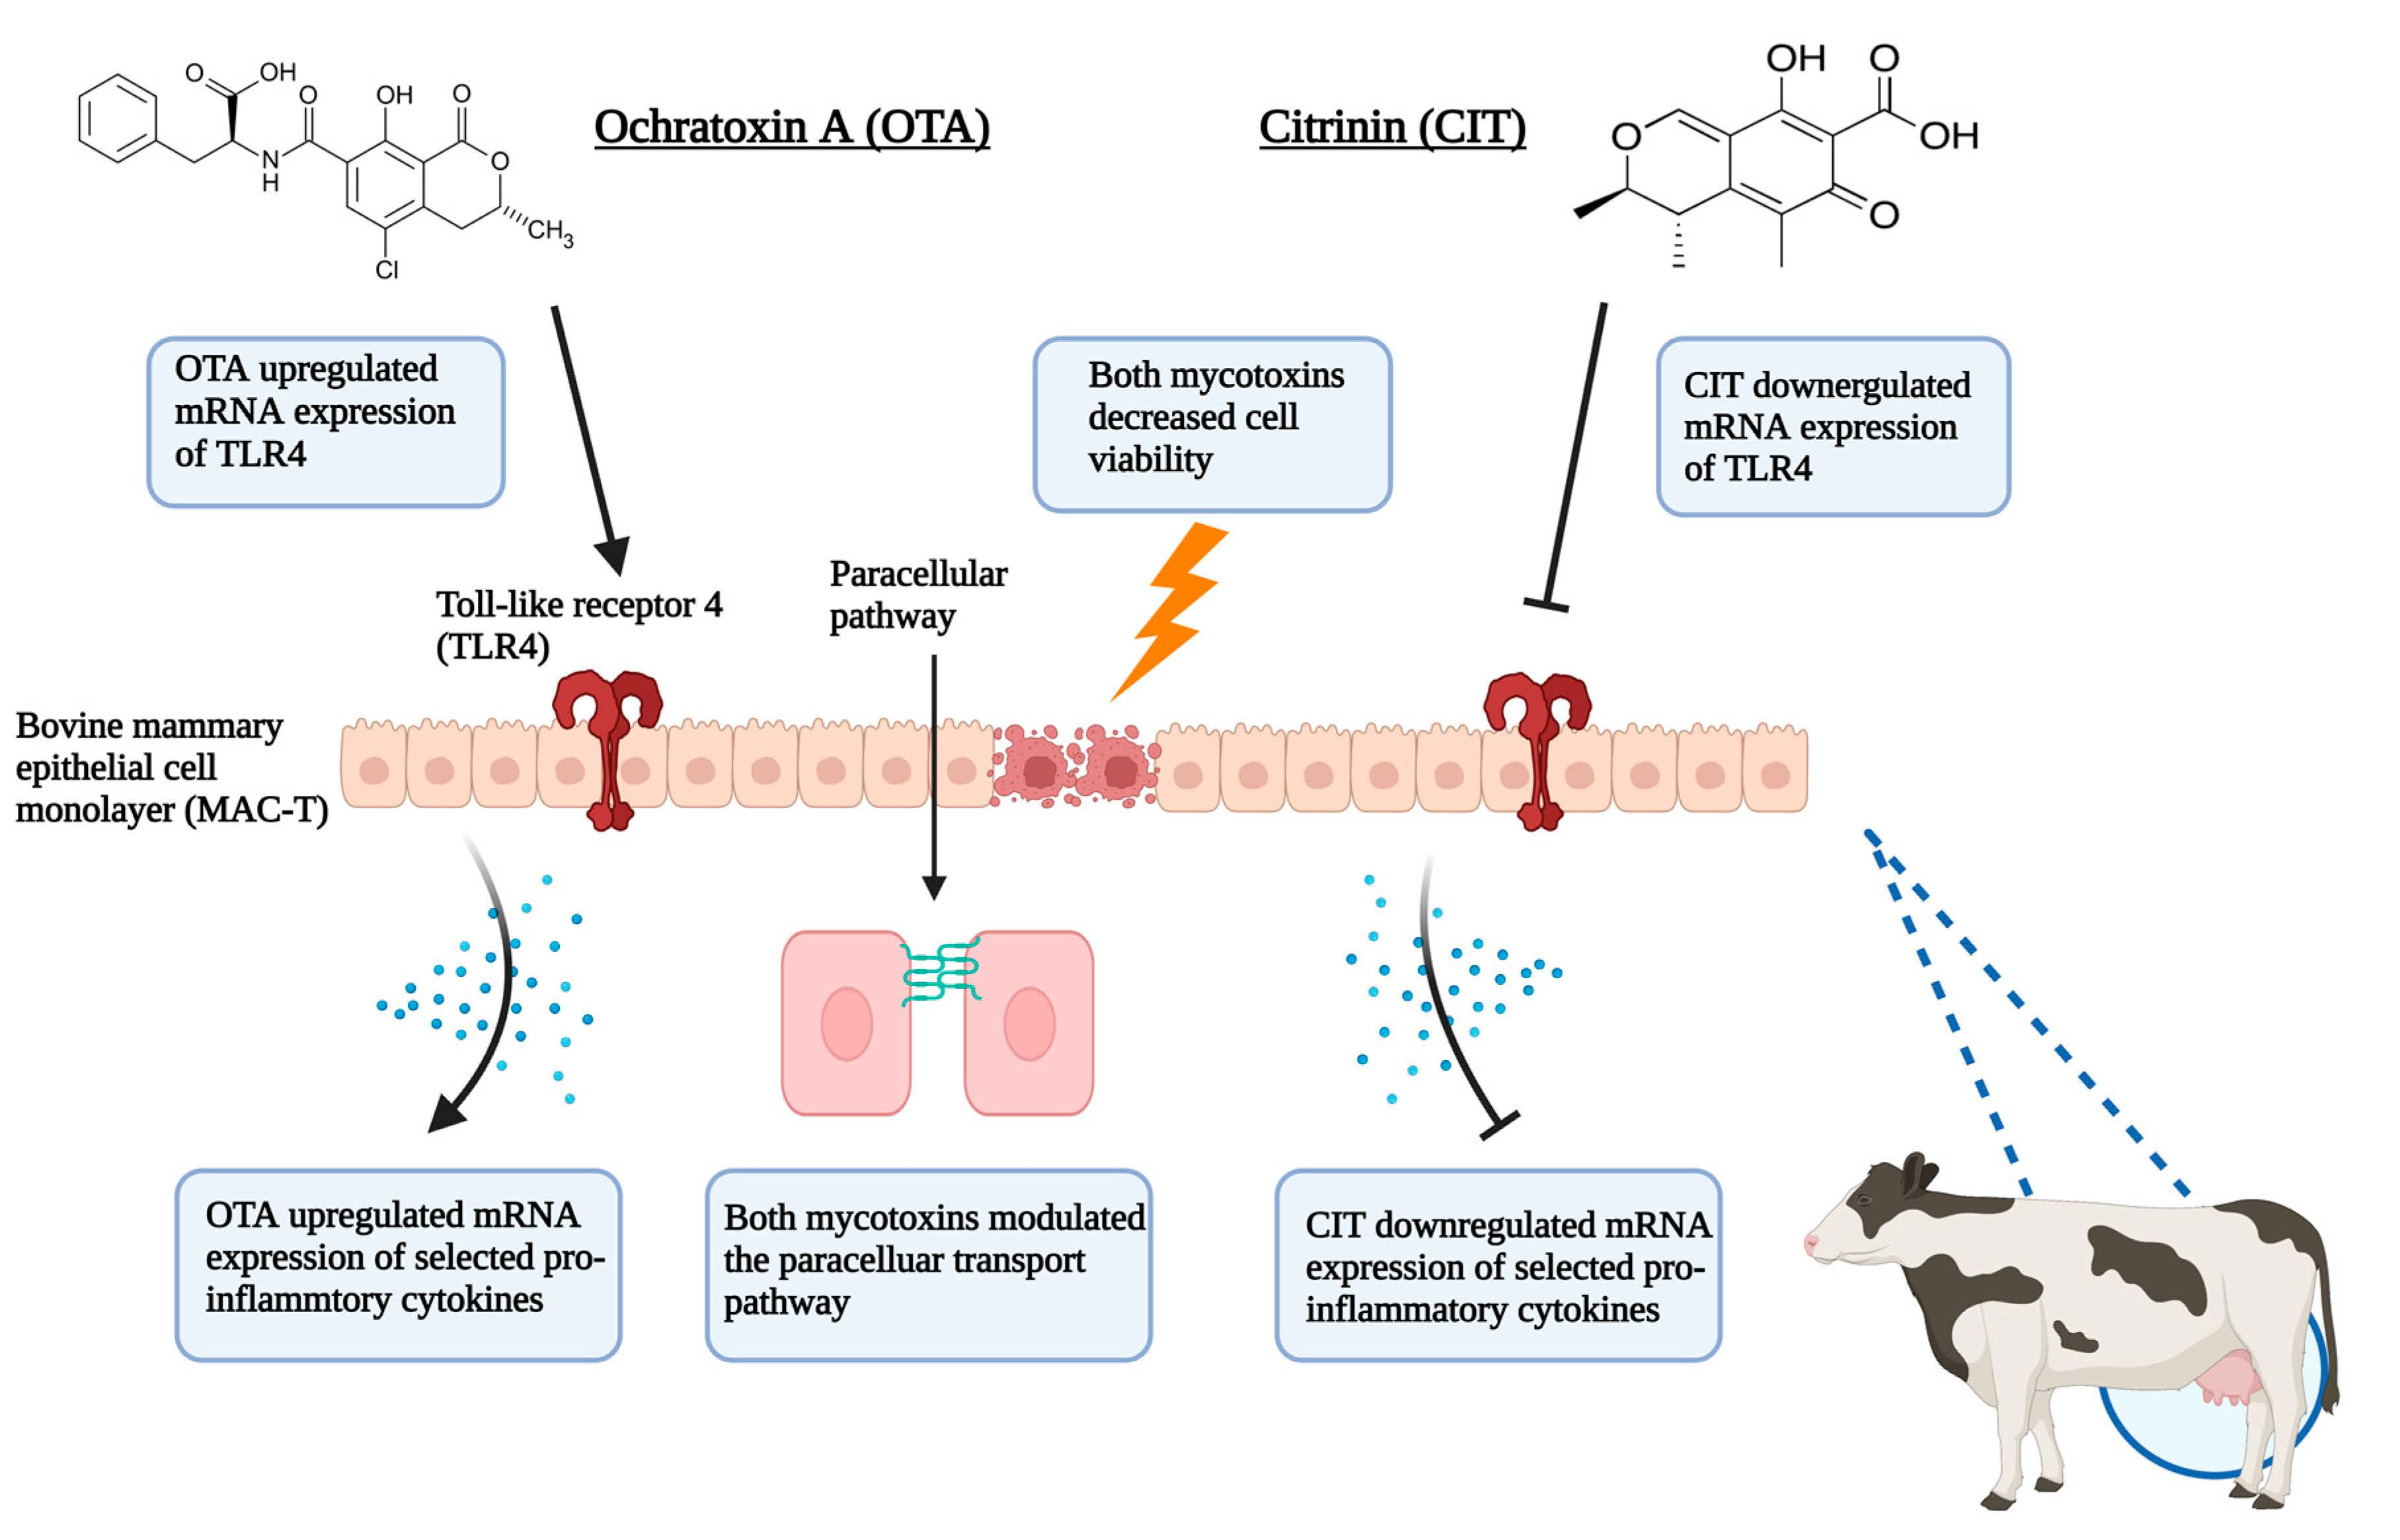
Ochratoxin A and Citrinin Differentially Modulate Bovine Mammary Epithelial Cell Permeability and Innate Immune Function

1
Department of Animal Biosciences, University of Guelph, Guelph, ON N1G 2W1, Canada
2
Alltech Inc., Center for Animal Nutrigenomics and Applied Animal Nutrition, 3031 Catnip Hill Road, Nicholasville, KY 40356, USA
*
Author to whom correspondence should be addressed.
Toxins 2022, 14(9), 640; https://doi.org/10.3390/toxins14090640
Submission received: 30 July 2022 / Revised: 8 September 2022 / Accepted: 12 September 2022 / Published: 16 September 2022
(This article belongs to the Special Issue Effects of Feedborne Mycotoxins on Animal Health 2.0)

Abstract

:
Frequent detection of mycotoxins ochratoxin A (OTA) and citrinin (CIT) in ruminant feed and feedstuff can be a potential threat to feed safety, animal performance and health. Ineffective biodegradation of these mycotoxins by rumen microflora following ingestion of contaminated feeds can lead to their circulatory transport to tissues such as mammary gland as the result of their biodistribution throughout the body. The bovine mammary epithelium plays a pivotal role in maintaining milk yield and composition and contributes to innate immune defense of the udder. The present study is the first to investigate individual effects of OTA and CIT on barrier and innate immune functions of the bovine mammary epithelium using a bovine mammary epithelial cell line (MAC-T). Results indicated that OTA and CIT exposure for 48 h significantly decreased cell viability in a concentration-dependent manner (p < 0.05). A decrease in transepithelial electrical resistance and increase in paracellular flux of FITC-40 kDa dextran was significantly induced by OTA treatment (p < 0.05), but not by CIT after 48 h exposure. qPCR was performed for assessment of expression of tight-junction proteins, Toll-like receptor 4 (TLR4) and cytokines after 4, 24 and 48 h of exposure. Both OTA and CIT markedly downregulated expression of claudin 3 and occludin (p < 0.05), whereas CIT did not affect zonula occludens-1 expression. Expression of TLR4 was significantly upregulated by OTA (p < 0.001) but downregulated by CIT (p < 0.05) at 48 h. Expression of IL-6, TNF-a and TGF-β was significantly upregulated by OTA (p < 0.05), whereas IL-6 and TGF-β expression was downregulated by CIT (p < 0.01). These results suggest that OTA and CIT could potentially differentially modulate barrier and innate immune functions of mammary epithelium. The present study not only throws light on the individual toxicity of each mycotoxin on bovine mammary epithelium but also lays the foundation for future studies on the combined effects of the two mycotoxins.
Key Contribution: The present study is the first in vitro study to investigate individual toxicity of the frequently detected mycotoxins OTA and CIT on both paracellular permeability and innate immune functions of the bovine mammary epithelium, which contributes to understanding their potential toxicity on bovine mammary gland at the cellular and molecular level.

Graphical Abstract

1. Introduction

Mycotoxins are naturally produced as toxic secondary metabolites by various fungal species that grow on a variety of feed ingredients, therefore animal feeds under favorable environmental conditions worldwide. Co-occurrence of different mycotoxins commonly occurs in animal feed. Mycotoxin contamination challenges feed quality and safety, and has become one of the most significant hazards to the global feed supply chain [1]. The consumption of mycotoxin-contaminated feed by animals can lead to a variety of adverse effects on animal health and production, such as reduced productivity and fertility [2,3,4], and increased susceptibility to infectious diseases due to mycotoxin-induced compromised immune system [5,6]. Moreover, climate change has been predicted to increase the incidence and patterns of mycotoxin contamination [7,8,9], which could further accentuate their impact in agricultural production systems.
Ochratoxin A (OTA) is among the major mycotoxins that have aroused public concern due to its high toxicity and agri-economic significance [1,10]. OTA has been reportedly detected in cereal grains [11,12], silage [12,13], as well as livestock feeds for various species including dairy cattle [10,14,15,16] with the highest concentration of 305.6 μg/kg in dairy cattle feed in Turkey [15]. The mycotoxin citrinin (CIT) also deserves attention due to its known toxic effects in various mammalian species [17] and its frequent occurrence in agricultural commodities and animal feeds [17,18], commonly with OTA from the same fungal species (e.g. Penicillium and Aspergillus) [17,18,19]. Kelman et al. [20] reported maximum 81 μg/kg of CIT in the samples of Canadian forage for dairy cattle and goats. Data regarding the toxicity and the occurrence of CIT in food and feed however, are currently limited. The European Food Safety Authority [17] stated the need for more relevant CIT toxicity data to further refine risk assessment due to uncertainties in the current database. Neither of these two mycotoxins are currently regulated for ruminant feeds or feedstuff by Canadian Food Inspection Agency in Canada where this study was performed.
Ruminants are considered less sensitive to OTA than monogastric animals due to the microbial biotransformation of OTA in the rumen to less toxic ochratoxin α [19]. Similarly, CIT was also assumed to be highly degraded by rumen microflora, however, limited data are available regarding its overall toxic effects on ruminants [17]. Several factors can influence the rumen ecosystem such as rumen pH, rumen dysbiosis and redox potential [21,22], and these could compromise ruminal biodegradation of mycotoxins and thereby increasing their bioavailability to the systemic circulation [23].
Other factors may also affect sensitivity to mycotoxins. Some mycotoxins possess antimicrobial properties for example, which could affect microflora biotransformation processes [17,24]. Sensitivity is also affected by animal production stages [25], heath status [26,27,28] as well as their feed composition [29]. Mycotoxins that escape ruminal degradation could be distributed to different tissues via systemic circulation where they could possibly exert their toxic effects [27,30], and also partition into edible animal products [17,19,31,32]. The mammary gland for example, is a likely site of action for several mycotoxins and their metabolites as mycotoxin residues including OTA has been reportedly detected in ruminant milk [19,31,32].
Mammary epithelial cells (MECs) are one of the critical functional cellular components of the mammary gland. They maintain and facilitate blood-milk barrier (BMB) function and participate in innate immune defense against pathogen; as such, MECs function to maintain tissue homeostasis in addition to secreting milk protein. Integrity of the BMB formed by MECs is critical for sustaining optimal milk composition during lactation and in preventing uncontrolled exchange of components between blood and milk via paracellular transport [33,34]. Tight junction (TJ) proteins that connect adjacent MECs are determinants of paracellular transport [35]. Thus, disrupted expression of MEC TJ proteins by mycotoxins could lead to leakiness and changes in milk composition [34].
In addition to their role in BMB, MECs also play a critical role in the host innate immune response. In response to microbial invasion of the teat canal [36,37], MECs first recognize conserved pathogen-associated molecular patterns (PAMPs) via their pattern-recognition receptors (PRRs) such as the Toll-like receptors, and subsequently secrete cytokines and chemokines that initiate inflammation, an innate immune response that leads to the influx of professional immune cells to clear the invading pathogens [38,39,40,41].
Despite previous in vitro studies showing the toxic effects of OTA on paracellular permeability and immune function in various cell models [42,43,44,45], studies on the toxic effect of OTA and CIT on the mammary epithelium are limited. In this study, individual effects of OTA and CIT on above-mentioned two important functions of MECs were investigated. Cell viability was first assessed to determine the cytotoxic effects of OTA and CIT on MECs. Transepithelial electrical resistance (TEER) and paracellular tracer flux were then measured as indicators of altered paracellular permeability. Gene expression of various TJ proteins, cytokines, and toll-like receptor 4 (TLR4) was also evaluated to assess the immunomodulatory effects of these mycotoxins.

2. Results

2.1. Cytotoxic Effects of OTA and CIT

Cell viability of MAC-T cells upon 48 h exposure to mycotoxin treatments was first measured to assess the cytotoxicity of mycotoxins. As shown in Figure 1, both OTA and CIT reduced viability of MAC-T cells in a concentration-dependent manner within the concentration range used in the present study. OTA and CIT significantly decreased cell viability at concentrations greater than 9.6 μmol/L (p < 0.001) and 80 μmol/L (p < 0.01), respectively. The calculated IC50 ± SE for OTA and CIT were 69.92 ± 18.35 μmol/L and 277.6 ± 44.56 μmol/L, respectively.

2.2. Effects of OTA and CIT on Paracellular Permeability

Transepithelial electrical resistance (TEER) and paracellular tracer flux were performed to assess the effects of OTA and CIT on paracellular permeability of MAC-T cell monolayer. As shown in Figure 2a, exposure to OTA for 48 h reduced TEER of MAC-T cell monolayer in a concentration-dependent manner. The TEER was not affected by 2 μmol/L OTA but was significantly reduced by OTA at higher concentrations of 4.8 μmol/L (p < 0.01) and 9.6 μmol/L (p < 0.001). In contrast, exposure to CIT for 48 h did not alter the TEER of MAC-T cell monolayer at any tested concentrations up to 80 μmol/L (p > 0.05) (Figure 2b).
With regards to paracellular flux (Figure 3), only the highest concentration of OTA (9.6 μmol/L) resulted in a significant increase in FITC-40 kDa dextran flux across MAC-T cell monolayer after 48 h exposure (p < 0.01), whereas 48 h exposure to CIT did not induce any significant changes in the permeability of MAC-T cells to dextran flux (p > 0.05).

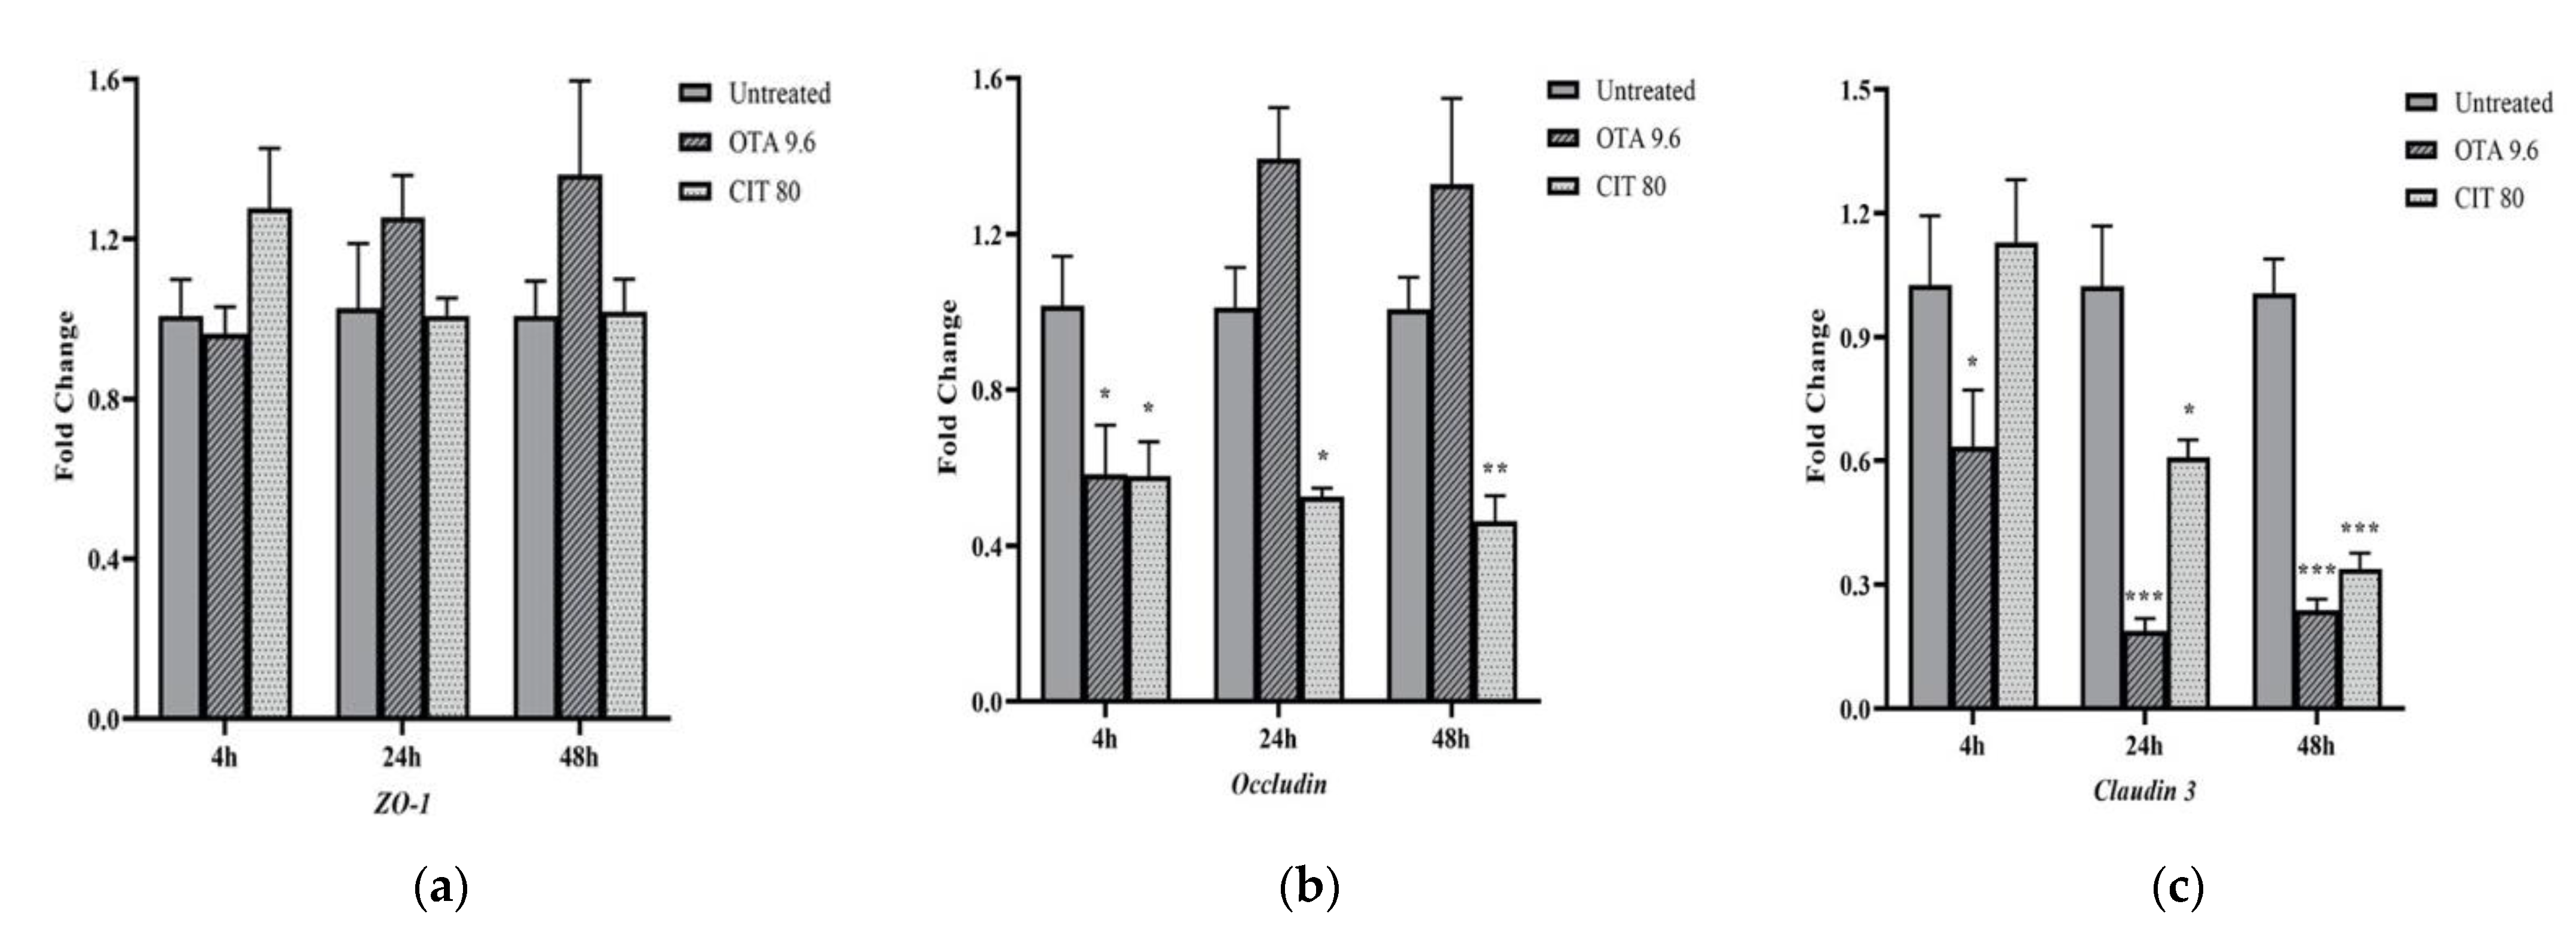
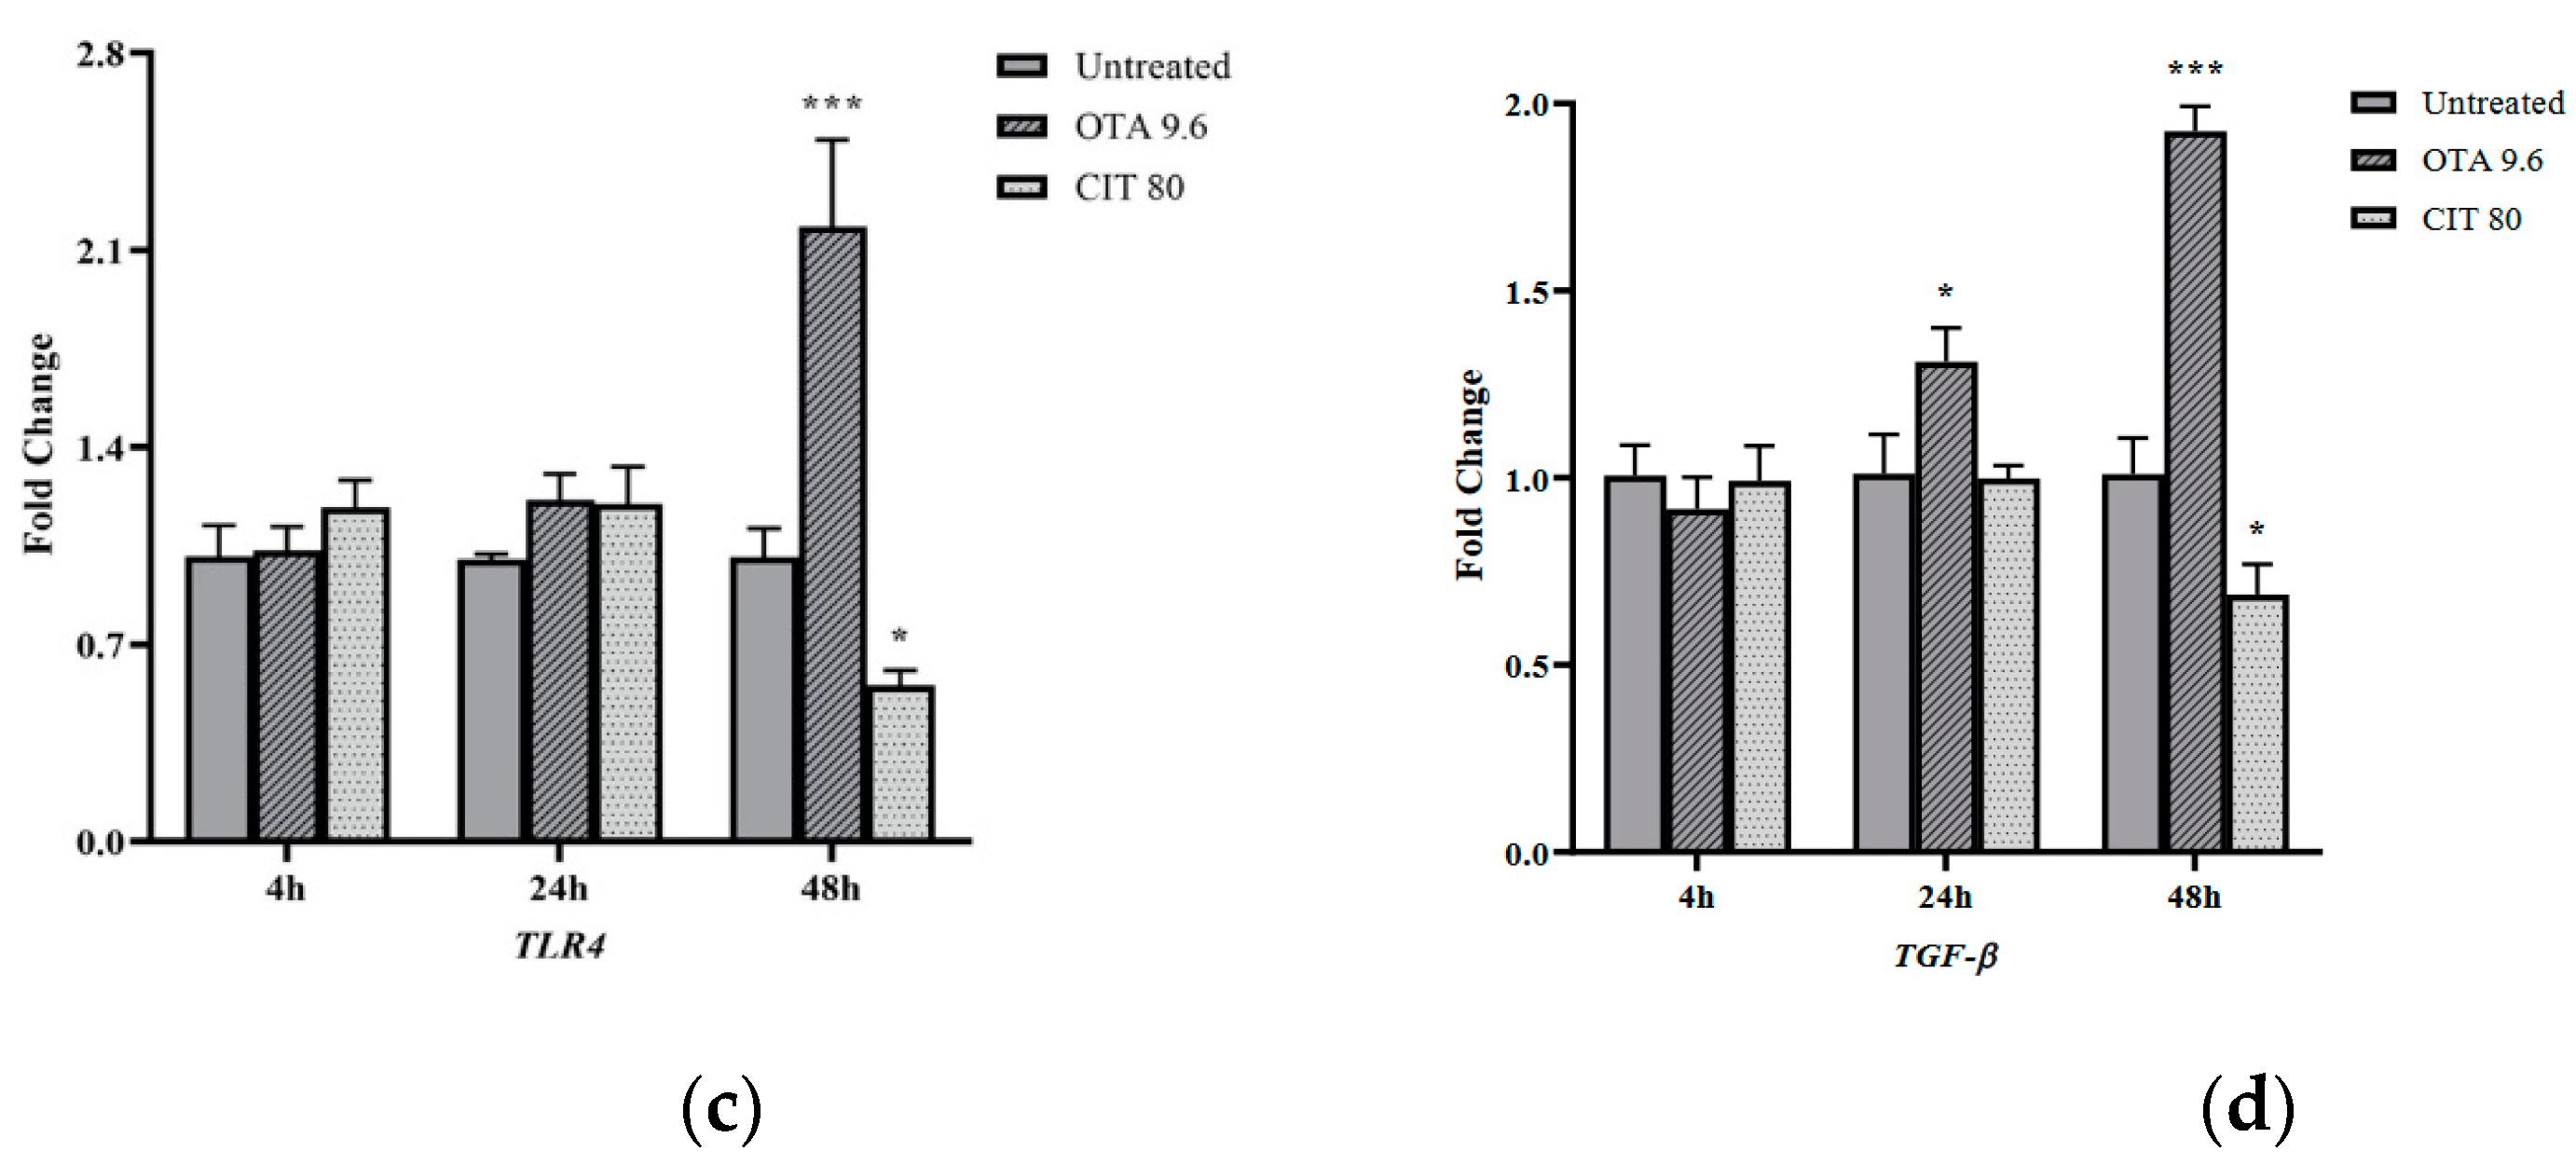
2.3. Gene Expression Analysis

The effects of mycotoxins on the relative mRNA expression of selected MAC-T cell TJ proteins Zonula occludens-1 (ZO-1), claudin 3 and occludin were evaluated at three time points (4, 24 and 48 h) of mycotoxin exposure by qPCR. The highest concentration for each mycotoxin that did not exhibit cytotoxicity to MAC-T cells (9.6 μmol/L for OTA, 80 μmol/L for CIT) were used in this experiment. As shown in Figure 4, ZO-1 was not significantly affected by either OTA or CIT at any timepoints (p > 0.05). In contrast, expression of claudin 3 was significantly downregulated by OTA at all 3 timepoints (p < 0.05), and by CIT at 24 and 48 h (p < 0.05). The expression of occludin was also downregulated by OTA at 4 h (p < 0.05) and by CIT at all 3 timepoints (p < 0.05).
Gene expression of immune-related genes was also quantified to assess the potential immunomodulatory effects of OTA and CIT. The results showed that OTA and CIT exhibited opposing immunomodulatory effects on MAC-T cells overall (Figure 5). Specifically, expression of interleukin 6 (IL-6) (p < 0.001), tumour necrosis factor alpha (TNF-α) (p < 0.001) and transforming growth factor beta (TGF-β) (p < 0.05) were all upregulated by OTA at 24 and 48 h, but not affected at 4 h (p > 0.05). OTA also upregulated TLR4 expression at 48 h (p < 0.001). In contrast, expression of IL-6 was downregulated by CIT at all 3 timepoints (p < 0.01), but CIT did not significantly alter TNF-α expression at any timepoints (p > 0.05). Expression of TGF-β and TLR4 was also downregulated by CIT at 48 h (p < 0.05).

3. Discussion

Udder health is of importance to the high-yield production of high-quality milk. As such, is required for profitability of dairy farmers, human food security and is a welfare issue. Sufficient high-quality milk and colostrum is also important for providing balanced nutrients and adequate passive immune protection to the newborn calves [46,47]. As a pressing issue to feed and livestock industry worldwide, the effects of mycotoxin contamination on bovine udder deserves more attention. Application of the MAC-T cell line has been well-documented in the literature as in vitro model to help investigate basic questions related to mammary gland physiology [48,49,50,51]. In vitro cell models have been widely accepted as effective approaches for mycotoxicity testing [52,53,54,55]. To our knowledge, the present study is the first parallel study to investigate individual toxicity of frequently detected mycotoxins OTA and CIT on paracellular permeability and innate immune functions of the bovine mammary epithelium.
Enhancing the production of high-quality milk is the ultimate goal of mammary gland in lactating dairy cow. Milk production is partly influenced by the number of MECs, the fundamental milk secretory units of mammary gland [56]. The integrity of BMB formed by MECs represents an important barrier between the interstitium and blood, and it is critical to milk production. Disruption of this barrier integrity has been associated with altered milk composition during lactation [34]. The mammary epithelium barrier also contributes to immunocompetence of the udder by protecting the mammary gland from microbial invasion and involving an innate immune response during intramammary infection. A compromised epithelium barrier has been associated with increased susceptibility of microbial translocation, reduced milk yield and quality [38,57,58,59,60].
In the current study, to assess the effects of OTA and CIT on cell viability, cell viability assay was performed using Calcein AM, a cell-permeant dye that has been frequently used to determine cell viability in eukaryotic cells [61,62,63]. We showed that OTA and CIT treatments significantly reduced viability of MAC-T cells after 48 h in a concentration-dependent manner. These findings are in line with previous in vitro studies reporting their cytotoxicity on various epithelial cells [43,64,65,66,67,68]. We also demonstrated that OTA was more toxic in reducing viability of MAC-T cells than CIT, as shown by the calculated IC50 of OTA (69.92 μmol/L) and CIT (277.6 μmol/L), which was consistent with previously reported toxicity differences between these two mycotoxins [65,69,70]. Collectively, our results suggested that exposure to OTA and CIT at certain concentrations could potentially lead to the loss of milk secreting cells in the udder during lactation and resulting impairment of BMBs by cell loss.
Blood-milk barrier function of MECs is critical to maternal lactogenesis, subsequent galactopoiesis and milk secretion [35,71]. The integrity of this barrier is primarily determined by TJ. Tight junction becomes highly impermeable to prevent transport of ion and small molecules via paracellular route during lactation in healthy cows [35,72], and opening of TJ during lactation lead to permeable BMB and changes in milk composition [34]. We first assessed transepithelial electrical resistance and paracellular tracer flux, two parameters to indicate paracellular permeability and epithelial barrier integrity. Decreased TEER or increased tracer flux is indicative of increased epithelial paracellular permeability. In this study, non-toxic concentrations (9.6 μmol/L for OTA, 80 μmol/L for CIT) were selected for each mycotoxin based on cell viability results in an attempt to exclude any changes in paracellular permeability caused by the damage of cell monolayer. A significant decrease in TEER of MAC-T cell monolayer was observed after 48 h of OTA treatment. Our results were in agreement with previous studies where OTA-induced reduction in TEER in human (Caco-2) and porcine (IPEC-J2) intestinal epithelial cell models has been extensively reported [42,73,74,75,76,77,78,79]. In contrast, CIT treatment did not significantly alter TEER values of MAC-T cell monolayer in this study. Among few studies on CIT- associated effects of epithelial permeability, Nakayama et al. [45] reported an increase in TEER in CMT93-II, a mouse rectum cell line induced by CIT at 125 μmol/L after 48 h exposure, which was inconsistent with our results. The discrepancy could be explained by different cell types originated from different species associated with species- and organ-specific mechanisms, and mycotoxin concentrations used in experimental designs, which were the contributing factors to variation in mycotoxin-induced effects on TEER reported in the literature [42,76,77,80,81,82,83]. In correlation with the TEER results in the present study, CIT did not affect paracellular flux of FITC-40 kDa across the MAC-T monolayer, suggesting unaffected paracellular permeability, which could be attributed to the lower concentrations used in the present study, as it was previously demonstrated that mycotoxin-induced effects in paracellular flux of FITC-labeled dextran could be concentration-dependent [43,76,79,82]. Whereas, we observed an increase in paracellular flux of FITC-40 kDa dextran after 48 h OTA treatment, which was in line with previously reported OTA-induced increase in paracellular tracer flux [42,43,78,79]. Collectively, our study demonstrated that exposure to OTA could disrupt barrier function of MECs by increasing its paracellular permeability, and this could result in an increased amount of OTA in the milk potentially leading to food safety issues.
We next investigated the mRNA expression of the TJ proteins (ZO-1, occludin and claudin 3) to assess the effects of OTA and CIT on epithelial integrity at the transcriptional level by performing qPCR analysis. Our results demonstrated that mRNA expression of ZO-1, occludin and claudin 3 was differentially modulated in response to OTA and CIT exposure, respectively; Claudin 3 and occludin was downregulated by both mycotoxin treatments, whereas ZO-1 being unaffected. Such differential toxic effects observed on TJ proteins have also been previously reported for OTA [42,78,84] and other mycotoxins [59,85]. Claudin 3 is one of the members of a large claudin protein family. Claudins along with occludin are the two major transmembrane proteins that play a role in maintaining the TJ barrier function, and they are linked to the actin cytoskeleton via scaffolding proteins, such as ZO-1 [72]. Claudins have been considered as the key determinant of paracellular characteristics. They form the backbone of TJ and contribute to the tightness of TJ by sealing the paracellular pathway [45]. It is known that different claudins selectively modulate paracellular pathway [86,87]. Wang et al. [82] for example, found that Claudin 4 was the core TJ protein involved to Caco-2 cell permeability upon DON exposure. In contrast, occludin contributes to TJ stabilization and optimal barrier function [88]. Our results suggested that decreased expression of claudin 3 could be the potential primary contributor to OTA-induced increase in paracellular permeability of MAC-T cells, whereas other claudin proteins might play a predominate role in responding to CIT treatment in MAC-T cells, as indicated by the results from TEER and tracer flux.
A successful host immune response is generally the results of a dynamic balance between pro- and anti-inflammatory elements, with the ultimate goal of clearing the pathogen and limiting host damage [89]. qPCR analysis of TLR4, IL-6, TNF-α and TGF-β was performed to investigate the effects of OTA and CIT on the innate immune response of the mammary epithelium. In the present study, we observed potential opposing effects of OTA and CIT on innate immune function of MECs. Both effects suggested that OTA and CIT could lead to aberrant immunity in mammary epithelium. Toll-like receptor 4 is of importance to mammary gland defense in that it is capable of recognizing lipopolysaccharide, the PAMP derived from Gram-negative mastitis-causing pathogens [90]. The observed OTA-induced upregulation and CIT-induced downregulation of TLR4 expression at 48 h suggested possible immunostimulatory effect of OTA whereas immunosuppressive property of CIT. Consistent with our results, upregulated TLR4 expression were previously reported in different cell models [91,92] as well as in duck liver [93]. However, studies on immunomodulatory effects of CIT are limited. In an in vivo study, Islam et al. [94] reported a downregulation of TLR3 induced by CIT in mice spleen, but no effect observed for TLR4, suggesting CIT exposure may selectively affect toll-like receptors.
We next evaluated mRNA expression of cytokines given their important roles in inflammatory response. Likewise, we observed possible immunostimulatory effect of OTA and immunosuppressive property of CIT, as shown by OTA-induced upregulation of IL-6, TNF-α and CIT-induced downregulation of IL-6. Consistently, previous studies also reported OTA upregulated mRNA expression of IL-6 and TNF-α in cell models [44,92,95,96]. IL-6 and TNF-α are two well-known pro-inflammatory cytokines that can locally and systemically initiate the immune response in the host [60,97]. Whereas TGF-β functions as an anti-inflammatory cytokine to dampen the inflammation as part of host homeostatic mechanisms [98,99,100], since an exaggerated or protracted dysfunctional mammary innate immune response could have deleterious effects resulting in uncontrolled acute or chronic mastitis [90]. Elevated levels of IL-6, TNF-α and TGF-β have been found to be associated with experimentally-induced inflammation in the bovine mammary gland [98,101,102,103]. Taken together, our results suggested that OTA could potentially induce over-activated innate immune system in mammary epithelium, which could lead to various negative outcomes to the host [104]; whereas CIT exposure could potentially lead to a noninfectious cause of immunosuppression in mammary gland, which could decrease resistance of mammary gland to infection [105]. Such contradictory properties observed in the present study could also suggest the potential antagonistic effects of combination of these two mycotoxins, which has been reported previously [6,69,70].

4. Conclusions

Ochratoxin A and CIT have been frequently detected in ruminant feedstuff and feeds. Inefficient degradation of mycotoxins resulting from disrupted rumen environments can lead to mycotoxin encounter with mammary gland, where subsequently their toxic effects may disrupt homeostasis of MECs. In the present study, OTA was found to increase paracellular permeability of MAC-T cell monolayer accompanied with decreased gene expression of certain TJ proteins at tested concentrations. Ochratoxin A could also potentially exert stimulatory effect on innate immune function of MAC-T by elevating gene expression of TLR4 and pro-inflammatory cytokines. Conversely, CIT exposure could potentially induce immunosuppressive effects by suppressing expression of TLR4 and pro-inflammatory cytokines but did not appear to affect paracellular permeability of MAC-T cells at tested concentrations in this study. The present study not only throws light on the individual toxicity of each mycotoxin on bovine mammary epithelium but also lays the foundation for future studies on the combined effects of the two mycotoxins.

5. Materials and Methods

5.1. Chemicals

Purified OTA and CIT (Sigma-Aldrich, St. Louis, MO, USA) were dissolved in dimethyl sulfoxide (DMSO) to final stock concentrations of 5.0 mg/mL and stored at −20 °C until further dilution in complete cell culture medium for subsequent experiments. The designated mycotoxin concentrations used for each subsequent experiment described below were prepared by serial dilutions of the stock concentrations in cell culture medium.

5.2. Cell Culture

The bovine mammary epithelial cell line (MAC-T) was maintained in the cell culture medium containing Dulbecco’s Modified Eagle Medium (DMEM) supplemented with 4.0 mmol/L L-glutamine, 10% heat inactivated fetal bovine serum, 2.5% HEPES buffer (Invitrogen), 1% Penicillin/Streptomycin (100 units/mL of Penicillin and 100 μg/mL Streptomycin; Invitrogen) and 1 mM Sodium Pyruvate (Invitrogen) as previously described with slight modifications [61]. Cells were maintained in T75 flasks in a humidified incubator at 37  °C with 5% CO2 and passaged by trypsinization using TrypLE™ (Gibco # 12605036) when reaching 80% confluency.

5.3. Cytotoxicity Assay

MAC-T cells were seeded at 2 × 10⁴ cells per well in 96-well microplates. After 24 h of cell culture, OTA (0, 4.8, 9.6, 19.2 and 76.8 μmol/L) and CIT (0, 60, 80, 240 and 270 μmol/L) were administered to the cells for 48 h [43,65,106,107,108]. The range of exposure concentrations were selected based on [42,63,64,109,110] and our preliminary studies (data not shown). At the end of mycotoxin exposure, 200 μL of Calcein AM (Invitrogen, CA, USA), a cell-permeant fluorescent dye was added to each well at a final concentration of 2 μmol/L, and the cells were incubated at room temperature for 45 min according to the references with slight modifications [61,63]. The fluorescence intensity (FI) was measured using a microplate reader (BioTek Instruments, VT, USA) at excitation 498/emission 528 nm. The percentage of viable cells was calculated using the following formula:
% Cell viability = Mean (FI498 Treated cells − FI Blank)/Mean (FI498 Untreated cell − FI Blank) × 100
where FI498 Treated cells is the FI obtained from mycotoxin-treated groups; FI498 Untreated cells is FI obtained from groups without any mycotoxin treatment; FI Blank is the background signal resulting from Calcein AM treated wells without cells. Mean is the average FI of three replicates.
The IC50 (the 50% inhibitory concentration) of each mycotoxin was also calculated by fitting the data to non-linear Hill’s equation (Equation 1) using GraphPad Prism version 8.2.1 for Windows (GraphPad Software).
Ŷ = a + b a [ 1 + ( c X ) d ]  
where Ŷ is the expected response at dosage X, a is the minimum asymptote or the response when dosage = 0, b = the maximum asymptote or the stabilized response for an infinite dosage, c is the dosage at which 50% of the subjects are expected to show the desired response (that is, the response halfway between the minimum response asymptote a and the maximum response asymptote b), and d is the slope at the steepest part of the curve, also known as the Hill slope [111]. According to these cell viability data, non-cytotoxic concentrations were chosen for subsequent experiments in an attempt to exclude any changes in experiment endpoints caused by the damage of cell monolayer [43].

5.4. Transepithelial Electrical Resistance (TEER) Measurement

An insert-based MAC-T cell culture system was established as previously described with slight modifications [50] to assess the paracellular permeability of MAC-T cell monolayer. MAC-T cells were seeded at 2.5 × 10⁴ cells per Transwell® insert (Corning® Transwell® #3470, 6.5 mm, 0.4 µm pore size) pre-coated with Type I collagen at 10 μg/cm2 (C3867, Sigma-Aldrich) according to the manufacturer’s instruction and grown for 33 days in the same medium described above to ensure stable transepithelial electrical resistance (TEER) readings were yield according to our preliminary studies (data not shown). Medium was refreshed for both apical (AP) and basal compartments (BL) of the Transwell® inserts every other day [82]. On day 33, the cells were exposed to the increasing non-cytotoxic concentrations of either OTA (0, 2, 4.8 and 9.6 μmol/L), or CIT (0, 30, 60 and 80 μmol/L) in the AP compartment for 48 h. The TEER readings were measured before the addition of mycotoxins (TEER0) and after 48 h mycotoxin exposure (TEER48) using a Millicell ERS-2 Voltohmmeter (EMD Millipore Corporation) according to the manufacturer’s instruction. The change in TEER was expressed as TEER48 to TEER0 ratio, which was calculated according to the following formula [112]:
% TEER = TEER48 (Ω • cm2)/TEER0(Ω • cm2) × 100

5.5. Permeability Tracer Flux Assay

The paracellular tracer fluorescein isothiocyanate (FITC)-40 kDa dextran (FD-40, Sigma-Aldrich) was used in the tracer flux assay as another indicator of paracellular permeability of MAC-T cell monolayer. A tracer working solution of a final concentration of 1 mg/mL was prepared by dissolving FITC-40 kDa dextran powder in DMEM/Nutrient Ham’s Mixture F-12 (F12). The insert-based cell culture system was established as described above. On day 33, when stable TEER readings were achieved, the MAC-T cells were challenged with mycotoxin treatments as described above. After 48 h of mycotoxin exposure, the tracer working solution was added to the AP compartment of the culture system with DMEM/F12 added to the BL compartment. As previously described [43,113,114], after 2 h incubation, the fluorescence intensity of FITC-40 kDa in the BL compartment was measured by a microplate reader (Agilent Technologies formally BioTek Instruments, Winooski, VT, USA) at 498/528 nm.

5.6. Quantitative Real-Time PCR Analysis

MAC-T cells were cultured in 24-well plates in triplicate at a density of 1 × 10⁵ cells per well. After 4 h, 24 h and 48 h exposure to OTA (0, 9.6 μmol/L) or CIT (0, 80 μmol/L) at the highest non-cytotoxic concentrations, cells were lysed with TRIzol Reagent (Invitrogen) according to the manufacturer’s instructions and stored at −80 °C until further RNA extraction. Total RNA was extracted and purified using RNeasy Mini Kit (Qiagen) according to the manufacturer’s instructions. RNA samples with a A260 nm/A280 nm ratio between 1.9 and 2.1 were reverse-transcribed into complementary DNA (cDNA) using High-Capacity cDNA Reverse Transcription Kit (Applied Biosystems) according to the manufacturer’s instructions. Quantitative real-time PCR (qPCR) was performed using SsoAdvanced Universal SYBR Green Supermix (Bio-Rad) in a total reaction volume of 10 μL with a StepOne Plus instrument (Applied Biosystems). The polymerase was activated at 95 °C for 10 min and the PCR was performed for 40 cycles (95 °C for 15 s and 60 °C for 1 min). The relative levels of gene expression were calculated using ΔΔCt method [115]. Glyceraldehyde-3-phosphate dehydrogenase (GAPDH) and ubiquitously expressed prefoldin like chaperone (UXT) were used as reference genes to normalize the expression of the target gene transcripts. The gene-specific primers are listed in Table 1.

5.7. Statistical Analysis

Statistical analysis was performed using GraphPad Prism version 8.2.1 for Windows (GraphPad Software). A one-way analysis of variance (ANOVA) was performed followed by Dunnett’s post-hoc test for multiple mean comparisons for cell viability, TEER and paracellular tracer flux. A two-way ANOVA followed by Dunnett’s post-hoc test for multiple mean comparisons was performed for the qPCR analysis. The data are presented as mean ± SEM of three independent experiments conducted in triplicate, and p < 0.05 was considered statistically significant.

Author Contributions

Conceptualization, R.X. and N.A.K.; methodology, R.X. and U.K.S.; validation, R.X., U.K.S., A.Y. and N.A.K.; formal analysis, R.X. and U.K.S.; writing—original draft preparation, R.X.; writing—review and editing, U.K.S., A.Y. and N.A.K.; supervision, N.A.K.; project administration, U.K.S.; funding acquisition, N.A.K. All authors have read and agreed to the published version of the manuscript.

Funding

This research was funded by the Natural Sciences and Engineering Research Council: 401550 and Alltech (United States): 054247.

Data Availability Statement

The datasets used and analyzed during the current study available from the corresponding author upon request.

Acknowledgments

The authors acknowledge the financial contributions from the Natural Sciences and Engineering Research Council of Canada (NSERC) and Alltech Inc., KY, US [532378-18] to this study.

Conflicts of Interest

The authors have not stated any conflicts of interest.

References

  1. Dey, D.K.; Kang, J.I.; Bajpai, V.K.; Kim, K.; Lee, H.; Sonwal, S.; Simal-Gandara, J.; Xiao, J.; Ali, S.; Huh, Y.S.; et al. Mycotoxins in food and feed: Toxicity, preventive challenges, and advanced detection techniques for associated diseases. Crit. Rev. Food Sci. Nutr. 2022. [Google Scholar] [CrossRef]
  2. Chilaka, C.A.; De Boevre, M.; Atanda, O.O.; De Saeger, S. The Status of Fusarium Mycotoxins in Sub-Saharan Africa: A Review of Emerging Trends and Post-Harvest Mitigation Strategies towards Food Control. Toxins 2017, 9, 19. [Google Scholar] [CrossRef] [PubMed]
  3. Kępińska-Pacelik, J.; Biel, W. Mycotoxins—Prevention, Detection, Impact on Animal Health. Processes 2021, 9, 2035. [Google Scholar] [CrossRef]
  4. Weaver, A.C.; King, W.D.; Verax, M.; Fox, U.; Kudupoje, M.B.; Mathis, G.; Lumpkins, B.; Yiannikouris, A. Impact of Chronic Levels of Naturally Multi-Contaminated Feed with Fusarium Mycotoxins on Broiler Chickens and Evaluation of the Mitigation Properties of Different Titers of Yeast Cell Wall Extract. Toxins 2020, 12, 636. [Google Scholar] [CrossRef] [PubMed]
  5. Brown, R.; Priest, E.; Naglik, J.R.; Richardson, J.P. Fungal Toxins and Host Immune Responses. Front. Microbiol. 2021, 12, 643639. [Google Scholar] [CrossRef] [PubMed]
  6. Brennan, K.M.; Oh, S.-Y.; Yiannikouris, A.; Graugnard, D.E.; Karrow, N.A. Differential Gene Expression Analysis of Bovine Macrophages after Exposure to the Penicillium Mycotoxins Citrinin and/or Ochratoxin A. Toxins 2017, 9, 366. [Google Scholar] [CrossRef] [PubMed]
  7. Battilani, P.; Toscano, P.; Van Der Fels-Klerx, H.J.; Moretti, A.; Leggieri, M.C.; Brera, C.; Rortais, A.; Goumperis, T.; Robinson, T. Aflatoxin B1 contamination in maize in Europe increases due to climate change. Sci. Rep. 2016, 6, 24328. [Google Scholar] [CrossRef]
  8. EFSA; Maggiore, A.; Afonso, A.; Barrucci, F.; De Sanctis, G. Climate change as a driver of emerging risks for food and feed safety, plant, animal health and nutritional quality. EFSA Support. Publ. 2020, 17, 1881E. [Google Scholar] [CrossRef]
  9. FAO. Climate Change: Unpacking the Burden on Food Safety; Food Safety and Quality Series; FAO: Rome, Italy, 2020; ISBN 978-92-5-132293-2. [Google Scholar]
  10. Kemboi, D.C.; Antonissen, G.; Ochieng, P.E.; Croubels, S.; Okoth, S.; Kangethe, E.K.; Faas, J.; Lindahl, J.F.; Gathumbi, J.K. A Review of the Impact of Mycotoxins on Dairy Cattle Health: Challenges for Food Safety and Dairy Production in Sub-Saharan Africa. Toxins 2020, 12, 222. [Google Scholar] [CrossRef]
  11. Akinmusire, O.O.; El-Yuguda, A.-D.; Musa, J.A.; Oyedele, O.A.; Sulyok, M.; Somorin, Y.M.; Ezekiel, C.N.; Krska, R. Mycotoxins in poultry feed and feed ingredients in Nigeria. Mycotoxin Res. 2018, 35, 149–155. [Google Scholar] [CrossRef] [Green Version]
  12. Weaver, A.; Weaver, D.; Adams, N.; Yiannikouris, A. Co-Occurrence of 35 Mycotoxins: A Seven-Year Survey of Corn Grain and Corn Silage in the United States. Toxins 2021, 13, 516. [Google Scholar] [CrossRef] [PubMed]
  13. Gruber-Dorninger, C.; Jenkins, T.; Schatzmayr, G. Global Mycotoxin Occurrence in Feed: A Ten-Year Survey. Toxins 2019, 11, 375. [Google Scholar] [CrossRef] [PubMed]
  14. Abidin, Z.; Khatoon, A.; Arooj, N.; Hussain, S.; Ali, S.; Manzoor, A.W.; Saleemi, M.K. Estimation of ochratoxin A in poultry feed and its ingredients with special reference to temperature conditions. Br. Poult. Sci. 2017, 58, 251–255. [Google Scholar] [CrossRef] [PubMed]
  15. Gumus, R.; Ercan, N.; Imik, H. Determination of Ochratoxin A Levels in Mixed Feed and Feed Stuffs Used in Some Laying Hens and Ruminant Enterprises of Sivas City. Braz. J. Poult. Sci. 2018, 20, 85–90. [Google Scholar] [CrossRef]
  16. Leiva, A.; Méndez, G.; Rodríguez, C.; Molina, A.; Granados-Chinchilla, F. Chemical assessment of mycotoxin contaminants and veterinary residues in Costa Rican animal feed. Int. J. Food Contam. 2019, 6, 5. [Google Scholar] [CrossRef]
  17. EFSA Panel on Contaminants in the Food Chain (Contam). Scientific Opinion on the risks for public and animal health related to the presence of citrinin in food and feed. EFSA J. 2012, 10, 2605. [Google Scholar] [CrossRef]
  18. Meerpoel, C.; Vidal, A.; di Mavungu, J.D.; Huybrechts, B.; Tangni, E.K.; Devreese, M.; Croubels, S.; De Saeger, S. Development and validation of an LC–MS/MS method for the simultaneous determination of citrinin and ochratoxin a in a variety of feed and foodstuffs. J. Chromatogr. A 2018, 1580, 100–109. [Google Scholar] [CrossRef]
  19. European Food Safety. Opinion of the Scientific Panel on contaminants in the food chain [CONTAM] related to ochratoxin A (OTA) as undesirable substance in animal feed. EFSA J. 2004, 2, 101. [Google Scholar] [CrossRef]
  20. Kelman, M.; Renaud, J.; Baines, D.; Yeung, K.-C.; Miller, J.; Sumarah, M. Mycotoxin determination in fungal contaminated Canadian silage toxic to dairy cows and goats. World Mycotoxin J. 2022, 15, 429–438. [Google Scholar] [CrossRef]
  21. Billenkamp, F.; Schnabel, K.; Hüther, L.; Frahm, J.; von Soosten, D.; Meyer, U.; Höper, D.; Beer, M.; Seyboldt, C.; Neubauer, H.; et al. No hints at glyphosate-induced ruminal dysbiosis in cows. npj Biofilms Microbiomes 2021, 7, 30. [Google Scholar] [CrossRef]
  22. Huang, Y.; Marden, J.P.; Julien, C.; Bayourthe, C. Redox potential: An intrinsic parameter of the rumen environment. J. Anim. Physiol. Anim. Nutr. 2018, 102, 393–402. [Google Scholar] [CrossRef] [PubMed]
  23. Kabak, B.; Ozbey, F. Assessment of the bioaccessibility of aflatoxins from various food matrices using an in vitro digestion model, and the efficacy of probiotic bacteria in reducing bioaccessibility. J. Food Compos. Anal. 2012, 27, 21–31. [Google Scholar] [CrossRef]
  24. Křížová, L.; Dadáková, K.; Dvořáčková, M.; Kašparovský, T. Feedborne Mycotoxins Beauvericin and Enniatins and Livestock Animals. Toxins 2021, 13, 32. [Google Scholar] [CrossRef]
  25. Valgaeren, B.; Théron, L.; Croubels, S.; Devreese, M.; De Baere, S.; Van Pamel, E.; Daeseleire, E.; De Boevre, M.; De Saeger, S.; Vidal, A.; et al. The role of roughage provision on the absorption and disposition of the mycotoxin deoxynivalenol and its acetylated derivatives in calves: From field observations to toxicokinetics. Arch. Toxicol. 2018, 93, 293–310. [Google Scholar] [CrossRef] [PubMed]
  26. Chen, X.; Su, X.; Li, J.; Yang, Y.; Wang, P.; Yan, F.; Yao, J.; Wu, S. Real-time monitoring of ruminal microbiota reveals their roles in dairy goats during subacute ruminal acidosis. npj Biofilms Microbiomes 2021, 7, 45. [Google Scholar] [CrossRef]
  27. Debevere, S.; Cools, A.; De Baere, S.; Haesaert, G.; Rychlik, M.; Croubels, S.; Fievez, V. In Vitro Rumen Simulations Show a Reduced Disappearance of Deoxynivalenol, Nivalenol and Enniatin B at Conditions of Rumen Acidosis and Lower Microbial Activity. Toxins 2020, 12, 101. [Google Scholar] [CrossRef]
  28. Nagaraja, T.G.; Titgemeyer, E.C. Ruminal acidosis in beef cattle: The current microbiological and nutritional outlook. J. Dairy Sci. 2007, 90, E17–E38. [Google Scholar] [CrossRef]
  29. Upadhaya, S.D.; Park, M.A.; Ha, J.K. Mycotoxins and Their Biotransformation in the Rumen: A Review. Asian-Australas. J. Anim. Sci. 2010, 23, 1250–1260. [Google Scholar] [CrossRef]
  30. Escrivá, L.; Font, G.; Manyes, L. In vivo toxicity studies of fusarium mycotoxins in the last decade: A review. Food Chem. Toxicol. 2015, 78, 185–206. [Google Scholar] [CrossRef]
  31. Becker-Algeri, T.A.; Castagnaro, D.; Bortoli, K.; Souza, C.; Drunkler, D.A.; Badiale-Furlong, E. Mycotoxins in Bovine Milk and Dairy Products: A Review. J. Food Sci. 2016, 81, R544–R552. [Google Scholar] [CrossRef] [Green Version]
  32. Völkel, I.; Schröer-Merker, E.; Czerny, C.-P. The Carry-Over of Mycotoxins in Products of Animal Origin with Special Regard to Its Implications for the European Food Safety Legislation. Food Nutr. Sci. 2011, 2011, 852–867. [Google Scholar] [CrossRef]
  33. Kessler, E.; Wall, S.; Hernandez, L.; Gross, J.; Bruckmaier, R. Short communication: Mammary gland tight junction permeability after parturition is greater in dairy cows with elevated circulating serotonin concentrations. J. Dairy Sci. 2019, 102, 1768–1774. [Google Scholar] [CrossRef] [PubMed]
  34. Wellnitz, O.; Bruckmaier, R. Invited review: The role of the blood–milk barrier and its manipulation for the efficacy of the mammary immune response and milk production. J. Dairy Sci. 2021, 104, 6376–6388. [Google Scholar] [CrossRef] [PubMed]
  35. Markov, A.G.; Aschenbach, J.R.; Amasheh, S. The epithelial barrier and beyond: Claudins as amplifiers of physiological organ functions. IUBMB Life 2017, 69, 290–296. [Google Scholar] [CrossRef]
  36. Brenaut, P.; Lefèvre, L.; Rau, A.; Laloë, D.; Pisoni, G.; Moroni, P.; Bevilacqua, C.; Martin, P. Contribution of mammary epithelial cells to the immune response during early stages of a bacterial infection to Staphylococcus aureus. Vet.-Res. 2014, 45, 16. [Google Scholar] [CrossRef]
  37. Gray, C.; Strandberg, Y.; Donaldson, L.; Tellam, R.L. Bovine mammary epithelial cells, initiators of innate immune responses to mastitis. Aust. J. Exp. Agric. 2005, 45, 757–761. [Google Scholar] [CrossRef]
  38. Newton, K.; Dixit, V.M. Signaling in Innate Immunity and Inflammation. Cold Spring Harb. Perspect. Biol. 2012, 4, a006049. [Google Scholar] [CrossRef]
  39. Rainard, P.; Riollet, C. Innate immunity of the bovine mammary gland. Vet.-Res. 2006, 37, 369–400. [Google Scholar] [CrossRef]
  40. Sun, L.; Chen, L.; Wang, F.; Zheng, X.; Yuan, C.; Niu, Q.; Li, Z.; Deng, L.; Zheng, B.; Li, C.; et al. Exogenous hydrogen sulfide prevents lipopolysaccharide-induced inflammation by blocking the TLR4/NF-κB pathway in MAC-T cells. Gene 2019, 710, 114–121. [Google Scholar] [CrossRef]
  41. Zhuang, C.; Liu, G.; Barkema, H.W.; Zhou, M.; Xu, S.; Rahman, S.U.; Liu, Y.; Kastelic, J.P.; Gao, J.; Han, B. Selenomethionine Suppressed TLR4/NF-κB Pathway by Activating Selenoprotein S to Alleviate ESBL Escherichia coli-Induced Inflammation in Bovine Mammary Epithelial Cells and Macrophages. Front. Microbiol. 2020, 11, 1461. [Google Scholar] [CrossRef]
  42. Alizadeh, A.; Akbari, P.; Varasteh, S.; Braber, S.; Malekinejad, H.; Fink-Gremmels, J. Ochratoxin A challenges the intestinal epithelial cell integrity: Results obtained in model experiments with Caco-2 cells. World Mycotoxin J. 2019, 12, 399–407. [Google Scholar] [CrossRef]
  43. Gao, Y.; Li, S.; Wang, J.; Luo, C.; Zhao, S.; Zheng, N. Modulation of Intestinal Epithelial Permeability in Differentiated Caco-2 Cells Exposed to Aflatoxin M1 and Ochratoxin A Individually or Collectively. Toxins 2017, 10, 13. [Google Scholar] [CrossRef] [PubMed]
  44. Gao, Y.; Ye, Q.; Bao, X.; Huang, X.; Wang, J.; Zheng, N. Transcriptomic and proteomic profiling reveals the intestinal immunotoxicity induced by aflatoxin M1 and ochratoxin A. Toxicon 2020, 180, 49–61. [Google Scholar] [CrossRef]
  45. Nakayama, H.; Kitagawa, N.; Otani, T.; Iida, H.; Anan, H.; Inai, T. Ochratoxin A, citrinin and deoxynivalenol decrease claudin-2 expression in mouse rectum CMT93-II cells. Microscopy 2018, 67, 99–111. [Google Scholar] [CrossRef] [PubMed]
  46. Derakhshani, H.; Fehr, K.B.; Sepehri, S.; Francoz, D.; De Buck, J.; Barkema, H.W.; Plaizier, J.C.; Khafipour, E. Invited review: Microbiota of the bovine udder: Contributing factors and potential implications for udder health and mastitis susceptibility. J. Dairy Sci. 2018, 101, 10605–10625. [Google Scholar] [CrossRef]
  47. Vlasova, A.N.; Saif, L.J. Bovine Immunology: Implications for Dairy Cattle. Front. Immunol. 2021, 12, 659801. [Google Scholar] [CrossRef]
  48. Mitz, C.A.; Viloria-Petit, A.M. TGF-beta signalling in bovine mammary gland involution and a comparative assessment of MAC-T and BME-UV1 cells as in vitro models for its study. PeerJ 2019, 6, e6210. [Google Scholar] [CrossRef]
  49. Silva, L.G.; Ferguson, B.S.; Faciola, A.P. Rapid Communication: Prolactin and hydrocortisone impact TNFα-mediated mitogen-activated protein kinase signaling and inflammation of bovine mammary epithelial (MAC-T) cells. J. Anim. Sci. 2017, 95, 5524–5531. [Google Scholar] [CrossRef]
  50. Wang, J.; Jin, Y.; Wu, S.; Yu, H.; Zhao, Y.; Fang, H.; Shen, J.; Zhou, C.; Fu, Y.; Li, R.; et al. Deoxynivalenol induces oxidative stress, inflammatory response and apoptosis in bovine mammary epithelial cells. J. Anim. Physiol. Anim. Nutr. 2019, 103, 1663–1674. [Google Scholar] [CrossRef]
  51. Zhang, L.; Hou, X.; Sun, L.; He, T.; Wei, R.; Pang, M.; Wang, R. Staphylococcus aureus Bacteriophage Suppresses LPS-Induced Inflammation in MAC-T Bovine Mammary Epithelial Cells. Front. Microbiol. 2018, 9, 1614. [Google Scholar] [CrossRef] [Green Version]
  52. Bertero, A.; Fossati, P.; Tedesco, D.E.A.; Caloni, F. Beauvericin and Enniatins: In Vitro Intestinal Effects. Toxins 2020, 12, 686. [Google Scholar] [CrossRef] [PubMed]
  53. Oh, S.-Y.; Cedergreen, N.; Yiannikouris, A.; Swamy, H.; Karrow, N.A. Assessing interactions of binary mixtures of Penicillium mycotoxins (PMs) by using a bovine macrophage cell line (BoMacs). Toxicol. Appl. Pharmacol. 2017, 318, 33–40. [Google Scholar] [CrossRef] [PubMed]
  54. Skrzydlewski, P.; Twarużek, M.; Grajewski, J. Cytotoxicity of Mycotoxins and Their Combinations on Different Cell Lines: A Review. Toxins 2022, 14, 244. [Google Scholar] [CrossRef] [PubMed]
  55. Xu, R.; Karrow, N.A.; Shandilya, U.K.; Sun, L.-H.; Kitazawa, H. In-Vitro Cell Culture for Efficient Assessment of Mycotoxin Exposure, Toxicity and Risk Mitigation. Toxins 2020, 12, 146. [Google Scholar] [CrossRef]
  56. Hervé, L.; Quesnel, H.; Lollivier, V.; Boutinaud, M. Regulation of cell number in the mammary gland by controlling the exfoliation process in milk in ruminants. J. Dairy Sci. 2016, 99, 854–863. [Google Scholar] [CrossRef] [PubMed]
  57. Cheng, W.N.; Han, S.G. Bovine mastitis: Risk factors, therapeutic strategies, and alternative treatments—A review. Asian-Australas. J. Anim. Sci. 2020, 33, 1699–1713. [Google Scholar] [CrossRef]
  58. Kelly, J.R.; Kennedy, P.J.; Cryan, J.F.; Dinan, T.G.; Clarke, G.; Hyland, N.P. Breaking down the barriers: The gut microbiome, intestinal permeability and stress-related psychiatric disorders. Front. Cell. Neurosci. 2015, 9, 392. [Google Scholar] [CrossRef]
  59. Ling, K.-H.; Wan, M.L.Y.; El-Nezami, H.; Wang, M. Protective Capacity of Resveratrol, a Natural Polyphenolic Compound, against Deoxynivalenol-Induced Intestinal Barrier Dysfunction and Bacterial Translocation. Chem. Res. Toxicol. 2016, 29, 823–833. [Google Scholar] [CrossRef]
  60. Rainard, P.; Fromageau, A.; Cunha, P.; Gilbert, F.B. Staphylococcus aureuslipoteichoic acid triggers inflammation in the lactating bovine mammary gland. Vet.-Res. 2008, 39, 52. [Google Scholar] [CrossRef]
  61. Li, Z.; You, Q.; Ossa, F.; Mead, P.; Quinton, M.; Karrow, N.A. Assessment of yeast Saccharomyces cerevisiae component binding to Mycobacterium avium subspecies paratuberculosis using bovine epithelial cells. BMC Vet.-Res. 2016, 12, 42. [Google Scholar] [CrossRef] [Green Version]
  62. Li, Z.; Kang, H.; You, Q.; Ossa, F.; Mead, P.; Quinton, M.; Karrow, N. In vitro bioassessment of the immunomodulatory activity of Saccharomyces cerevisiae components using bovine macrophages and Mycobacterium avium ssp. paratuberculosis. J. Dairy Sci. 2018, 101, 6271–6286. [Google Scholar] [CrossRef] [PubMed]
  63. Oh, S.-Y.; Quinton, V.M.; Boermans, H.J.; Swamy, H.V.L.N.; Karrow, N.A. In vitro exposure of Penicillium mycotoxins with or without a modified yeast cell wall extract (mYCW) on bovine macrophages (BoMacs). Mycotoxin Res. 2015, 31, 167–175. [Google Scholar] [CrossRef] [PubMed]
  64. Gayathri, L.; Dhivya, R.; Dhanasekaran, D.; Periasamy, V.S.; Alshatwi, A.; Akbarsha, M.A. Hepatotoxic effect of ochratoxin A and citrinin, alone and in combination, and protective effect of vitamin E: In vitro study in HepG2 cell. Food Chem. Toxicol. 2015, 83, 151–163. [Google Scholar] [CrossRef] [PubMed]
  65. Gong, L.; Zhu, H.; Li, T.; Ming, G.; Duan, X.; Wang, J.; Jiang, Y. Molecular signatures of cytotoxic effects in human embryonic kidney 293 cells treated with single and mixture of ochratoxin A and citrinin. Food Chem. Toxicol. 2018, 123, 374–384. [Google Scholar] [CrossRef]
  66. Lee, J.-Y.; Lim, W.; Ryu, S.; Kim, J.; Song, G. Ochratoxin A mediates cytotoxicity through the MAPK signaling pathway and alters intracellular homeostasis in bovine mammary epithelial cells. Environ. Pollut. 2018, 246, 366–373. [Google Scholar] [CrossRef]
  67. Pinhão, M.; Tavares, A.; Loureiro, S.; Louro, H.; Alvito, P.; Silva, M. Combined cytotoxic and genotoxic effects of ochratoxin A and fumonisin B1 in human kidney and liver cell models. Toxicol. Vitr. 2020, 68, 104949. [Google Scholar] [CrossRef]
  68. Wang, H.; Chen, Y.; Zhai, N.; Chen, X.; Gan, F.; Li, H.; Huang, K. Ochratoxin A-Induced Apoptosis of IPEC-J2 Cells through ROS-Mediated Mitochondrial Permeability Transition Pore Opening Pathway. J. Agric. Food Chem. 2017, 65, 10630–10637. [Google Scholar] [CrossRef]
  69. Klarić, M.; Želježić, D.; Rumora, L.; Peraica, M.; Pepeljnjak, S.; Domijan, A.-M. A potential role of calcium in apoptosis and aberrant chromatin forms in porcine kidney PK15 cells induced by individual and combined ochratoxin A and citrinin. Arch. Toxicol. 2011, 86, 97–107. [Google Scholar] [CrossRef]
  70. Knecht, A.; Schwerdt, G.; Gekle, M.; Humpf, H.-U. Combinatory effects of citrinin and ochratoxin A in immortalized human proximal tubule cells. Mycotoxin Res. 2005, 21, 176–181. [Google Scholar] [CrossRef]
  71. Montalbetti, N.; Dalghi, M.G.; Albrecht, C.; Hediger, M.A. Nutrient Transport in the Mammary Gland: Calcium, Trace Minerals and Water Soluble Vitamins. J. Mammary Gland Biol. Neoplasia 2014, 19, 73–90. [Google Scholar] [CrossRef]
  72. Stelwagen, K.; Singh, K. The Role of Tight Junctions in Mammary Gland Function. J. Mammary Gland Biol. Neoplasia 2013, 19, 131–138. [Google Scholar] [CrossRef] [PubMed]
  73. Assunção, R.; Alvito, P.; Kleiveland, C.R.; Lea, T.E. Characterization of in vitro effects of patulin on intestinal epithelial and immune cells. Toxicol. Lett. 2016, 250–251, 47–56. [Google Scholar] [CrossRef] [PubMed]
  74. Assunção, R.; Pinhão, M.; Loureiro, S.; Alvito, P.; Silva, M.J. A multi-endpoint approach to the combined toxic effects of patulin and ochratoxin a in human intestinal cells. Toxicol. Lett. 2019, 313, 120–129. [Google Scholar] [CrossRef] [PubMed]
  75. Khan, N.; Binder, L.; Pantakani, D.V.K.; Asif, A.R. MPA Modulates Tight Junctions’ Permeability via Midkine/PI3K Pathway in Caco-2 Cells: A Possible Mechanism of Leak-Flux Diarrhea in Organ Transplanted Patients. Front. Physiol. 2017, 8, 438. [Google Scholar] [CrossRef]
  76. Luo, S.; Terciolo, C.; Bracarense, A.P.L.; Payros, D.; Pinton, P.; Oswald, I.P. In vitro and in vivo effects of a mycotoxin, deoxynivalenol, and a trace metal, cadmium, alone or in a mixture on the intestinal barrier. Environ. Int. 2019, 132, 105082. [Google Scholar] [CrossRef]
  77. Springler, A.; Vrubel, G.-J.; Mayer, E.; Schatzmayr, G.; Novak, B. Effect of Fusarium-Derived Metabolites on the Barrier Integrity of Differentiated Intestinal Porcine Epithelial Cells (IPEC-J2). Toxins 2016, 8, 345. [Google Scholar] [CrossRef]
  78. Wang, H.; Zhai, N.; Chen, Y.; Fu, C.; Huang, K. OTA induces intestinal epithelial barrier dysfunction and tight junction disruption in IPEC-J2 cells through ROS/Ca2+-mediated MLCK activation. Environ. Pollut. 2018, 242, 106–112. [Google Scholar] [CrossRef]
  79. Ying, C.; Hong, W.; Nianhui, Z.; Chunlei, W.; Kehe, H.; Cuiling, P. Nontoxic concentrations of OTA aggravate DON-induced intestinal barrier dysfunction in IPEC-J2 cells via activation of NF-κB signaling pathway. Toxicol. Lett. 2019, 311, 114–124. [Google Scholar] [CrossRef]
  80. Pinton, P.; Nougayrède, J.-P.; Del Rio, J.-C.; Moreno, C.; Marin, D.E.; Ferrier, L.; Bracarense, A.-P.; Kolf-Clauw, M.; Oswald, I.P. The food contaminant deoxynivalenol, decreases intestinal barrier permeability and reduces claudin expression. Toxicol. Appl. Pharmacol. 2009, 237, 41–48. [Google Scholar] [CrossRef]
  81. Prieto, P.; Graepel, R.; Gerloff, K.; Lamon, L.; Sachana, M.; Pistollato, F.; Gribaldo, L.; Bal-Price, A.; Worth, A. Investigating cell type specific mechanisms contributing to acute oral toxicity. ALTEX 2019, 36, 39–64. [Google Scholar] [CrossRef]
  82. Wang, X.; Li, L.; Zhang, G. Impact of deoxynivalenol and kaempferol on expression of tight junction proteins at different stages of Caco-2 cell proliferation and differentiation. RSC Adv. 2019, 9, 34607–34616. [Google Scholar] [CrossRef] [PubMed]
  83. Weidner, M.; Hüwel, S.; Ebert, F.; Schwerdtle, T.; Galla, H.-J.; Humpf, H.-U. Influence of T-2 and HT-2 Toxin on the Blood-Brain Barrier In Vitro: New Experimental Hints for Neurotoxic Effects. PLoS ONE 2013, 8, e60484. [Google Scholar] [CrossRef] [PubMed]
  84. McLaughlin, J.; Padfield, P.J.; Burt, J.P.H.; O’Neill, C.A. Ochratoxin A increases permeability through tight junctions by removal of specific claudin isoforms. Am. J. Physiol. Cell Physiol. 2004, 287, C1412–C1417. [Google Scholar] [CrossRef] [PubMed]
  85. Liao, P.; Liao, M.; Li, L.; Tan, B.; Yin, Y. Effect of deoxynivalenol on apoptosis, barrier function, and expression levels of genes involved in nutrient transport, mitochondrial biogenesis and function in IPEC-J2 cells. Toxicol. Res. 2017, 6, 866–877. [Google Scholar] [CrossRef] [PubMed]
  86. Schneeberger, E.E. Claudins form ion-selective channels in the paracellular pathway. Focus on “Claudin extracellular domains determine paracellular charge selectively and resistance but not tight junction fibril architecture”. Am. J. Physiol. Cell Physiol. 2003, 284, C1331–C1333. [Google Scholar] [CrossRef]
  87. Van Itallie, C.M.; Anderson, J.M. The Role of Claudins in Determining Paracellular Charge Selectivity. Proc. Am. Thorac. Soc. 2004, 1, 38–41. [Google Scholar] [CrossRef]
  88. Cummins, P.M. Occludin: One Protein, Many Forms. Mol. Cell. Biol. 2012, 32, 242–250. [Google Scholar] [CrossRef]
  89. Cicchese, J.M.; Evans, S.; Hult, C.; Joslyn, L.R.; Wessler, T.; Millar, J.A.; Marino, S.; Cilfone, N.A.; Mattila, J.T.; Linderman, J.J.; et al. Dynamic balance of pro- and anti-inflammatory signals controls disease and limits pathology. Immunol. Rev. 2018, 285, 147–167. [Google Scholar] [CrossRef]
  90. Sordillo, L.M. Mammary Gland Immunobiology and Resistance to Mastitis. Vet.-Clin. N. Am. Food Anim. Pract. 2018, 34, 507–523. [Google Scholar] [CrossRef]
  91. Hou, L.; Le, G.; Lin, Z.; Qian, G.; Gan, F.; Gu, C.; Jiang, S.; Mu, J.; Ge, L.; Huang, K. Nontoxic concentration of ochratoxin A decreases the dosage of cyclosporine A to induce chronic nephropathy model via autophagy mediated by toll-like receptor 4. Cell Death Dis. 2020, 11, 153. [Google Scholar] [CrossRef] [Green Version]
  92. Xu, H.; Hao, S.; Gan, F.; Wang, H.; Xu, J.; Liu, D.; Huang, K. In vitro immune toxicity of ochratoxin A in porcine alveolar macrophages: A role for the ROS-relative TLR4/MyD88 signaling pathway. Chem. Biol. Interact. 2017, 272, 107–116. [Google Scholar] [CrossRef] [PubMed]
  93. Wang, W.; Zhai, S.; Xia, Y.; Wang, H.; Ruan, D.; Zhou, T.; Zhu, Y.; Zhang, H.; Zhang, M.; Ye, H.; et al. Ochratoxin A induces liver inflammation: Involvement of intestinal microbiota. Microbiome 2019, 7, 151. [Google Scholar] [CrossRef] [PubMed]
  94. Islam, M.R.; Roh, Y.-S.; Cho, A.; Kim, J.; Kim, J.-H.; Eo, S.-K.; Lim, C.-W.; Kim, B. Immune modulatory effects of the foodborne contaminant citrinin in mice. Food Chem. Toxicol. 2012, 50, 3537–3547. [Google Scholar] [CrossRef] [PubMed]
  95. Cremer, B.; Soja, A.; Sauer, J.-A.; Damm, M. Pro-inflammatory effects of ochratoxin A on nasal epithelial cells. Eur. Arch. Otorhinolaryngol. 2011, 269, 1155–1161. [Google Scholar] [CrossRef]
  96. Darif, Y.; Mountassif, D.; Belkebir, A.; Zaid, Y.; Basu, K.; Mourad, W.; Oudghiri, M. Ochratoxin A mediates MAPK activation, modulates IL-2 and TNF-α mRNA expression and induces apoptosis by mitochondria-dependent and mitochondria-independent pathways in human H9 T cells. J. Toxicol. Sci. 2016, 41, 403–416. [Google Scholar] [CrossRef] [PubMed]
  97. Bougarn, S.; Cunha, P.; Gilbert, F.B.; Harmache, A.; Foucras, G.; Rainard, P. Staphylococcal-associated molecular patterns enhance expression of immune defense genes induced by IL-17 in mammary epithelial cells. Cytokine 2011, 56, 749–759. [Google Scholar] [CrossRef]
  98. Bannerman, D.D. Pathogen-dependent induction of cytokines and other soluble inflammatory mediators during intramammary infection of dairy cows1. J. Anim. Sci. 2009, 87, 10–25. [Google Scholar] [CrossRef]
  99. Ezzat Alnakip, M.; Quintela-Baluja, M.; Bohme, K.; Fernandez-No, I.; Caamano-Antelo, S.; Calo-Mata, P.; Barros-Velazquez, J. The Immunology of Mammary Gland of Dairy Ruminants between Healthy and Inflammatory Conditions. J. Vet. Med. 2014, 2014, 659801. [Google Scholar] [CrossRef]
  100. Horwitz, D.A.; Fahmy, T.M.; Piccirillo, C.A.; La Cava, A. Rebalancing Immune Homeostasis to Treat Autoimmune Diseases. Trends Immunol. 2019, 40, 888–908. [Google Scholar] [CrossRef]
  101. Bannerman, D.D.; Paape, M.J.; Chockalingam, A. Staphylococcus aureus intramammary infection elicits increased production of transforming growth factor-α, β1, and β2. Vet. Immunol. Immunopathol. 2006, 112, 309–315. [Google Scholar] [CrossRef]
  102. Chockalingam, A.; Paape, M.; Bannerman, D. Increased Milk Levels of Transforming Growth Factor-α, β1, and β2 During Escherichia coli-Induced Mastitis. J. Dairy Sci. 2005, 88, 1986–1993. [Google Scholar] [CrossRef]
  103. Kauf, A.; Rosenbusch, R.; Paape, M.; Bannerman, D. Innate Immune Response to Intramammary Mycoplasma bovis Infection. J. Dairy Sci. 2007, 90, 3336–3348. [Google Scholar] [CrossRef] [PubMed]
  104. Blach-Olszewska, Z.; Leszek, J. Mechanisms of over-activated innate immune system regulation in autoimmune and neurodegenerative disorders. Neuropsychiatr. Dis. Treat. 2007, 3, 365–372. [Google Scholar] [PubMed]
  105. Datz, C.A. Noninfectious Causes of Immunosuppression in Dogs and Cats. Vet.-Clin. N. Am. Small Anim. Pract. 2010, 40, 459–467. [Google Scholar] [CrossRef]
  106. Agahi, F.; Font, G.; Juan, C.; Juan-García, A. Individual and Combined Effect of Zearalenone Derivates and Beauvericin Mycotoxins on SH-SY5Y Cells. Toxins 2020, 12, 212. [Google Scholar] [CrossRef]
  107. Song, Y.; Liu, W.; Zhao, Y.; Zang, J.; Gao, H. Ochratoxin A induces human kidney tubular epithelial cell apoptosis through regulating lipid raft/ PTEN / AKT signaling pathway. Environ. Toxicol. 2021, 36, 1880–1885. [Google Scholar] [CrossRef]
  108. Oh, S.-Y.; Boermans, H.J.; Swamy, H.V.; Sharma, B.S.; Karrow, N.A. Immunotoxicity of Penicillium Mycotoxins on Viability and Proliferation of Bovine Macrophage Cell Line (BOMACs). Open Mycol. J. 2012, 6, 11–16. [Google Scholar] [CrossRef]
  109. Juan-García, A.; Carbone, S.; Ben-Mahmoud, M.; Sagratini, G.; Mañes, J. Beauvericin and ochratoxin A mycotoxins individually and combined in HepG2 cells alter lipid peroxidation, levels of reactive oxygen species and glutathione. Food Chem. Toxicol. 2020, 139, 111247. [Google Scholar] [CrossRef]
  110. Spevakova, I.; Fernandez-Cruz, M.-L.; Tokarova, K.; Greifova, H.; Capcarova, M. The protective effect of stilbenes resveratrol and pterostilbene individually and combined with mycotoxin citrinin in human adenocarcinoma HT-29 cell line in vitro. J. Environ. Sci. Health Part A 2020, 56, 75–88. [Google Scholar] [CrossRef]
  111. Gadagkar, S.R.; Call, G.B. Computational tools for fitting the Hill equation to dose–response curves. J. Pharmacol. Toxicol. Methods 2015, 71, 68–76. [Google Scholar] [CrossRef] [Green Version]
  112. Majima, A.; Handa, O.; Naito, Y.; Suyama, Y.; Onozawa, Y.; Higashimura, Y.; Mizushima, K.; Morita, M.; Uehara, Y.; Horie, H.; et al. Real-time monitoring of trans-epithelial electrical resistance in cultured intestinal epithelial cells: The barrier protection of water-soluble dietary fiber. J. Dig. Dis. 2017, 18, 151–159. [Google Scholar] [CrossRef] [PubMed]
  113. Akbari, P.; Braber, S.; Gremmels, H.; Koelink, P.J.; Verheijden, K.A.T.; Garssen, J.; Fink-Gremmels, J. Deoxynivalenol: A trigger for intestinal integrity breakdown. FASEB J. 2014, 28, 2414–2429. [Google Scholar] [CrossRef] [PubMed]
  114. Chopyk, D.M.; Kumar, P.; Raeman, R.; Liu, Y.; Smith, T.; Anania, F.A. Dysregulation of junctional adhesion molecule-A contributes to ethanol-induced barrier disruption in intestinal epithelial cell monolayers. Physiol. Rep. 2017, 5, e13541. [Google Scholar] [CrossRef] [PubMed]
  115. Livak, K.J.; Schmittgen, T.D. Analysis of relative gene expression data using real-time quantitative PCR and the 2−ΔΔCT Method. Methods 2001, 25, 402–408. [Google Scholar] [CrossRef]
Figure 1. Effects of (a) Ochratoxin A (OTA) and (b) Citrinin (CIT) on MAC-T cell viability after 48 h exposure, respectively. Results are presented as the percentage of viable cells compared to the untreated control (0 μmol/L). Values are presented as the mean ± SEM of 3 independent experiments. Significant differences compared to control are indicated at p < 0.01 (**) and p < 0.001 (***).
Toxins 14 00640 g001
Figure 2. Effects of (a) Ochratoxin A (OTA) and (b) Citrinin (CIT) on transepithelial electrical resistance (TEER) of MAC-T cells after 48 h exposure, respectively. Results are presented as the percentage of TEER compared to the initial TEER values prior to mycotoxin treatment and values are presented as the mean ± SEM of 3 independent experiments. Significant differences compared to control are indicated at p < 0.01 (**) and p < 0.001 (***).
Toxins 14 00640 g002
Figure 3. Effects of (a) Ochratoxin A (OTA) and (b) Citrinin (CIT) on paracellular flux of FITC-40 kDa dextran in MAC-T cells after 48 h exposure. Results are presented as the percentage of FITC-dextran flux compared to control groups (untreated) and values are the mean ± SEM of 3 independent. Significant differences compared to control (untreated) at are indicated at p < 0.01 (**).
Toxins 14 00640 g003
Figure 4. Effects of ochratoxin A at 9.6 μmol/L (OTA 9.6) and citrinin at 80 μmol/L (CIT 80) on mRNA expression of tight junction proteins (a) Zonula Occludens-1 (ZO-1), (b) Occludin and (c) Claudin 3 in MAC-T cells after 4, 24 and 48 h exposure, respectively. Results are presented as fold change and control groups (untreated) of each timepoint was used as calibrators; values are the mean ± SEM of 3 independent experiments. Significant differences compared to control (untreated) are indicated at p < 0.05 (*), p < 0.01 (**) and p < 0.001 (***), respectively.
Toxins 14 00640 g004
Figure 5. Effects of ochratoxin A at 9.6 μmol/L (OTA 9.6) and citrinin at 80 μmol/L (CIT 80) on mRNA expression of immune-related genes (a) Interleukin 6 (IL-6), (b) Tumour necrosis factor alpha (TNF-α), (c) Toll-like receptor 4 (TLR4) and (d) Transforming growth factor beta (TGF-β) in MAC-T cells after 4, 24 and 48 h exposure, respectively. Results are presented as fold change and control groups (untreated) of each timepoint were used as calibrators; values are the mean ± SEM of 3 independent experiments. Significant differences compared to control (untreated) at p < 0.05 (*), p < 0.01 (**) and p < 0.001 (***), respectively.
Toxins 14 00640 g005aToxins 14 00640 g005b
Table 1. Details of primer sequences, PCR efficiency, amplicon length, accession number of the target and reference genes.
Gene 1Primer Sequence 5′-3′PCR Efficiency (%)Amplicon Length (bp) 2Accession No.
GAPDH: FGATGGTGAAGGTCGGAGTGAAC101.711100NM_001034034.2
GAPDH: RGTCATTGATGGCGACGATGT
UXT: FTTGACACAGTGGTCCCAGAC96.603143NM_001037471.2
UXT: RCTTGGTGAGGTTGTCGCTGA
ZO-1: FGCGAAATGAGAAACAAGCACC97.78121XM_024982012.1
ZO-1: RATGAGTTGAGTTGGGCAGGAC
Claudin 3: FAGGGACTGTGGATGAACTGC108.701128NM_205801.2
Claudin 3: RCAGTAGGATGGCGATGACG
Occludin: FGCCAGCATATTCCTTCTACCC103.487139NM_001082433.2
Occludin: RAAGAGTGGAGGCAACACAGG
IL-6: FGGCTCCCATGATTGTGGTAGTT105.691523NM_173923.2
IL-6: RGCCCAGTGGACAGGTTTCTG
TNF-α: FCGGTGGTGGGACTCGTATG103.751352NM_173923.2
TNF-α: RCTGGTTGTCTTCCAGCTTCACA
TGF-β: FCCTGAGCCAGAGGCGGACTAC99.181130NM_001166068.1
TGF-β: RGCTCGGACGTGTTGAAGAAC
TLR4: FGAACAGGTAGCCCAGACAGC99.35151NM_174198.6
TLR4: RAGGCCATGATACGGTTGAAG
1 F = forward; R = reverse; 2 bp = base pair.
Publisher’s Note: MDPI stays neutral with regard to jurisdictional claims in published maps and institutional affiliations.

