Article

Fungal Species and Multi-Mycotoxin Associated with Post-Harvest Sorghum (Sorghum bicolor (L.) Moench) Grain in Eastern Ethiopia

1
School of Plant Sciences, College of Agriculture and Environmental Sciences, Haramaya University, Dire Dawa P.O. Box 138, Ethiopia
2
Institute of Technology, Food Sciences and Post-harvest Technology, Haramaya University, Dire Dawa P.O. Box 138, Ethiopia
3
Institute of Bioanalytics and Agro-Metabolomics, Department of Agrobiotechnology (IFA-Tulln), University of Natural Resources and Life Sciences, Vienna Konrad Lorenzstr. 20, A-3430 Tulln, Austria
4
Institute for Global Food Security, School of Biological Sciences, Queens University Belfast, University Road, Belfast BT7 1NN, UK
*
Author to whom correspondence should be addressed.
Toxins 2022, 14(7), 473; https://doi.org/10.3390/toxins14070473
Submission received: 10 June 2022 / Revised: 3 July 2022 / Accepted: 7 July 2022 / Published: 11 July 2022
(This article belongs to the Special Issue Mycotoxins in Feed, Food, Nutraceuticals, and Functional Food)

Abstract

:
Sorghum is the main staple food crop in developing countries, including Ethiopia. However, sorghum grain quantity and quality are affected by contaminating fungi both under field and post-harvest stage. The aim of the current study was to assessed fungal species and multi-mycotoxins associated with sorghum grain in post-harvest samples collected from eastern Ethiopia. Fungal genera of Aspergillus, Alternaria, Bipolaris, Fusarium, Mucor, Penicillium, and Rhizoctonia were recovered in the infected grain. A liquid chromatography-tandem mass spectrometric (LC-MS/MS) was used for quantification of multiple mycotoxins/fungal metabolites. Overall, 94 metabolites were detected and grouped into eight categories. All metabolites were detected either in one or more samples. Among major mycotoxins and derivatives, deoxynivalenol (137 μg/kg), zearalenone (121 μg/kg), ochratoxin A (115 μg/kg), and fumonisin B1 (112 μg/kg) were detected with maximum concentrations, while aflatoxin B1 had relatively lower concentrations (23.6 μg/kg). Different emerging mycotoxins were also detected, with tenuazonic acid (1515 μg/kg) occurring at the maximum concentration among Alternaria metabolites. Fusaric acid (2786 μg/kg) from Fusarium metabolites and kojic acid (4584 μg/kg) were detected with the maximum concentration among Fusarium and Aspergillus metabolites, respectively. Unspecific metabolites were recognized with neoechinulin A (1996 μg/kg) at the maximum concentration, followed by cyclo (L-Pro-L-Tyr) (574 μg/kg) and cyclo (L-Pro-L-Val) (410 μg/kg). Moreover, metabolites form other fungal genera and bacterial metabolites were also detected at varying levels. Apparently, the study revealed that sorghum grains collected across those districts were significantly contaminated with co-occurrences of several mycotoxins. Farmers should be the main target groups to be trained on the improved management of sorghum production.
Key Contribution: The study generated the first report of multi-mycotoxins in sorghum across the potential sorghum-producing districts of eastern Ethiopia. It identified 94 toxins, comprising mycotoxins and bacterial toxins detected in the samples. The report provides prominent information for assessment of health risk assessment of mycotoxins in sorghum grain and acquainted for possible and urgent interventions to assure consumers’ food safety.

1. Introduction

Sorghum (Sorghum bicolour L. Moench) is a tropical cereal crop cultivated in the warmer climatic areas across the world. Ethiopia is considered as one of the greatest sorghum producers, with 2,668,177.68 tons, making it the third greatest in Africa next to Nigeria (7,337,775.96 tons) and Sudan (3,722,277.78 tons) [1]. Globally, sorghum is among the most important nutritional staple grain crops for more than 500 million people, mostly in poor nations, providing carbohydrates, vitamins, protein, and minerals [2]. In Ethiopia, sorghum is grown on approximately 1,679,277.06 hectares of land, with a total annual yield of 4,517,350.21 tons [3]. About 4.5 million smallholders located in the eastern and north-west parts of the country cultivate sorghum. All of the sorghum produced in the country is used for domestic consumption, and its contribution to food security is significant. According to the Central Statistical Agency (CSA) [4], sorghum is the third most important food cereal crop in Ethiopia, after maize and teff, in terms of the total number of growers involved, area coverage, and grain production. It is typically used to make Injera, a local bread, boiled porridge or gruel, malted beverages, popped grain, as well as homemade local beverages such as tela, areke, and bordie [5]. Sorghum is the second most important crop for quality Injera next to teff in Ethiopia.
Post-harvest handling and inadequate storage conditions are the main contributing factors to food crop losses. In sub-Saharan Africa (SSA) countries, post-harvest loss is the main food crop insecurity problem [6]. In Ethiopia, massive amounts (5–26%) of cereal post-harvest losses have been reported due to poor storage conditions and a weak post-harvest system [7]. For instance, according to [8], 27% of harvested sorghum grain in Ethiopia is lost at the post-harvest stage, owing to several factors. The losses that may occur in this chain includes harvesting, drying in the field and/or on platforms, threshing and winnowing, and transport to store, farm storage, market, and market storage. Given that sorghum grain is an ideal substrate for mold development when poorly dried and stored, this subsequently contributes to post-harvest deterioration of grains. A major concern associated with grain mold is the production of mycotoxins [9].
Sorghum is affected by various fungal species in the field and post-harvest stages, known to produce mycotoxins that pose serious health risks to humans and animals that feed on contaminated grains [10,11]. Mycotoxins are natural secondary metabolites produced by fungi that grow on a variety of agricultural products including cereals, nuts, spices, apples, dried fruits, and coffee beans [12]. The majority of mycotoxins are produced by the genera of Aspergillus, Fusarium, and Penicillium species, a concern for food safety in the developed and developing world [13]. These mycotoxins are associated with human diseases such as cancer and hepatitis [14], and the trichothecenes are labeled as bioterrorism agents [15]. Mycotoxin effects in humans and animals following direct exposures varies in terms of their toxicity, e.g., carcinogenic, endocrine disorders, teratogenic, mutagenic, hemorrhagic, estrogenic, hepatotoxic, nephrotoxic, and immunosuppressive [16]. In Ethiopia, different fungal species such as A. flavus, A. niger, A. parasiticus, Alternaria, Fusarium, Penicillium, and others were isolated from sorghum grain [17,18,19]. The most important classes of mycotoxins include the highly carcinogenic aflatoxins (e.g., AFB1), trichothecenes (e.g., deoxynivalenol, DON), fumonisins (e.g., FB1), ochratoxin A (OTA), and zearalenone (ZEN) [20,21]. These toxins and several others are addressed by regulatory limits in many countries of the world after thorough risk assessment, taking into account toxicity, occurrence, and consumption data as well as economic and political considerations [22]. Furthermore, emerging mycotoxins become investigated due to the food safety concern and health impacts and advanced technology, used for diagnosing trace compounds in food matrix. Primarily, an emerging mycotoxin was reported in 2008 that deals with the Fusarium metabolites such as fusaproliferin (FP), beauvericin (BEA), enniatins (ENNs), and moniliformin (MON) [23]. However, data on the toxicity and occurrence of emerging mycotoxins are limited. Nevertheless, there have been some studies describing their potential implications for food safety [24]. Based on the scientific opinion of European Food Safety Authority (EFSA), some opinion papers about the risk to human and animal health to the presence of regulated, modified, and emerging mycotoxins have been published [25,26,27]. Emerging mycotoxins in food crops, and certainly in sorghum grain, are not exhaustively studied in Ethiopia.
Addressing the issue of mycotoxin contamination and exposure in Africa is still a pressing challenge. Among most African governments, food safety is not regarded as a priority, particularly for domestic populations [28]. For instance, in Ethiopia, there is no standard and regulation strategy for tackling mycotoxin contamination in food crops, including cereal crops. In some sub-Saharan African (SSA) countries, including Burkina Faso, Ethiopia, Mali, and Sudan, mycotoxin contamination in sorghum grain was prevalent, in which Ethiopian samples were 11.0% contaminated with several mycotoxins [29]. Among several mycotoxins detected, prevalence of sterigmatocystin, fumonisins, and aflatoxins were reported in the sorghum samples [29]. Mycotoxins from Aspergillus and Alternaria species are the mycotoxins of concern in SSA grain sorghum with regard to prevalence, concentration, and health risk exposure. Aflatoxin (344 μg/kg) and fumonisin (2041 µg/kg) in the post-harvest sorghum samples were reported from Ethiopia [18]. In Ethiopia, recently, the economic and health impacts of mycotoxin prevalence in different food crops were extensively reviewed [30]. However, such emerging mycotoxins were not heartened, likely due to limitation of exhaustive published data in the country. Indeed, [17] attempted to report multiple mycotoxins in sorghum and finger millet. However, the present study covered wide geographic areas known by sorghum production. Hence, the aim of the current study the determination of major fungal species and multi-mycotoxins associated with post-harvest sorghum grain in eastern Ethiopia, covering East and West Hararghe zones.

2. Result and Discussions

2.1. Analysis of Fungal Species in Sorghum Grain Samples

Different fungal species were isolated from the contaminated sorghum samples obtained from all districts: Aspergillus flavus, A. niger, Alternaria, Bipolaris, Fusarium, Mucor, Penicillium, and Rhizoctonia species. Bipolaris species was isolated from Fedis and Miesso districts, while Mucor species was isolated only in samples collected from Miesso district. The incidences of those fungal species infecting sorghum grain samples across those districts are presented below (Figure 1).
The maximum incidence (37%) of infection was found from Miesso district samples, followed by Fedis (27%), while samples from Goro Gutu were found to be less contaminated (15%). It could be due to Miesso and Fedis being relatively lowland, given that warm weather creates conducive conditions for fungal development, while Goro Gutu has higher elevations (Table 4). However, as a contamination factor, other associated bio-factors were not discussed in the entire sections. Different fungal species are known to contaminate sorghum grains. The taxonomic diversity of the fungal genera contaminating sorghum grain most commonly encompasses, but is not limited to, Fusarium, Aspergillus, Curvularia, Colletotrichum, and Alternaria species [31], and likely contribute to pre- and post-harvest grain deteriorations. The various fungal infections of the sorghum grain may become complex and fluctuate throughout sorghum growth, harvest, and storage practices. From Ethiopia, [17] revealed species of Aspergillus, Alternaria, Fusarium, Penicillium, Rhizopus and Epicoccum, isolated from sorghum grain. However, in the current study, apart from those dominant fungal species of Aspergillus, Alternaria, Fusarium, and Penicillium, Bipolaris and Mucor species were identified in samples from different districts and conform to the finding of [17]. The study also conforms to report of [18], which revealed A. flavus, A. niger, and A. parasiticus isolated in sorghum grain of from post-harvest in Ethiopia. Nevertheless, A. parasiticus was not recovered in our study.
Regardless of the fungal species prevalence, A. niger and Fusarium species were the most dominant, followed by A. flavus, while Rhizoctonia and Bipolaris species occurred less (Figure 2). Likewise, a similar study from Egypt revealed that, among Aspergillus species, A. niger becomes the predominant species of fungal count infecting sorghum grain, followed by A. flavus [32]. The authors also reported that Fusarium and A. parasiticus species represented less frequency [32]. In contrast to this, Fusarium species comprised to the dominant fungi. However, in another study, A. flavus was the predominant species infecting sorghum grain, while A. niger was less contaminated from Northern Shewa of Ethiopia [18]. Indeed, the current study was targeted the East and West Hararghe zones, potential sorghum-producing areas in the country. Thereby, geographical locations used for sample collections might have affect mold development, owing to the fact that ecological requirements are the main factors for fungal development. In support of this study, Ref. [19] revealed that Aspergillus and Fusarium species were the dominant fungal invasion of sorghum grain, despite being influenced by the trashing and storage period. Thus, the study affirmed that Aspergillus and Fusarium species caused adversities to sorghum grain production from eastern Ethiopia, which might subsequently lead to mycotoxin contamination and food safety problems, given that sorghum is the leading staple crop for household consumptions.

2.2. Contamination of Mycotoxin Groups in Sorghum Grain

In this study, multi-mycotoxin analysis in sorghum samples were employed, and 94 metabolites including bacterial toxins were detected. All samples were contaminated by either one or more metabolites. In total, the detected toxins comprised eight categories (Table 1). These are: major mycotoxins and derivatives (n= 13), Fusarium metabolites (n = 18), Aspergillus metabolites (n = 13), Penicillium metabolites (n = 21), Alternaria metabolites (n = 6), metabolites from other fungal genera (n = 8), Bacterial metabolites (n = 4), and unspecific metabolites (n = 11). In this case, metabolites produced by Penicillium species were most abundant, followed by Fusarium metabolites. Alternaria metabolites and bacterial metabolites were detected in less frequency. Sorghum grain contaminated with mycotoxin produced by Alternaria, Aspergillus, Fusarium, and Penicillium species were abundantly reported [9,29]. Yet in the present study, of those mycotoxin groups, metabolites of Penicillium fungi, metabolites from other genera, and unspecified metabolites were (100%) prevalent in sorghum grain across all the districts. Thus, our study affirmed that Ethiopian sorghum is contaminated with those groups of fungal origin and bacterial metabolites, which may lead to serious food safety issues due to its toxicity impacts.
Geographically, Fedis and Goro Gutu districts were from East Hararghe zones, while Doba and Miesso were from West Hararghe Zones. Moreover, irrespective of the sampled sources, those from Fedis and Miesso were 100% contaminated by five toxins out of eight toxin groups, while samples from Doba and Goro Gutu districts were contaminated with four out of eight toxin groups (Table 1). Globally, it is estimated that 60–80% of food crops are contaminated with mycotoxin [33]. So, the current study confirmed that sorghum grain in Ethiopia is highly contaminated with mycotoxins and contribute to these predictions. The lowest prevalence (15%) of major mycotoxins was revealed in the Fedis district. Those variations might have been influenced by responsible fungi-produced metabolites and handling practices. Overall, the study affirmed that various mycotoxins are abundantly contaminating Ethiopian sorghum and need further mitigation strategies to halt the health risk exposures associated with sorghum-based food consumptions, given that sorghum is the staple food crop across targeted areas.

2.3. Multi-Mycotoxins Detected in Sorghum Samples

Mycotoxins of different groups and specific metabolites produced by diverse fungal species in sorghum grain samples were presented (Table 2). Over the years, there was a report that stated that approximately 25% of world cereal crops are contaminated by mycotoxin; however, according to the recent investigations, it become raised to 60–80% [33]. Researchers revealed that about 72% of feed samples from different parts of the world collected over several years contained mycotoxins [34]. In the present study, all samples (100%) were contaminated with either one or more of mycotoxins, which could be in agreement with those earlier reports [35].
Among the major mycotoxins and derivative groups, zearalenone was the most prevalent, detected in 24% of samples, with a maximum concentration of 121 μg/kg; however, deoxynivalenol contaminated only 6% with a low prevalence rate and had maximum levels of 137 μg/kg amongst, but below the maximum tolerable level of 750 μg/kg [36]. The levels of zearalenone detected in sorghum grain in South Africa (70.5 μg/kg) [35] and Togo (25 μg/kg) [37] were found to be below the current finding. The study confirmed that, in sorghum, zearalenone contamination is more prevalent than deoxynivalenol, similar to the report of [17] from Ethiopia. However, the maximum concentration of deoxynivalenol soured zearalenone, which was in argument with the previous study [17,38]. Overall, in [38], the maximum level of deoxynivalenol was detected in sorghum samples, compared to [17] and the present study. It was also astonishing that aflatoxin B1, B2, and G1 were only detected in 1.25%, occurring in low levels and prevalence. However, one sample became contaminated with the maximum concentration of 23.6 μg/kg of aflatoxin B1; indeed, this specific figure was beyond the tolerable levels of aflatoxin B1 in cereal food, according to the EU commissions ranging from 2 to 12 μg/kg [39]. Likewise, Ref. [17] detected aflatoxin B1 in sorghum beyond the international standards in some samples. The occurrence of aflatoxins groups in low levels in sorghum grain in the present study is in agreement with different previous reports, from Ethiopia [17,38], Nigeria [40], Cameroon [41], and Togo [37]. Moreover, in harmony with our study, AFG2 was not detected in some previous studies [41,42]. Establishment of ochratoxin A levels in cereals and other commodities is used to formulate the regulations for setting the maximum tolerable levels. The European Union has set a limit of 5 µg/kg and 3 µg/kg in cereals and cereal products, respectively [43]. In the present study, ochratoxin A was detected in 5% of samples with maximum levels of 115 µg/kg, which surpassed the regulated levels 23-fold However, Ethiopia has no set limits for ochratoxin A in cereals and related products.
However, in the earlier study demonstrated from eastern Ethiopia, a total aflatoxin level (B1, B2, G1, and G2) up to 344 μg/kg and aflatoxin B1 up to 33 μg/kg were detected in the post-harvest sorghum samples [18], found more worthwhile than the current study. In the same report, a total fumonisin level ranging from 907 to 2041 μg/kg was detected [18]. Later on, the mycotoxin contamination of sorghum in SSA, notably from Ethiopia, detected the mean and maximum aflatoxin B1 (42 and 126 μg/kg), as well as fumonisin B1 (105 and 259 μg/kg) and B2 (74.4 and 106 μg/kg), respectively [29]. In the current study, the maximum levels of fumonisin B1 (112 μg/kg) and B2 (30.3 μg/kg) were detected, and this affirmed that both aflatoxins and fumonisins concentrations were found below the earlier reports. Similarly, the levels of fumonisins B1 and B2 were below the maximum tolerable limits set by EU commission countries, which are 1000 and 4000 μg/kg, respectively [36]. It is demonstrated that sorghum contamination by mycotoxins is associated with the contaminated fungi with the sorghum grain [32]. Furthermore, ochratoxin A as high as 115 μg/kg was detected, a level lower than the earlier report (175 μg/kg) [38].
Among Fusarium metabolites, moniliformin had the maximum prevalence (93%) followed by siccanol (88%), while enniatin A1 and gibepyron D, had less prevalence (2.5%, each). Consistently, in [17], moniliformin had the maximum prevalence (97%) of Fusarium metabolites origin. Furthermore, from the same groups of Fusarium metabolites, the mean and maximum concentration of fusaric acid was 204 and 2790 μg/kg, respectively, greater than what is reported in [17] (130 and 239 μg/kg), and the concentration of siccanol was 240 and 2374 μg/kg, which was reported in Ethiopian sorghum for the first time.
Presently, some Fusarium and rare Aspergillus metabolites are considered as an “emerging toxin” [44]. Those that occur most frequently are enniatins, beauvericin, apicidin, aurofusarin, culmorin, butenolide, fusaric acid, moniliformin, fusaproliferin, produced by Fusarium species, and emodin, 3-Nitropropionic acid, by Aspergillus species [45]. The maximum incidences of enniatins and beauvericin were detected in food (63 and 80%), feed (32 and 79%), and unprocessed grains (24 and 46%) collected from 2010 and 2014 in 12 European countries [24], an argument with the current report, in which moniliformin had the maximum incidences (93%). 3-Nitropropionic acid (3-NPA) had 61% prevalence with a maximum concentration of 817 μg/kg. Among the enniatin groups A, A1, B, and B2 are the most frequently reported in food and feeds [46]; concordant with our study, enniatins (A1, B, and B1) were detected in sorghum samples, albeit in low concentrations. Previously, [47] revealed the likely frequent contamination of enniatins in cereals and cereal-based foods and urged further investigation of such mycotoxins across diverse geographical regions with different climatic conditions from all over the world. Thus, the present study affirmed the contamination of enniatins as an emerging mycotoxin in sorghum grain from Ethiopia. Moniliformin is known to be a worldwide natural contaminant in cereals such as rice, wheat, oats, barley, rye, and maize [48], which entirely supported our finding. Moniliformin was firstly reported in 1982 in moldy maize from Transkei region of South Africa at levels ranging from 16 to 25 μg/kg [49]. However, moniliformin detected in the present study, mean 58 μg/kg and maximum concentration 437 μg/kg, were greater than the earlier report [17]. This indicated that those samples were adversely infected by the responsible Fusarium species. It is revealed that moniliformin is produced by different Fusarium species, but mostly by F. proliferatum [50].
Among the other Aspergillus metabolites, 3-Nitropropionic acid had the maximum prevalence (61%), while its maximum concentration (817 μg/kg) was surpassed by viomellein (1412 μg/kg), asperfuran (2630 μg/kg), and kojic acid (4584 μg/kg) subsequently. Penicillium metabolites are also commonly reported as contaminants of sorghum grain [17,51]. Presently, flavoglaucin had 100% prevalence, with maximum concentration of 1870 μg/kg. However, mycophenolic acid was found to be the second most prevalent (60%), with a maximum average mean (242 μg/kg) and concentration level of 8300 μg/kg, which was the maximum levels of all metabolites detected in the current study. This metabolite was also detected in sorghum before from Ethiopia, with a maximum concentration of 198 μg/kg [17].
Alternaria species have the ability to produce different metabolites, which play an important role in fungal pathogenicity and food safety [52]. Some Alternaria toxins are hazardous to animal health through cytotoxicity, genotoxicity, fetotoxicity, and teratogenicity [52]. Tenuazonic acid was considered as the abundant mycotoxin in the study conducted in South Africa, contaminating sorghum samples at 100%, with the maximum levels of 293 μg/kg [35]. In accordance with that, tenuazonic acid contaminated 93% of samples in this study with an average mean of 155 μg/kg and maximum level of 1515 μg/kg, which was five times the maximum concentration detected in sorghum samples from South Africa. Consistently, this metabolite with a maximum concentration of 629 μg/kg was detected in sorghum in Ethiopian before [17]. Thereby, the study affirmed, among Alternaria metabolites, Ethiopian sorghum is highly contaminated with tenuazonic acid-producing Alternaria species.
On top of fungal metabolites and multi-mycotoxins detected in sorghum samples of the present study, bacterial metabolites, which are byproducts from bacteria that contaminate food crops and feeds, were investigated [53]. Of which the concentrations ranged from 1.06 to 14.1 μg/kg for monactin and puromycin, respectively, equivalent level of monactin was detected in the report of [17], while staurosporin 105 μg/kg was detected at the maximum level and was not presented in the current study.
Mycotoxin contamination in other cereal crops such as maize was also reported from Ethiopia. An earlier study [54] reported that 88, 29.4, and 23.5% of maize samples were contaminated by aflatoxins, deoxynivalenol, and fumonisins, respectively. Furthermore, [55] reported total fumonisin levels of 25 to 4500 μg/kg in maize samples collected from 20 major maize-growing areas in the country, of which about 7% of the maize samples exceeded the maximum tolerable limit set by the EU in maize (>1000 μg/kg) [36] and surpassed the levels of fumonisin in the present study detected in sorghum grain. In addition, aflatoxin B1 was detected in the range of 3.9 to 382 μg/kg in maize grain samples [56], in which 7.7% of samples had aflatoxin B1 content higher than the maximum limit (5 μg/kg) set by EU in maize to be used as an ingredient in foodstuffs [56]. Recently, [57] detected about 23 metabolites in maize grain samples collected from south and south-west of Ethiopia and reported nivalenol (1052 μg/kg), deoxynivalenol (2158 μg/kg), zearalenone (2447 μg/kg), fumonisin B2 (2712 μg/kg), and fumonisin B1 (7069 μg/kg) were abundantly detected. The study revealed that Fusarium metabolites were prevalent among all the targeted toxins. Both incidences and levels of contaminations of aflatoxins, deoxynivalenol, and fumonisins in the present study were below the earlier reports for maize. Such variations might have been influenced owing to several factors such as the substrate, storage conditions, mold development, temperature, and relative humidity during sampled time.

2.4. Multi-Mycotoxins in Sorghum Samples across the Targeted Districts

Of these 94 metabolites detected, overall prevalence of metabolites across the sampled districts revealed that Goro Gutu had the maximum prevalence (76, 80.9%), followed by Doba (73, 77.5%), and samples from Fedis (68, 72.3%) and Miesso (64, 68.1%) were found to be relatively less contaminated.
Detected metabolites in all samples from each district with statistical comparisons of means and standard deviations were presented below (Table 3). Although aflatoxins are the most extensively studied fungal toxins due to their potency and prevalence in different crops, in our study, aflatoxins B1, B2, and G1 were detected only in samples obtained from Goro Gutu district, albeit with fewer concentrations. Aflatoxin G2 was not detected in the present study, congruent with the report of [41,42]. Moreover, ochratoxin A (7.86 ± 26.2 μg/kg) and deoxynivalenol (8.45 ± 30.7 μg/kg) subsequently had maximum mean and standard deviations in Doba district and relatively less in the remaining districts. In agreement with this, Ref. [17] revealed the maximum mean of deoxynivalenol (44.9 μg/kg) in their study, however, did not associate with the specific sampled areas. Generally, the concentration levels of major mycotoxins and derivatives showed less compared to the other analytes across the sampled areas.
Fusarium metabolites were detected in all samples with different levels of concentrations, of which fusaric acid had the maximum mean and standard deviation of 628 ± 649 μg/kg, followed by siccanol (506 ± 544 μg/kg) and moniliformin (149 ± 99.1 μg/kg) from Miesso district. This indicated that sorghum samples from that specific district abundantly infected with Fusarium species were responsible for the production of those metabolites, compared to the other districts. This can affirm that agro-ecology associated with other biophysical factors might have affected the fungal development and mycotoxin productions. Apart from those notoriously known Aspergillus metabolites such as aflatoxins, other analytes were also reported as contaminants of sorghum and its byproducts [51]. The maximum mean and standard deviation of kojic acid (546 ± 1301 μg/kg) was detected in samples from Goro Gutu district, while the maximum levels of asperfuran (307 ± 639 μg/kg) were detected in samples from Doba district. Among Penicillium metabolites, maximum mean and standard deviations of mycophenolic acid (763 ± 1801 μg/kg) were detected in Goro Gutu, followed by flavoglaucin (267 ± 471 μg/kg) from Doba district. Flavoglaucin was reported in sorghum malt from South Africa [51].
In the last decades, researchers have studied the occurrence of the major Alternaria metabolites such as alternariol, alternariolmethylether, and tentoxin [58,59,60]. However, Ref. [51] revealed tenuazonic acid as an emerging mycotoxin of Alternaria species, and it was detected in sorghum malt from South Africa. In the present study, tenuazonic acid was detected with the maximum mean and standard deviation (312 ± 321 μg/kg) from Miesso, followed by Fedis (180 ± 195 μg/kg). The earlier report [17] also reported tenuazonic acid levels as high as 1121 μg/kg in sorghum grain from Ethiopia. Thus, our finding affirmed that Alternaria species responsible for this metabolite are the most prevalent species associated with sorghum grain in Ethiopia and may warrant further study.
Among bacterial metabolites, four of them were detected in Fedis and Miesso districts, while one and two were detected in samples from Goro Gutu and Doba, respectively, notwithstanding with lower levels compared to the fungal metabolites. Metabolites from the unspecified group were also detected, with the maximum mean and standard deviation of neoechinulin A (267 ± 451 μg/kg) from Fedis district, followed by asperglaucide (183 ± 420 μg/kg) from Miesso district. To the best of our knowledge, those metabolites were not reported in sorghum and any of food crops before in Ethiopia. However, Ref. [51] reported asperglaucide and other related metabolites such as cyclo (L-Pro-L-Tyr), cyclo(L-Pro-L-Val), and tryptophol, among others, as unspecified mycotoxins in sorghum malt from South Africa, which was in agreement with the present study.
Generally, mycotoxin contamination across the sampled districts was not associated with the biophysical factors and agro-ecology of each district, owing to the incidences of contaminations and levels of concentration varied among the locations.
Several factors affect mold development and mycotoxin contaminations in sorghum grain. Contamination with these toxins can occur at different points along the production chain since it is an accumulative process that may start in the field and increase during later stages including harvesting, drying, and storage. Colonization of sorghum by toxigenic fungi could be accompanied by the production of secondary metabolites including mycotoxins [17,19]. Different management approaches—such as avoiding drought under field conditions at maturity stage, use of resistant varieties, biological control, harvesting at optimum maturity, and proper drying and use of improved storage materials—reduce mold development and subsequent mycotoxin contamination in sorghum grain. Such strategies should be implemented by small scale farmers of sorghum growing to retard mycotoxin contamination in their products and reduce health risk impacts of mycotoxins at household levels.

3. Conclusions

The present study was focused on the post-harvest sorghum grain sample collection from five districts of East and West Hararghe zones of eastern Ethiopia for fungal species determination and multi-mycotoxin analysis. Thus, different fungal genera associated to sorghum grain were identified with the maximum prevalence of A. niger and Fusarium species. All samples were subjected to multi-mycotoxin analysis, and a total of 94 metabolites were detected and grouped in to eight categories. Metabolites of Penicillium fungi occurred copiously, followed by Fusarium metabolites, while bacterial metabolites were detected with less frequency. The levels of concentrations ranged from <LOD to 8300 μg/kg of mycophenolic acid. Regulated and emerging mycotoxins and bacterial toxins were noticed, of which major food safety concerning mycotoxins of Alternaria, Fusarium, and Penicillium metabolites were detected. The results indicated that there is a need to create awareness for the growers on the proper management system at pre- and post-harvest stages and further adaptation of improved storage materials to reduce fungal development and subsequent mycotoxin production to ensure safety for sorghum-based food consumers. Thus, the study is recommended for further health risk assessment of major mycotoxins associated with sorghum grain across the studied districts and potential sorghum growing areas of the country. Developing the sorghum varieties with resistance or tolerance for grain fungal infections and mycotoxin accumulations, as well as introducing and adopting the improved storage materials with adequate handling practices, should also be the prioritized strategies.

4. Materials and Methods

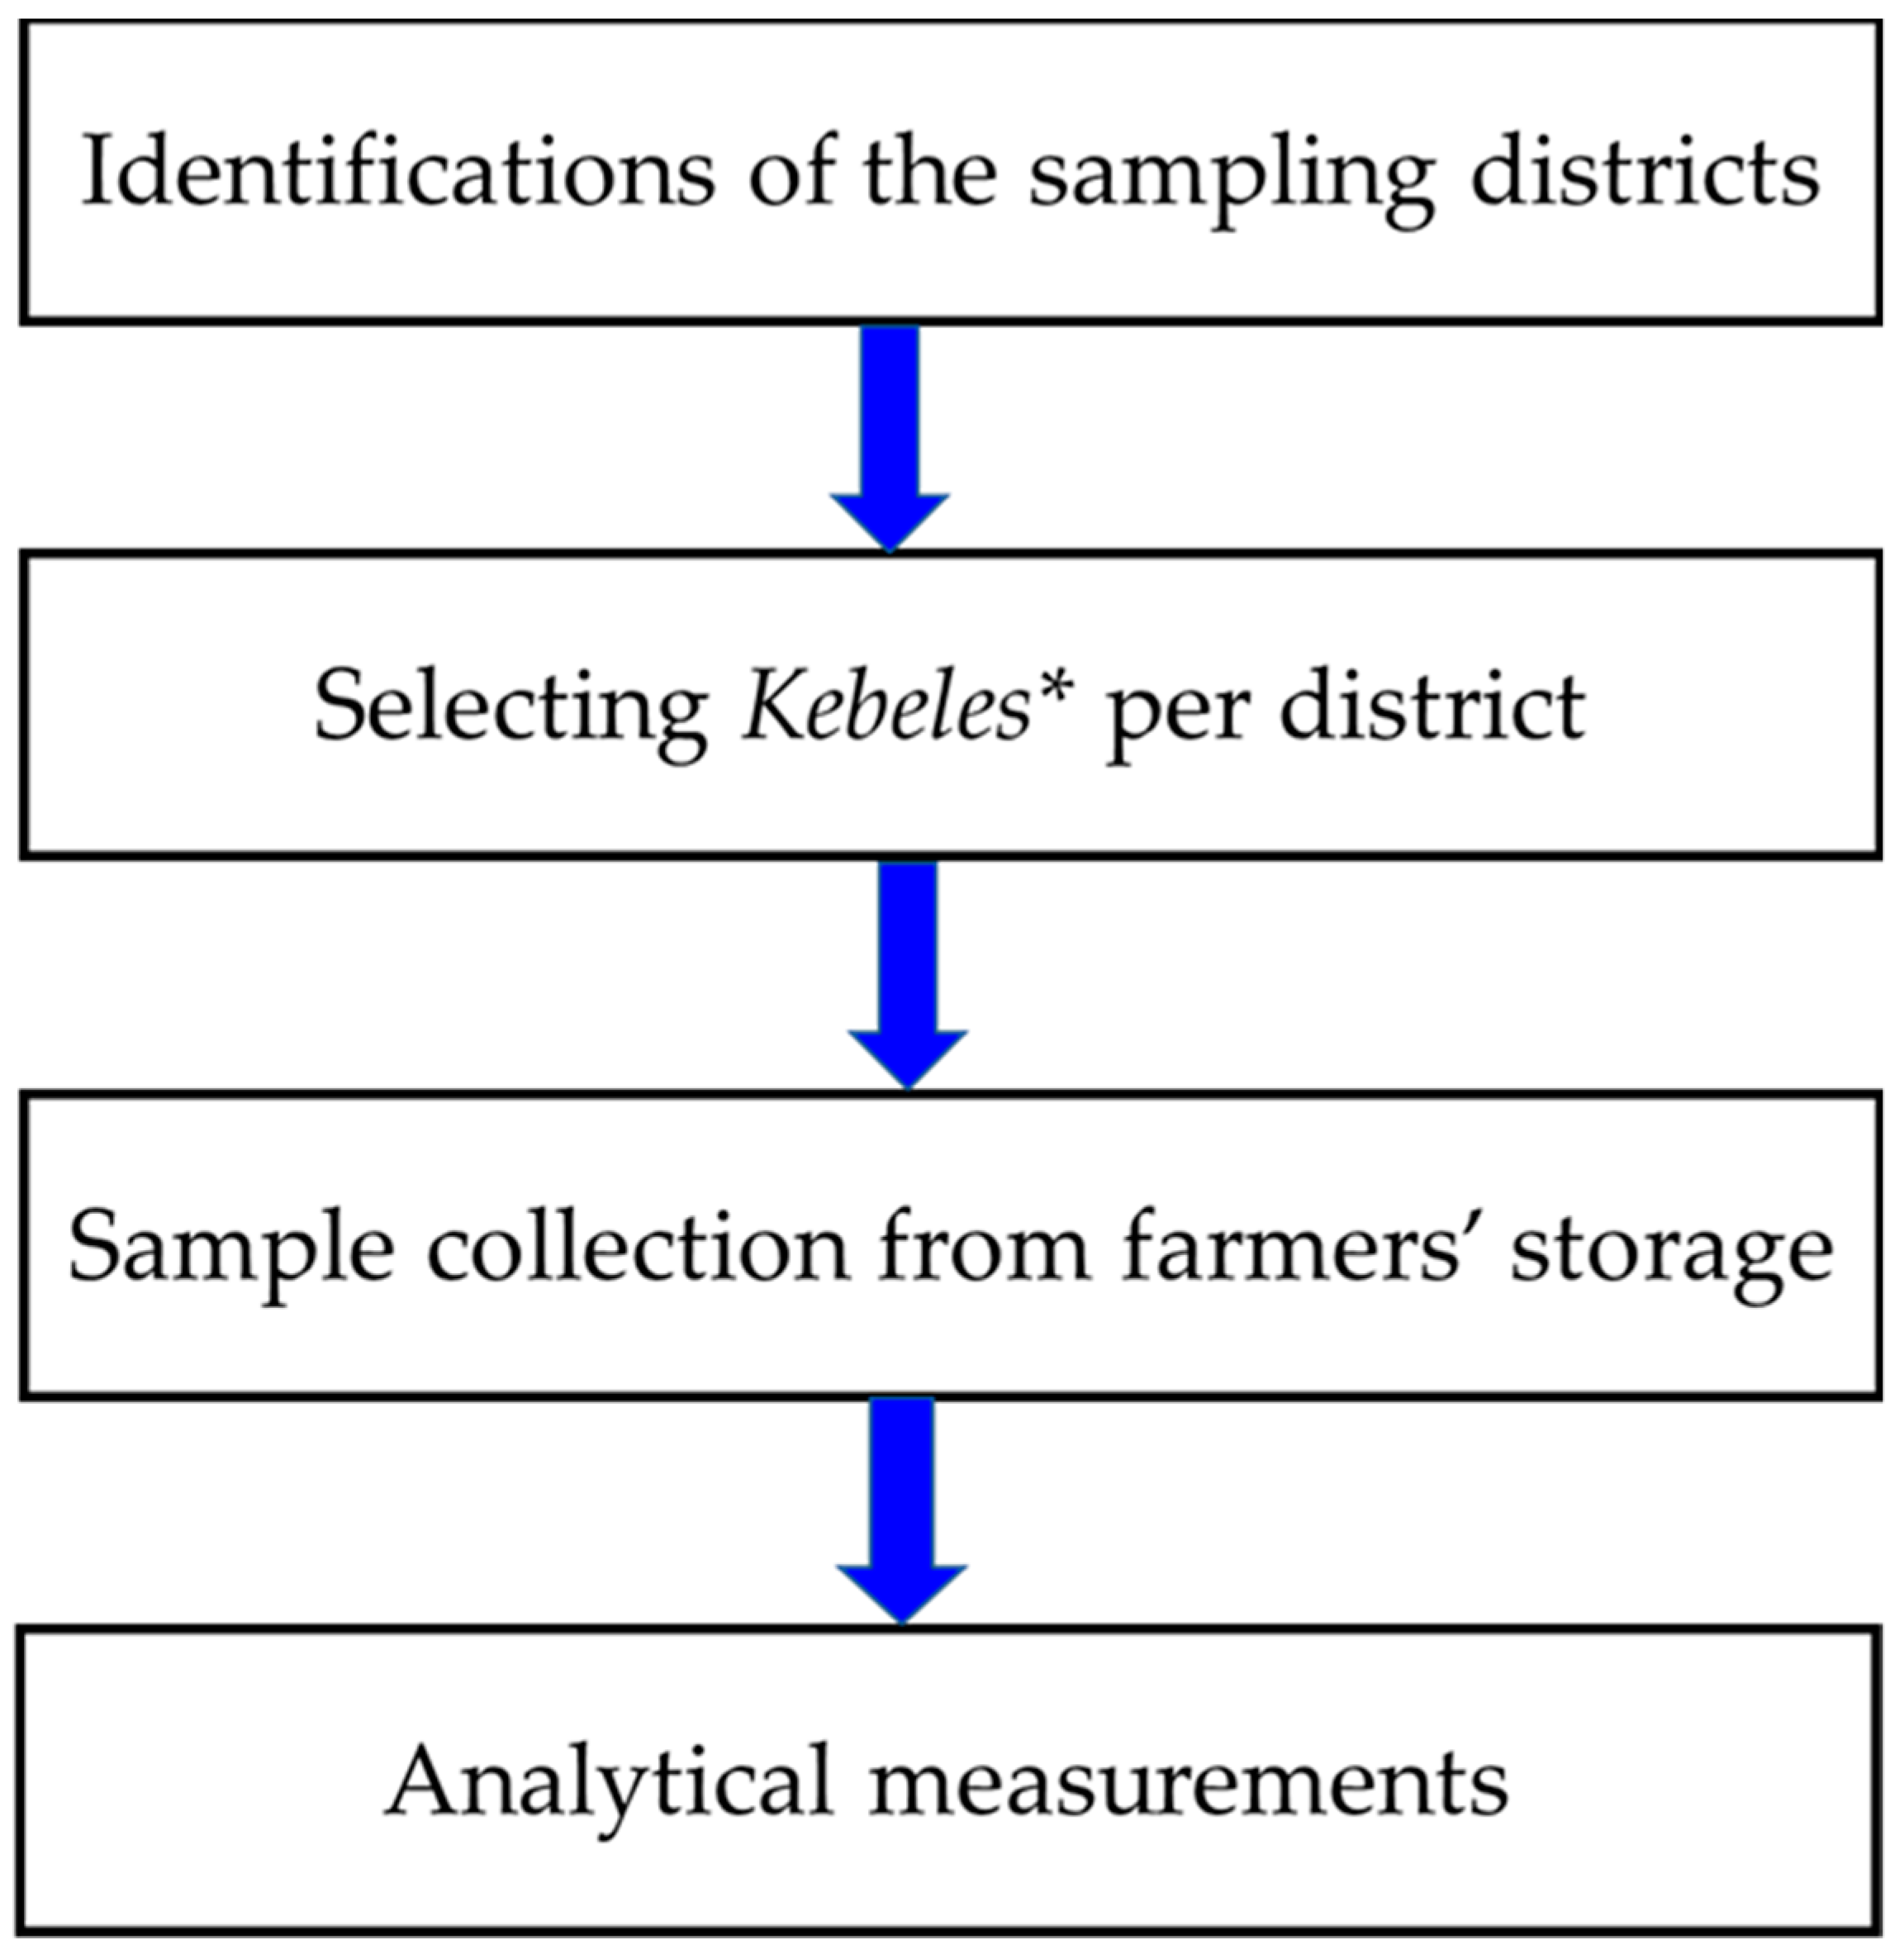
4.1. Schematic Overview of the Study

The current study was comprised of sorghum sample collections and laboratory analysis of fungal species associated to sorghum grain and multi-mycotoxins analysis (Figure 3).
This present study has been directed to find out more about major fungal species and multi-mycotoxins in sorghum grain in eastern Ethiopia. All chemicals used in this study were of analytical grade standard.

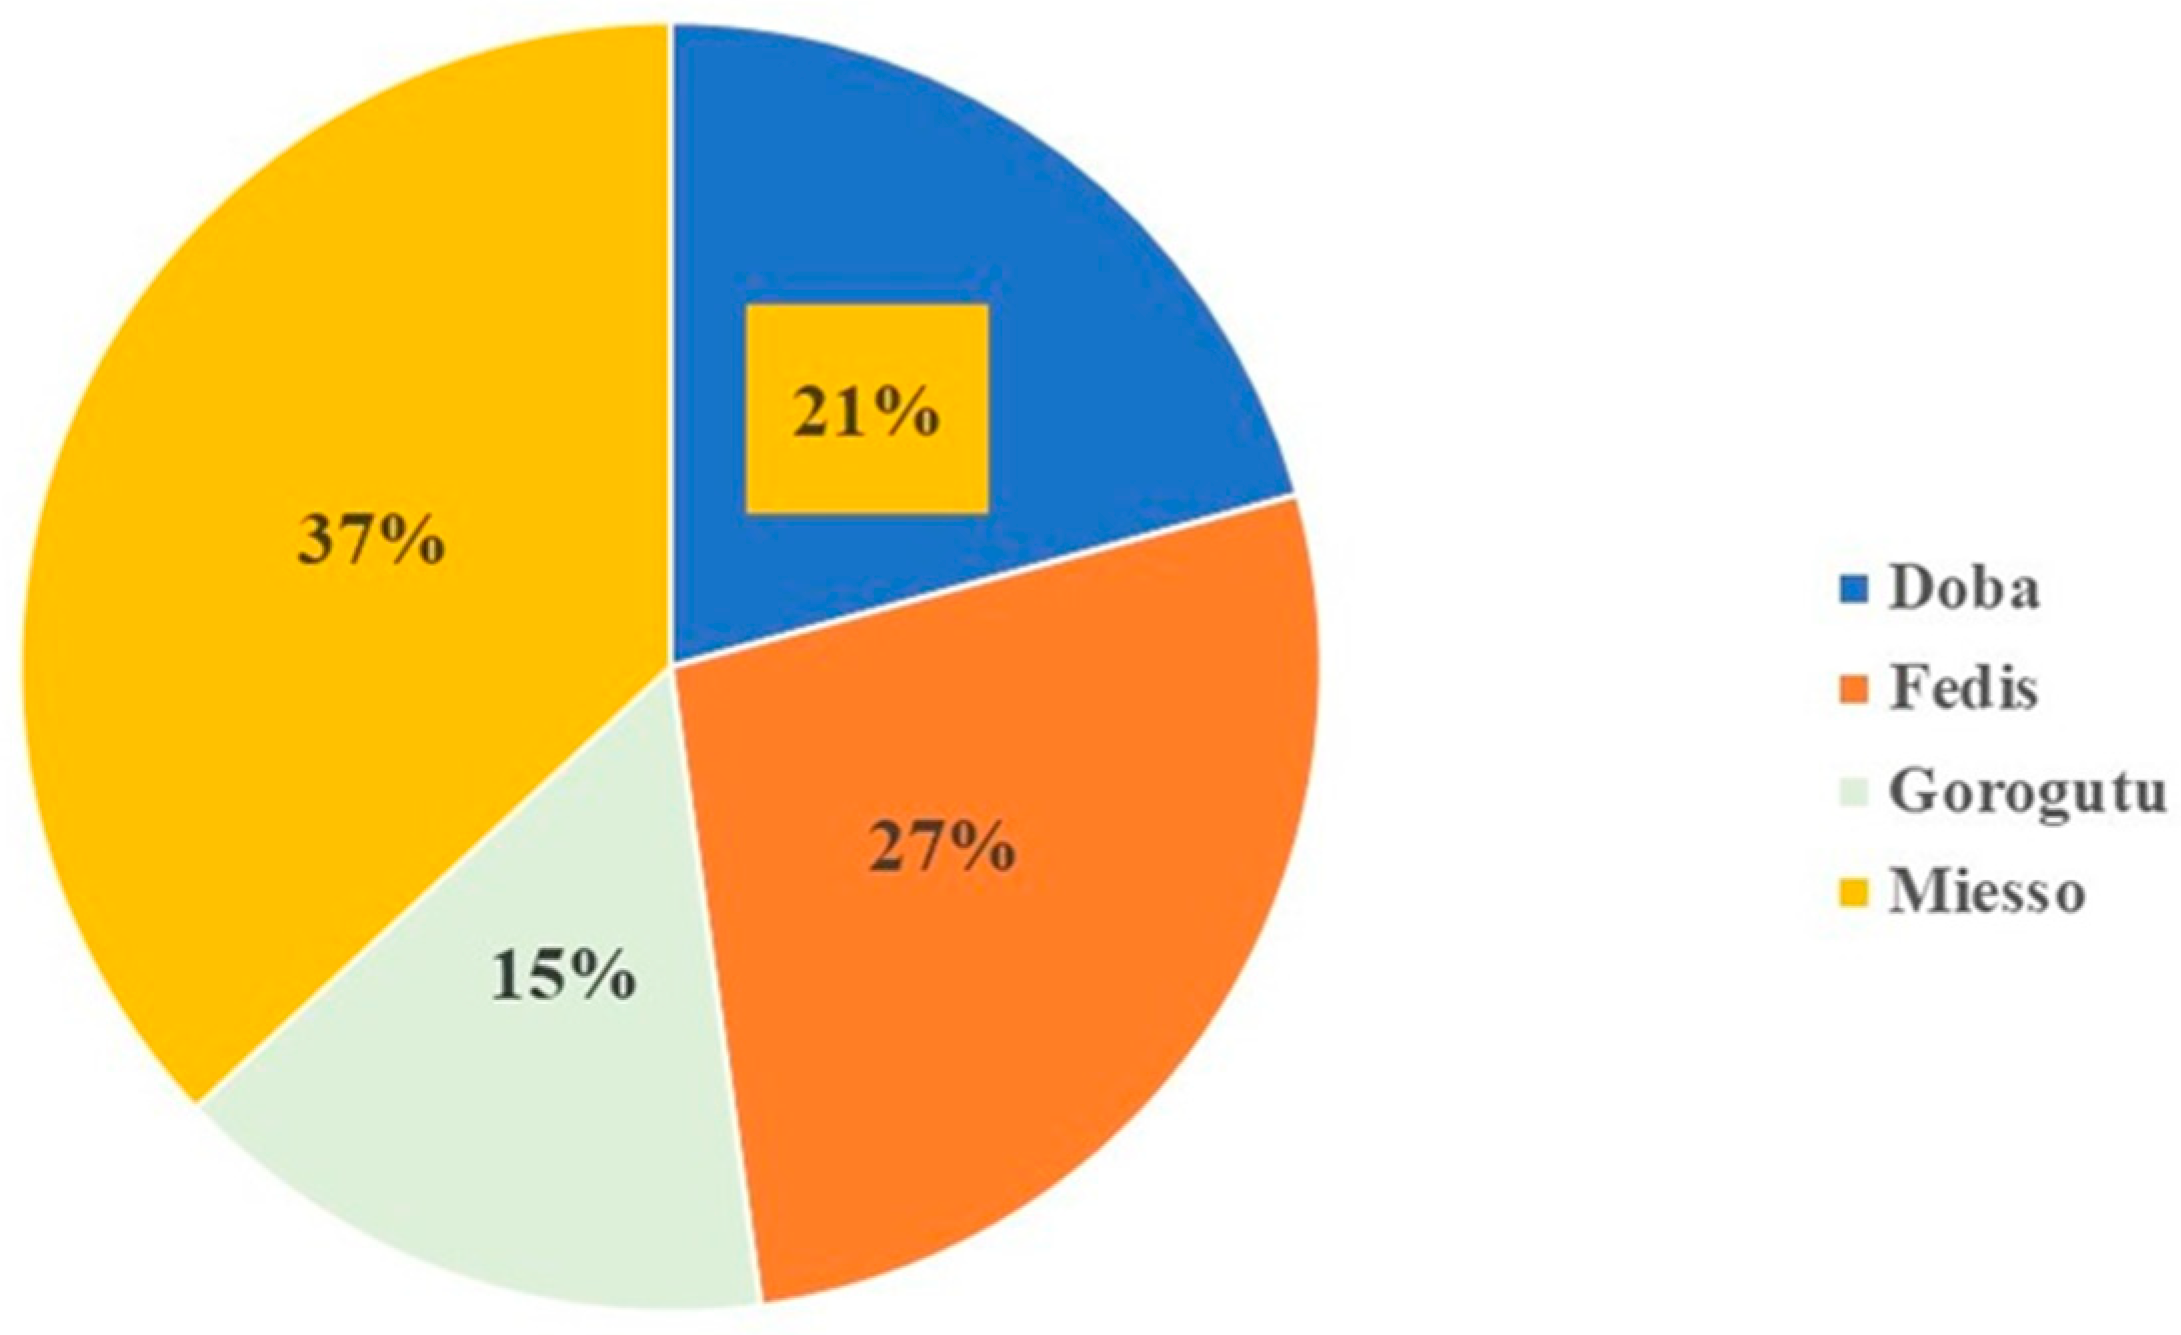
4.2. Sorghum Sample Collection

Sorghum sample collections were conducted in four districts (Doba, Fedis, Goro Gutu, and Miesso), i.e., two districts from East and West Hararghe zones (Figure 4 and Table 4). Districts were selected based on the sorghum production potential from eastern Ethiopia [61], and while there was no published data for Doba and Goro Gutu, those districts are abundantly producing sorghum. Then, four kebeles (a group of villages forming an administrative unit in Ethiopia) were selected per district and five samples were collected from each kebele, i.e., 20 samples per district and totally produced 80 samples were collected from the May to June 2021 cropping season. During sampling, households were randomly selected and the amounts of sorghum grain in the storage house were examined. The purpose of the study was explained, and then we requested to obtain the representative sample from their sorghum grain. A sampling spear was used to take a small portion of samples from different points of packs or lots and combine thoroughly to make an aggregated sample, and then divided into four parts equally. Then, one part weighing 500 g was taken and considered as household sample and placed in the sample bag. The sample numbers and dates were recorded, per kebele and district. Then, all of the samples were transported to Haramaya University for further analysis. Mycological analysis was conducted at Haramaya University, but multi-mycotoxin analysis was conducted at University of Natural Resources and Life Sciences (BOKU), Tulln, Vienna, Austria.
Table 4. Average rainfall and elevations of the selected districts.
Districts Altitude (m.a.s.l)Min and Maximum Annual Rainfall (mm)
Doba1400–2500550–800
Fedis1200–1500400–804
Goro Gutu1250–2575600–900
Miesso1100–1400400–750
Sources: Accessed from the Agriculture and Natural Resource office of the respective districts.

4.3. Analysis of Fungal Species Associated with Sorghum Grain Samples

Representatives of 60 seeds from each sample (n = 80) were randomly taken and surface-sterilized using sodium hypochlorite solution (5%) for 1–2 min and further rinsed in sterilized distilled water in two consecutive flasks for 1 min, to remove the solutions. Then, they were placed on cleaned filter paper to absorb the moisture, pre-plating. Then, for each sample, 10 seeds per plate (90 mm) in three replications were inoculated into pre-pared CZA (Czapek Agar) medium, incubated under 25 ± 2 °C, and evaluated in intervals of 24 hrs for 5 to 7 days. Incidences of infected seeds per sample were recorded daily for each district. Depending on the colony morphology, isolates were sub-cultured to newly prepared media of MEA (Malt Extract Agar) and YEA (Yeast Extract Agar) separately and incubated at 25 ± 2 °C for 5 to 7 days for subsequent characterization and taxonomic identifications. Then, further isolated fungi were identified on the basis of their micro- and macro-morphological characteristics of the standard taxonomic key using the laboratory manual series of food and indoor fungi [62]. Then, frequencies of fungal species and genera were recorded for each sampled district.

4.4. Multi-Mycotoxin Analysis in Sorghum Grain Samples

From the total 500 g, a representative 50 g of sorghum grain was taken from each sample and ground to a fine flour using a laboratory mill of RT series, pulverized with extreme high speed (25,000~30,000 RPM, Ririhong, RRH-A500, Shanghai, China). Then, a representative 5 g of sorghum flour for each sample was placed into a falcon tube of 50 mL, with 20 mL of extraction solvents (acetonitrile/water/acetic acid; 79:20:1 v/v), and extracted on a GFL 3017 rotatory shaker (GFL, Burgwedel, Germany) at 180 rpm for 90 min. Then, 500 µL of dilution solvents (acetonitrile/water/acetic acid; 20:79:1 v/v) and the 500 µL raw extract (1:1, v/v) were pipetted into HPLC vials and 5 µL were subsequently injected. Then, all samples were subjected for multi-mycotoxins analysis, using a liquid chromatography-tandem mass spectrometric (LC-MS/MS) for the simultaneous determination of multiple fungal metabolites, following the protocol developed and published [63].
Two MS/MS transitions were acquired per analyte with the exception of moniliformin and 3-nitroropionic acid, which yield only one product ion. For confirmation of a positive identification, the ion ratio had to agree with the related values of the related authentic standard within 30% as stated in official guidelines [20], whereas for the retention time a more strict in-house criterion of ±0.03 min was applied. The limit of detection (LOD) and limit of quantification (LOQ) were calculated according to the EURACHEM guide of [63]. Quantification is based on external calibration using a serial dilution of a multi-component standard mix. Results were corrected for apparent recoveries obtained by spiking experiments. The accuracy of the method is verified by participation in proficiency testing organized by BIPEA (Genneviliers, France) on a routine basis. Currently, satisfactory z-scores between −2 and 2 have been obtained for >95% of the >1700 results submitted so far. In particular, all 27 results submitted for two samples of sorghum were in this range.
The allocation of the toxins to different species was done based on the AntiBase for microbial metabolites by [64] and supported in the papers from [65,66] on a similar topic and by our own investigations of the metabolite profile of pure cultures of toxigenic fungi. We are aware that this is still somewhat arbitrary as some given metabolites might be produced by different non-related species, e.g., fumonisin B2 (produced by a Fusarium species as well as A. niger).

4.5. Data Evaluations

For data evaluations, the peaks were integrated and linear, 1/x weighted, and calibration curves were constructed from the data obtained from the analysis of each sample type (spiked sample, neat solvent standard, spiked extract) using MultiQuantTM2.0.2 software (AB Sciex, Foster City, CA, USA) to evaluate the linearity of the method. Further data evaluation was carried out in Microsoft Excel 2010, as per published earlier [63].

Author Contributions

Conceptualization, A.M., Z.B., and M.S.; methodology, M.S. and A.M.; software, M.S. and A.M.; validation, M.S.; formal analysis, M.S. and A.M.; investigation, A.M., Z.B., and M.Y.; data curation, M.S.; writing—original draft preparation, A.M.; writing—review and editing, A.M., Z.B., and M.Y.; visualization, M.S.; supervision, R.K.; project administration, A.M.; funding acquisition, A.M., M.S., and R.K. All authors have read and agreed to the published version of the manuscript.

Funding

This research was funded by the Austrian Federal Ministry of Education, Sciences and Research (BMBWF) and implemented by OeAD c/o Africa-UniNet, grant award P004_Ethiopia.

Institutional Review Board Statement

Not applicable.

Informed Consent Statement

Not applicable.

Data Availability Statement

We didn’t report any data before.

Conflicts of Interest

The authors declare no conflict of interest.

References

  1. Food and Agriculture Organization Corporate Statistical Database. FAOSTAT Food and Agriculture Organization of the United Nations Statistical Pocketbook; World Food and Agriculture: Rome, Italy, 2018; Available online: http://www.fao.org/3/CA1796EN/ca1796en.pdf (accessed on 23 April 2022).
  2. Mayer, J.E.; Pfeiffer, W.H.; Beyer, P. Biofortified crops to alleviate micronutrient malnutrition. Curr. Opin. Plant Biol. 2008, 11, 166–170. [Google Scholar] [CrossRef] [Green Version]
  3. Food and Agriculture Organization of the United Nations. FAO Food and Agriculture Data. 2021. Available online: https://www.fao.org/faostat/en/#data/QI (accessed on 24 May 2022).
  4. Central Statistical Agency. CSA Agricultural Sample Survey Report on Area and Production of Major Crops (Private Peasant Holdings ‘Meher’ Season); Statistical Bulletin 585; Central Statistical Agency: Addis Ababa, Ethiopia, 2020. [Google Scholar]
  5. Legesse, T. Physical measurements and improvement methods of protein and other nutritional quality traits of sorghum [Sorghum bicolor (L.) Moench]. Int. J. Food Eng. 2018, 2, 10–16. [Google Scholar]
  6. Rembold, F.; Hodges, R.; Bernard, M.; Knipschild, H.; Leo, O. The African postharvest losses information system (APHLIS). In EUR 24712 EN-Joint Research Centre-Institute for Environment and Sustainability; Publications Office of the European Union: Luxembourg, 2011. [Google Scholar]
  7. Tesfaye, W.; Tirivayi, N. The impacts of postharvest storage innovations on food security and welfare in Ethiopia. Food Policy 2018, 75, 52–67. [Google Scholar] [CrossRef]
  8. Food and Agriculture Organization. FAO Post-harvest Loss Assessment of Maize, Wheat, Sorghum and Haricot Bean: A Study Conducted in Fourteen Elected Woredas of Ethiopia under the Project–GCP/ETH/084/SWI; Food and Agriculture Organization: Addis Ababa, Ethiopia, 2017; Available online: https://www.fao.org/fileadmin/user_upload/food-loss-reduction/Ethiopia/Ethiopia-Baseline_PHT_food_loss_assessment_report-V25jan18__003_.pdf (accessed on 25 June 2022).
  9. Chulze, S.N. Strategies to reduce mycotoxin levels in maize during storage: A review. Food Addit. Contam. 2010, 27, 651–657. [Google Scholar] [CrossRef] [PubMed]
  10. D’Mello, J.P.F.; Placinta, C.M.; Macdonald, A.M.C. Fusarium mycotoxins: A review of global implications for animal health, welfare and productivity. Anim. Feed Sci. Technol. 1999, 80, 183–205. [Google Scholar] [CrossRef] [Green Version]
  11. Pestka, J.J.; Smolinski, A.T. Deoxynivalenol: Toxicology and potential effects on humans. J. Toxicol. Environ. Health. Part B 2005, 8, 39–69. [Google Scholar] [CrossRef]
  12. Ukwuru, M.U.; Ohaegbu, C.G.; Muritala, A. An overview of mycotoxin contamination of foods and feeds. J. Biochem. Microb. Toxicol. 2017, 1, 101. [Google Scholar]
  13. De Saeger, S. Determining Mycotoxins and Mycotoxigenic Fungi in Food and Feed; Woodhead Publishers: Cambridge, UK, 2011; ISBN 978-1-84569-674-0. [Google Scholar]
  14. Wild, C.P.; Turner, P.C. The toxicology of aflatoxins as basis for public health decisions. Mutagenesis 2002, 17, 471–482. [Google Scholar] [CrossRef]
  15. Ecker, D.J.; Sampath, R.; Willett, P.; Wyatt, J.R.; Samant, V.; Massire, C. The microbial Rosetta Stone Database: A compilation of global and emerging infectious microorganisms and bioterrorist threat agents. BMC Microbiol. 2005, 19, 19. [Google Scholar] [CrossRef] [Green Version]
  16. Ben Taheur, F.; Kouidhi, B.; Al Qurashi, Y.M.A.; Ben Salah-Abbès, J.; Chaieb, K. Review: Biotechnology of mycotoxins detoxification using microorganisms and enzymes. Toxicon 2019, 160, 12–22. [Google Scholar] [CrossRef]
  17. Chala, A.; Taye, W.; Ayalew, A.; Krska, R.; Sulyok, M.; Logrieco, A. Multi-mycotoxin analysis of sorghum (Sorghum bicolor L. Moench) and finger millet (Eleusine coracana L. Garten) from Ethiopia. Food Control 2014, 45, 29–35. [Google Scholar] [CrossRef]
  18. Weledesemayat, G.T.; Gezmu, T.B.; Woldegiorgis, A.Z.; Gemede, H.F. Study on Aspergillus species and aflatoxin levels in sorghum (Sorghum bicolor L.) stored for different period and storage system in Kewet districts, Northern Shewa, Ethiopia. J. Food Sci. Nutr. 2016, 3, 010. [Google Scholar] [CrossRef]
  19. Wondimeneh, T.; Amare, A.; Mashilla, D.; Alemayehu, C. Fungal invasion and mycotoxin contamination of stored sorghum grain as influenced by threshing methods. Int. J. Pest Manag. 2017, 64, 66–76. [Google Scholar] [CrossRef]
  20. Malir, F.; Ostry, V.; Pfohl-Leszkowicz, A.; Malir, J.; Toman, J. Ochratoxin A, 50 years of research. Toxins 2016, 8, 191. [Google Scholar] [CrossRef] [PubMed] [Green Version]
  21. McCormick, S.P.; Stanley, A.M.; Stover, N.A.; Alexander, N.J. Trichothecenes: From simple to complex mycotoxins. Toxins 2011, 3, 802–814. [Google Scholar] [CrossRef]
  22. van Egmond, H.P.; Schothorst, R.C.; Jonker, M.A. Regulations relating to mycotoxins in food: Perspectives in a global and European context. Anal. Bioanal. Chem. 2007, 389, 147–157. [Google Scholar] [CrossRef] [Green Version]
  23. Jestoi, M. Emerging Fusarium mycotoxins fusaproliferin, beauvericin, enniatins, and moniliformin—A review. Crit. Rev. Food Sci. Nutr. 2008, 48, 21–49. [Google Scholar] [CrossRef]
  24. EFSA-European Food Safety Authority. EFSA Scientific opinion on the risks to human and animal health related to the presence of beauvericin and enniatins in food and feed: Beauvericin and enniatins in food and feed. EFSA J. 2014, 12, 3802. [Google Scholar]
  25. European Food Safety Authority. EFSA Scientific opinion on the risks for animal and public health related to the presence of T-2 and HT-2 toxin in food and feed. EFSA J. 2011, 9, 187. [Google Scholar] [CrossRef]
  26. EFSA-European Food Safety Authority. EFSA Scientific opinion on risks for animal and public health related to the presence of nivalenol in food and feed. EFSA J. 2013, 11, 3262. [Google Scholar] [CrossRef]
  27. EFSA-European Food Safety Authority. EFSA Risks to human and animal health related to the presence of deoxynivalenol and its acetylated and modified forms in food and feed. EFSA J. 2017, 15, e04718. [Google Scholar] [CrossRef]
  28. Motarjemi, Y. Public health measures: Modern approach to food safety management: An overview. Encycl. Food Saf. 2013, 4, 1–12. [Google Scholar] [CrossRef]
  29. Ssepuuya, G.; Van Poucke, C.; Ediage, E.N.; Mulholland, C.; Tritscher, A.; Verger, P.; Kenny, M.; Bessy, C.; De Saeger, S. Mycotoxin contamination of sorghum and its contribution to human dietary exposure in four sub-Saharan countries. Food Addit. Contam. Part A 2018, 35, 1384–1393. [Google Scholar] [CrossRef] [PubMed]
  30. Mamo, F.T.; Abate, B.A.; Tesfaye, K.; Nie, C.; Wang, G.; Liu, Y. Mycotoxins in Ethiopia: A review on prevalence, economic and health impacts. Toxins 2020, 12, 648. [Google Scholar] [CrossRef]
  31. Cuevas, H.E.; Prom, L.K. Evaluation of genetic diversity, agronomic traits, and anthracnose resistance in the NPGS Sudan Sorghum Core collection. BMC Genom. 2020, 21, 88. [Google Scholar] [CrossRef] [PubMed]
  32. Osman, M.A.; Salama, A.; Naguib, K.H.M.; Abdel-Wahhab, M.A.; Sherif, S.R. Fungi and mycotoxins associated with Egyptian sorghum grains. MOJ Toxicol. 2017, 3, 51–56. [Google Scholar] [CrossRef] [Green Version]
  33. Eskola, M.; Kos, G.; Elliott, C.T.; Hajšlová, J.; Mayar, S.; Krska, R. Worldwide contamination of food-crops with mycotoxins: Validity of the widely cited ‘FAO estimate’ of 25%. Crit. Rev. Food Sci. Nutr. 2020, 60, 2773–2789. [Google Scholar] [CrossRef]
  34. Streit, E.; Naehrer, K.; Rodrigues, I.; Schatzmayr, G. Mycotoxin occurrence in feed and feed raw materials worldwide: Long-term analysis with special focus on Europe and Asia. J. Sci. Food Agric. 2013, 93, 2892–2899. [Google Scholar] [CrossRef]
  35. Tebele, S.M.; Gbashi, S.; Adebo, O.; Changwa, R.; Naidu, K.; Njobeh, P.B. Quantification of multi-mycotoxin in cereals (maize, maize porridge, sorghum and wheat) from Limpopo province of South Africa. Food Addit. Contam. Part A 2020, 37, 1922–1938. [Google Scholar] [CrossRef]
  36. European Commission. EU Regulation (1126/2007) amending Regulation (EC) No 1881/2006 setting maximum levels for certain contaminants in foodstuffs as regards Fusarium toxins in maize and maize products. Off. J. Eur. Union. 2007, 255, 14–17. [Google Scholar]
  37. Hanvi, D.M.; Lawson-Evi, P.; De Boevre, M.; Goto, C.E.; De Saeger, S.; Eklu-Gadegbeku, K. Natural occurrence of mycotoxins in maize and sorghum in Togo. Mycotoxin Res. 2019, 35, 321–327. [Google Scholar] [CrossRef] [PubMed]
  38. Ayalew, A.; Fehrmann, H.; Lepschy, J.; Beck, R.; Abate, D. Natural occurrence of mycotoxins in staple cereals from Ethiopia. Mycopathologia 2006, 162, 57–63. [Google Scholar] [CrossRef] [PubMed]
  39. Wageh, S.D.; Yoshinori, I.; Shouta, M.M.N.; Mayumi, I. An overview on mycotoxin contamination of foods in Africa. J. Vet. Med. Sci. 2014, 76, 789–797. [Google Scholar] [CrossRef] [Green Version]
  40. Bandyopadhyay, R.; Kumar, M.; Leslie, J.F. Relative severity of aflatoxin contamination of cereal crops in West Africa. Food Addit. Contam. 2007, 24, 1109–1114. [Google Scholar] [CrossRef] [PubMed]
  41. Ediage, E.N.; Van Poucke, C.; De Saeger, S. A multi-analyte LC–MS/ MS method for the analysis of 23 mycotoxins in different sorghum varieties: The forgotten sample matrix. Food Chem. 2015, 177, 397–404. [Google Scholar] [CrossRef]
  42. Ghali, R.; Belouaer, I.; Hdiri, S.; Ghorbel, H.; Maaroufi, K.; Hedilli, A. Simultaneous HPLC determination of aflatoxins B1, B2, G1 and G2 in Tunisian sorghum and pistachios. J. Food Compos. Anal. 2009, 22, 751–755. [Google Scholar] [CrossRef]
  43. Barber, M. The UK Code of Good Storage Practice to Reduce Ochratoxin A in Cereals. Food Standards Agency. 2007. Available online: https://www.food.gov.uk/sites/default/files/multimedia/pdfs/ochratoxinacop.pdf (accessed on 23 June 2022).
  44. Ekwomadu, T.I.; Akinola, S.A.; Mwanza, M. Fusarium Mycotoxins, their metabolites (Free, Emerging, and Masked), Food Safety Concerns, and Health Impacts. Int. J. Environ. Health Res. 2021, 18, 11741. [Google Scholar] [CrossRef]
  45. Gruber-Dorninger, C.; Novak, B.; Nagl, V.; Berthiller, F. Emerging mycotoxins: Beyond traditionally determined food contaminants. J. Agric. Food Chem. 2017, 65, 7052–7070. [Google Scholar] [CrossRef]
  46. Santini, A.; Meca, G.; Uhlig, S.; Ritieni, A. Fusaproliferin, beauvericin and enniatins: Occurrence in food—review. World Mycotoxin J. 2012, 5, 71–81. [Google Scholar] [CrossRef]
  47. Agriopoulou, S. Enniatins: An Emerging Food Safety Issue. EC Nutr. 2016, 3, 1142–1146. [Google Scholar]
  48. Sanhueza, C.E.P.; Degrossi, M.C. Moniliformin, a Fusarium mycotoxin. Rev. Mex. Micol. 2004, 19, 103–112. [Google Scholar]
  49. Thiel, P.G.; Meyer, C.J.; Marasas, W.F.O. Natural occurrence of moniliformin together with deoxynivalenol and zearalenone in Transkei corn. J. Agric. Food Chem. 1982, 30, 308–317. [Google Scholar] [CrossRef]
  50. Zain, M.E. Impact of mycotoxins on humans and animals. J. Saudi Chem. Soc. 2011, 15, 129–144. [Google Scholar] [CrossRef] [Green Version]
  51. Nafuka, S.N.; Misihairabgwi, J.M.; Bock, R.; Ishola, A.; Sulyok, M.; Krska, R. Variation of fungal metabolites in sorghum malts used to prepare Namibian traditional fermented beverages Omalodu and Otombo. Toxins 2019, 11, 165. [Google Scholar] [CrossRef] [PubMed] [Green Version]
  52. Escrivá, L.; Oueslati, S.; Font, G.; Manyes, L. Alternaria mycotoxins in food and feed: An Overview. J. Food Qual. 2017, 2017, 1569748. [Google Scholar] [CrossRef] [Green Version]
  53. Ezekiel, C.N.; Bandyopadhyay, R.; Sulyok, M.; Warth, B.; Krska, R. Fungal and bacterial metabolites in commercial poultry feed from Nigeria. Food Addit. Contam. Part A Chem. Anal. Control Expo. Risk Assess. 2012, 29, 1288–1299. [Google Scholar] [CrossRef] [PubMed]
  54. Ayalew, A. Mycotoxins and surface and internal fungi of maize from Ethiopia. Afr. J. Food Agric. Nutr. Dev. 2010, 10, 4109–4123. [Google Scholar] [CrossRef]
  55. Tsehaye, H.; Brurberg, M.B.; Sundheim, L.; Assefa, D.; Tronsmo, A.; Tronsmo, A.M. Natural occurrence of Fusarium species and fumonisin on maize grains in Ethiopia. Eur. J. Plant Pathol. 2017, 147, 141–155. [Google Scholar] [CrossRef]
  56. Yilma, S.; Sadessa, K.; Kebede, D. Fungal Infections and Aflatoxin Contamination in Maize Grains Collected from West Showa and East Wallega. Int. J. Curr. Res. Rev. 2019, 11, 16–22. [Google Scholar] [CrossRef]
  57. Mesfin, A.; Tesfamariam, K.; Belachew, T.; De Saeger, S.; Lachat, C.; De Boevre, M. Multi-mycotoxin profiling in maize reveals prevalence of Fusarium mycotoxins in South and West Ethiopia. World Mycotoxin J. 2021, 15, 73–83. [Google Scholar] [CrossRef]
  58. Fern´andez-Cruz, M.; Mansilla, L.; Tadeo, J.L. Mycotoxins in fruits and their processed products: Analysis, occurrence and health implications. J. Adv. Res. 2010, 2, 113–122. [Google Scholar] [CrossRef] [Green Version]
  59. Ostry, V. Alternaria mycotoxins: An overview of chemical characterization, producers, toxicity, analysis and occurrence in foodstuffs. World Mycotoxin J. 2008, 1, 175–188. [Google Scholar] [CrossRef]
  60. Scott, P.M.; Zhao, W.; Feng, S.; Lau, B.P.Y. Alternaria toxins alternariol and alternariol monomethyl ether in grain foods in Canada. Mycotoxin Res. 2012, 28, 261–266. [Google Scholar] [CrossRef] [Green Version]
  61. Muluken, G.; Yoseph, A.; Augustine, N.; Chemeda, F. Cereal stem borer management practices in subsistence farms of eastern Ethiopia. Int. J. Pest Manag. 2017, 63, 289–298. [Google Scholar]
  62. Samson, R.A.; Houbraken, J.; Thrane, U.; Frisvad, J.C.; Andersen, B. Food and Indoor Fungi. Laboratory Manual Series; Fungal Biodiversity Center: Utrecht, The Netherlands, 2010. [Google Scholar]
  63. Sulyok, M.; Stadler, D.; Steiner, D.; Krska, R. Validation of an LC-MS/MS-based dilute-and-shoot approach for the quantification of > 500 mycotoxins and other secondary metabolites in food crops: Challenges and solutions. Anal. Bioanal. Chem. 2020, 412, 2607–2620. [Google Scholar] [CrossRef] [Green Version]
  64. Laatsch, H. AntiBase, a Data Base for Rapid Dereplication and Structure Determination of Microbial Natural Products; Wiley-VCH: Weinheim, Germany, 2009; Available online: http://www.user.gwdg.de/nucoc/laatsch/AnitBase.htm (accessed on 24 June 2022).
  65. Frisvad, J.C.; Filtenborg, O.; Thrane, U. Analysis and screening for mycotoxins and other metabolites in fungal cultures by thin-layer chromatography and high-performance liquid chromatography. Arch. Environ. Contam. Toxicol. 1989, 18, 331–335. [Google Scholar] [CrossRef]
  66. Frisvad, J.C.; Andersen, B.; Thrane, U. The use of secondary metabolite profiling in chemotaxonomy of filamentous fungi. Mycol. Res. 2007, 112, 231–240. [Google Scholar] [CrossRef]
Figure 1. Incidences of infected samples by different fungal species across the sampled districts.
Toxins 14 00473 g001
Figure 2. Prevalence of sorghum grain samples’ contaminated fungi.
Toxins 14 00473 g002
Figure 3. Schematic overviews of the present study. * Kebele is a group of villages forming an administrative unit in Ethiopia.
Toxins 14 00473 g003
Figure 4. Schematic representation of selected districts for survey and post-harvest sorghum grain sample collections in East and West Hararghe zones.
Toxins 14 00473 g004
Table 1. Incidence (%) of mycotoxins contaminated sorghum grain samples (n = 80) from different districts of Eastern Ethiopia, from the 2021 harvesting season.
Mycotoxins GroupDobaFedisGoro GutuMiesso
Major mycotoxins and derivatives40.015.040.065.0
Fusarium metabolites95.0100100100
Aspergillus metabolites10060.095.090.0
Penicillium metabolites100100100100
Alternaria metabolites90.010095.0100
Metabolites from other fungal genera100100100100
Bacterial metabolites60.055.080.095.0
Unspecified metabolites100100100100
Table 2. Multi-mycotoxin groups and metabolites detected in sorghum grain samples (n = 80) collected at post-harvest stage from eastern Ethiopia, 2021 harvesting season.
Mycotoxins GroupSpecific Metabolites% Positive SamplesConcentration (μg/kg)
MeanMedianMax
Major mycotoxins and derivativesAflatoxin B11 (1.25)0.29<LOD23.6
Aflatoxin B21 (1.25)0.01<LOD0.79
Aflatoxin G11 (1.25)0.01<LOD0.62
Ochratoxin A4 (5.0)2.89<LOD115
Ochratoxin B4 (5.0)0.28<LOD13.8
Fumonisin B15 (6.25)2.78<LOD112
Fumonisin B22 (2.5)0.52<LOD30.3
Deoxynivalenol5 (6.25)2.70<LOD137
Nivalenol13 (16)1.66<LOD22.3
Monoacetoxyscirpenol8 (10)2.38<LOD59.1
Diacetoxyscirpenol13 (16)0.88<LOD15.3
Zearalenone19 (24)3.62<LOD121
alpha-Zearalenol1 (1.25)0.08<LOD6.52
Fusarium metabolitesMoniliformin74 (93)58.025.62437
Beauvericin17 (21)0.57<LOD10.2
Enniatin A12 (2.50)0.02<LOD0.95
Enniatin B8 (10)0.02<LOD0.65
Enniatin B13 (3.75)0.03<LOD1.14
Antibiotic Y3 (3.75)0.15<LOD8.29
Aurofusarin15 (19)4.79<LOD116
Bikaverin67 (84)80.942.3468
Chrysogin20 (25)1.72<LOD34
Deoxyfusapyron39 (49)14.8<LOD306
Epiequisetin4 (5.00)0.02<LOD0.61
Equisetin23 (29)2.42<LOD32.9
Fusapyron7 (8.80)0.99<LOD27.3
Fusaric acid43 (54)20436.62790
Gibepyron D2 (2.50)1.18<LOD50.9
Sambutoxin6 (7.50)0.02<LOD0.71
Siccanol70 (88)2401102374
W4936 (7.50)1.25<LOD31.9
Aspergillus metabolitesSterigmatocystin24 (30)2.80<LOD50.5
Methoxysterigmatocystin5 (6.25)0.80<LOD29.7
Versicolorin C8 (10)0.19<LOD6.08
Averufin23 (29)0.66<LOD11.7
8-O-Methylaverufin12 (15)0.32<LOD8.54
Kojic acid8 (10)197<LOD4580
3-Nitropropionic acid49 (61)67.89.07817
Asperflavine27 (34)3.83<LOD63
Asperfuran28 (35)218<LOD2630
Asperloxine A1 (1.25)0.04<LOD3.05
Aspochracin8 (10)6.42<LOD226
Sydonic acid2 (2.50)0.04<LOD2.77
Viomellein2 (2.50)21.2<LOD1410
Penicillium metabolitesMycophenolic acid48 (60)2428.408300
Mycophenolic acid IV16 (20)1.13<LOD47
1-Deoxypebrolide38 (48)5.46<LOD127
7-Hydroxypestalotin6 (7.50)0.44<LOD13.4
Barceloneic acid13 (16)1.27<LOD32.8
Chanoclavin4 (5.00)0.06<LOD1.71
Cycloaspeptide A5 (6.25)1.28<LOD90.5
Cyclopenin4 (5.00)0.08<LOD2.47
Cyclopenol5 (6.25)0.93<LOD33.5
Dechlorogriseofulvin6 (7.50)0.52<LOD23.5
Dehydrogriseofulvin2 (2.50)0.01<LOD0.47
F01 1358-A1 (1.25)0.10<LOD8.38
Flavoglaucin80 (100)12812.81870
Griseofulvin15 (19)0.96<LOD25.3
NP17935 (6.25)3.23<LOD129
O-Methylviridicatin4 (5.00)0.08<LOD5.29
Penicillic acid3 (3.75)0.66<LOD27.9
Quinolactacin A4 (5.00)0.07<LOD3.78
Quinolactacin B1 (1.25)0.01<LOD0.41
PF 1163A2 (2.50)0.02<LOD1.33
Rugulovasine A5 (6.25)0.58<LOD24.8
Alternaria metabolitesTenuazonic acid74 (93)15570.51520
Alternariol47 (59)3.390.7346.4
Alternariolmethylether40 (50)2.380.2635.2
Tentoxin46 (581.070.459.33
Macrosporin57 (71)5.612.3277.1
Radicinin13 (16)6.19<LOD126
Metabolites from other fungal generaAbscisic acid80 (100)17.515.846.5
Cytochalasin B2 (2.50)1.45<LOD109
Destruxin A3 (3.75)0.06<LOD2.37
Monocerin50 (63)6.050.69119
Preussin5 (6.25)0.61<LOD28.3
Terphenyllin26 (33)61.6<LOD1980
Terrein1 (1.25)1.49<LOD120
Trichodermamide C4 (5.00)0.40<LOD11.1
Bacterial metabolitesChloramphenicol55 (69)0.390.244.98
Monactin2 (2.50)0.02<LOD1.06
Nonactin4 (5.00)0.12<LOD5.4
Puromycin3 (3.75)0.35<LOD14.1
Unspecific metabolitesAsperglaucide32 (40)76.52<LOD1583
Brevianamid F26 (33)2.86<LOD110
cyclo(L-Pro-L-Tyr)80 (100)33.5820.90574
cyclo(L-Pro-L-Val)8 (10)5.71<LOD410
Emodin30 (38)1.13<LOD24.6
Fallacinol22 (28)3.32<LOD46
N-Benzoyl-Phenylalanine25 (31)2.56<LOD51
Neoechinulin A44 (55)1727.852000
Neoechinulin D54 (68)27.50.94329
Physcion18 (23)21.2<LOD309
Tryptophol11 (14)5.08<LOD210
LOD = Limit of Detection.
Table 3. Concentrations (μg/kg) of means and standard deviations (SD) of multi-mycotoxins detected in sorghum samples of 2021, across the sampled districts.
Mycotoxin GroupsSpecific MetabolitesDobaFedisGoro GutuMiesso
Means ± SD Means ± SDMeans ± SDMeans ± SD
Major mycotoxins and derivativesAflatoxin B1<LOD<LOD1.18 ± 5.28<LOD
Aflatoxin B2<LOD<LOD0.04 ± 0.18<LOD
Aflatoxin G1<LOD<LOD0.03 ± 0.14<LOD
Ochratoxin A7.86 ± 26.2<LOD3.71 ± 16.57<LOD
Ochratoxin B0.43 ± 1.10<LOD0.69 ± 3.08<LOD
Fumonisin B17.00 ± 25.45<LOD<LOD4.12 ± 9.50
Fumonisin B21.52 ± 6.78<LOD<LOD0.58 ± 2.59
Deoxynivalenol8.45 ± 30.74<LOD<LOD2.36 ± 7.96
Nivalenol<LOD0.51 ± 2.281.08 ± 2.775.05 ± 7.13
Monoacetoxyscirpenol1.08 ± 4.832.96 ± 13.22<LOD5.49 ± 10.1
Diacetoxyscirpenol0.70 ± 3.130.76 ± 3.420.24 ± 0.921.84 ± 3.47
Zearalenone2.15 ± 7.650.08 ± 0.389.47 ± 27.972.77 ± 5.98
alpha-Zearalenol<LOD<LOD0.33 ± 1.46<LOD
Fusarium metabolitesMoniliformin26.5 ± 38.127.1 ± 22.329.5 ± 27.9149 ±99.1
Beauvericin0.14 ± 0470.06 ± 0.150.56 ± 2.19 1.53 ± 2.95
Enniatin A1<LOD<LOD0.09 ± 0.28<LOD
Enniatin B0.02 ± 0.010.01 ± 0.020.07 ± 0.170.01 ± 0.03
Enniatin B1<LOD0.02 ± 0.070.09 ± 0.31<LOD
Antibiotic Y<LOD0.15 ± 0.65<LOD0.47 ± 1.86
Aurofusarin1.37 ± 5.542.76 ± 12.365.13 ± 16.89.92 ± 26.14
Bikaverin23.1 ± 51.168.3 ± 41.850.2 ± 98.6182 ± 111
Chrysogin2.53 ± 7.73<LOD2.48 ± 3.841.85 ± 2.62
Deoxyfusapyron3.53 ± 13.910.5 ± 20.54.66 ± 11.540.4 ± 66.1
Epiequisetin0.02 ± 0.08 0.02 ± 0.07<LOD0.05 ± 0.15
Equisetin0.97 ± 3.110.97 ± 2.262.92 ± 6.634.79 ± 8.53
Fusapyron<LOD<LOD0.50 ± 2.263.49 ± 6.83
Fusaric acid41.8 ± 11565.4 ± 80.882.4 ± 184628 ± 649
Gibepyron D<LOD<LOD<LOD4.73 ± 14.6
Sambutoxin0.01 ± 0.02<LOD<LOD0.06 ± 0.17
Siccanol46.5 ± 47.9274 ± 502135 ± 243506 ± 544
W4930.76 ± 3.391.55 ± 6.932.53 ± 7.490.15 ± 0.67
Aspergillus metabolitesSterigmatocystin2.86 ± 11.272.18 ± 4.741.66 ± 4.884.49 ± 11.0
Methoxysterigmatocystin1.78 ± 6.700.06 ± 0.271.38 ± 4.33<LOD
Versicolorin C0.34 ± 1.36 0.11 ± 0.370.29 ± 0.720.04 ± 0.19
Averufin0.73 ± 2.640.48 ± 0.820.82 ± 2.290.59 ± 1.44
8-O-Methylaverufin0.13 ± 0.520.07 ± 0.220.37 ± 1.510.73 ± 1.98
Kojic acid235 ± 1024<LOD546 ± 13019.31 ± 34.0
3-Nitropropionic acid85.0 ± 1159.47 ± 40.3684.2 ± 12492.7 ± 199
Asperflavine4.41 ± 10.239.55 ± 18.351.01 ± 1.660.34 ± 1.00
Asperfuran307 ± 63992.2 ±149235 ± 419238 ± 466
Asperloxine A0.15 ± 0.68<LOD<LOD<LOD
Aspochracin1.77 ± 5.5411.3 ± 50.64.12 ± 15.18.49 ± 36.2
Sydonic acid<LOD0.14 ± 0.620.03 ± 0.11<LOD
Viomellein70.6 ± 316<LOD14.1 ± 63.1<LOD
Penicillium metabolitesMycophenolic acid167 ± 27333.8 ±138763 ±18013.07 ± 5.57
Mycophenolic acid IV0.70 ± 1.370.32 ± 1.453.51 ± 10.4<LOD
1-Deoxypebrolide8.50 ± 8.530.12 ± 0.5313.21 ± 27.6<LOD
7-Hydroxypestalotin<LOD<LOD1.75 ± 3.34<LOD
Barceloneic acid<LOD0.75 ± 2.37<LOD4.31 ± 7.34
Chanoclavin0.10 ± 0.31<LOD0.05 ± 0.240.08 ± 0.38
Cycloaspeptide A<LOD4.55 ± 20.2<LOD0.60 ± 2.23
Cyclopenin0.03 ± 0.160.12 ± 0.550.16 ± 0.55<LOD
Cyclopenol1.04 ± 4.670.22 ± 0.972.48 ± 7.73<LOD
Dechlorogriseofulvin1.57 ± 5.330.27 ± 1.190.11 ± 0.480.14 ± 0.63
Dehydrogriseofulvin0.01 ± 0.03 <LOD0.02 ± 0.11 <LOD
F01 1358-A<LOD<LOD0.42 ± 1.87<LOD
Flavoglaucin267 ± 471118 ± 18191.3 ± 14834.5 ± 64.5
Griseofulvin2.51 ± 6.680.52 ± 1.000.57 ± 1.130.23 ± 1.02
NP17930.92 ± 2.866.45 ± 28.91.85 ± 8.293.71 ± 16.6
O-Methylviridicatin<LOD0.33 ± 1.190.01 ± 0.04 <LOD
Penicillic acid1.56 ± 6.24 <LOD1.09 ± 4.90<LOD
Quinolactacin A0.21 ± 0.84<LOD0.05 ± 0.18<LOD
Quinolactacin B0.02 ± 0.09<LOD<LOD<LOD
PF 1163A<LOD<LOD0.09 ± 0.03<LOD
Rugulovasine A1.41 ± 5.550.76 ± 2.350.17 ± 0.77<LOD
Alternaria metabolitesTenuazonic acid47.9 ± 43.5180 ± 19579.4 ± 96.1312 ± 321
Alternariol0.58 ± 1.093.45 ± 7.223.55 ± 10.325.99 ± 10.1
Alternariolmethylether0.39 ± 1.042.64 ± 7.762.72 ± 7.303.78 ± 6.82
Tentoxin0.17 ± 0.301.46 ± 1.570.22 ± 0.642.45 ± 2.51
Macrosporin0.88 ± 1.8911.0 ± 17.10.75 ± 0.949.78 ± 5.73
Radicinin0.46 ± 2.0512.2 ± 29.49.34 ± 23.132.82 ± 10.23
Metabolites from other fungal generaAbscisic acid16.6 ± 6.6619.4 ± 8.4214.5 ± 4.5819.49 ± 4.56
Cytochalasin B<LOD0.36 ± 1.615.43 ± 24.3<LOD
Destruxin A0.19 ± 0.610.08 ± 0.35<LOD<LOD
Monocerin8.68 ± 27.27.16 ± 7.924.68 ± 9.503.68 ± 7.17
Preussin0.63 ± 1.951.42 ± 6.330.25 ± 1.130.16 ± 0.69
Terphenyllin13.2 ± 25.4136 ± 43810.9 ±21.986.3 ± 210
Terrein5.99 ± 26.8<LOD<LOD<LOD
Trichodermamide C0.56 ± 1.750.55 ± 2.470.49 ± 2.23<LOD
Bacterial metabolitesChloramphenicol0.15 ± 0.190.12 ± 0.160.32 ± 0.311.00 ± 1.09
Monactin<LOD0.03 ± 0.14<LOD0.05 ± 0.23
Nonactin<LOD0.27 ± 1.21<LOD0.20 ± 0.76
Puromycin0.32 ± 1.410.70 ± 3.14<LOD0.39 ± 1.75
Unspecific metabolitesAsperglaucide58.0 ± 13563.1 ±1301.74 ± 3.86183 ± 420
Brevianamid F1.01 ± 2.146.22 ± 24.41.51 ± 2.182.71 ± 2.79
cyclo(L-Pro-L-Tyr)19.9 ± 12.448.9 ± 12422.4 ± 12.343.1 ±27.8
cyclo(L-Pro-L-Val)<LOD20.5 ± 91.6<LOD2.34 ± 3.31
Emodin0.62 ± 1.332.99 ± 5.810.67 ± 1.390.26 ± 0.46
Fallacinol3.18 ± 7.236.98 ± 12.62.64 ± 8.620.51 ± 1.66
N-Benzoyl-Phenylalanine3.39 ± 5.640.32 ± 0.604.70 ± 11.81.84 ± 4.08
Neoechinulin A250 ± 480267 ± 451109 ± 17659.9 ± 136
Neoechinulin D33.4 ± 76.249.6 ± 93.416.9 ± 27.29.99 ± 21.2
Physcion28.7 ± 69.447.0 ± 78.06.37 ± 19.62.85 ± 12.8
Tryptophol5.15 ± 10.211.5 ± 47.03.73 ± 7.78<LOD
Publisher’s Note: MDPI stays neutral with regard to jurisdictional claims in published maps and institutional affiliations.

