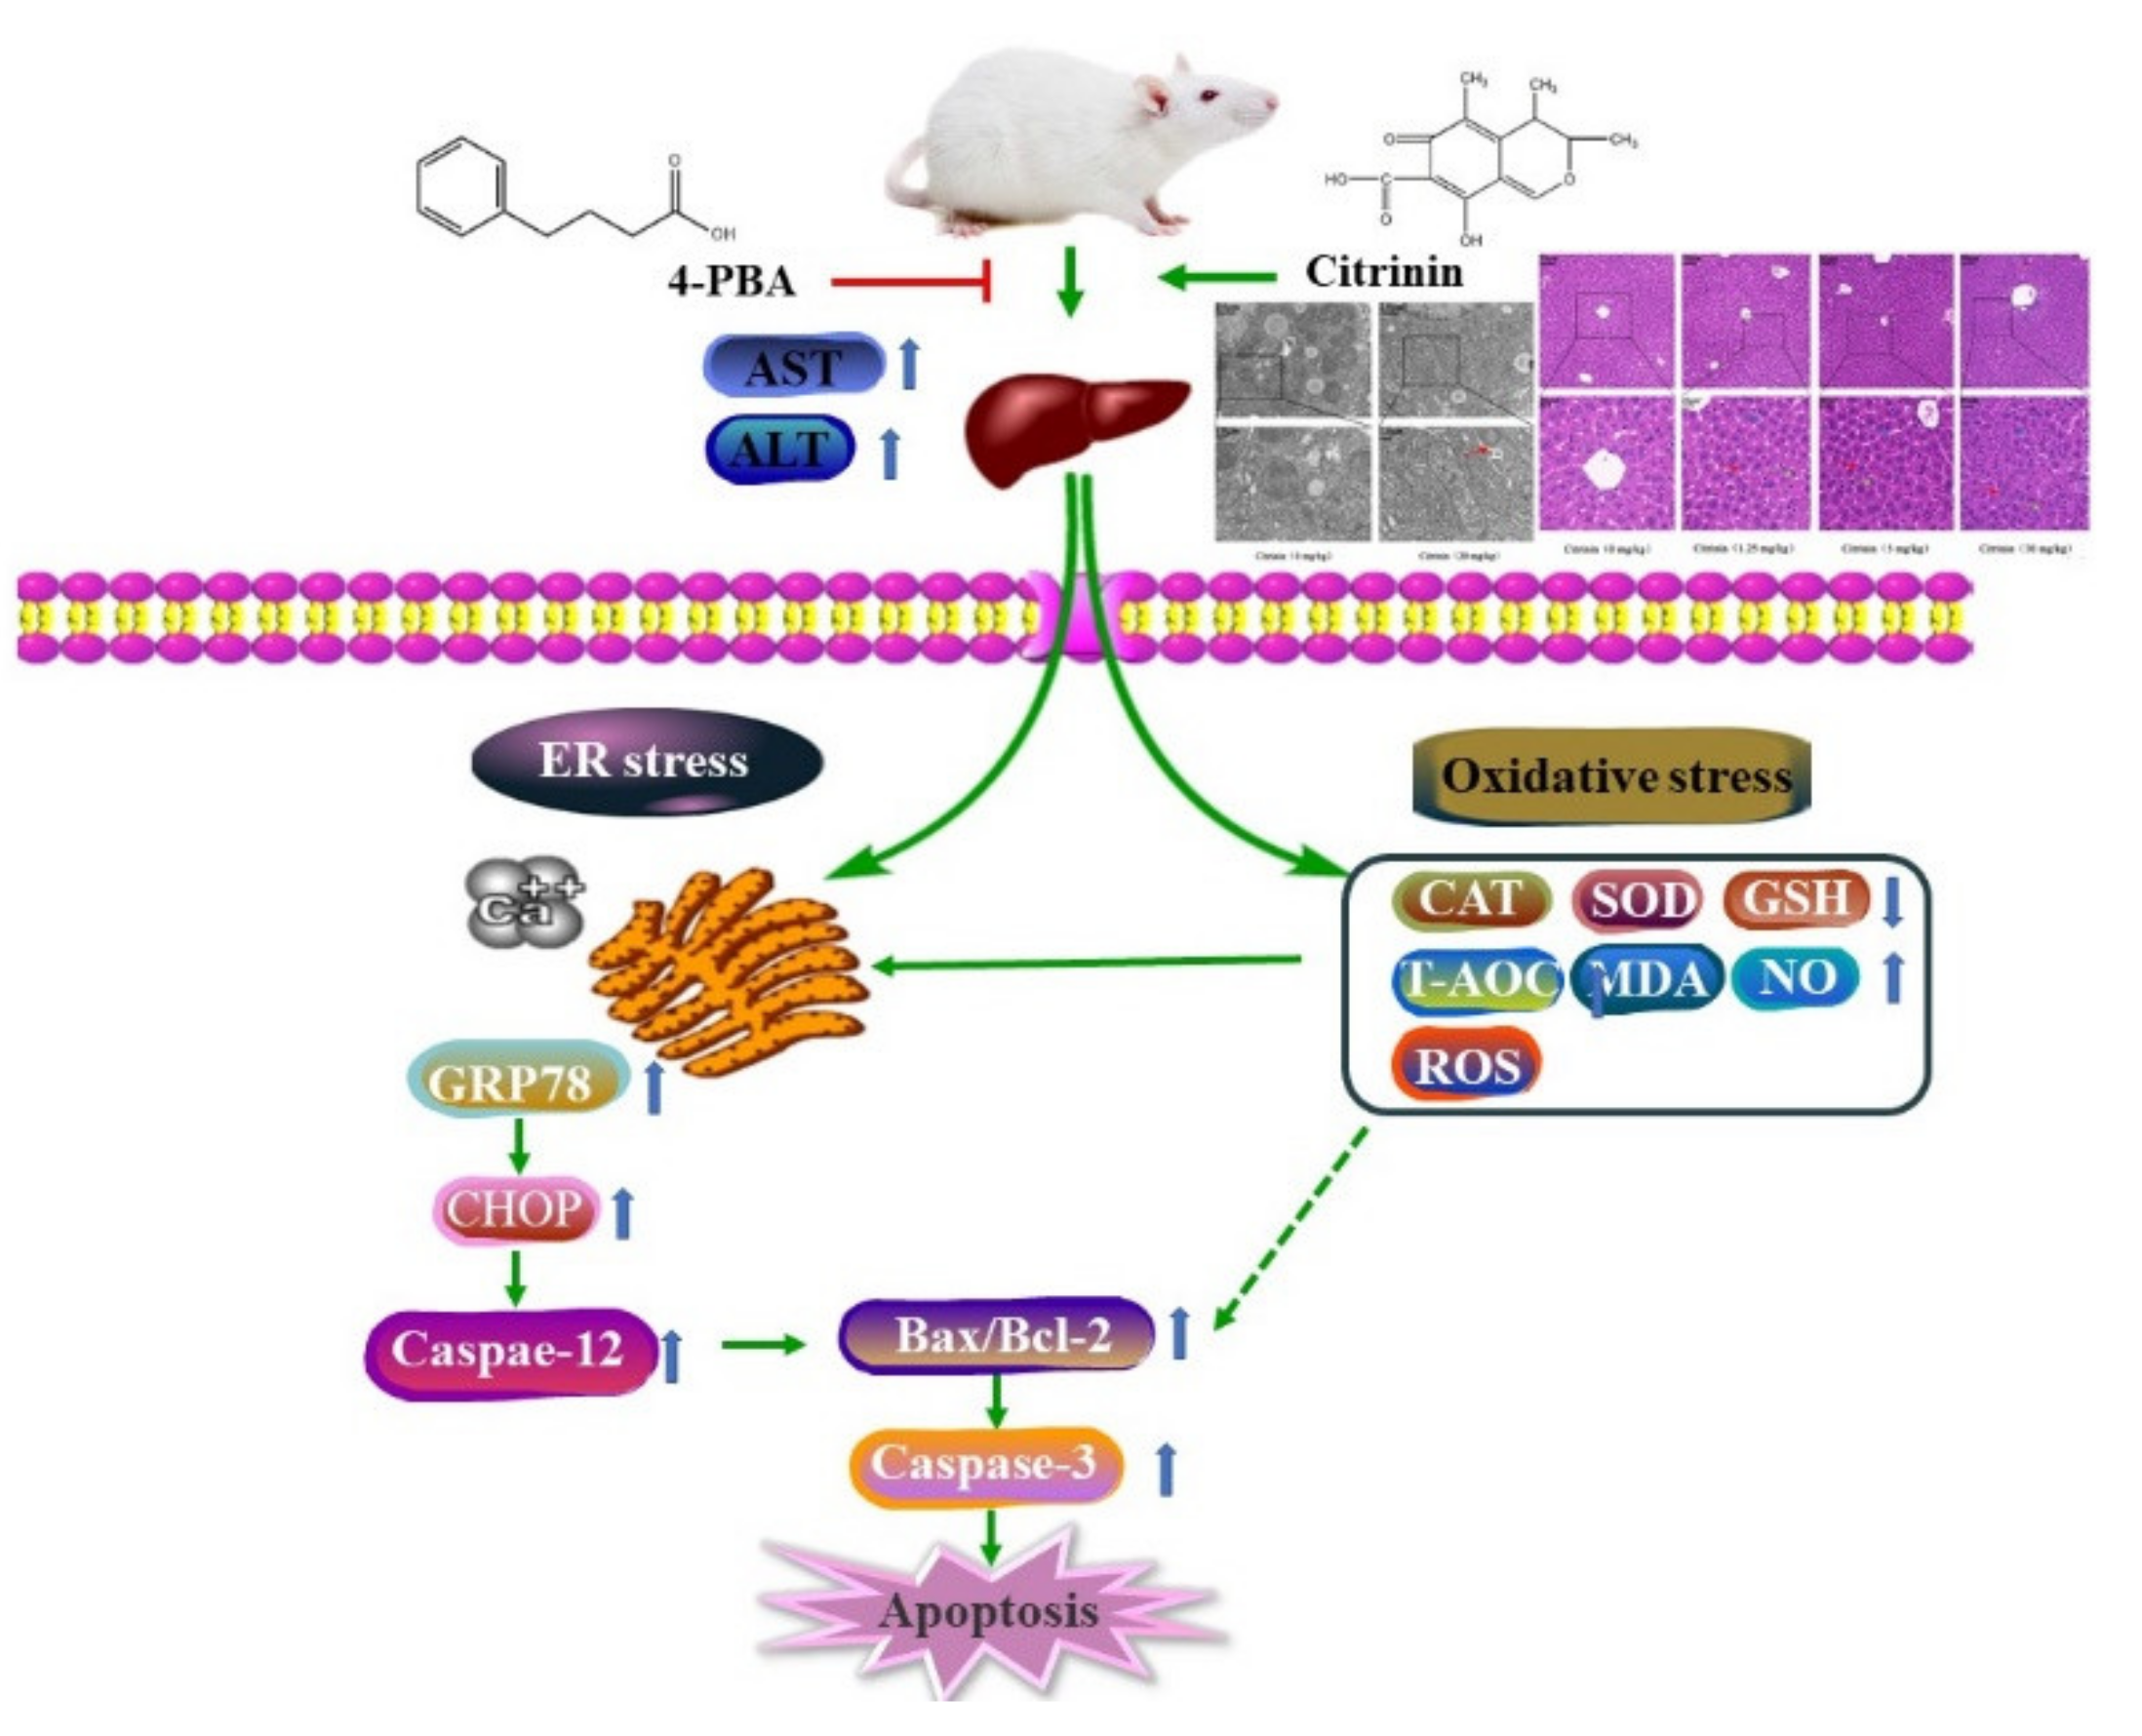
Citrinin-Induced Hepatotoxicity in Mice Is Regulated by the Ca2+/Endoplasmic Reticulum Stress Signaling Pathway

 , and
, and 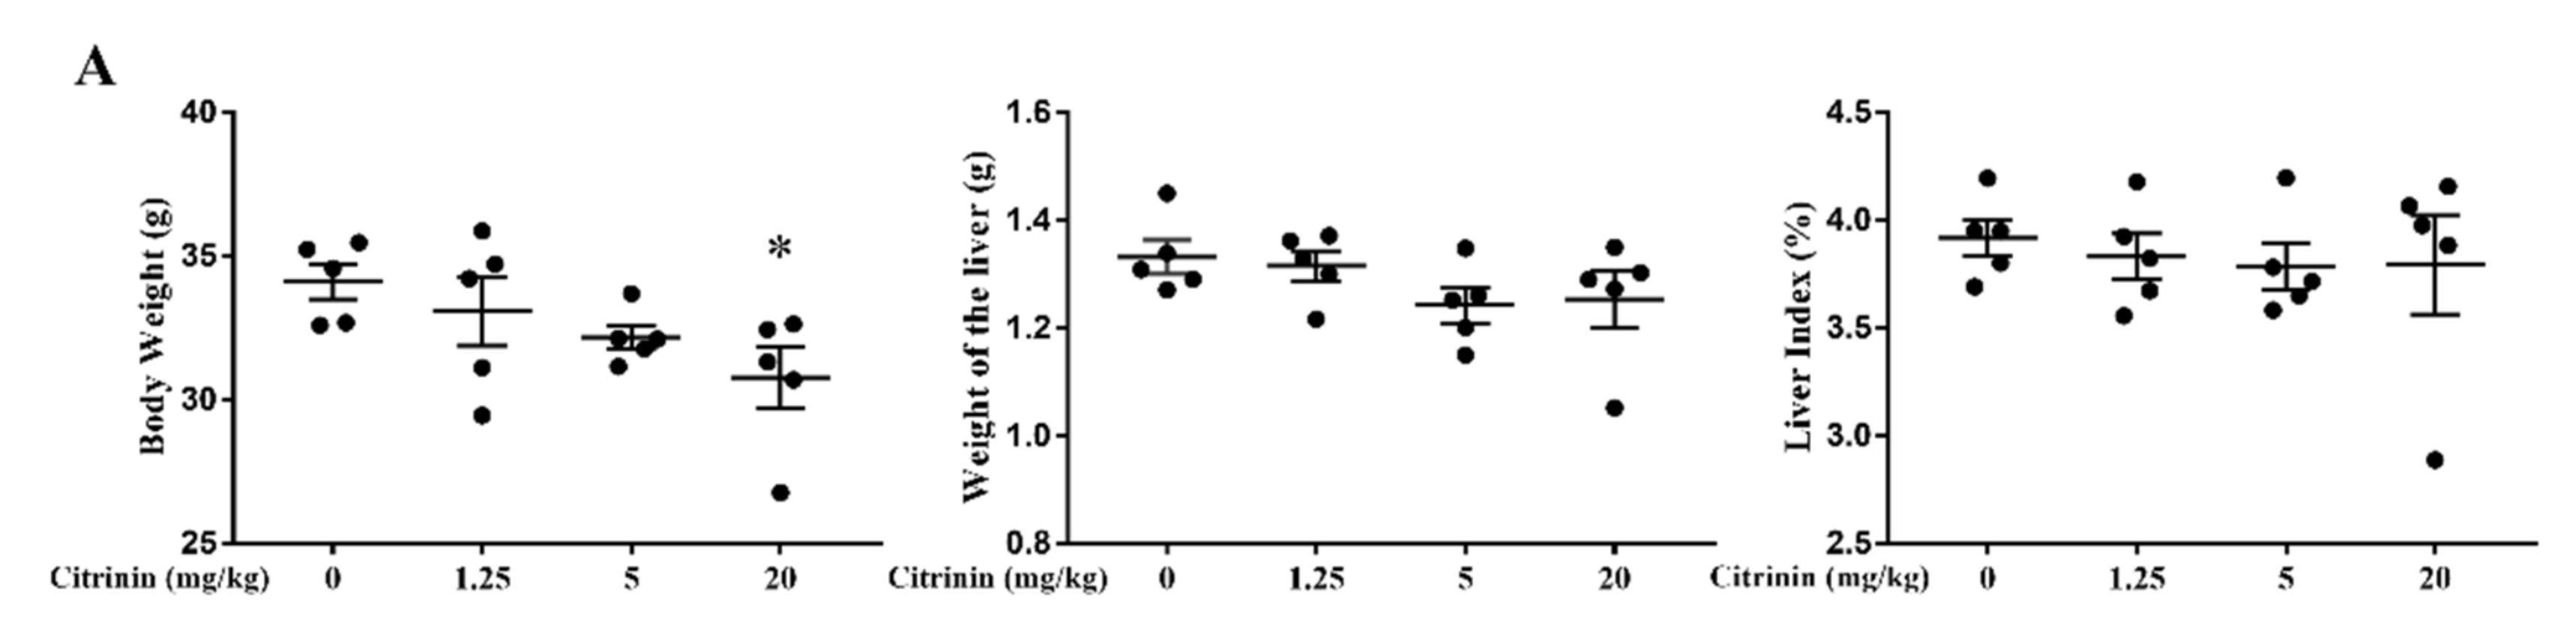
Abstract
:1. Introduction
2. Results
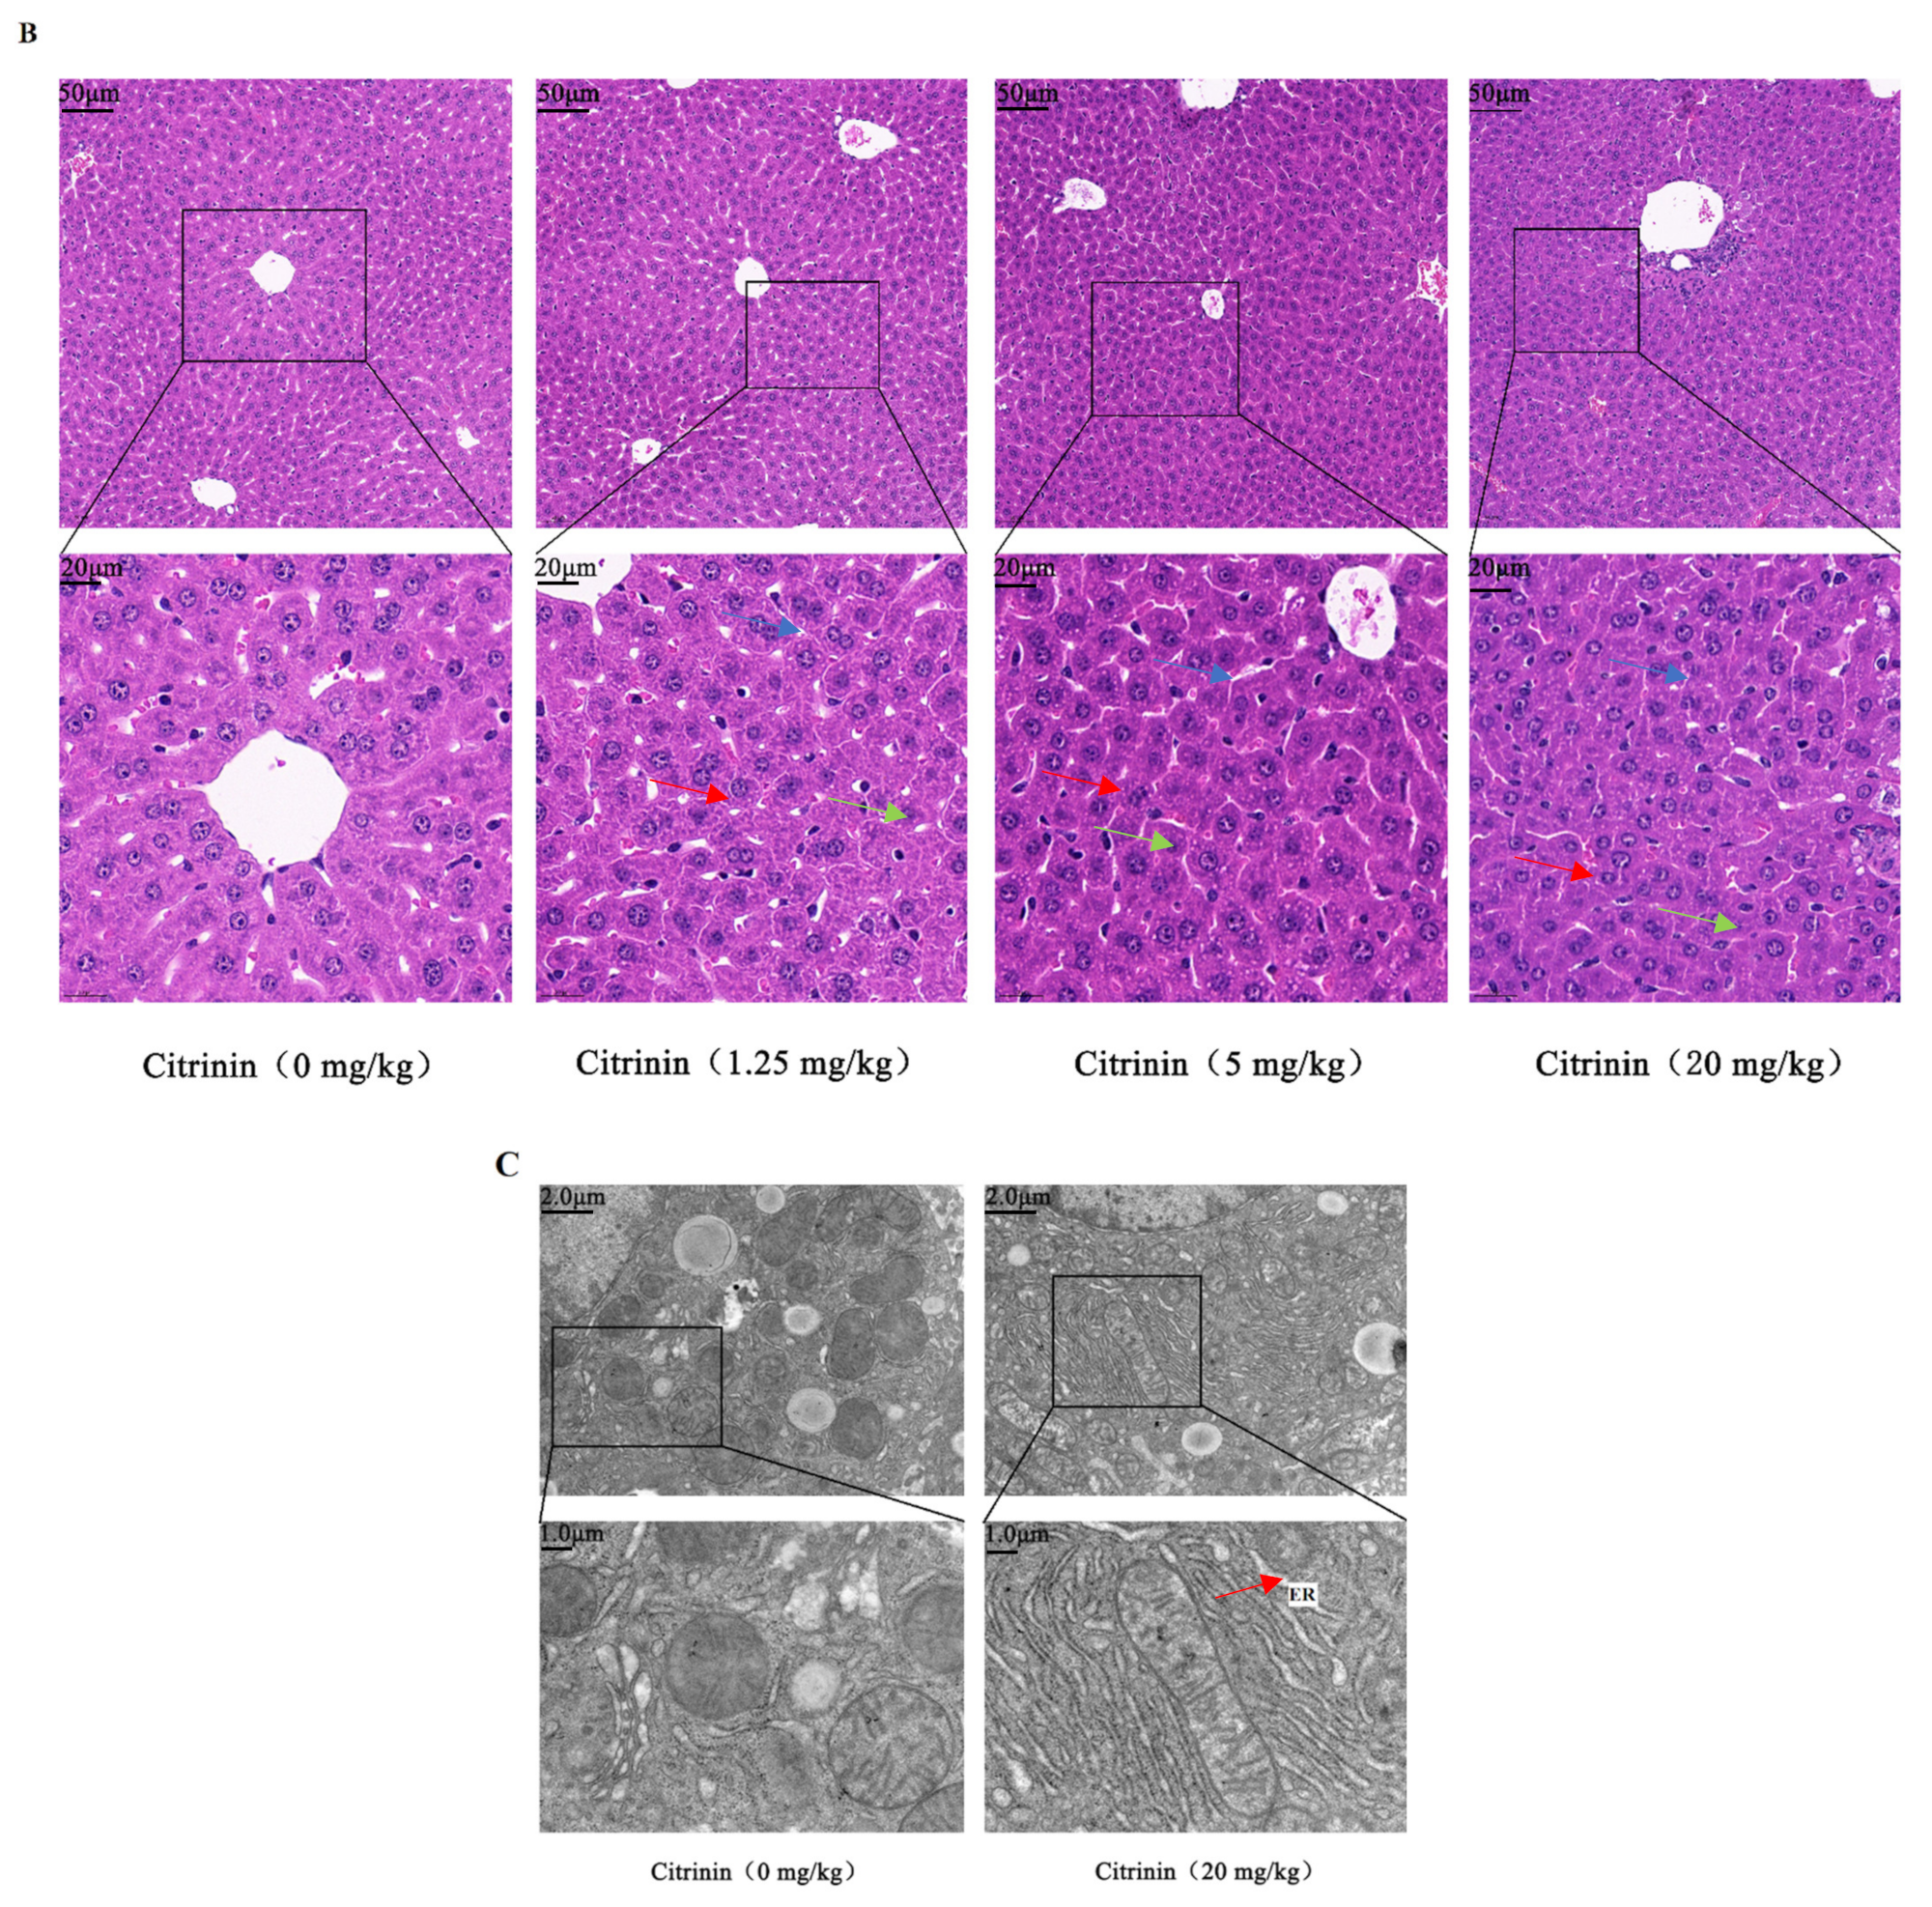
2.1. The Effects of CTN on Liver Injury
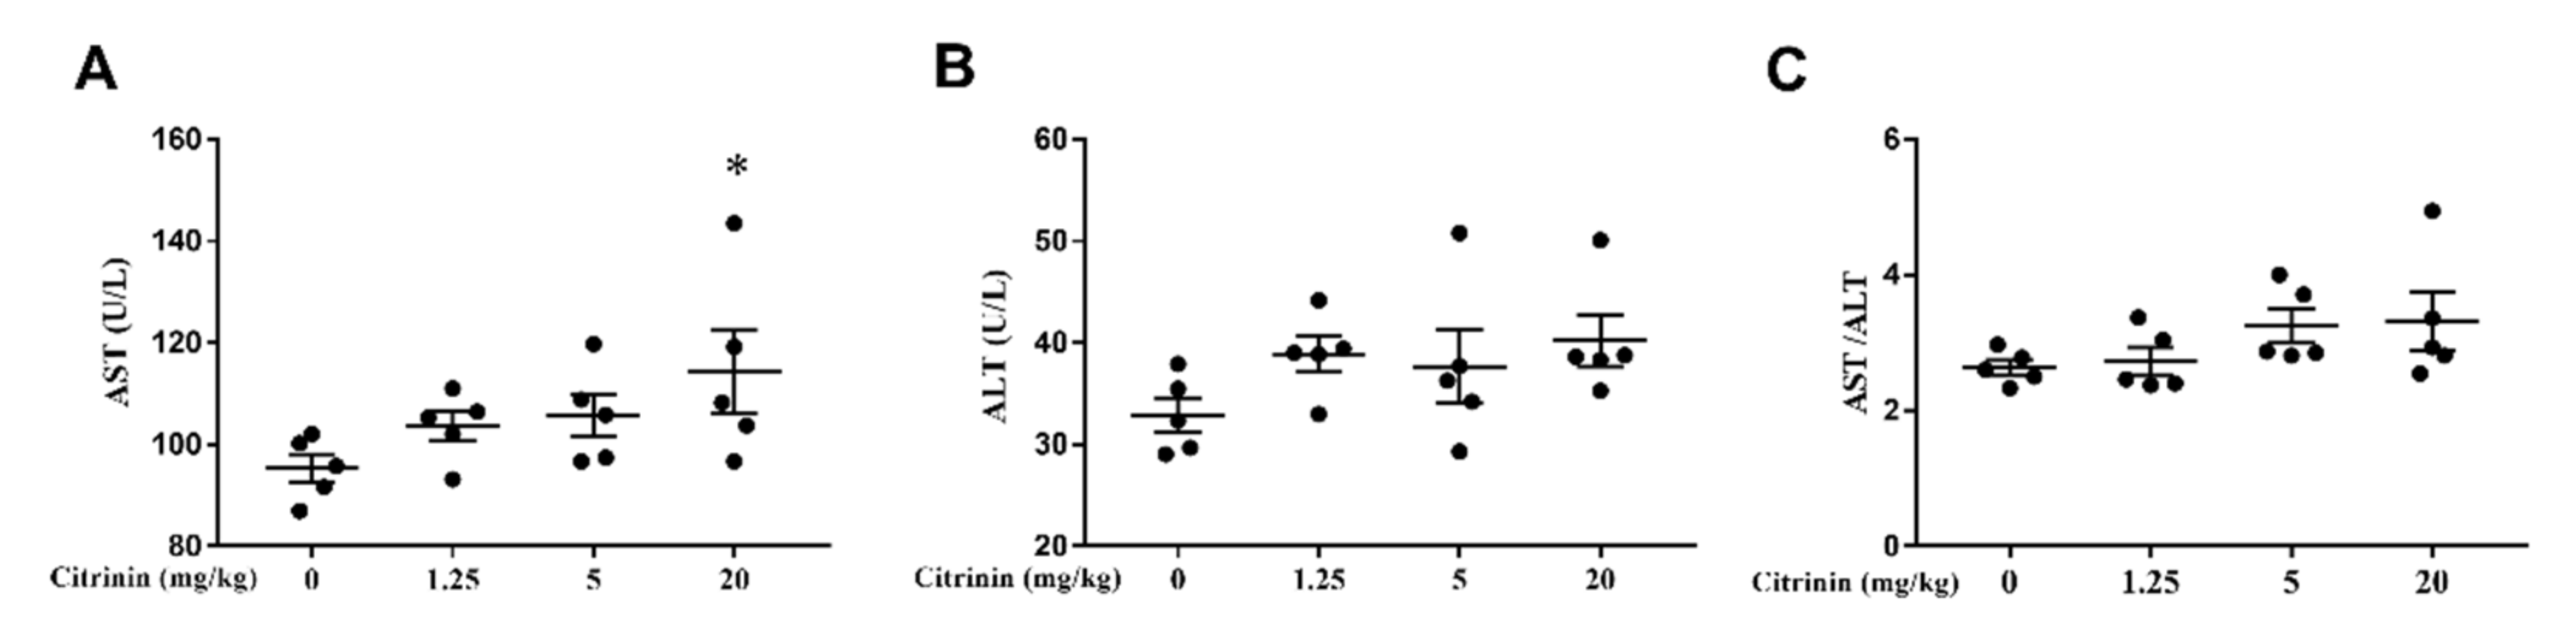
2.2. The Effects of CTN on Biochemical of Liver Functions
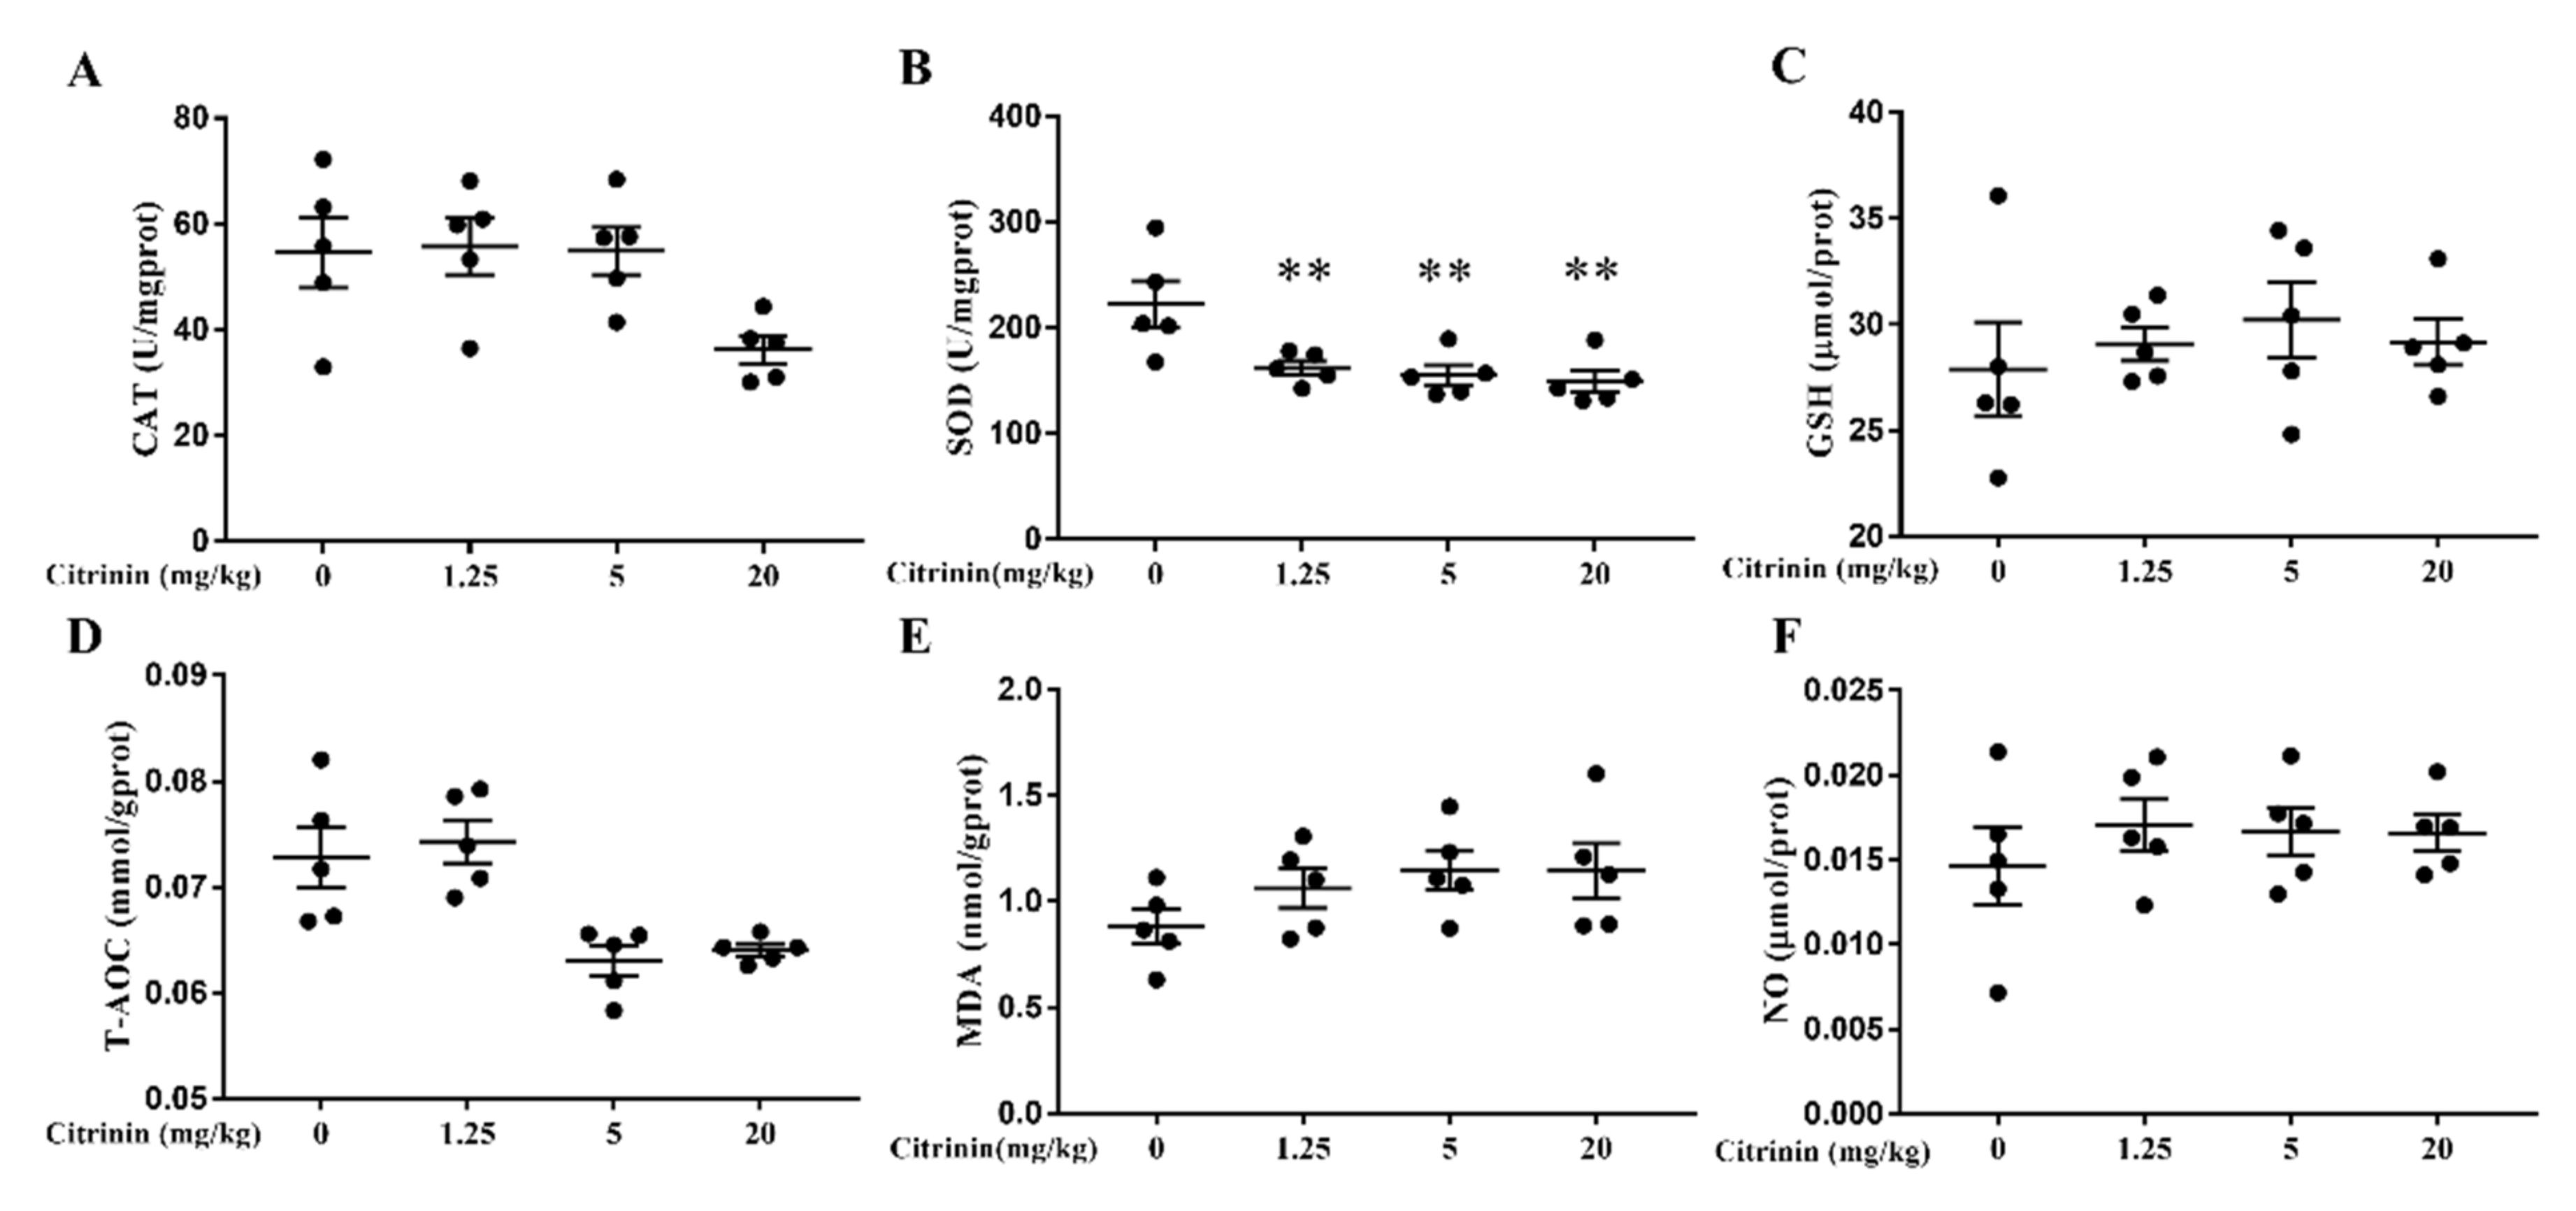
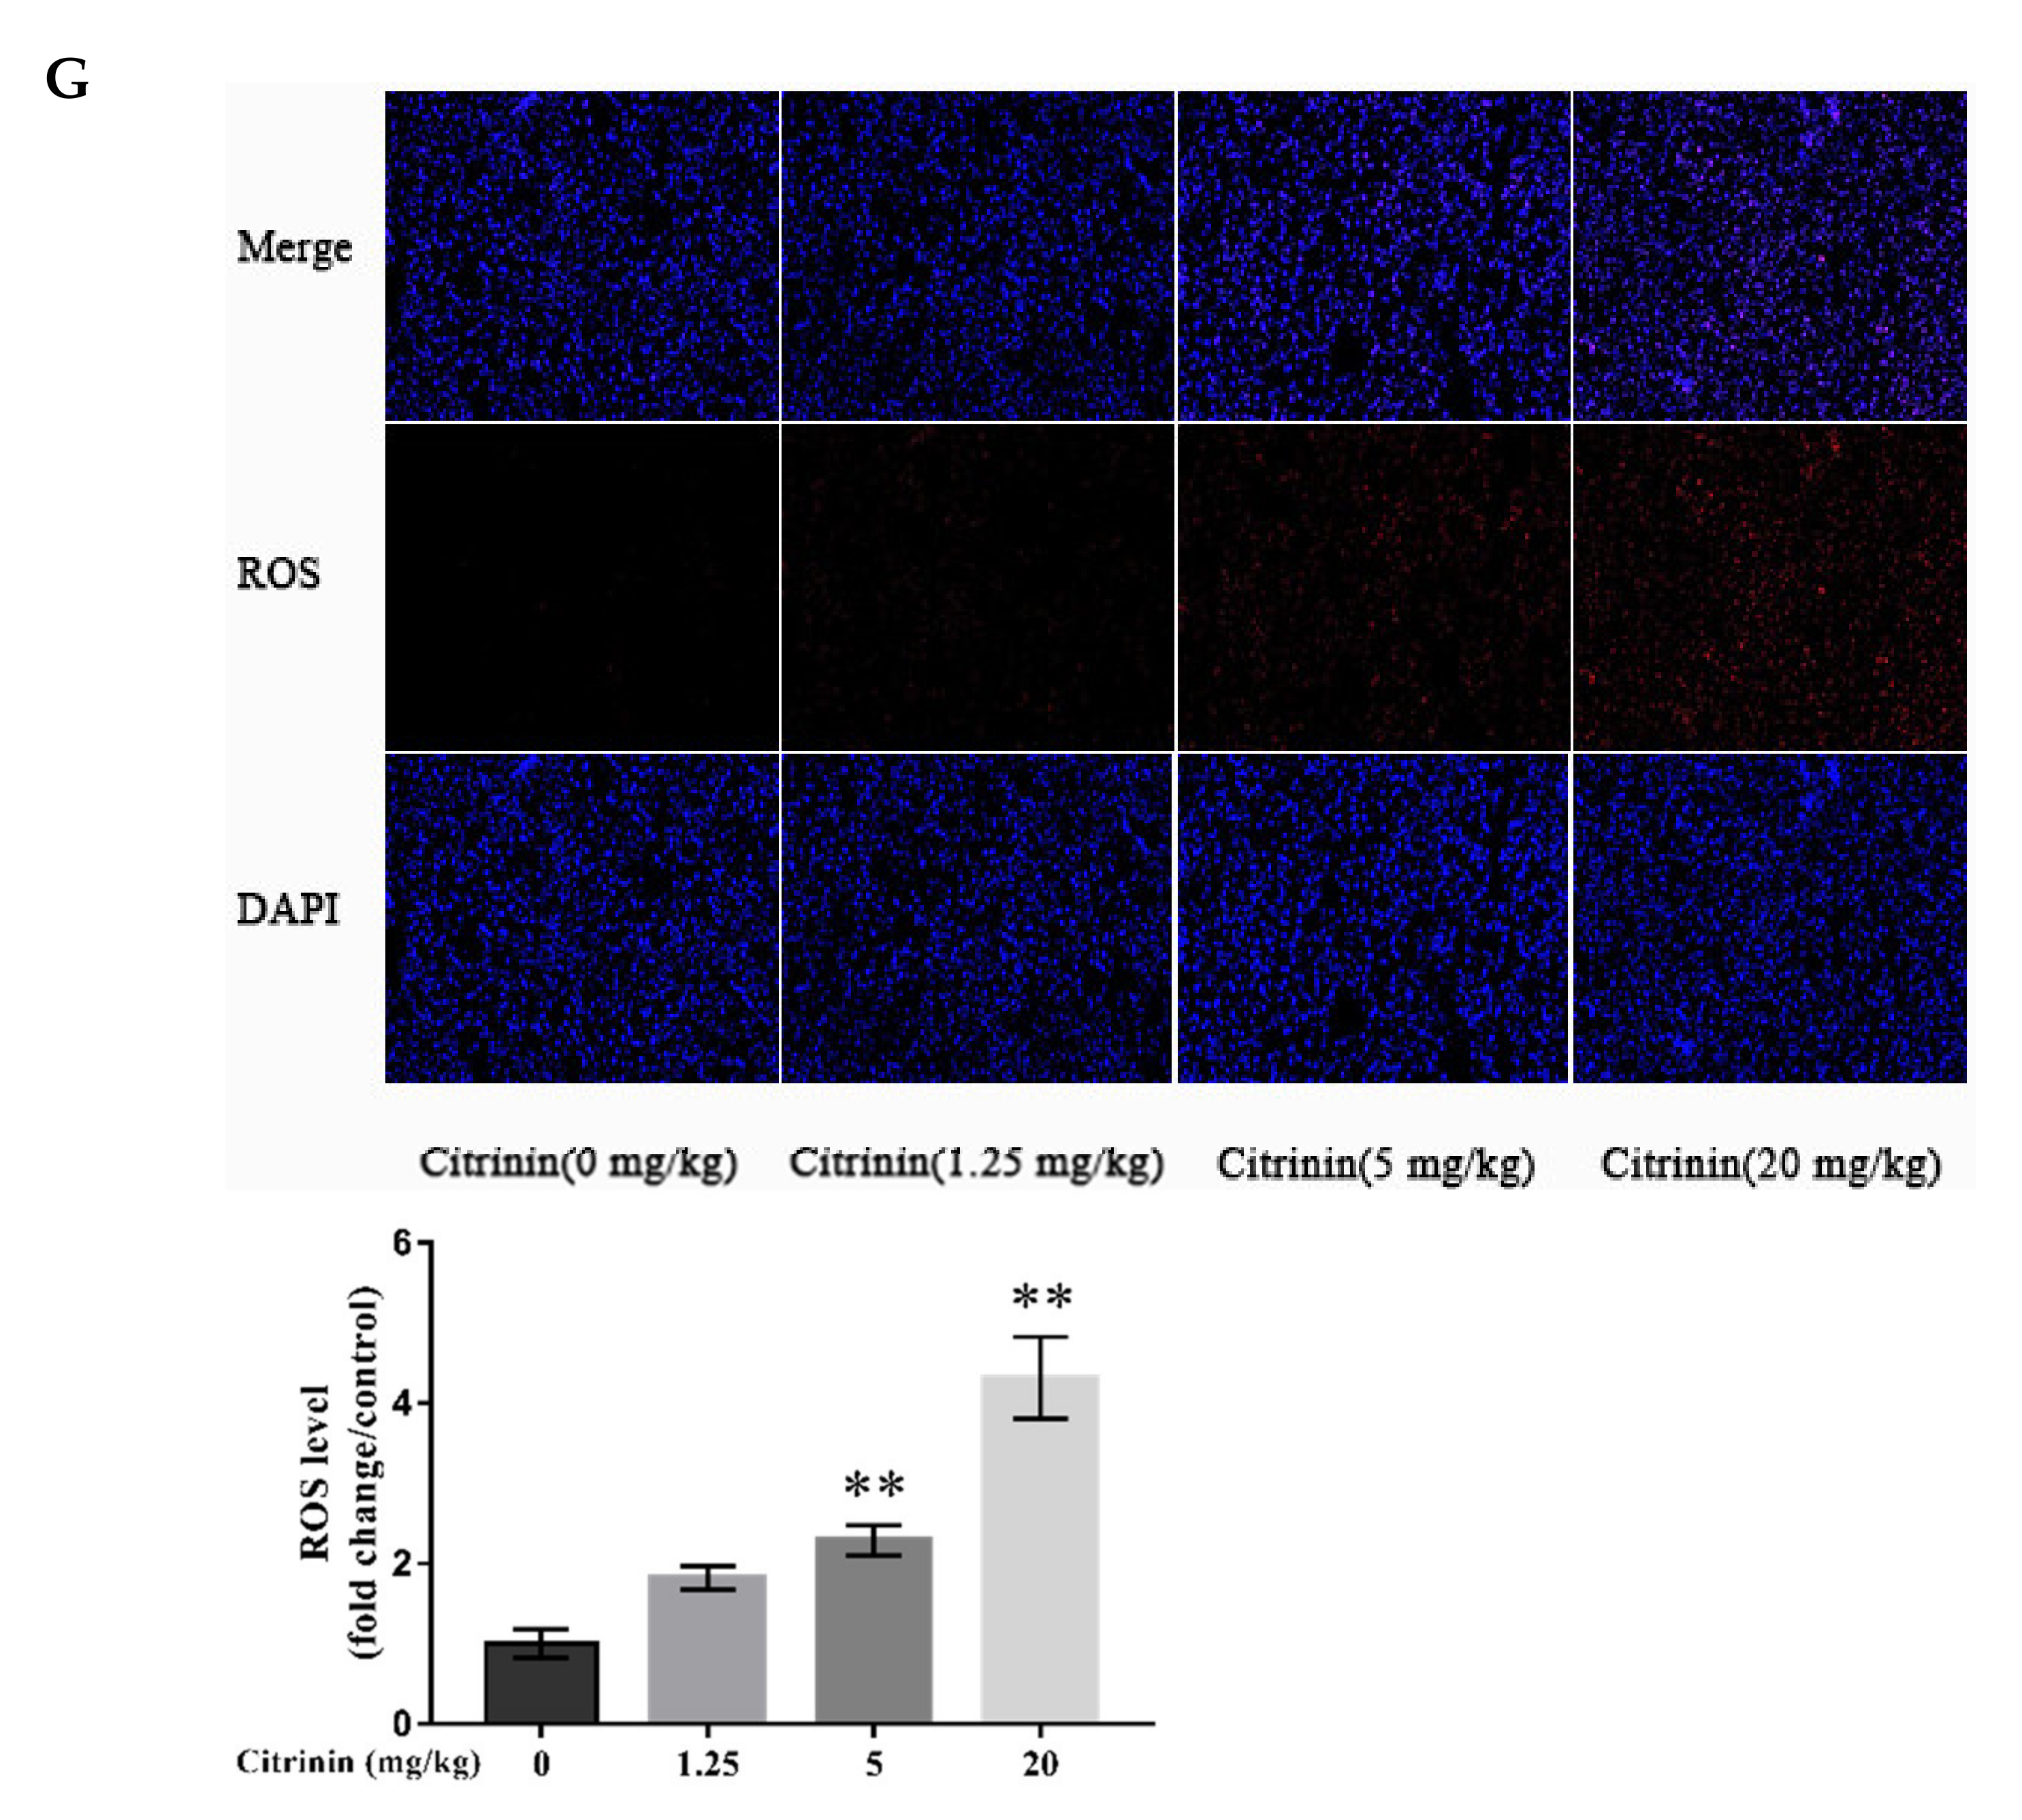
2.3. The Effects of CTN on Liver Oxidative Damage
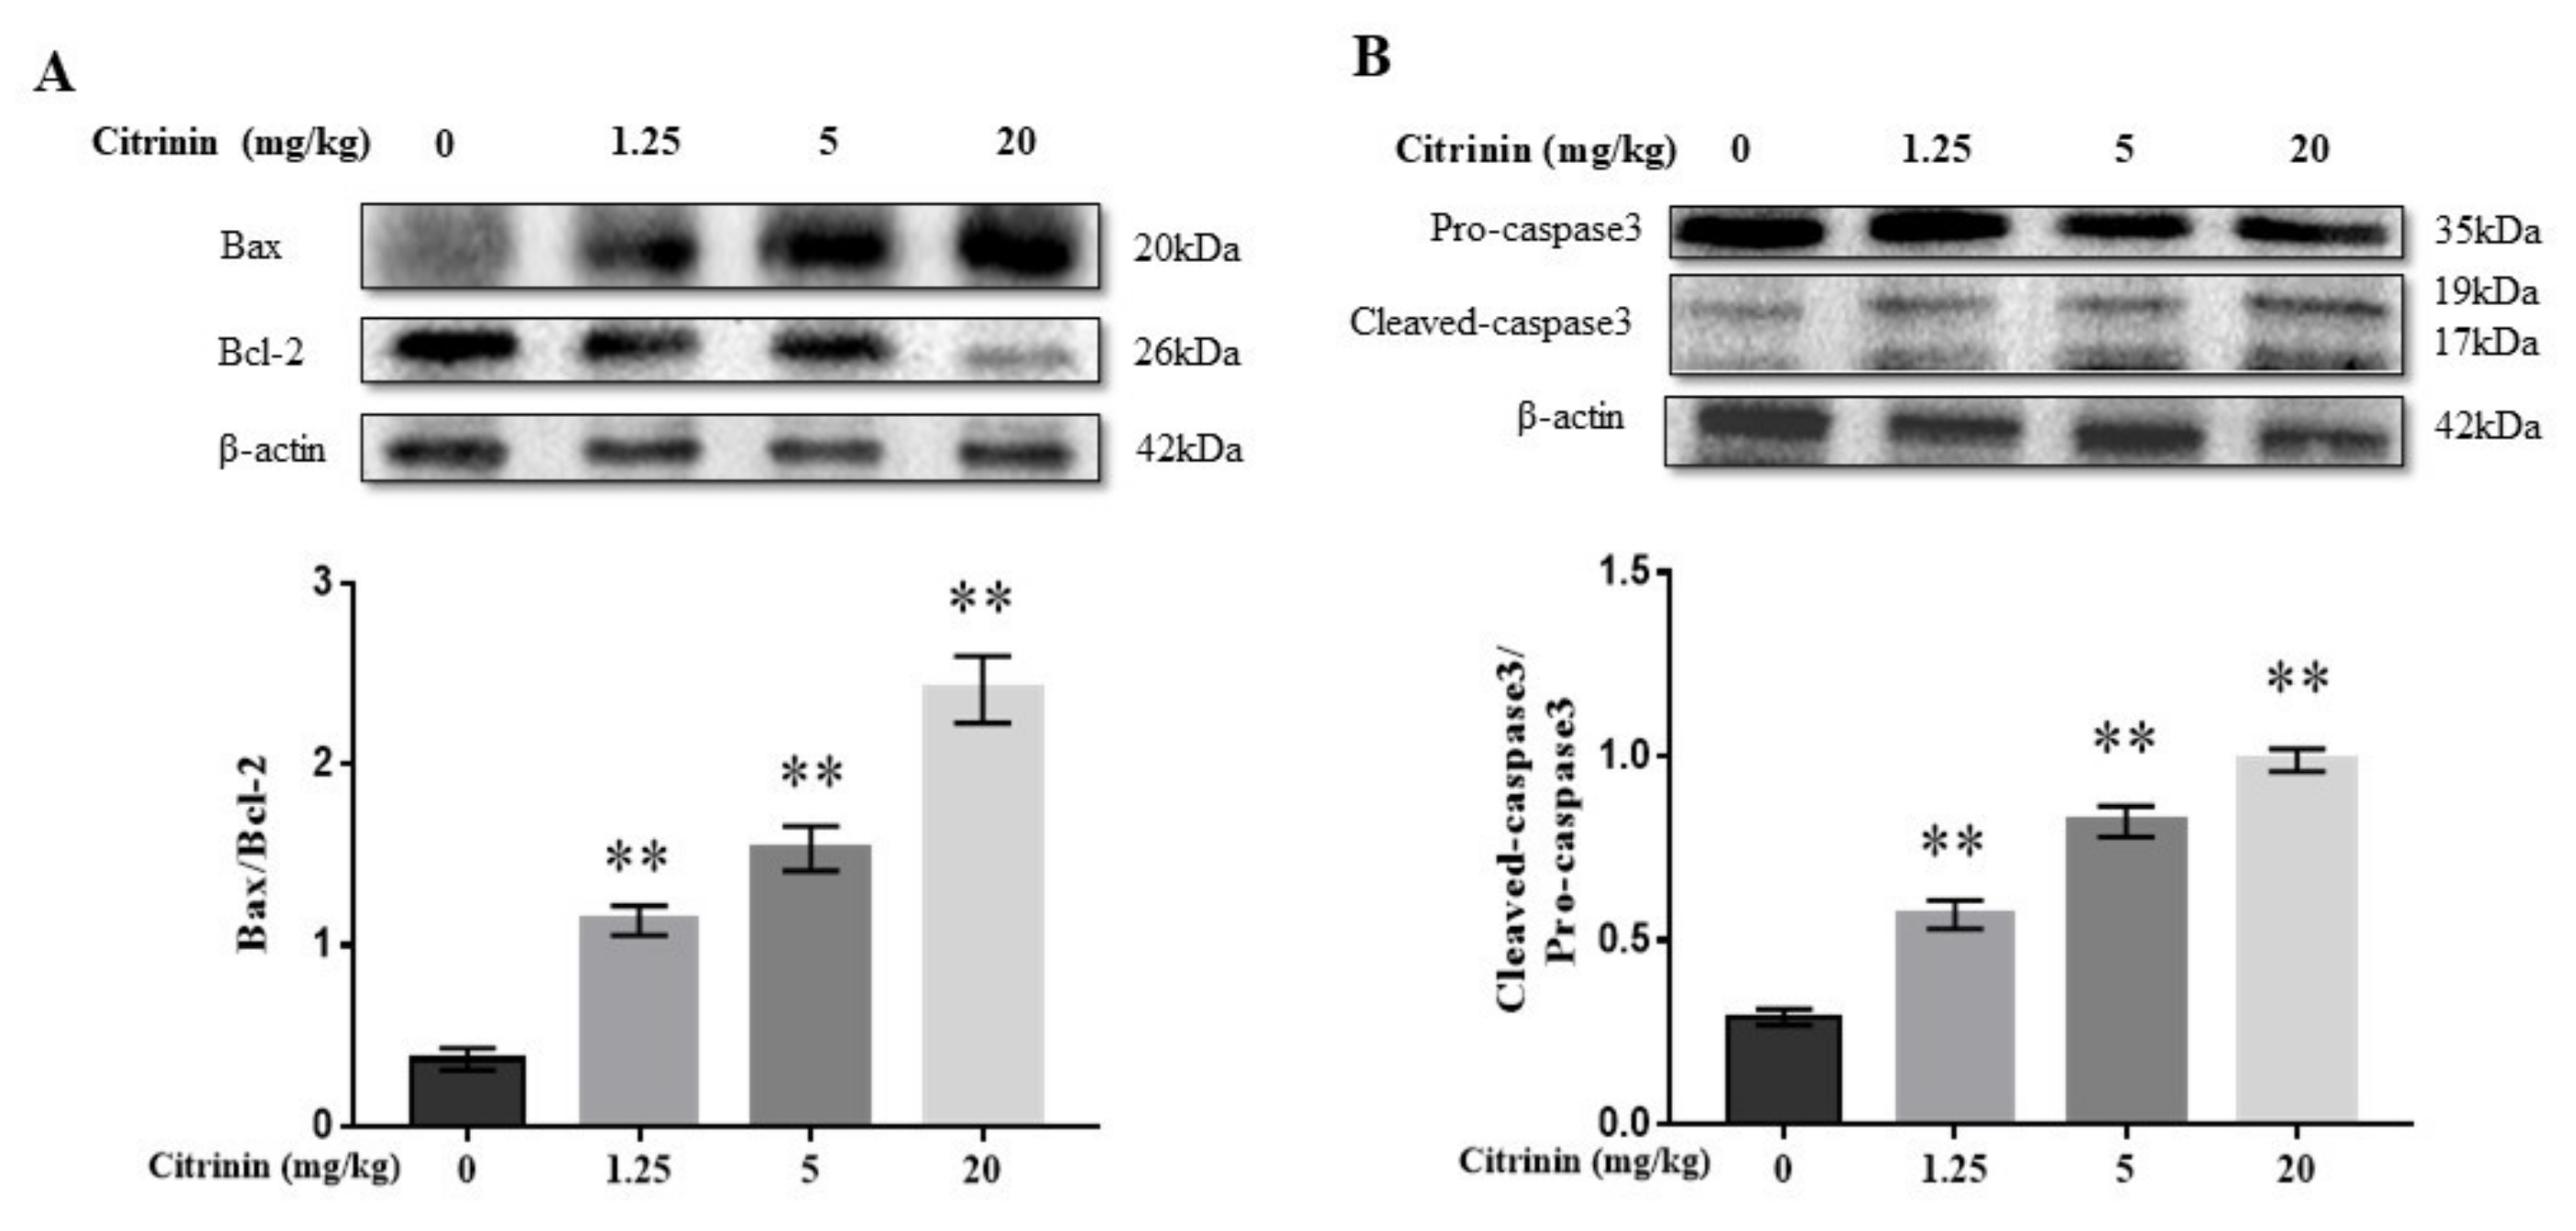
2.4. The Effects of CTN on Hepatocyte Apoptosis
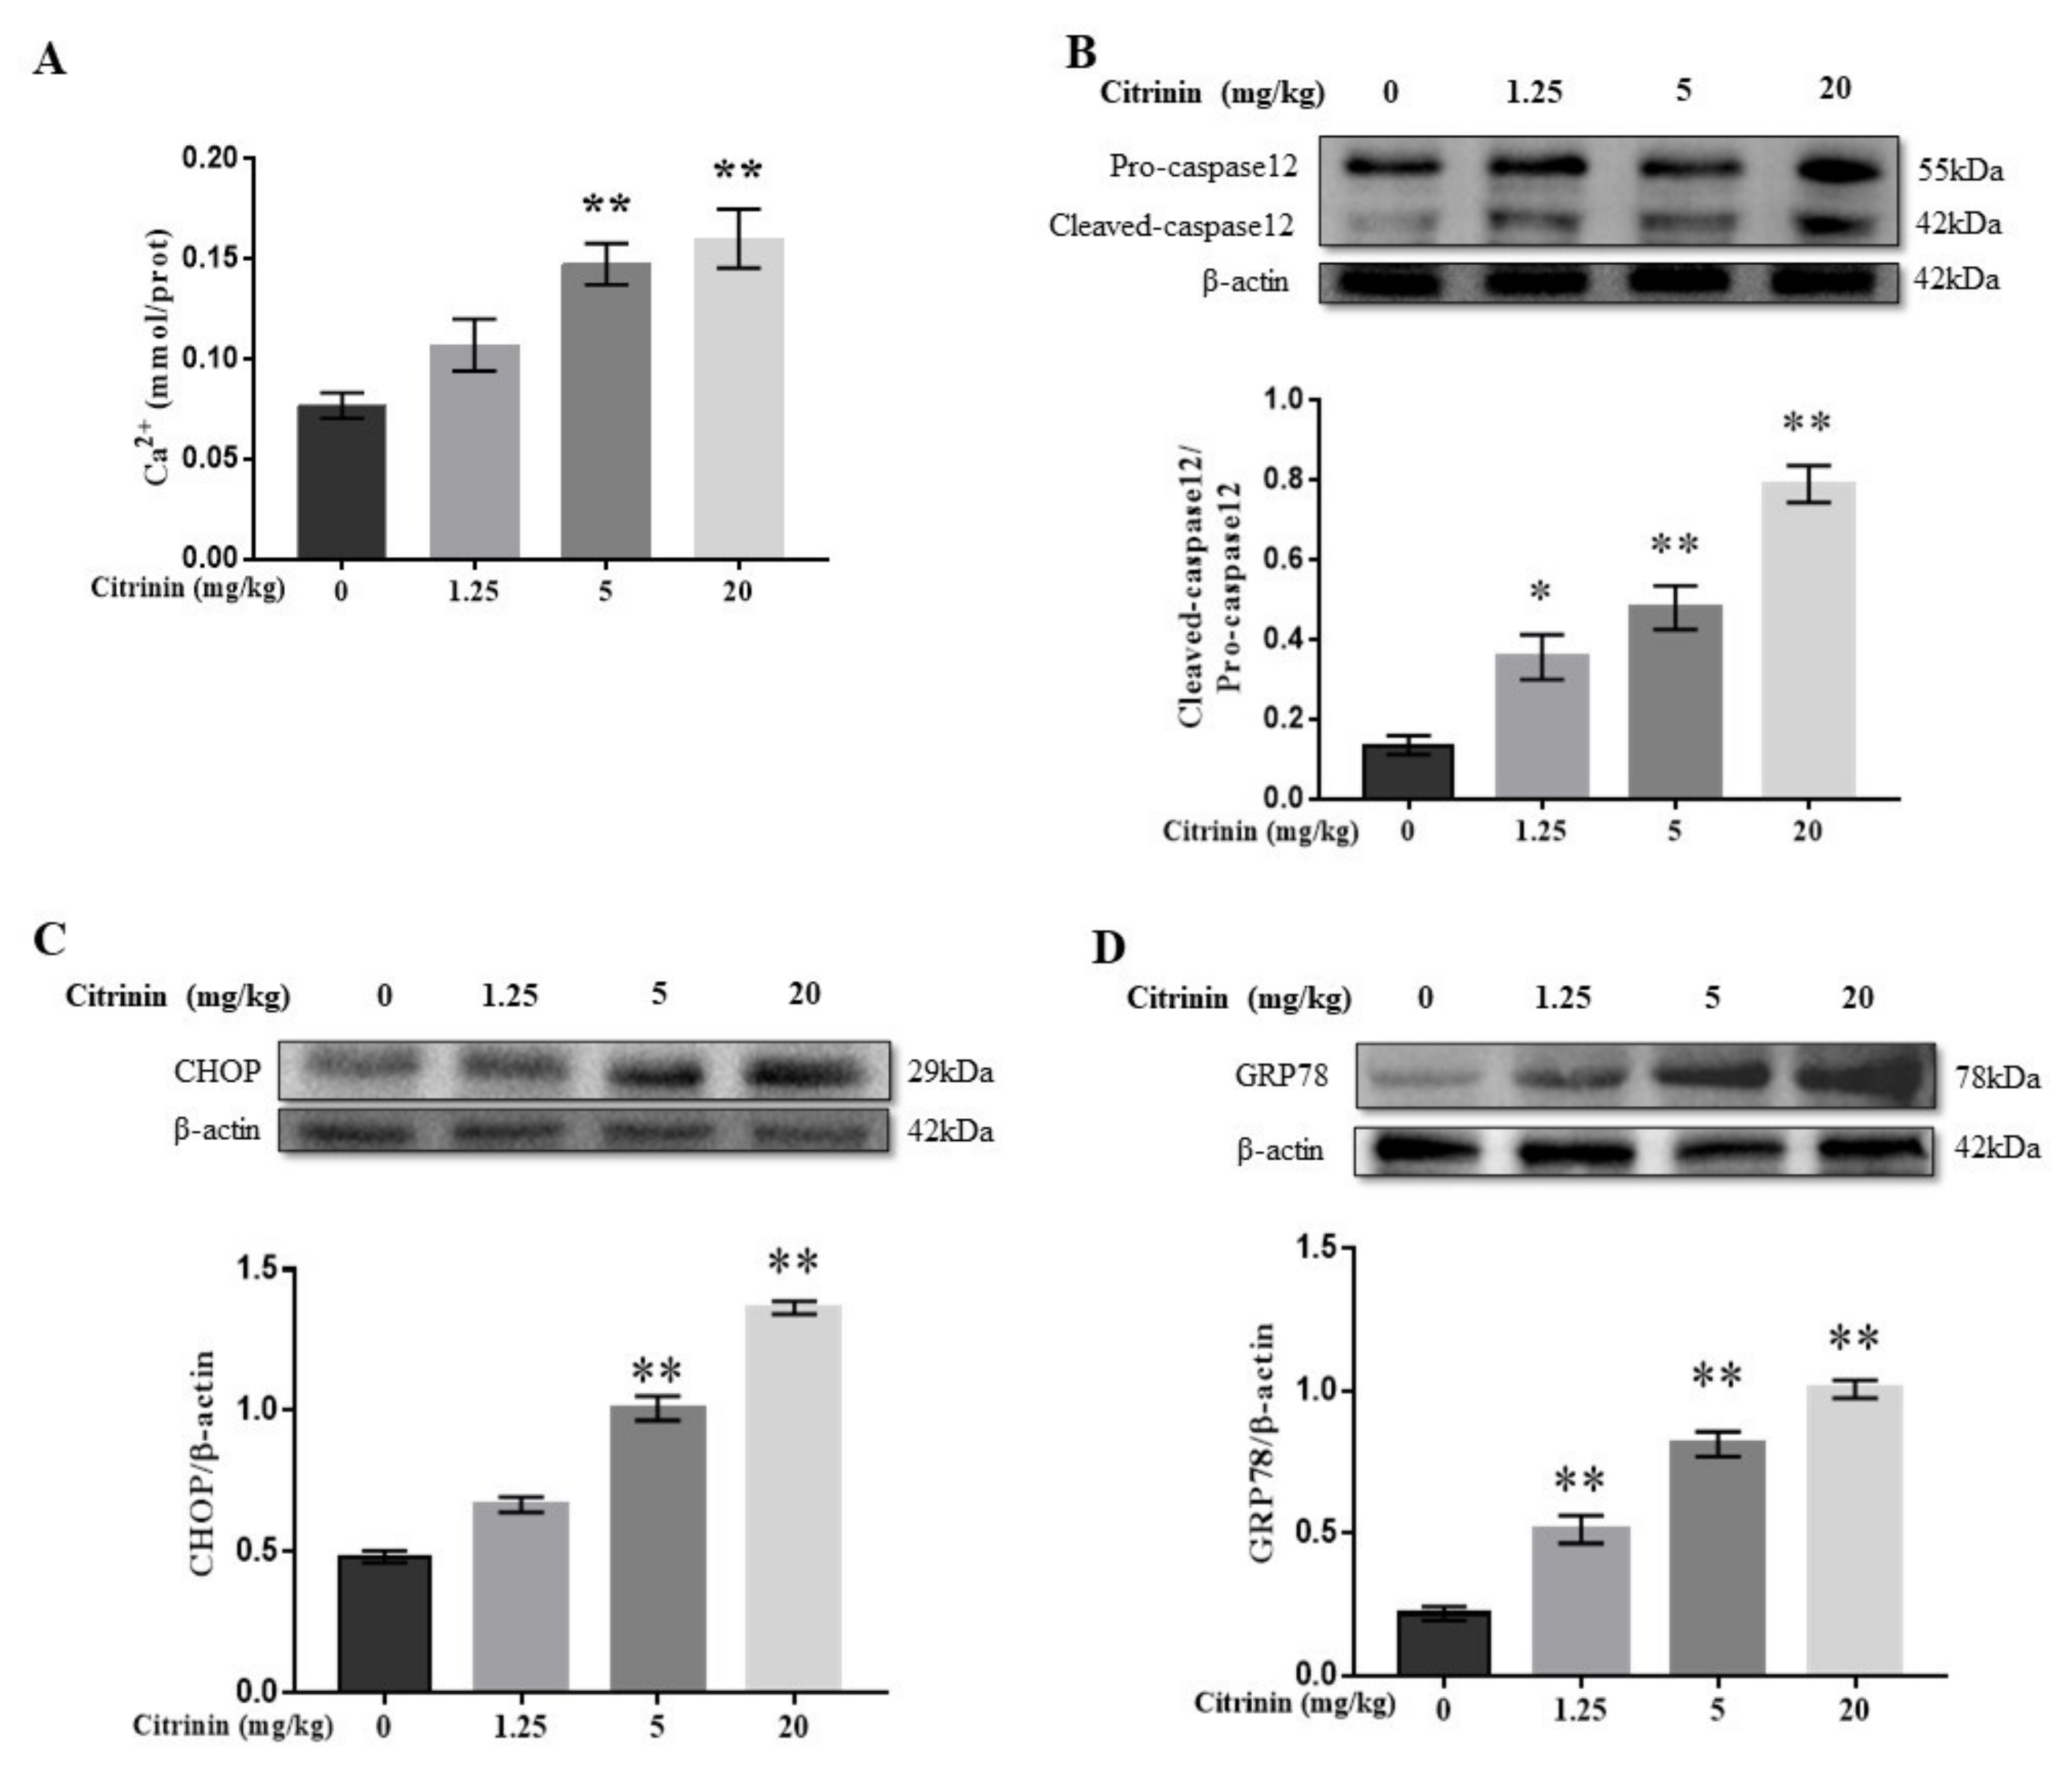
2.5. The Effects of CTN on ER Stress
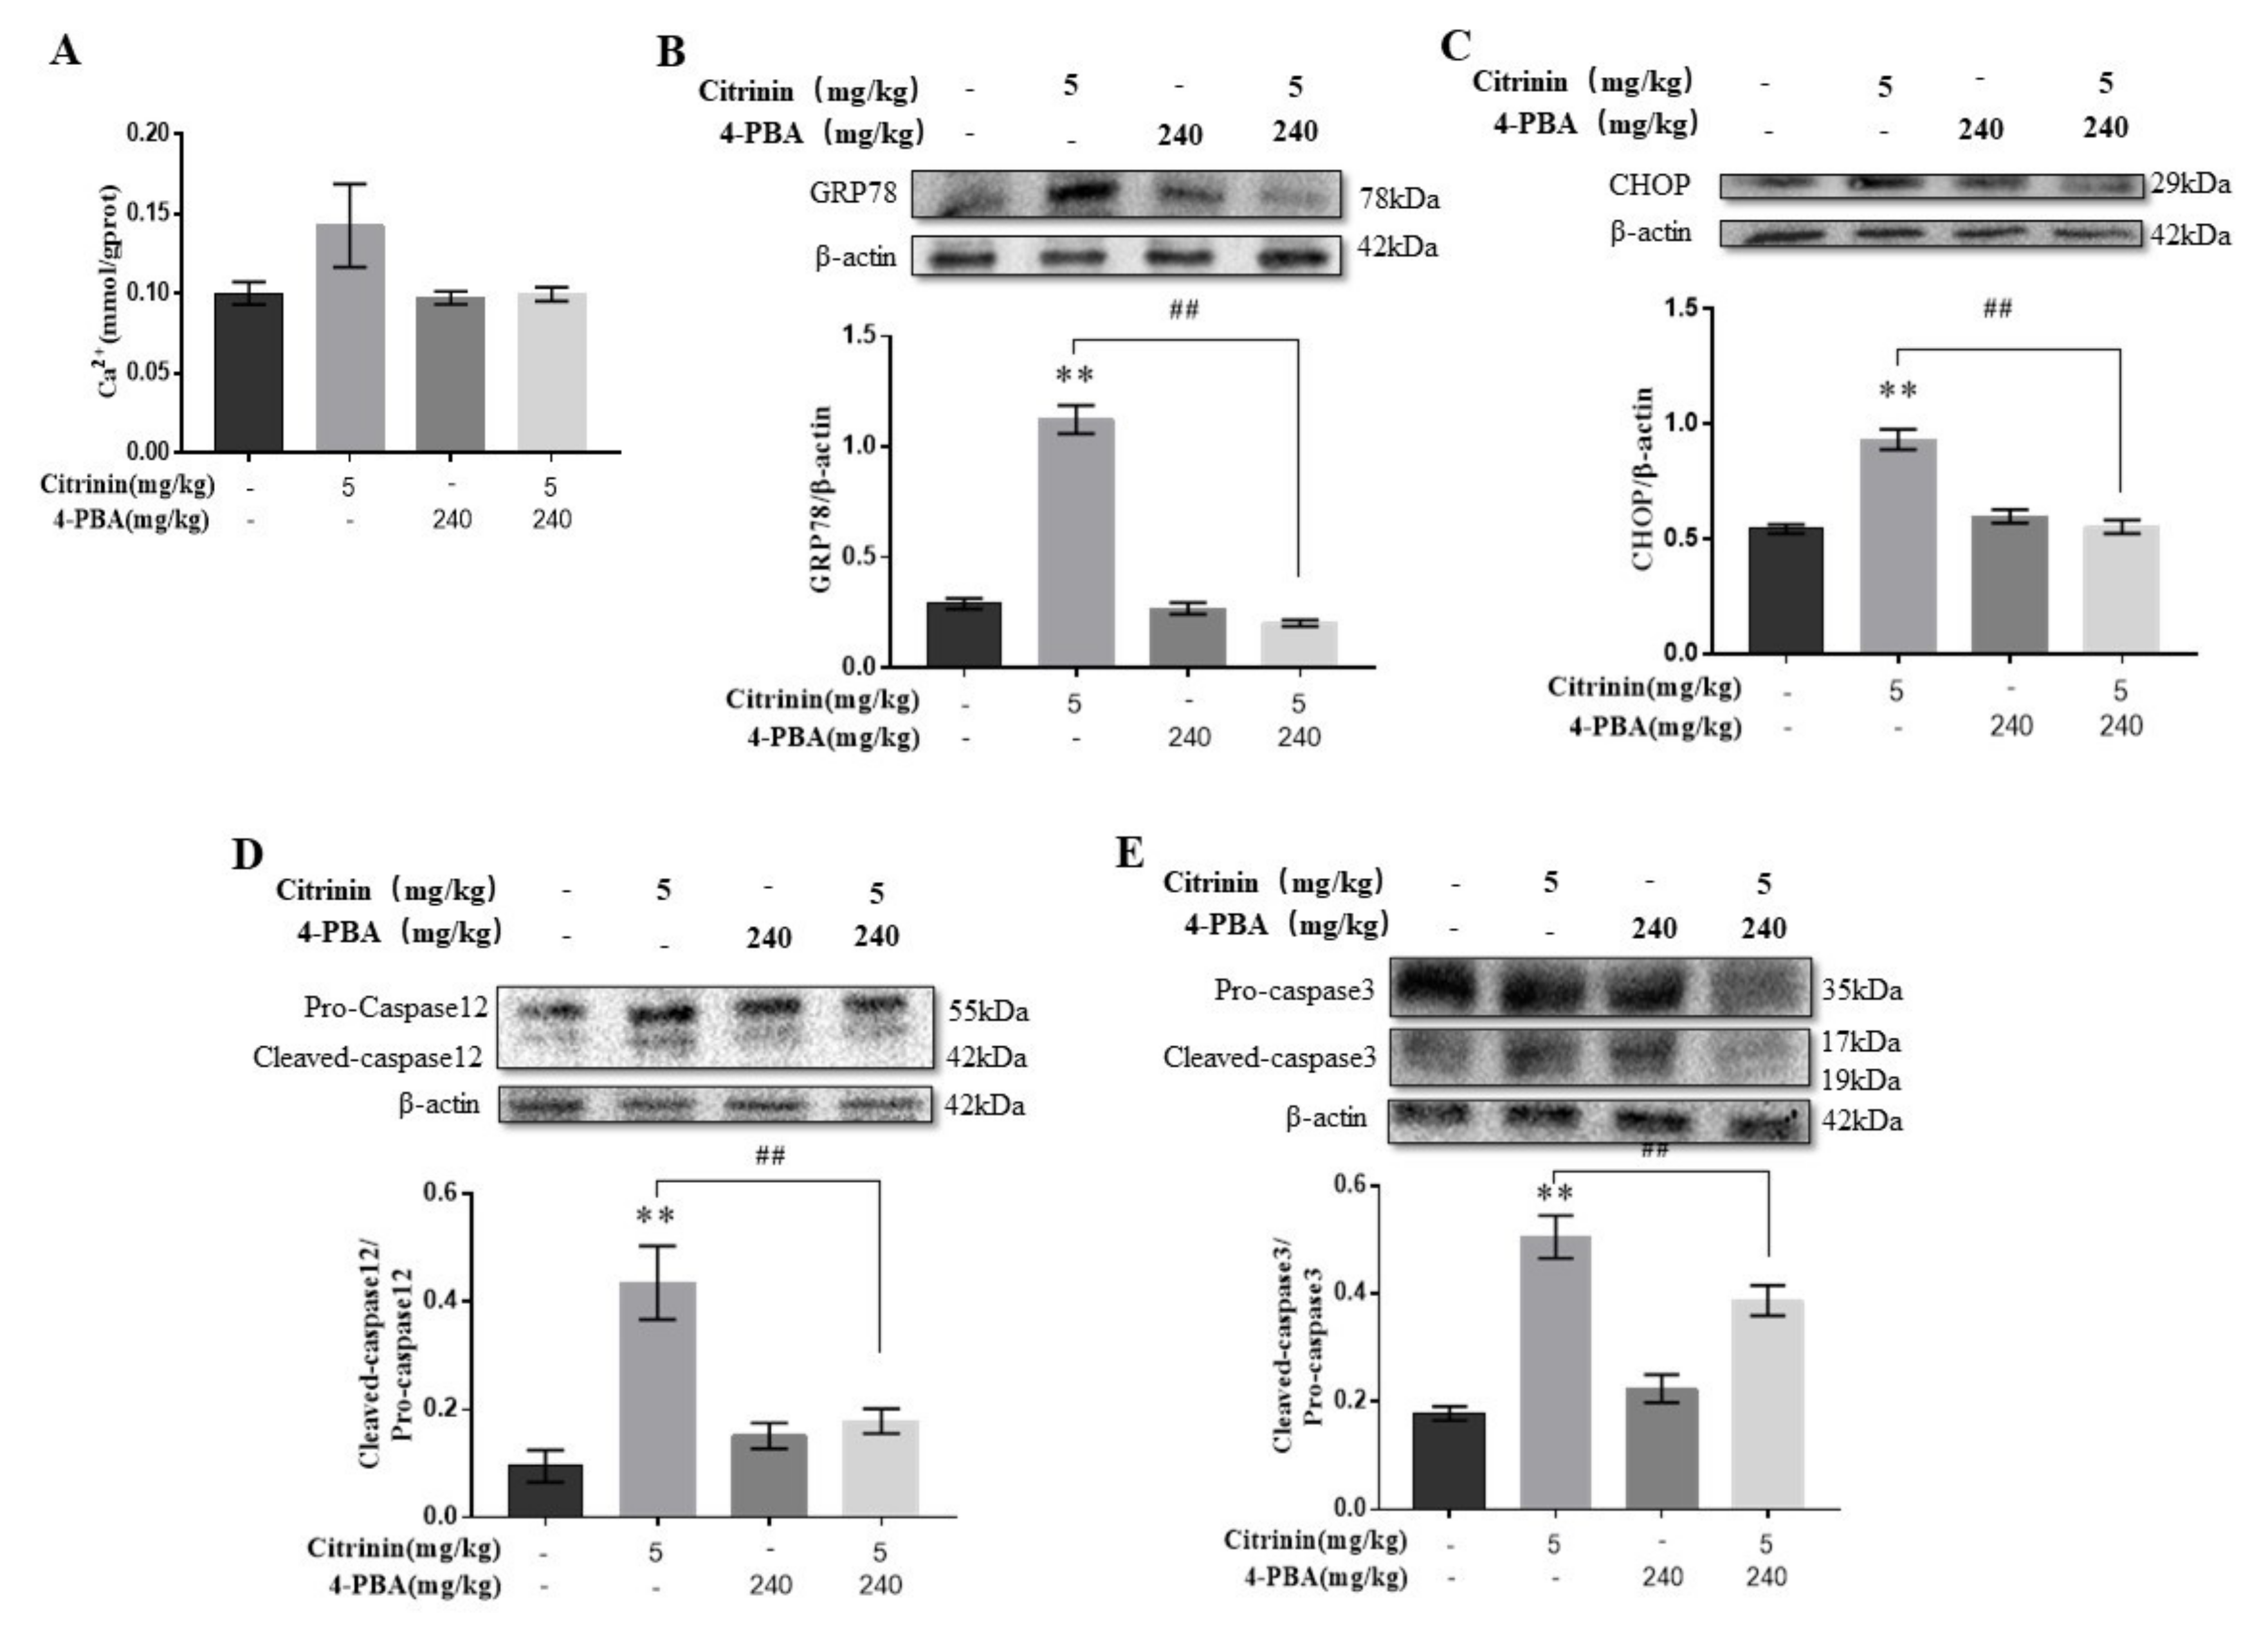
2.6. The Effects of 4-PBA on ER Stress Mediated Hepatocyte Apoptosis-Induced by CTN
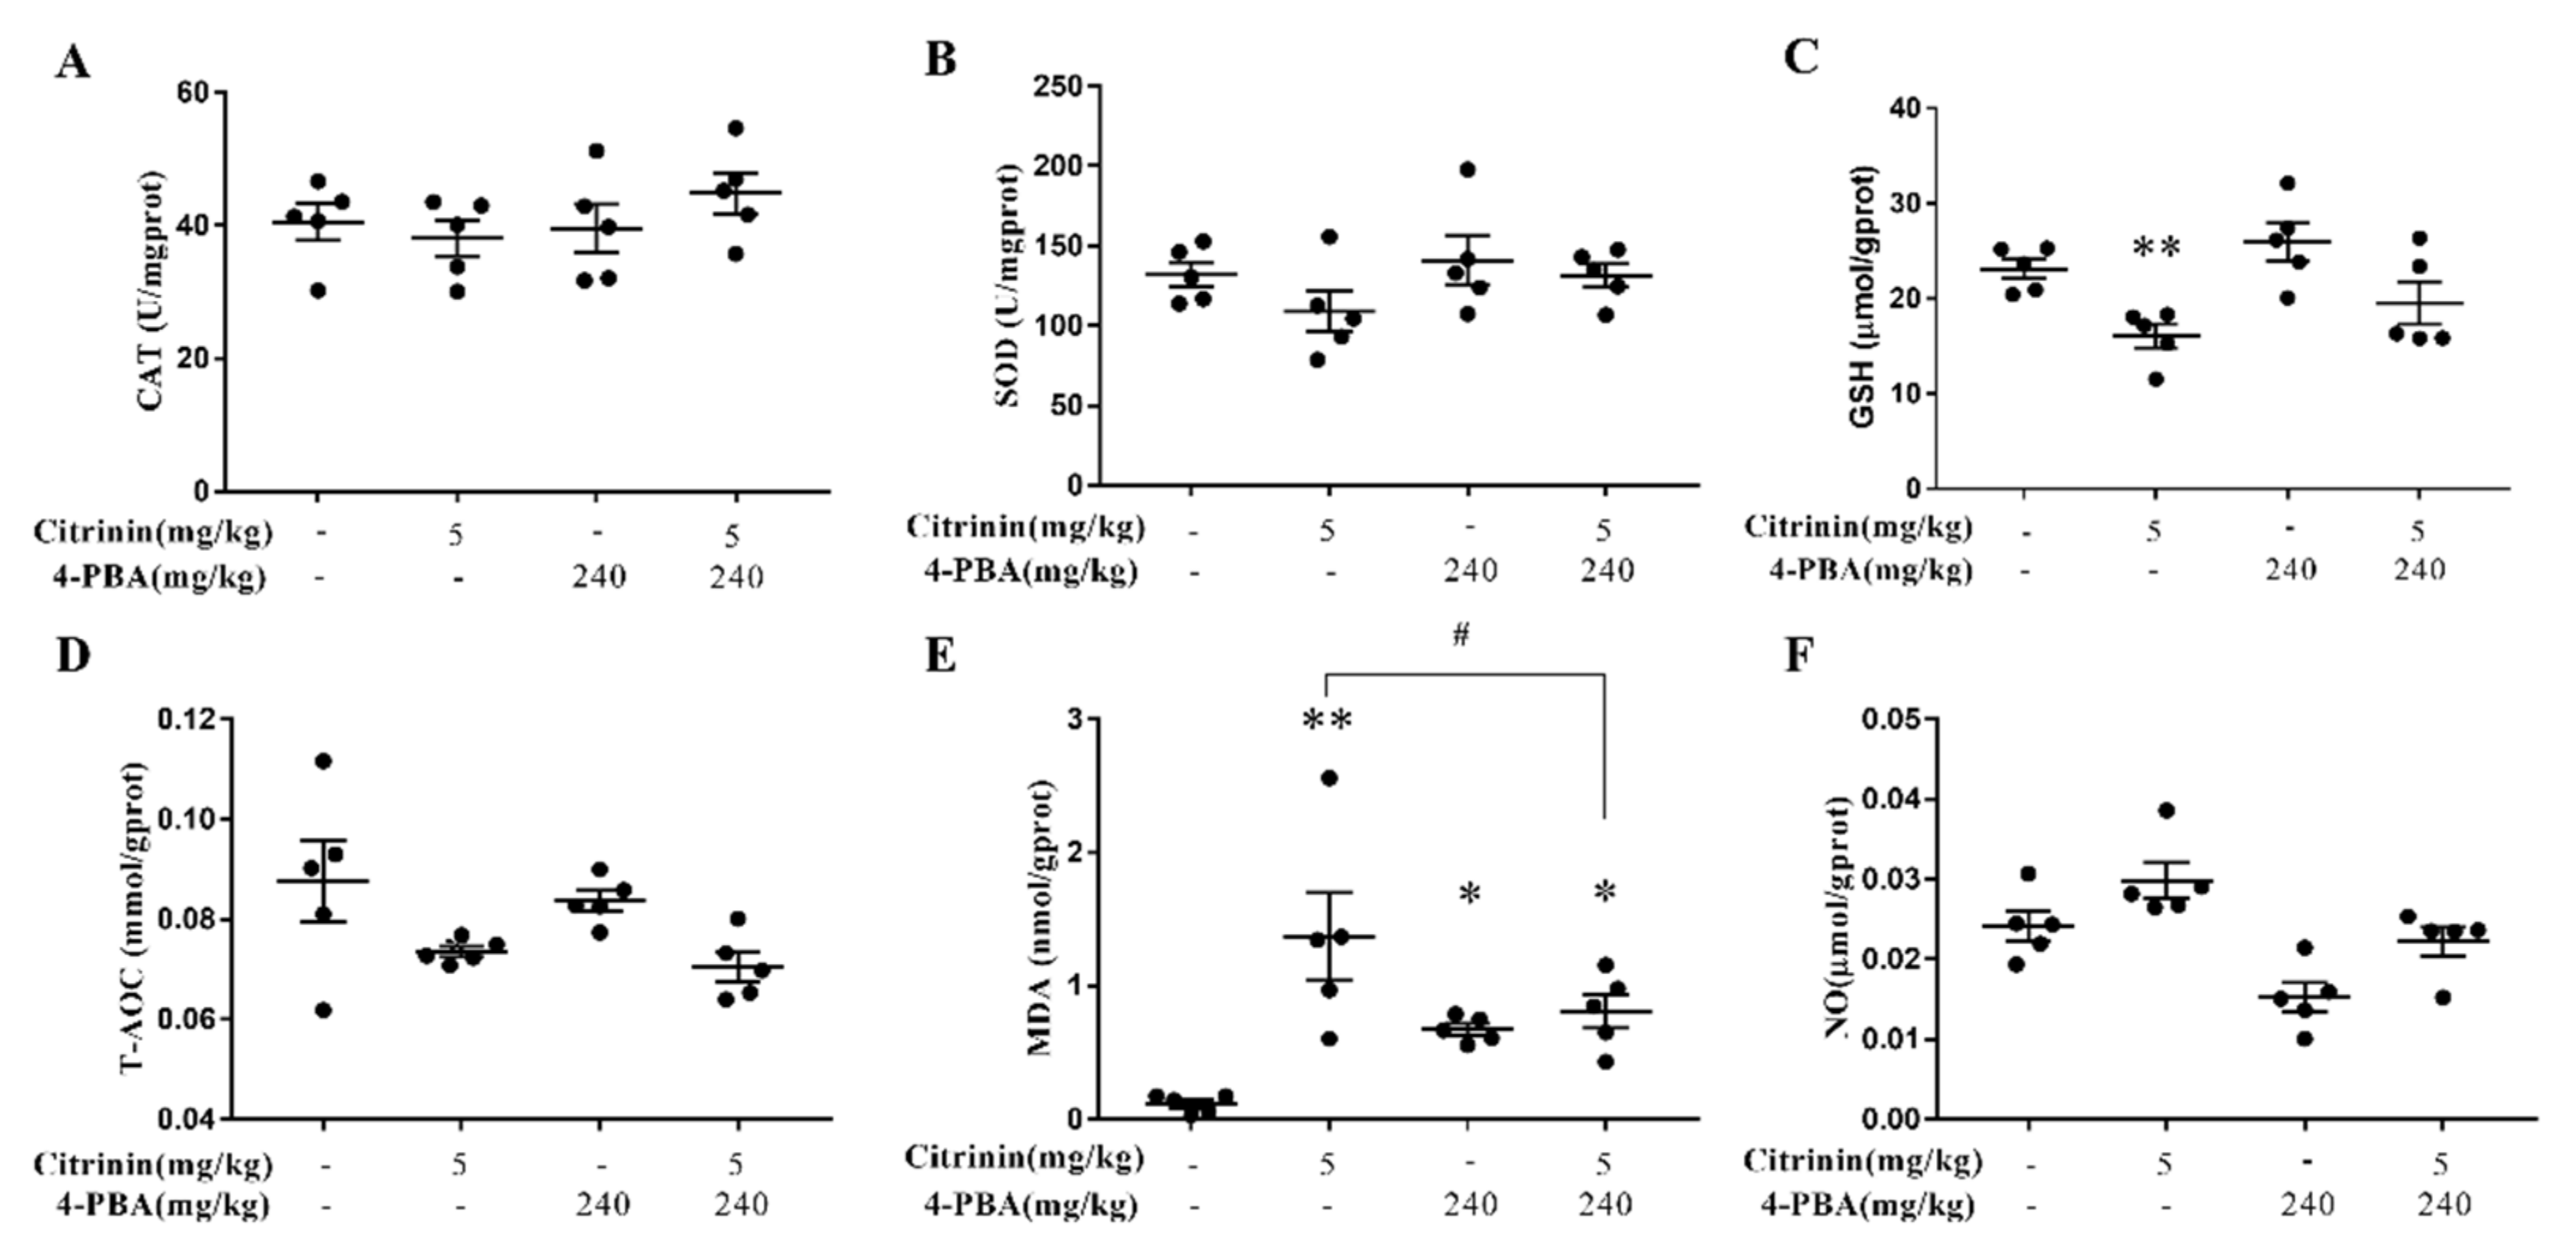
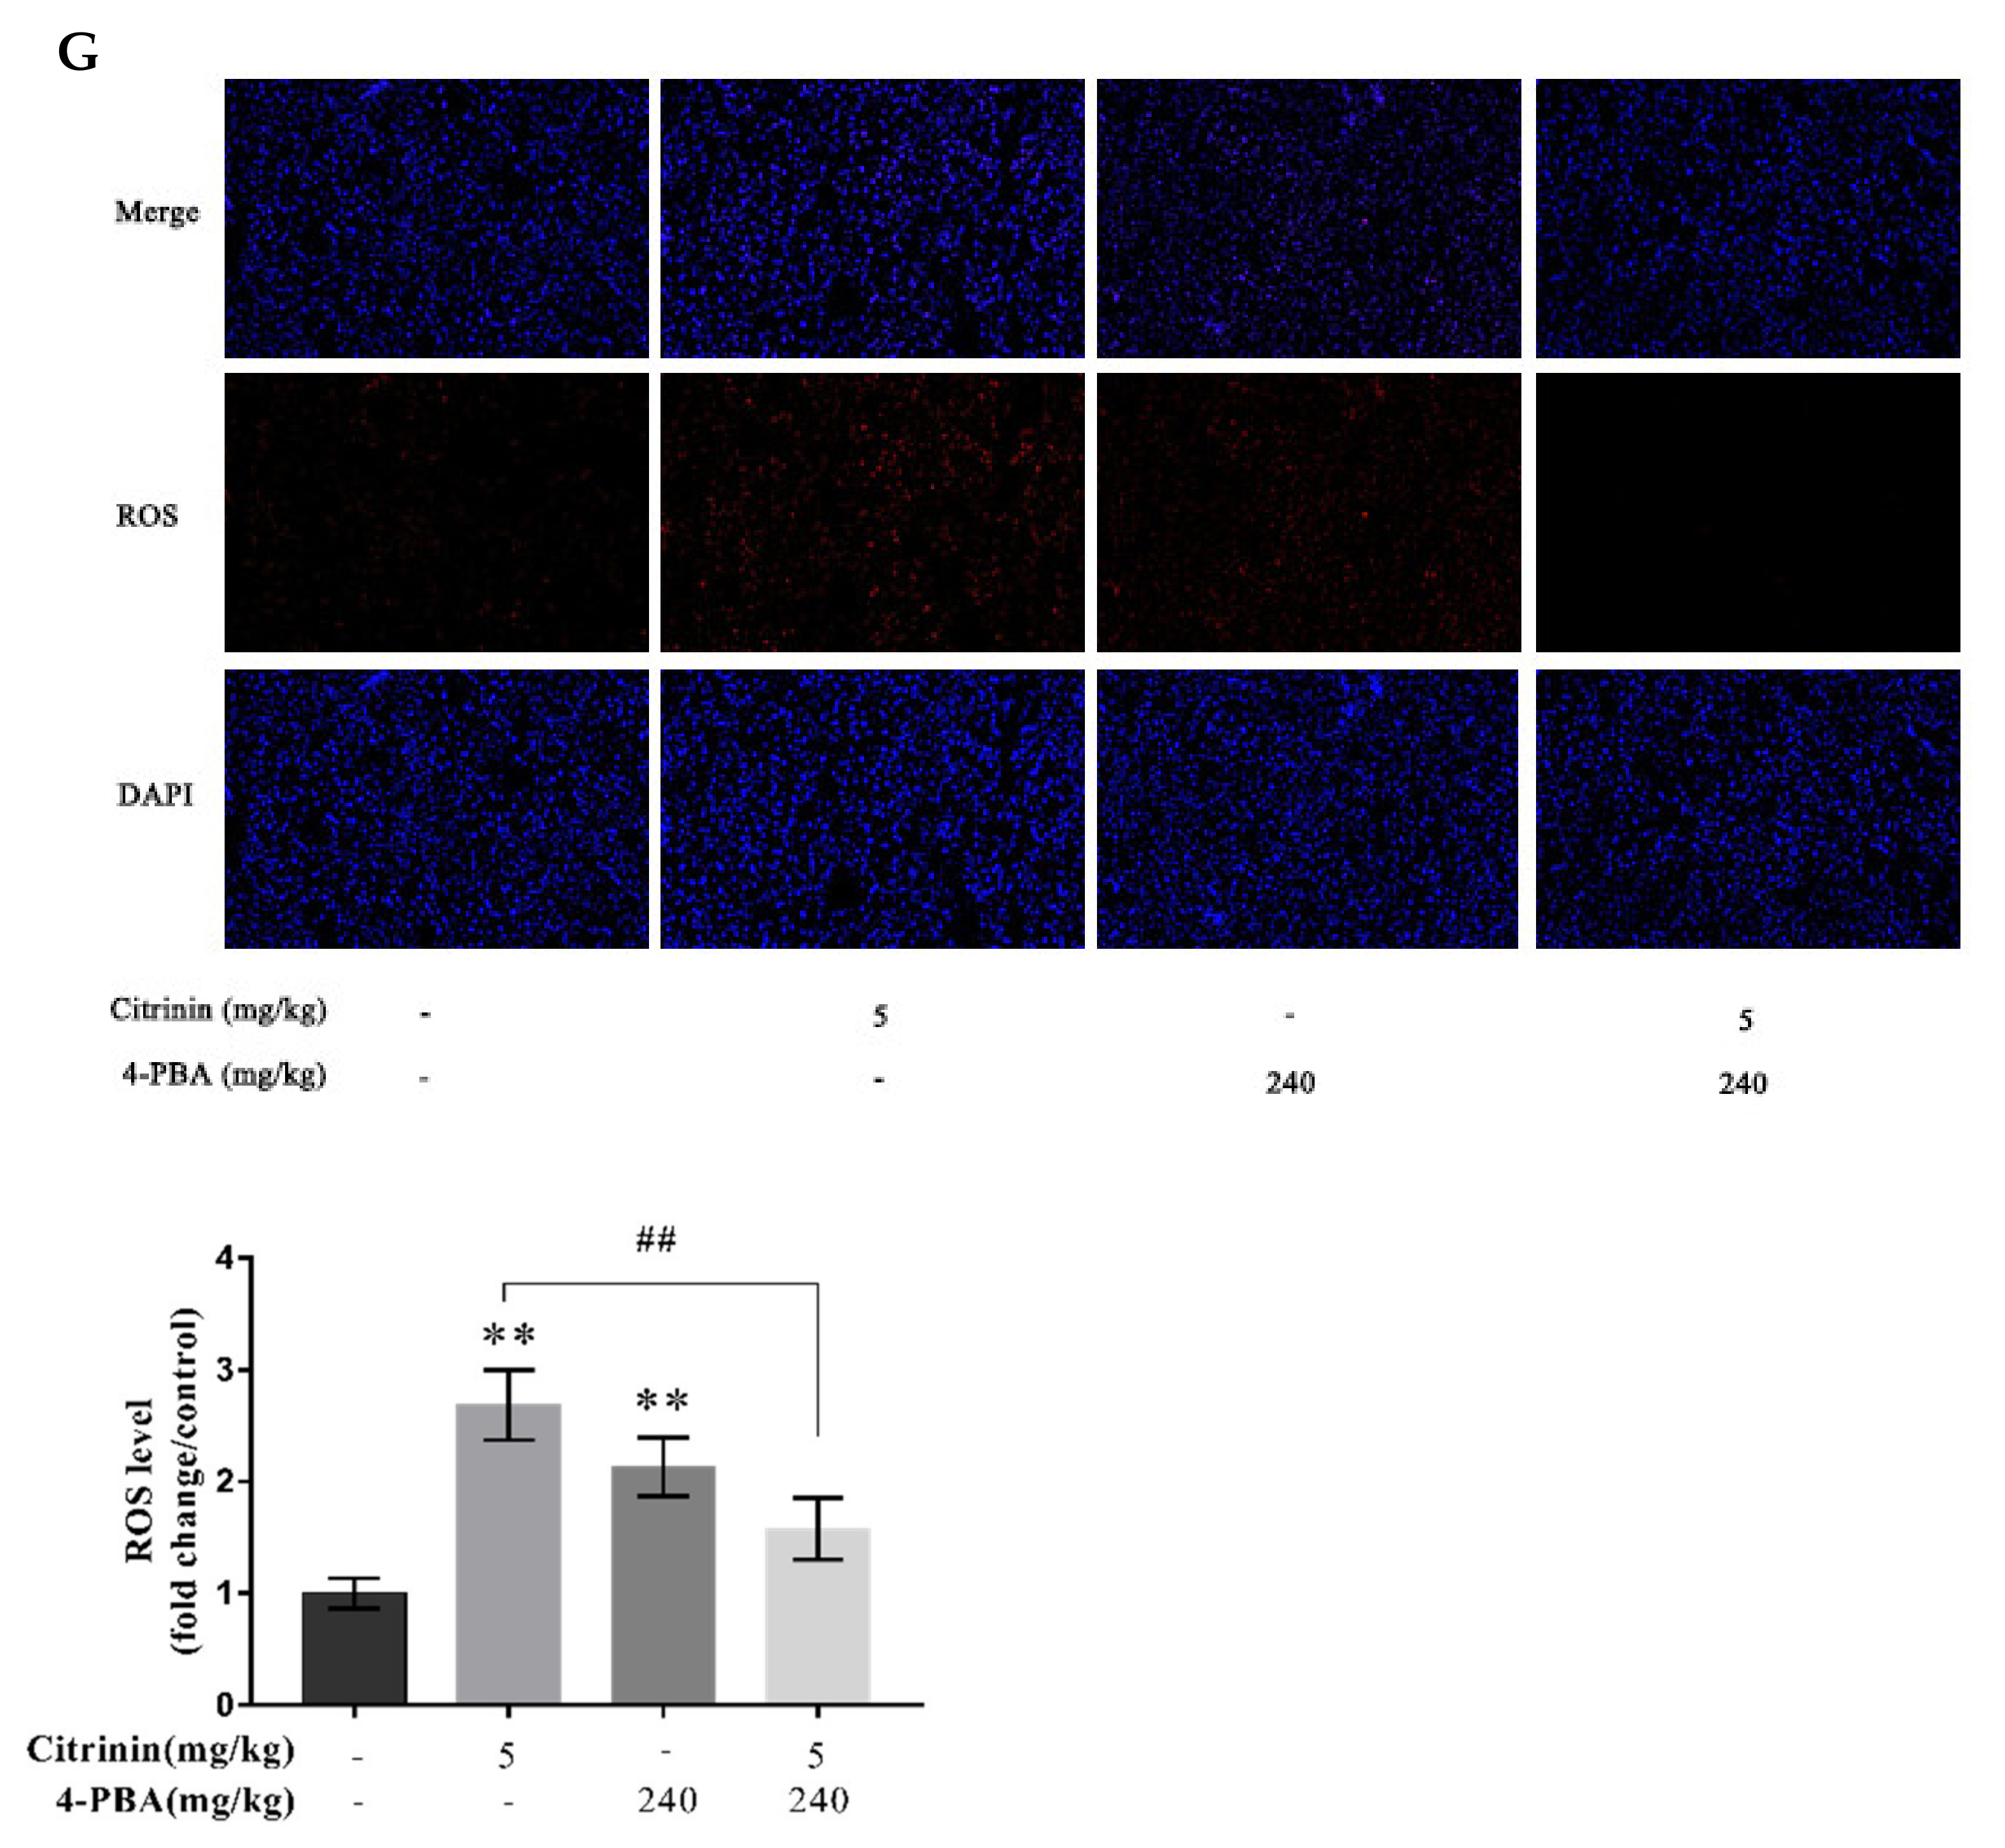
2.7. The Effects of 4-PBA on CTN-Induced Oxidative Stress in Liver
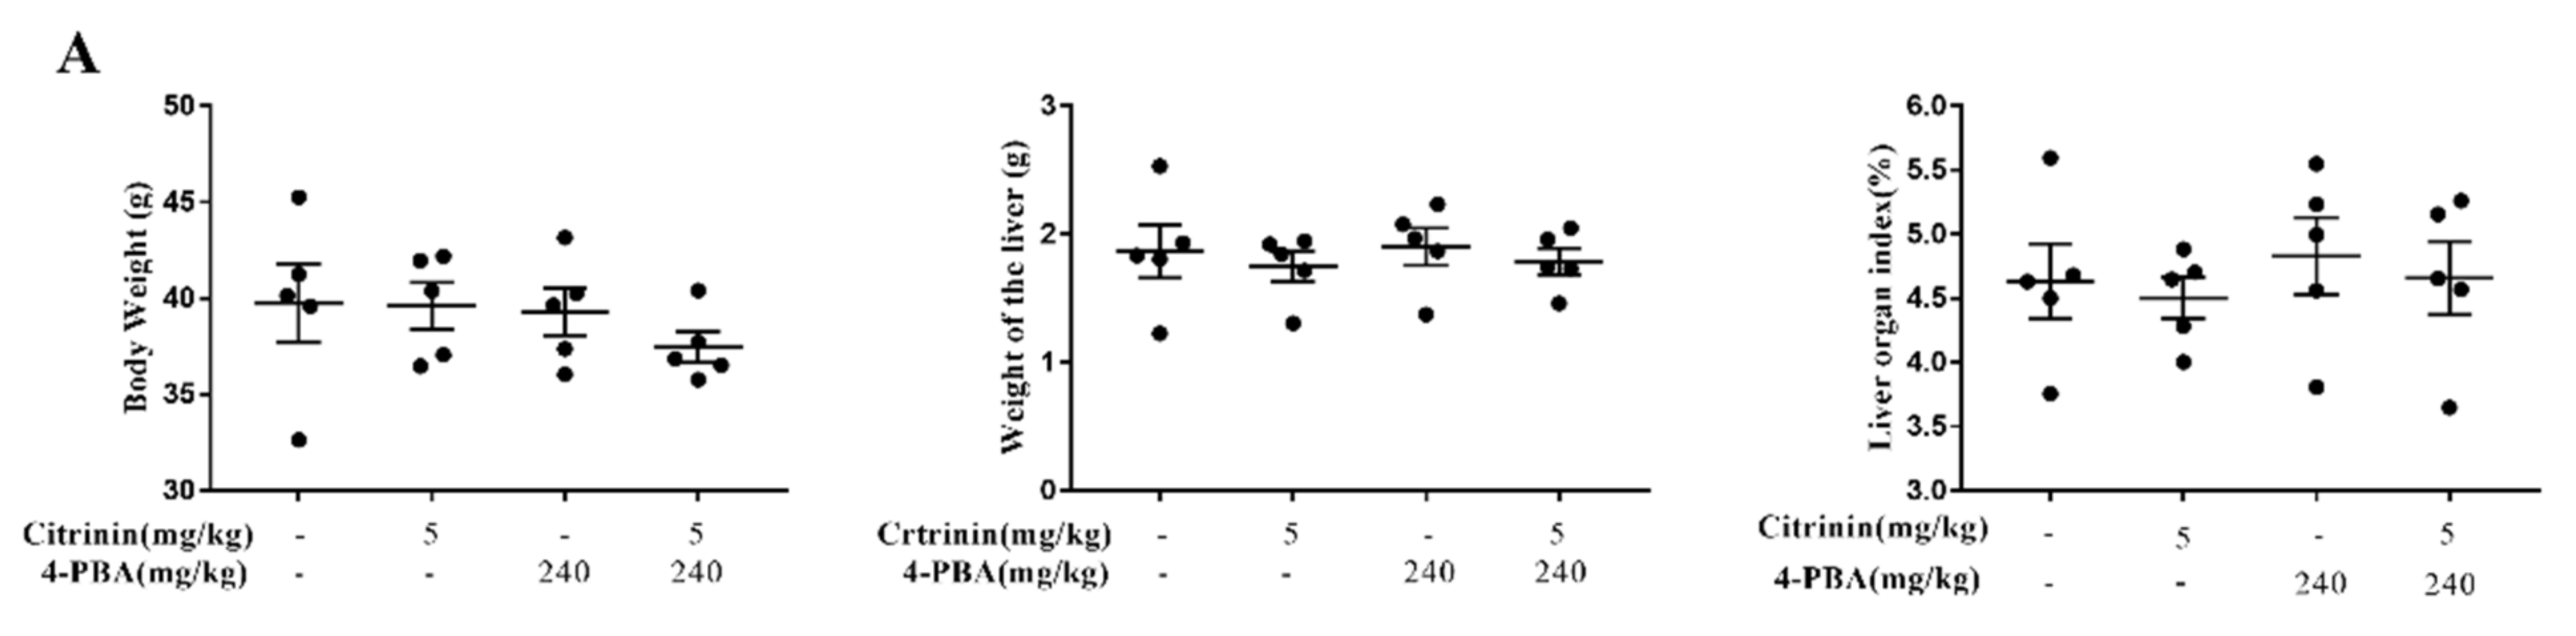
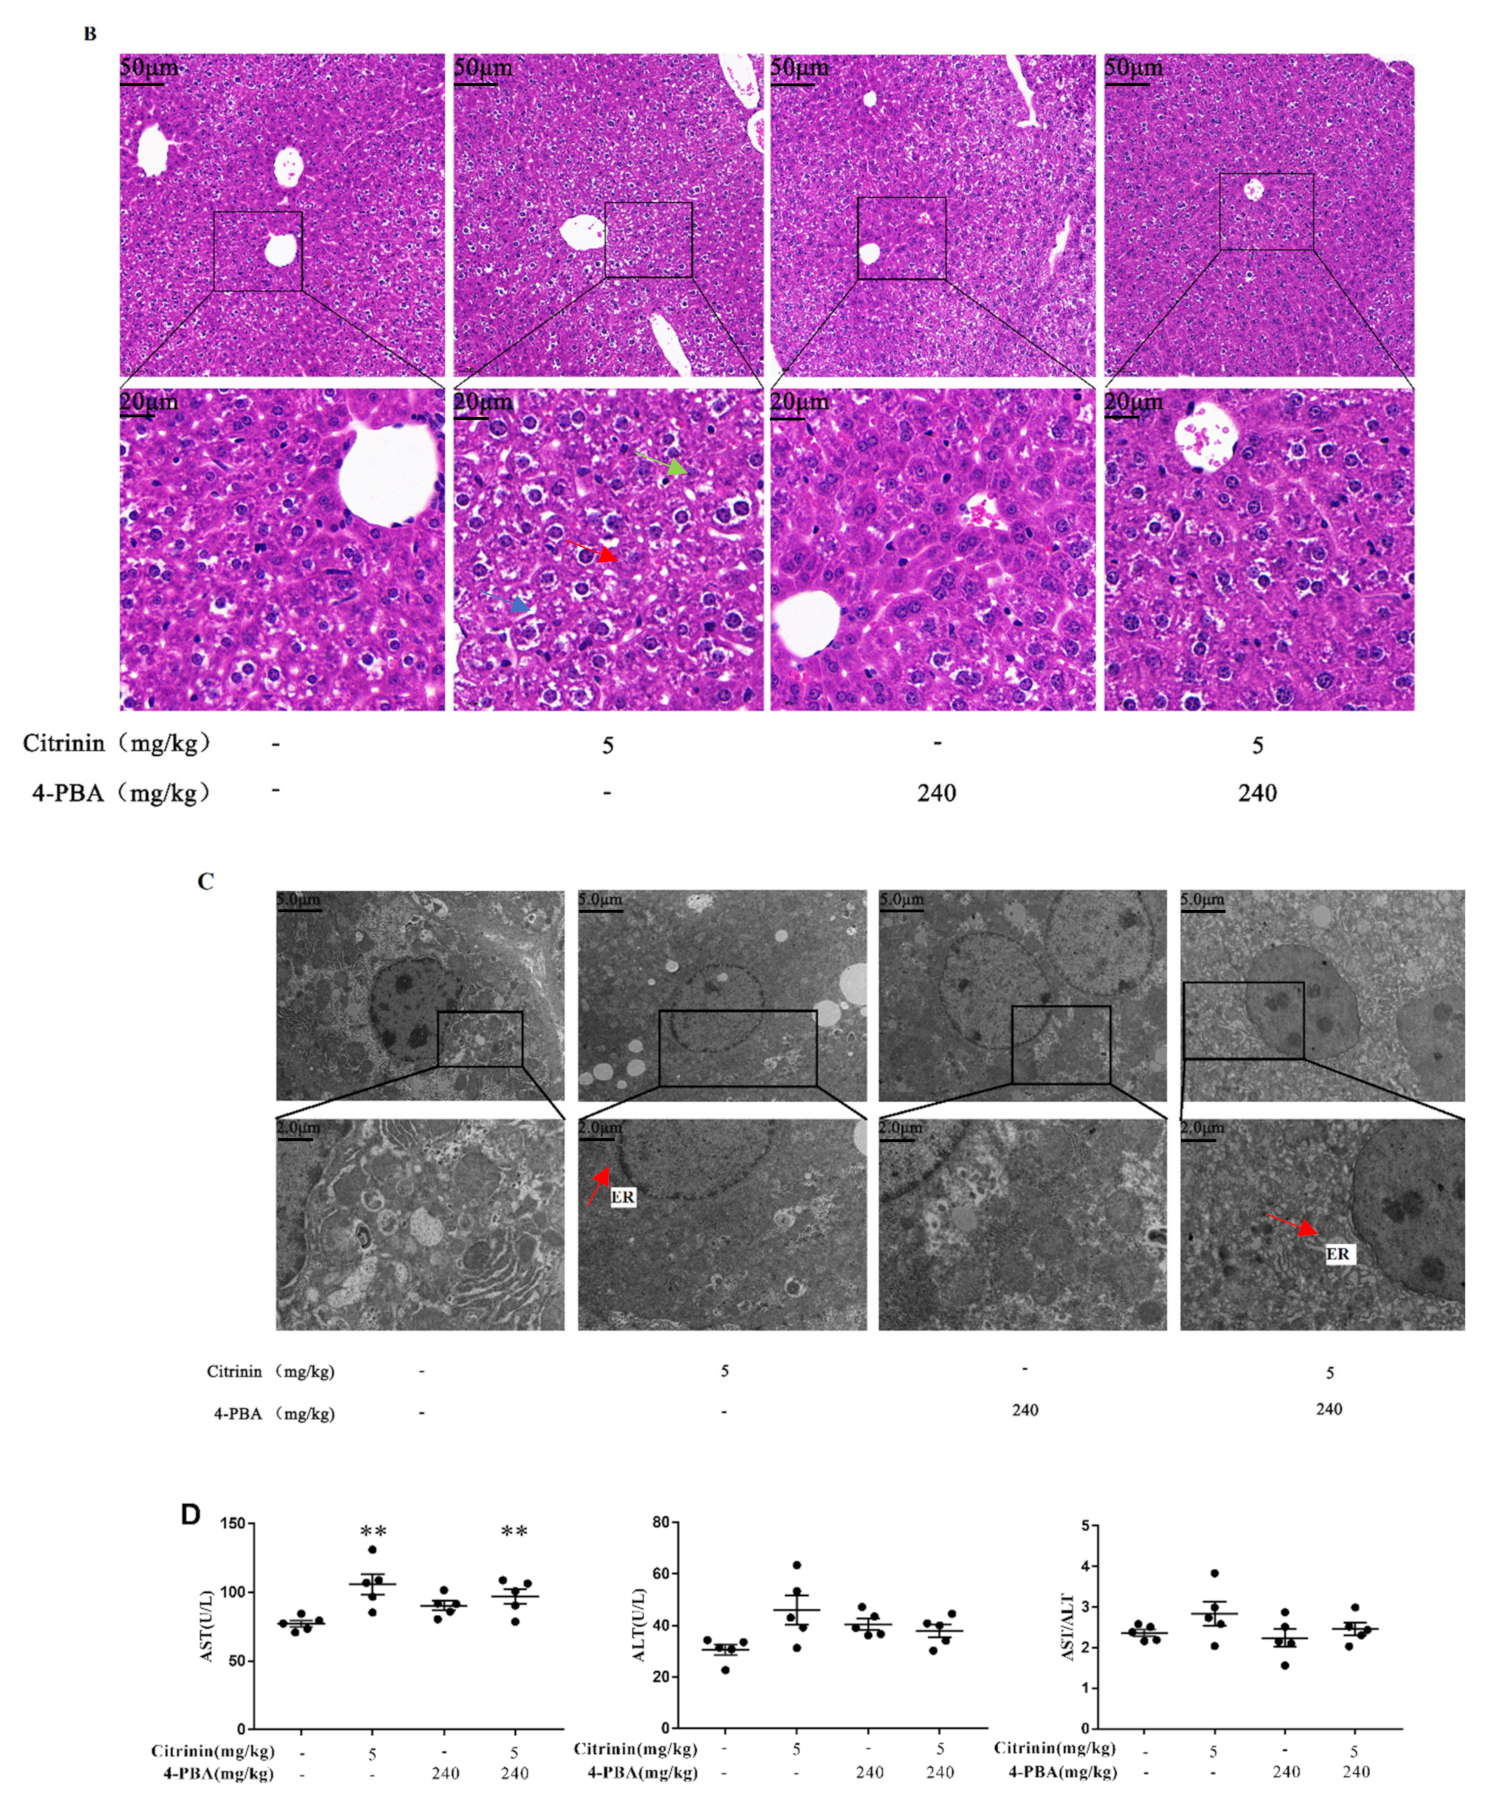
2.8. The Effects of 4-PBA Alleviates CTN-Induced Liver Injury
3. Discussion
4. Conclusions
5. Materials and Methods
5.1. Drugs and Reagents
5.2. Animals and Treatments
5.3. Measuring Liver Indices
5.4. Liver Function Biochemical Indices
5.5. Oxidation-Antioxidant Index Detection
5.6. Detection of Ca2+ Content
5.7. ROS Release Determination
5.8. Structural Observations of Liver Histology
5.9. Transmission Electron Microscope (TEM) Ultra-Structural Observations
5.10. Western Blotting
5.11. Data Analysis and Processing
Author Contributions
Funding
Institutional Review Board Statement
Informed Consent Statement
Data Availability Statement
Conflicts of Interest
References
- Turner, P.C.; Flannery, B.; Isitt, C.; Ali, M.; Pestka, J. The role of biomarkers in evaluating human health concerns from fungal contaminants in food. Nutr. Res. Rev. 2012, 25, 162–179. [Google Scholar] [CrossRef] [PubMed] [Green Version]
- Schmidt, J.; Cramer, B.; Turner, P.C.; Stoltzfus, R.J.; Humphrey, J.H.; Smith, L.E.; Humpf, H.U. Determination of Urinary Mycotoxin Biomarkers Using a Sensitive Online Solid Phase Extraction-UHPLC-MS/MS Method. Toxins 2021, 13, 418. [Google Scholar] [CrossRef] [PubMed]
- He, Y.; Cox, R.J. The molecular steps of citrinin biosynthesis in fungi. Chem. Sci. 2016, 7, 21192127. [Google Scholar] [CrossRef] [Green Version]
- De Oliveira Filho, J.W.G.; Islam, M.T.; Ali, E.S.; Uddin, S.J.; Santos, J.V.O.; de Alencar, M.V.O.B.; Júnior, A.L.G.; Paz, M.F.C.J.; de Brito, M.D.R.M.; ESousa, J.M.C.; et al. A comprehensive review on biological properties of citrinin. Food Chem. Toxicol. 2017, 110, 130141. [Google Scholar] [CrossRef] [PubMed]
- Gayathri, L.; Dhivya, R.; Dhanasekaran, D.; Periasamy, V.S.; Alshatwi, A.A.; Akbarsha, M.A. Hepatotoxic effect of ochratoxin A and citrinin, alone and in combination, and protective effect of vitamin E: In vitro study in HepG2 cell. Food Chem. Toxicol. 2015, 83, 15163. [Google Scholar] [CrossRef]
- Ning, Z.Q.; Cui, H.; Xu, Y.; Huang, Z.B.; Tu, Z.; Li, Y.P. Deleting the citrinin biosynthesis-related gene, ctnE, to greatly reduce citrinin production in Monascus aurantiacus Li AS3.4384. Int. J. Food Microbiol. 2017, 241, 325330. [Google Scholar] [CrossRef] [PubMed]
- Degen, G.H.; Ali, N.; Gundert-Remy, U. Preliminary data on citrinin kinetics in humans and their use to estimate citrinin exposure based on biomarkers. Toxicol. Lett. 2018, 282, 4348. [Google Scholar] [CrossRef] [PubMed]
- Leonard, A.; Paton, A.W.; El-Quadi, M.; Paton, J.C.; Fazal, F. Preconditioning with endoplasmic reticulum stress ameliorates endot- helial cell inflammation. PLoS ONE 2014, 9, e110949. [Google Scholar] [CrossRef] [PubMed] [Green Version]
- Hwang, J.; Qi, L. Quality Control in the Endoplasmic Reticulum: Crosstalk between ERAD and UPR pathways. Trends Biochem. Sci. 2018, 43, 593–605. [Google Scholar] [CrossRef] [PubMed]
- Ghosh, R.; Colon-Negron, K.; Papa, F.R. Endoplasmic reticulum stress, degeneration of pancreatic islet β-cells, and therapeutic modulation of the unfolded protein response in diabetes. Mol. Metab. 2019, 27, S60–S68. [Google Scholar] [CrossRef]
- Jia, H.; Liu, N.; Zhang, Y.; Wang, C.; Yang, Y.; Wu, Z. 3-Acetyldeoxynivalenol induces cell death through endoplasmic reticulum stress in mouse liver. Environ. Pollut. 2021, 286, 117238. [Google Scholar] [CrossRef] [PubMed]
- Liu, X.; Zhang, E.; Yin, S.; Zhao, C.; Fan, L.; Hu, H. Activation of the IRE1α Arm, but not the PERK Arm, of the Unfolded Protein Response Contributes to Fumonisin B1-Induced Hepatotoxicity. Toxins 2020, 12, 55. [Google Scholar] [CrossRef] [PubMed] [Green Version]
- Luo, Y.; Fu, X.; Ru, R.; Han, B.; Zhang, F.; Yuan, L.; Men, H.; Zhang, S.; Tian, S.; Dong, B.; et al. CpG Oligodeoxynucleotides Induces Apoptosis of Human Bladder Cancer Cells via Caspase-3-Bax/Bcl-2-p53 Axis. Arch. Med. Res. 2020, 51, 233–244. [Google Scholar] [CrossRef] [PubMed]
- Grant, D.M. Detoxification pathways in the liver. J. Inherit. Metab. Dis. 1991, 14, 421–430. [Google Scholar] [CrossRef] [PubMed]
- Reinke, H.; Asher, G. Circadian Clock Control of Liver Metabolic Functions. Gastroenterology 2016, 150, 574–580. [Google Scholar] [CrossRef] [Green Version]
- Bennett, J.W.; Klich, M. Mycotoxins. Clin. Microbiol. Rev. 2003, 16, 497–516. [Google Scholar] [CrossRef] [Green Version]
- Islam, M.T.; Mishra, S.K.; Tripathi, S.; de Alencar, M.V.O.B.; ESousa, J.M.C.; Rolim, H.M.L.; de Medeiros, M.D.G.F.; Ferreira, P.M.P.; Rouf, R.; Uddin, S.J.; et al. Mycotoxin-assisted mitochondrial dysfunction and cytotoxicity: Unexploited tools against proliferative disorders. IUBMB Life 2018, 70, 1084–1092. [Google Scholar] [CrossRef]
- Huang, B.; Chen, Q.; Wang, L.; Gao, X.; Zhu, W.; Mu, P.; Deng, Y. Aflatoxin B1 Induces Neurotoxicity through Reactive Oxygen Species Generation, DNA Damage, Apoptosis, and S-Phase Cell Cycle Arrest. Int. J. Mol. Sci. 2020, 21, 6517. [Google Scholar] [CrossRef]
- Bahrehmand, F.; Vaisi-Raygani, A.; Kiani, A.; Rahimi, Z.; Tavilani, H.; Navabi, S.J.; Shakiba, E.; Hassanzadeh, N.; Pourmotabbed, T. Matrix metalloproteinase-2 functional promoter polymorphism G1575A is associated with elevated circulatory MMP-2 levels and increased risk of cardiovascular disease in systemic lupus erythematosus patients. Lupus 2012, 21, 616–624. [Google Scholar] [CrossRef]
- Yu, M.; Peng, Z.; Liao, Y.; Wang, L.; Li, D.; Qin, C.; Hu, J.; Wang, Z.; Cai, M.; Cai, Q.; et al. Deoxynivalenol-induced oxidative stress and Nrf2 translocation in maternal liver on gestation day 12.5 d and 18.5 d. Toxicon 2019, 161, 17–22. [Google Scholar] [CrossRef]
- Marin, D.E.; Pistol, G.C.; Gras, M.; Palade, M.; Taranu, I. A comparison between the effects of ochratoxin A and aristolochic acid on the inflammation and oxidative stress in the liver and kidney of weanling piglets. Naunyn Schmiedebergs Arch. Pharmacol. 2018, 391, 1147–1156. [Google Scholar] [CrossRef] [PubMed]
- Ribeiro, S.M.; Chagas, G.M.; Campello, A.P.; Klüppel, M.L. Mechanism of citrinin-induced dysfunction of mitochondria. V. Effect on the homeostasis of the reactive oxygen species. Cell Biochem. Funct. 1997, 15, 203–209. [Google Scholar] [CrossRef]
- Pei, X.; Jiang, H.; Liu, X.; Li, L.; Li, C.; Xiao, X.; Li, D.; Tang, S. Targeting HMGB1 inhibits T-2 toxin-induced neurotoxicity via regulation of oxidative stress, neuroinflammation and neuronal apoptosis. Food Chem. Toxicol. 2021, 151, 112134. [Google Scholar] [CrossRef] [PubMed]
- Wang, J.; Jin, Y.; Wu, S.; Yu, H.; Zhao, Y.; Fang, H.; Shen, J.; Zhou, C.; Fu, Y.; Li, R.; et al. Deoxynivalenol induces oxidative stress, inflammatory response and apoptosis in bovine mammary epithelial cells. J. Anim. Physiol. Anim. Nutr. 2019, 103, 1663–1674. [Google Scholar] [CrossRef] [PubMed]
- Yang, J.; Guo, W.; Wang, J.; Yang, X.; Zhang, Z.; Zhao, Z. T-2 Toxin-Induced Oxidative Stress Leads to Imbalance of Mitochondrial Fission and Fusion to Activate Cellular Apoptosis in the Human Liver 7702 Cell Line. Toxins 2020, 12, 43. [Google Scholar] [CrossRef] [Green Version]
- D’Arcy, M.S. Cell death: A review of the major forms of apoptosis, necrosis and autophagy. Cell Biol. Int. 2019, 43, 582–592. [Google Scholar] [CrossRef]
- Chen, M.; Zhou, B.; Zhong, P.; Rajamanickam, V.; Dai, X.; Karvannan, K.; Zhou, H.; Zhang, X.; Liang, G. Increased Intracellular Reactive Oxygen Species Mediates the Anti-Cancer Effects of WZ35 via Activating Mitochondrial Apoptosis Pathway in Prostate Cancer Cells. Prostate 2017, 77, 489–504. [Google Scholar] [CrossRef]
- Kirsch, D.G.; Doseff, A.; Chau, B.N.; Lim, D.S.; de Souza-Pinto, N.C.; Hansford, R.; Kastan, M.B.; Lazebnik, Y.A.; Hardwick, J.M. Caspase-3-dependent cleavage of Bcl-2 promotes release of cytochrome c. J. Biol. Chem. 1999, 274, 21155–21161. [Google Scholar] [CrossRef] [Green Version]
- Muñoz-Pinedo, C.; Guío-Carrión, A.; Goldstein, J.C.; Fitzgerald, P.; Newmeyer, D.D.; Green, D.R. Different mitochondrial intermembrane space proteins are released during apoptosis in a manner that is coordinately initiated but can vary in duration. Proc. Natl. Acad. Sci. USA 2006, 103, 11573–11578. [Google Scholar] [CrossRef] [Green Version]
- Wu, J.; Li, J.; Liu, Y.; Liao, X.; Wu, D.; Chen, Y.; Liang, Z.; Yuan, Z.; Li, R.; Yi, J.; et al. Tannic acid repair of zearalenone-induced damage by regulating the death receptor and mitochondrial apoptosis signaling pathway in mice. Environ. Pollut. 2021, 287, 117557. [Google Scholar] [CrossRef]
- Wu, J.; Zhou, Y.; Yuan, Z.; Yi, J.; Chen, J.; Wang, N.; Tian, Y. Autophagy and Apoptosis Interact to Modulate T-2 Toxin-Induced Toxicity in Liver Cells. Toxins 2019, 11, 45. [Google Scholar] [CrossRef] [PubMed] [Green Version]
- Li, X.; Lv, Z.; Chen, J.; Nepovimova, E.; Long, M.; Wu, W.; Kuca, K. Bacillus amyloliquefaciens B10 can alleviate liver apoptosis and oxidative stress induced by aflatoxin B1. Food Chem. Toxicol. 2021, 151, 112124. [Google Scholar] [CrossRef] [PubMed]
- Bhandari, N.; Raghubir, P.; Sharma. Modulation of selected cell signaling genes in mouse liver by fumonisin B1. Chem. Biol. Interact. 2002, 139, 317–331. [Google Scholar] [CrossRef]
- West, S.J.; Kodakandla, G.; Wang, Q.; Tewari, R.; Zhu, M.X.; Boehning, D.; Akimzhanov, A.M. S-acylation of Orai1 regulates store-operated Ca2+ entry. J. Cell Sci. 2022, 135, jcs258579. [Google Scholar] [CrossRef] [PubMed]
- Tadic, V.; Prell, T.; Lautenschlaeger, J.; Grosskreutz, J. The ER mitochondria calcium cycle and ER stress response as therapeutic targets in amyotrophic lateral sclerosis. Front. Cell. Neurosci. 2014, 8, 147. [Google Scholar] [CrossRef] [Green Version]
- Guerrero-Hernandez, A.; Verkhratsky, A. Calcium signalling in diabetes. Cell Calcium 2014, 56, 297–301. [Google Scholar] [CrossRef]
- Collins, H.E.; Zhu-Mauldin, X.; Marchase, R.B.; Chatham, J.C. STIM1/Orai1-mediated SOCE: Current perspectives and potential roles in cardiac function and pathology. Am. J. Physiol. Heart Circ. Physiol. 2013, 305, H446–H458. [Google Scholar] [CrossRef] [Green Version]
- Wang, W.A.; Groenendyk, J.; Michalak, M. Endoplasmic reticulum stress associated responses in cancer. Biochim. Biophys. Acta 2014, 1843, 2143–2149. [Google Scholar] [CrossRef] [Green Version]
- Krebs, J.; Agellon, L.B.; Michalak, M. Ca2+ homeostasis and endoplasmic reticulum (ER) stress: An integrated view of calcium signaling. Biochem. Biophys. Res. Commun. 2015, 460, 114–121. [Google Scholar] [CrossRef]
- McCullough, K.D.; Martindale, J.L.; Klotz, L.O.; Aw, T.Y.; Holbrook, N.J. Gadd153 sensitizes cells to endoplasmic reticulum stress by down-regulating Bcl2 and perturbing the cellular redox state. Mol. Cell. Biol. 2001, 21, 1249–1259. [Google Scholar] [CrossRef] [Green Version]
- Malhotra, J.D.; Kaufman, R.J. The endoplasmic reticulum and the unfolded protein response. Semin. Cell Dev. Biol. 2007, 18, 716–731. [Google Scholar] [CrossRef] [PubMed] [Green Version]
- Guo, H.L.; Hassan, H.M.; Ding, P.P.; Wang, S.J.; Chen, X.; Wang, T.; Sun, L.X.; Zhang, L.Y.; Jiang, Z.Z. Pyrazinamide-induced hepatotoxicity is alleviated by 4-PBA via inhibition of the PERK-eIF2α-ATF4-CHOP pathway. Toxicology 2017, 378, 65–75. [Google Scholar] [CrossRef] [PubMed]
- Dudek, J.; Benedix, J.; Cappel, S.; Greiner, M.; Jalal, C.; Müller, L.; Zimmermann, R. Functions and pathologies of BiP and its interaction partners. Cell. Mol. Life Sci. 2009, 66, 1556–1569. [Google Scholar] [CrossRef] [PubMed]
- Liu, X.; Wang, Z.; Wang, X.; Yan, X.; He, Q.; Liu, S.; Ye, M.; Li, X.; Yuan, Z.; Wu, J.; et al. Involvement of endoplasmic reticulum stress-activated PERK-eIF2α-ATF4 signaling pathway in T-2 toxin-induced apoptosis of porcine renal epithelial cells. Toxicol. Appl. Pharmacol. 2021, 432, 115753. [Google Scholar] [CrossRef] [PubMed]
- Puthalakath, H.; O’Reilly, L.A.; Gunn, P.; Lee, L.; Kelly, P.N.; Huntington, N.D.; Hughes, P.D.; Michalak, E.M.; McKimm-Breschkin, J.; Motoyama, N.; et al. ER stress triggers apoptosis by activating BH3-only protein Bim. Cell 2007, 129, 1337–1349. [Google Scholar] [CrossRef] [PubMed] [Green Version]
- Yamaguchi, H.; Wang, H.G. CHOP is involved in endoplasmic reticulum stress-induced apoptosis by enhancing DR5 expression in human carcinoma cells. J. Biol. Chem. 2004, 279, 45495–45502. [Google Scholar] [CrossRef] [Green Version]
- Tao, S.C.; Yuan, T.; Rui, B.Y.; Zhu, Z.Z.; Guo, S.C.; Zhang, C.Q. Exosomes derived from human platelet-rich plasma prevent apoptosis induced by glucocorticoid-associated endoplasmic reticulum stress in rat osteonecrosis of the femoral head via the Akt/Bad/Bcl-2 signal pathway. Theranostics 2017, 7, 733–750. [Google Scholar] [CrossRef]
- Nakagawa, T.; Zhu, H.; Morishima, N.; Li, E.; Xu, J.; Yankner, B.A.; Yuan, J. Caspase-12 mediates endoplasmic-reticulum-specific apoptosis and cytotoxicity by amyloid-beta. Nature 2000, 403, 98–103. [Google Scholar] [CrossRef]
- Zhang, Q.; Liu, J.; Chen, S.; Liu, J.; Liu, L.; Liu, G.; Wang, F.; Jiang, W.; Zhang, C.; Wang, S.; et al. Caspase-12 is involved in stretch-induced apoptosis mediated endoplasmic reticulum stress. Apoptosis 2016, 21, 432–442. [Google Scholar] [CrossRef]
- Singh, M.P.; Kang, S.C. Endoplasmic reticulum stress-mediated autophagy activation attenuates fumonisin B1 induced hepatotoxicity In Vitro and In Vivo. Food Chem. Toxicol. 2017, 110, 371–382. [Google Scholar] [CrossRef]
- Chen, Q.; Wang, Y.; Jiao, F.Z.; Shi, C.X.; Gong, Z.J. Histone deacetylase 6 inhibitor ACY1215 offers a protective effect through the autophagy pathway in acute liver failure. Life Sci. 2019, 238, 116976. [Google Scholar] [CrossRef] [PubMed]
- Lin, P.; Chen, F.; Sun, J.; Zhou, J.; Wang, X.; Wang, N.; Li, X.; Zhang, Z.; Wang, A.; Jin, Y. Mycotoxin zearalenone induces apoptosis in mouse Leydig cells via an endoplasmic reticulum stress-dependent signalling pathway. Reprod. Toxicol. 2015, 52, 71–77. [Google Scholar] [CrossRef] [PubMed]
- Boussabbeh, M.; Ben Salem, I.; Prola, A.; Guilbert, A.; Bacha, H.; Abid-Essefi, S.; Lemaire, C. Patulin induces apoptosis through ROS-mediated endoplasmic reticulum stress pathway. Toxicol. Sci. 2015, 144, 328–337. [Google Scholar] [CrossRef] [PubMed] [Green Version]
- Yam, G.H.; Gaplovska-Kysela, K.; Zuber, C.; Roth, J. Sodium 4-phenylbutyrate acts as a chemical chaperone on misfolded myocilin to rescue cells from endoplasmic reticulum stress and apoptosis. Investig. Ophthalmol. Vis. Sci. 2007, 48, 1683–1690. [Google Scholar] [CrossRef]


Publisher’s Note: MDPI stays neutral with regard to jurisdictional claims in published maps and institutional affiliations. |
© 2022 by the authors. Licensee MDPI, Basel, Switzerland. This article is an open access article distributed under the terms and conditions of the Creative Commons Attribution (CC BY) license (https://creativecommons.org/licenses/by/4.0/).
Share and Cite
Wu, D.; Yang, C.; Yang, M.; Wu, Y.; Mao, Y.; Zhou, X.; Wang, J.; Yuan, Z.; Wu, J. Citrinin-Induced Hepatotoxicity in Mice Is Regulated by the Ca2+/Endoplasmic Reticulum Stress Signaling Pathway. Toxins 2022, 14, 259. https://doi.org/10.3390/toxins14040259
Wu D, Yang C, Yang M, Wu Y, Mao Y, Zhou X, Wang J, Yuan Z, Wu J. Citrinin-Induced Hepatotoxicity in Mice Is Regulated by the Ca2+/Endoplasmic Reticulum Stress Signaling Pathway. Toxins. 2022; 14(4):259. https://doi.org/10.3390/toxins14040259
Chicago/Turabian StyleWu, Dongyi, Chenglin Yang, Mengran Yang, You Wu, Yan Mao, Xinyan Zhou, Ji Wang, Zhihang Yuan, and Jing Wu. 2022. "Citrinin-Induced Hepatotoxicity in Mice Is Regulated by the Ca2+/Endoplasmic Reticulum Stress Signaling Pathway" Toxins 14, no. 4: 259. https://doi.org/10.3390/toxins14040259
APA StyleWu, D., Yang, C., Yang, M., Wu, Y., Mao, Y., Zhou, X., Wang, J., Yuan, Z., & Wu, J. (2022). Citrinin-Induced Hepatotoxicity in Mice Is Regulated by the Ca2+/Endoplasmic Reticulum Stress Signaling Pathway. Toxins, 14(4), 259. https://doi.org/10.3390/toxins14040259