Communication

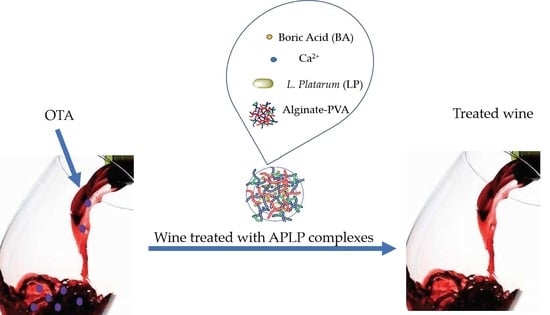
Removal of Ochratoxin A from Red Wine Using Alginate-PVA-L. plantarum (APLP) Complexes: A Preliminary Study

by
Ricardo Ignacio Castro
1,
V. Felipe Laurie
2,
Carlos Padilla
3 and
Verónica Carrasco-Sánchez
3,*
1
Multidisciplinary Agroindustry Research Laboratory, Instituto de Ciencias Químicas y Aplicadas, Universidad Autónoma de Chile, Talca 3467987, Chile
2
Facultad de Ciencias Agrarias, Universidad de Talca, Talca 3460000, Chile
3
Departamento de Microbiología, Facultad de Ciencias de la Salud, Universidad de Talca, Talca 3460000, Chile
*
Author to whom correspondence should be addressed.
Toxins 2022, 14(4), 230; https://doi.org/10.3390/toxins14040230
Submission received: 28 January 2022 / Revised: 18 March 2022 / Accepted: 20 March 2022 / Published: 22 March 2022
(This article belongs to the Section Mycotoxins)

Abstract

:
The presence of ochratoxin A (OTA) in wines is a problem mainly due to the health damage it can cause to frequent drinkers. A method for removing these toxic substances from wine is the use of lactic acid bacteria with mycotoxin-adsorption capacities; however, their use is limited since a matrix in which they can be immobilized, to remove them after use, is needed. In this study, L. plantarum (LP) was encapsulated in a polymeric matrix composed of polyvinyl alcohol (PVA) and alginate, forming alginate–PVA–LP (APLP) complexes. Then, these complexes were characterized, and assays of OTA and phenol removal from wines were performed. As a result, it was observed that the APLP complexes at a concentration of 0.5 g mL−1 removed over 50% of the OTA without substantially affecting the concentration of total phenols. In addition, it was determined that the presence of L. plantarum directly affected the ability to adsorb OTA from wines and did not decrease the total phenols. In conclusion, an alginate–PVA matrix allows immobilizing LP, and the complexes formed are an alternative for removing ochratoxin from contaminated wines.
Key Contribution: (a) It was possible to immobilize Lactobacillus plantarum in an alginate-PVA matrix, and (b) the use of complex APLPs enabled the adsorption of OTA from red wines without substantially damaging their phenolic content.

Graphical Abstract

1. Introduction

Ochratoxin A (OTA) is a mycotoxin produced mainly by Aspergillus carbonarius, A. ochraceus, A. niger, Penicillium verrucosum, and P. nordicum [1]. Structurally, it consists of a p-chlorophenolic group linked to a dihydroisocoumarin fragment linked by an amide bond to an L-phenylalanine [2]. Additionally, it has been found as a contaminant in cereals, beer, coffee beans, cacao, spices, dried wine fruit, grape juice, and wine, and human blood and animal tissues [3].
The presence of OTA in wines was first reported in Switzerland in 1996 [4]. Since that first report, this mycotoxin has been described in wines in several countries worldwide [5,6,7].
The contamination of wines with OTA should raise a public health alert worldwide for frequent drinkers since these toxins can cause acute to chronic poisoning [8,9,10], and wine is considered the second most important dietary source of OTA after cereals [11]. Thus, the regulation 1881/2006 of the European Commission (EC) established a concentration of 2 µg kg−1 as the maximum tolerable level in wines destined for human consumption [12].
Many scientists have focused on studying different strategies (physical, chemical, and biological) to remove mycotoxins from red wines [13,14,15,16]. Although many chemical strategies have been promising, their use is limited by possible side effects and is not allowed within the EC for commodities destined for human consumption [3]. Therefore, biological agents are an alternative, mainly due to the ability of lactic acid bacteria (LAB) to adsorb mycotoxins in aqueous matrices [17,18,19,20]. The most versatile LAB seem to be Lactobacillus species, which efficiently remove OTA [19,21].
Using free microbial cells can present tremendous stresses such as those regarding survival, proliferation, mechanical disturbances, low adaptation, and competition from indigenous microorganisms in natural environments [22]. Immobilization strategies emerge as an alternative solution since immobilized bacteria can be shielded from the stress of high pollutant concentrations, predators, and competition with indigenous microorganisms [23].
This study proposes a new system (APLP complex) composed of lactic acid bacteria with known mycotoxin-adsorption activity encapsulated in a matrix composed of alginate and polyvinyl alcohol (PVA) polymers as a strategy for mycotoxin removal from red wines.

2. Results and Discussion

2.1. Development and Characterization of Alginate–PVA–L. plantarum Complexes

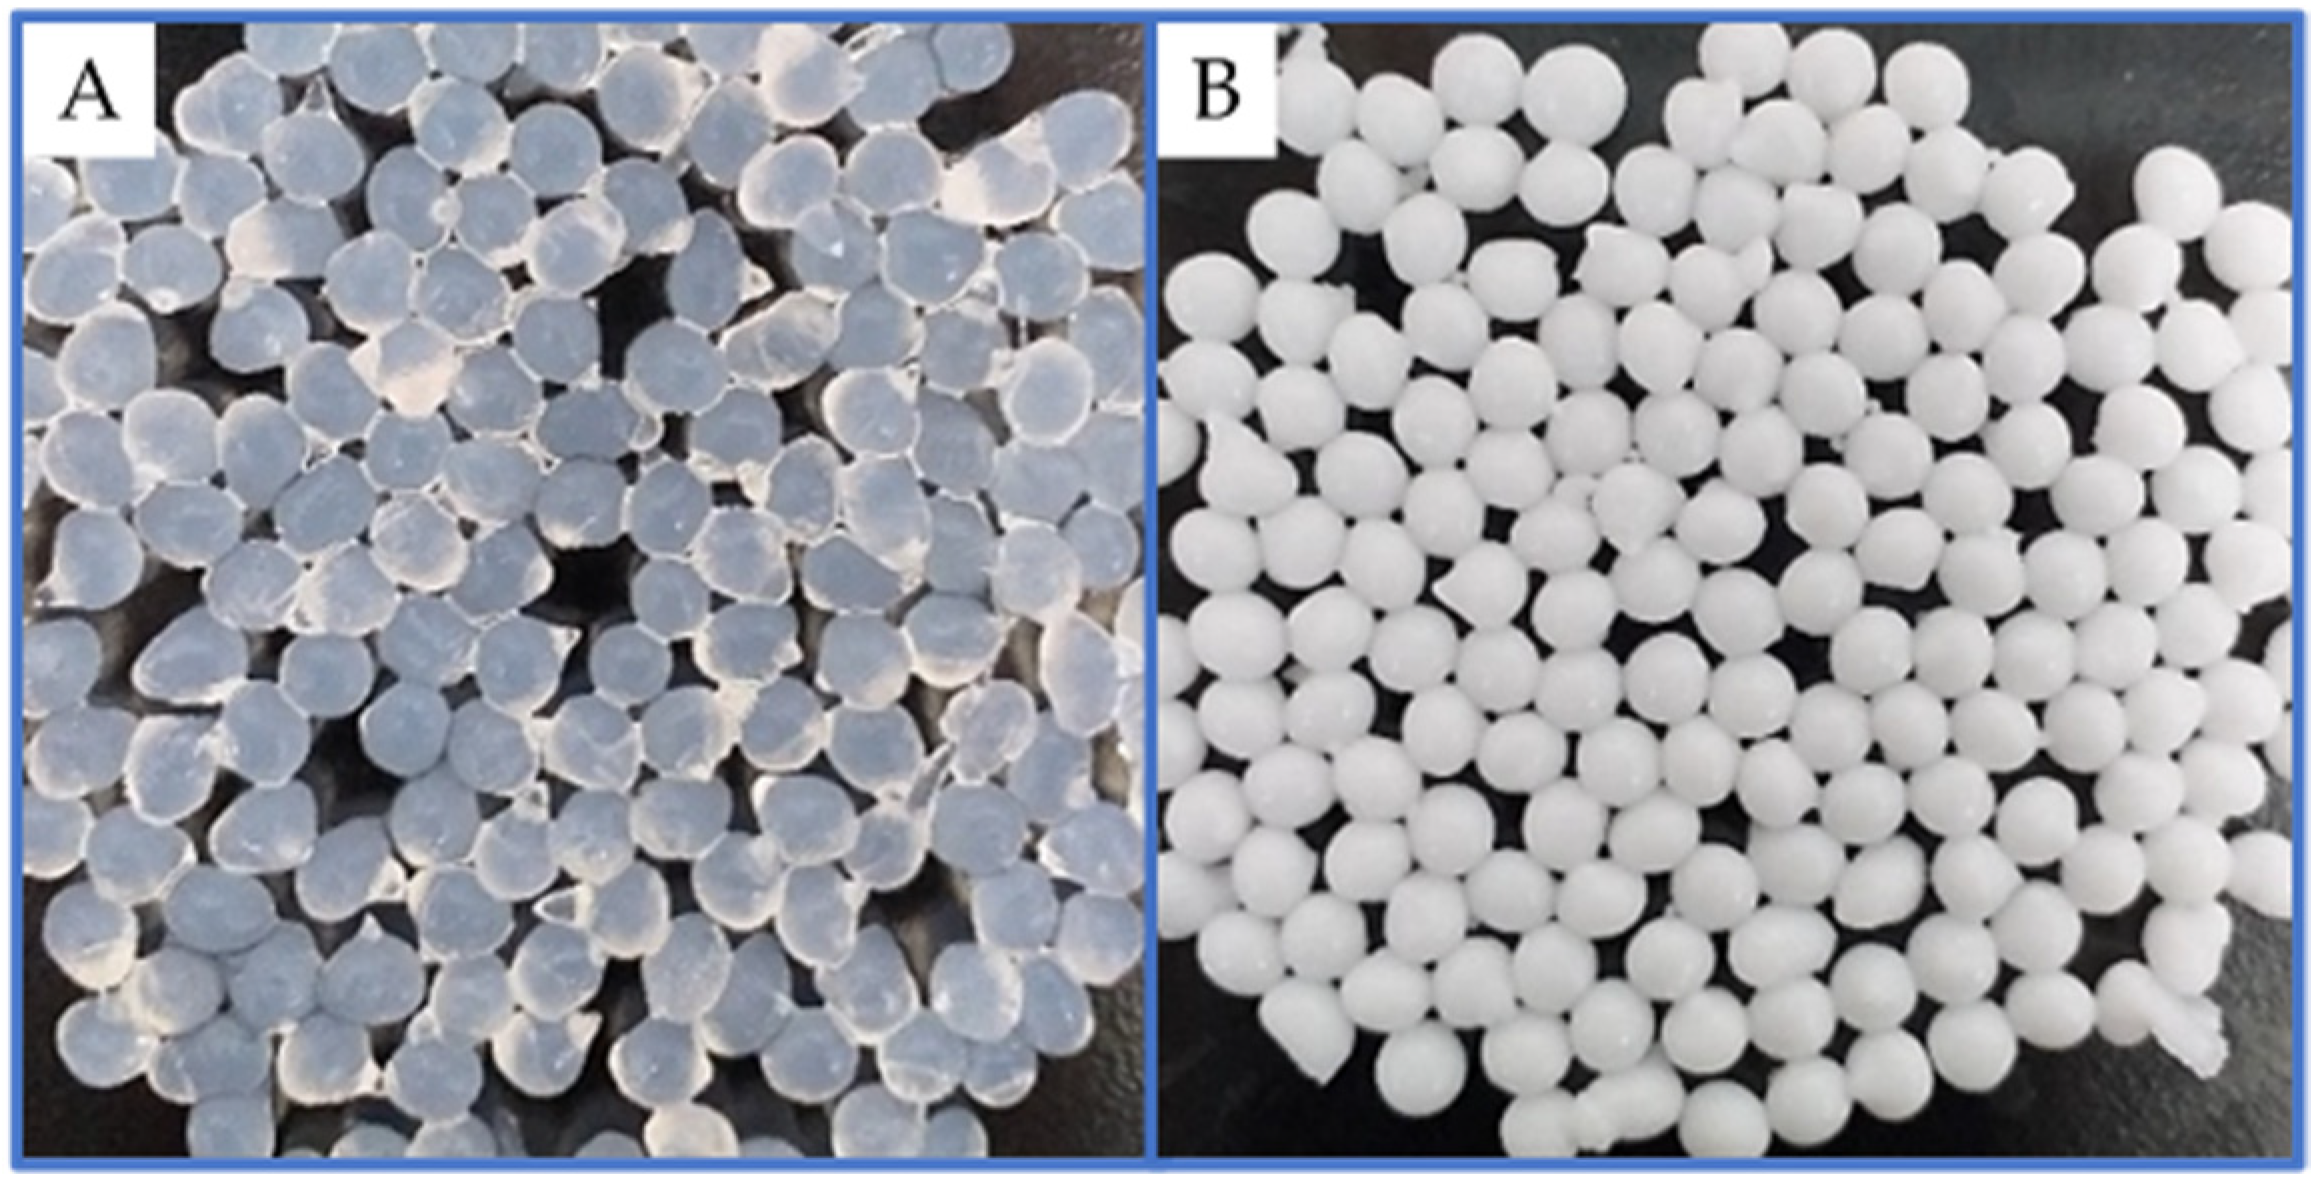
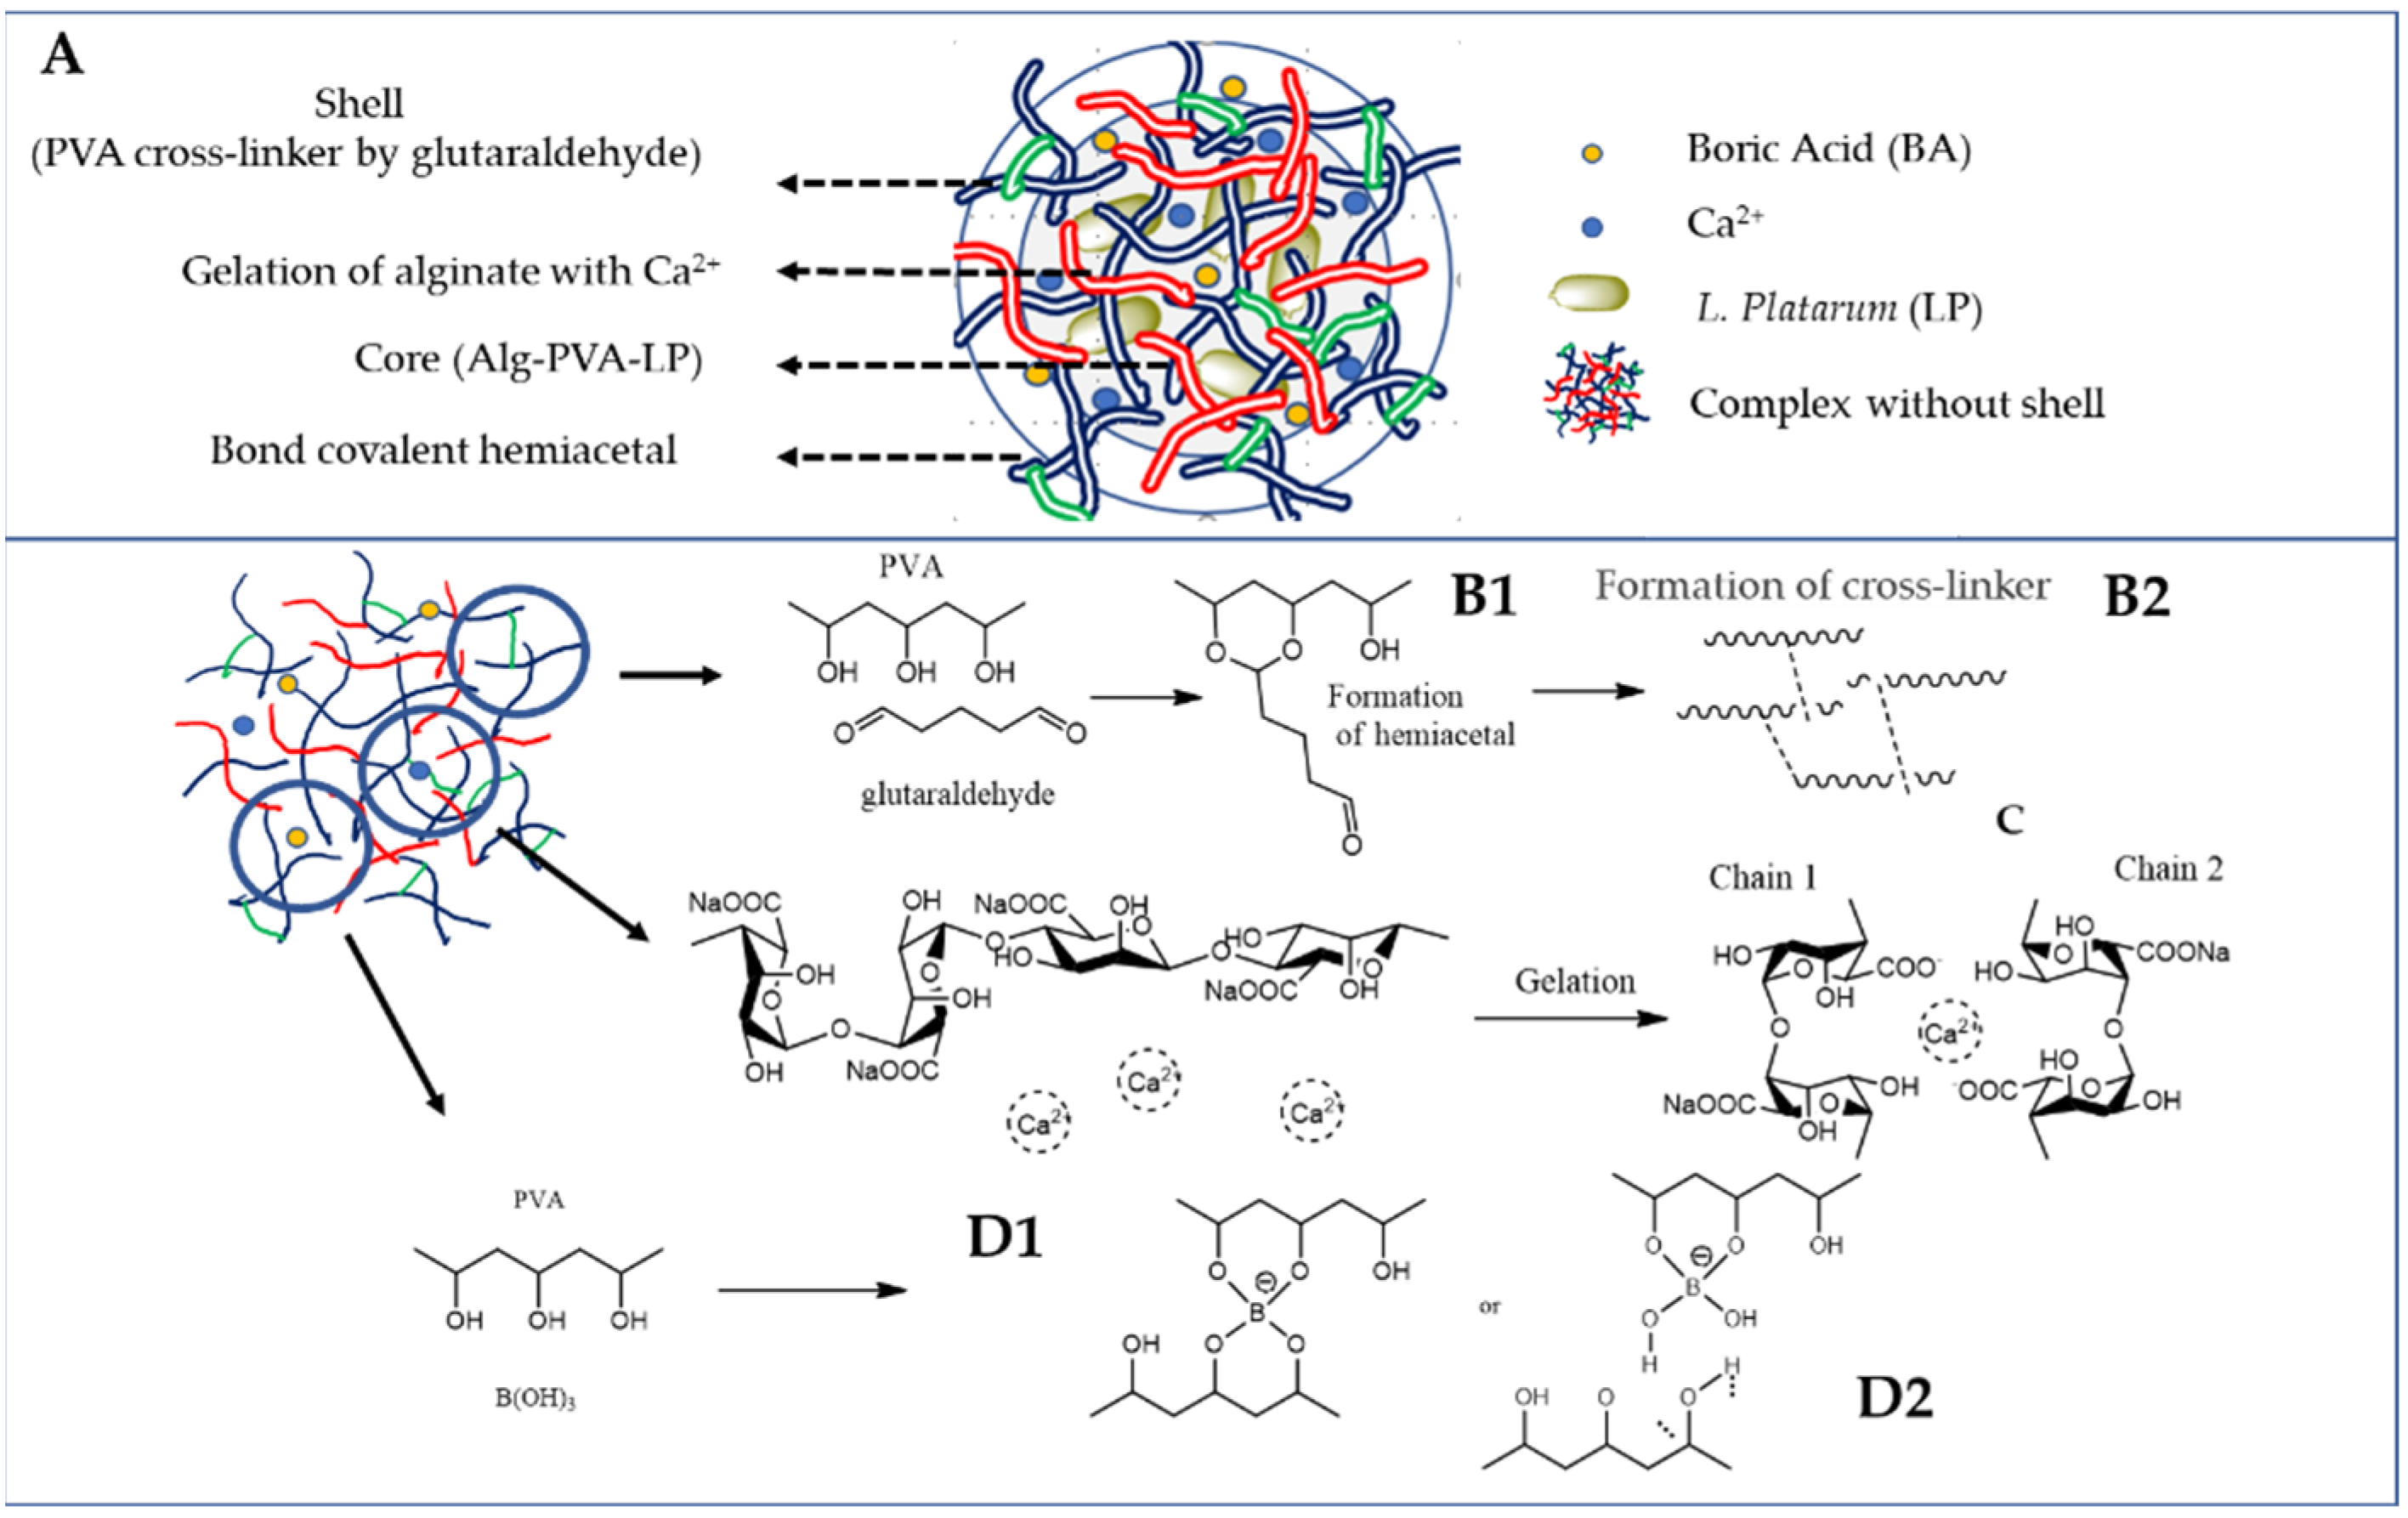
2.1.1. Development of Alginate–PVA–L. plantarum Complexes

In the present study, a strain of Lactobacillus plantarum (LP) with known OTA-adsorbing capacity was encapsulated in alginate–PVA (AP) polymers, forming alginate–PVA–L. plantarum (APLP) complexes, to develop a handy and easily removable tool for adsorbing the mycotoxin from red wines.
Alginate was used because it is a natural polymer (composed of D-mannuronic acid and D-glucuronic acid), non-toxic, biocompatible, and biodegradable, and is exploited in the food industry. Even in the wine industry, it is studied for encapsulating living yeast cells to carry out controlled fermentation [24]. Thus, L. plantarum was encapsulated in a polymeric matrix composed of PVA linked to boric acid (BA) and glutaraldehyde (GA); and alginate (Alg)’s crosslinking with calcium ions and the microspheres presented a sub-spherical shape measuring 1.5–2 mm in diameter (Figure 1). The complexes developed and their compositions are detailed in Table 1.
The proposed mechanism for developing APLP complexes consisted of the following steps: first, the BA acts as a crosslinker for PVA, forming dioxaborinane rings [25], followed by hemiacetal formation between GA and the OH groups on PVA [26]. Second, the encapsulation of L. plantarum in calcium alginate networks, induced by the gelation resulting from specific and strong ionic interactions between Ca2+ and G blocks of alginate, results in the “egg-box” structure [27,28] (Figure 2).
Even though PVA can form spheres when crosslinked with boric acid, these tend to agglomerate, mainly due to the relatively slow crosslinking. For this reason, a mixed solution of PVA and sodium was used. In this way, it was thought that the PVA could improve the durability and resistance of the pearls, while the calcium alginate could improve the surface properties of the pearls, reducing the tendency to agglomeration [29].
On the other hand, it was also shown that the polymeric matrix prevented the release of bacteria when the complexes were placed in contact with a model solution of wine at pH 3.5. The prior allows us to suspect that these complexes have good stability and could possibly be used in wine, given that no cells that could compromise wine composition were being released. In any case, the prior requires further studies to confirm this observation under different environmental conditions.

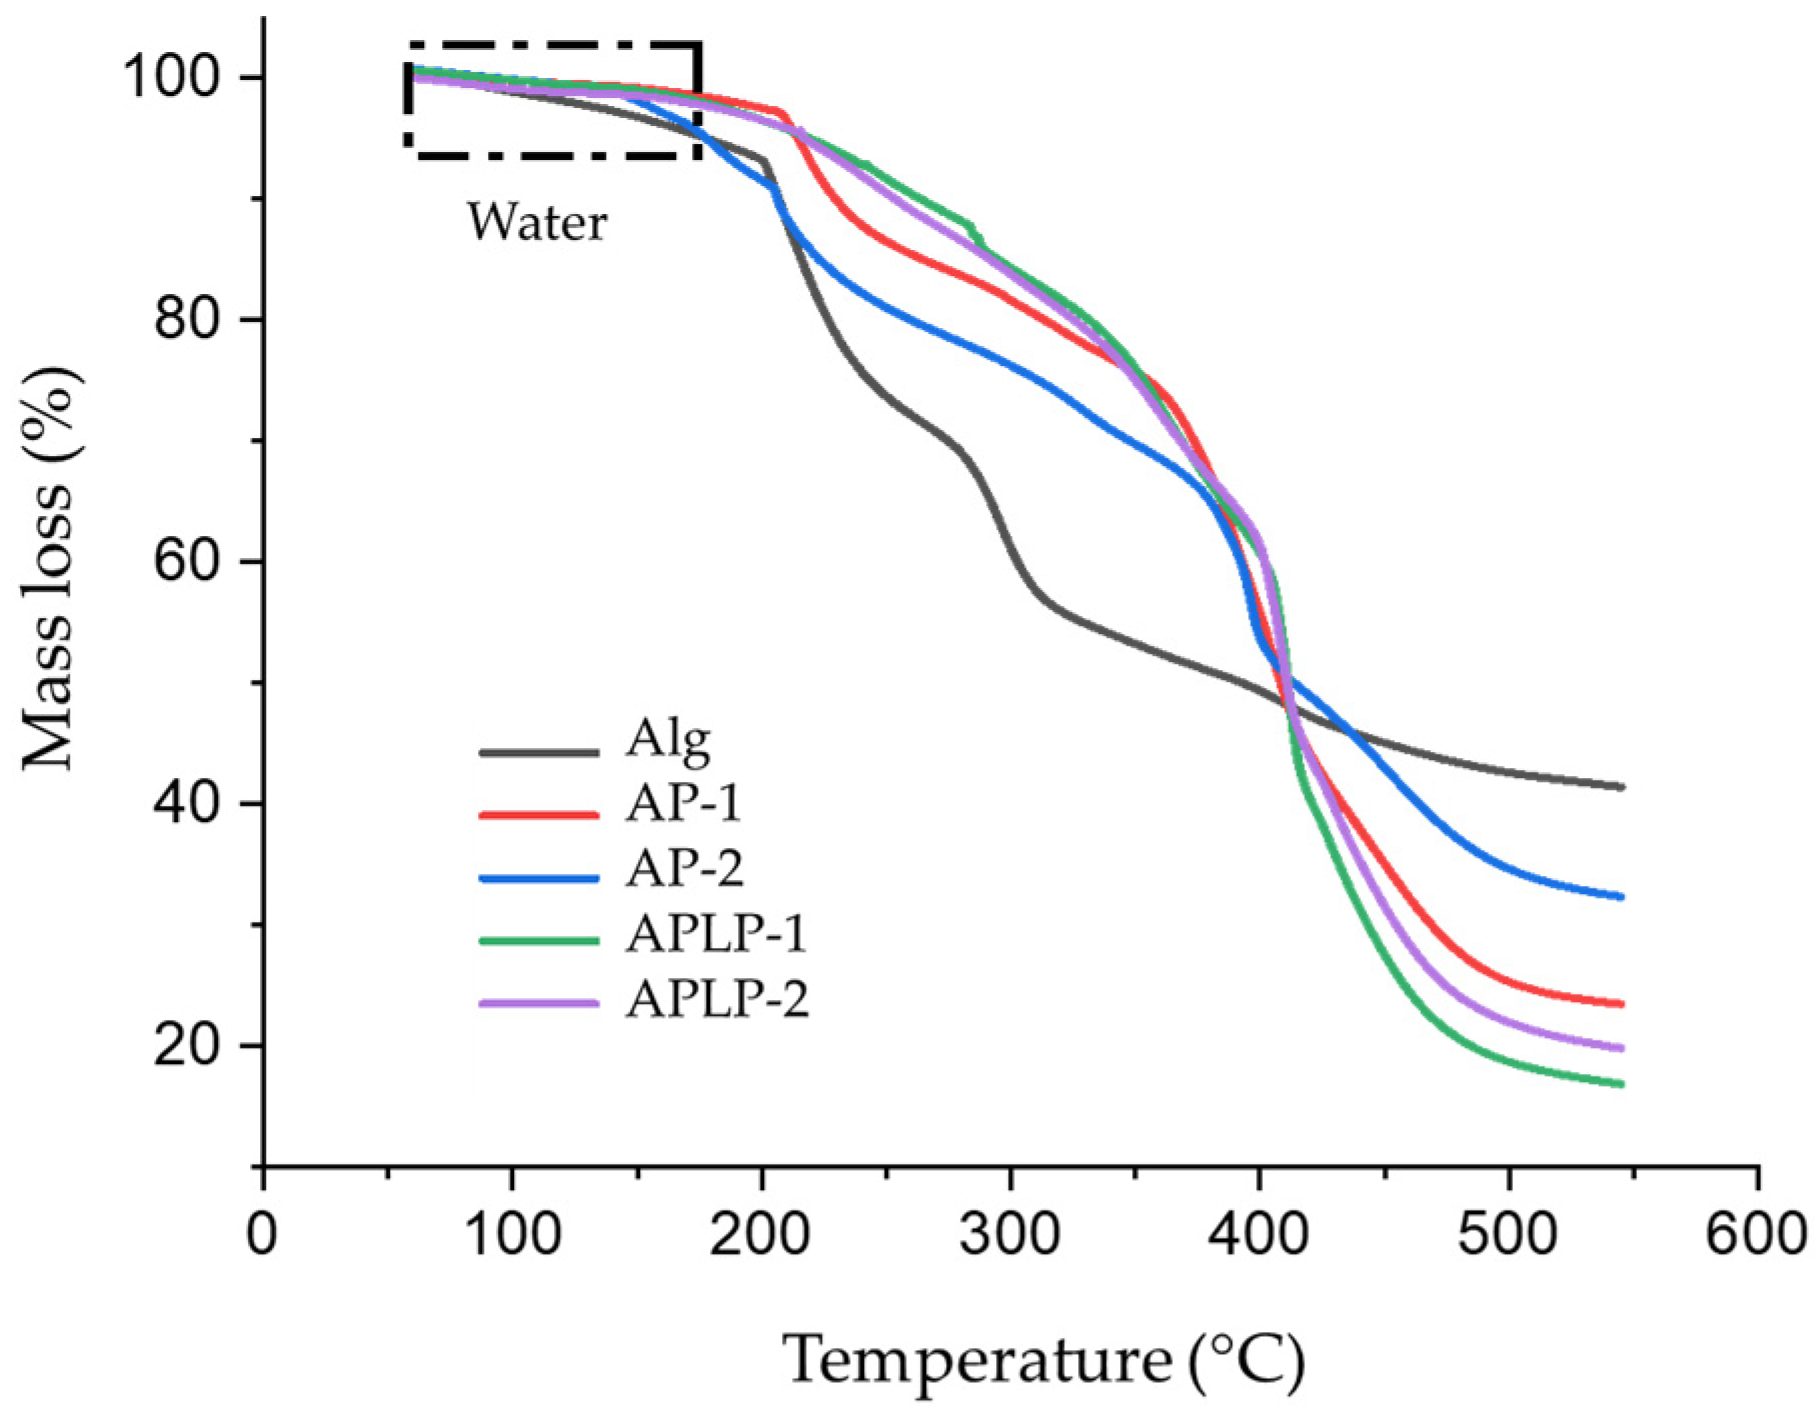
2.1.2. Characterization of Alginate–PVA–L. plantarum Complexes

The characterization of the alginate, AP, and APLP complexes by thermogravimetry analysis (TGA) (Figure 3) showed that all the samples had the capacity for water absorption; this result is observed in the regions of the TGA curves between 50 and 180 °C, which is indicative of the loss of moisture and suggests either physically weakly or chemically strongly bound water [30,31].
However, the formation of a crosslinker (boric acid) between the chain of PVA and the gelation of alginate with calcium ions decreases the water absorption and increases the thermal stability of the complex due to the interaction of PVA chains and the possible ionic interactions between the hydroxyl groups of both chains (double-network hydrogels). Additionally, the increase in the thermal stability of the complex may also be due to the change in molecule between B(OH)3 and water [32].
Finally, the APLP−1 and APLP-2 curves indicate increased stability and decreased water absorption, possibly due to the interaction of L. plantarum with the alginate and PVA chains, which suggests the formation of the complex.

2.2. OTA Removal from Red Wines for APLP Complexes

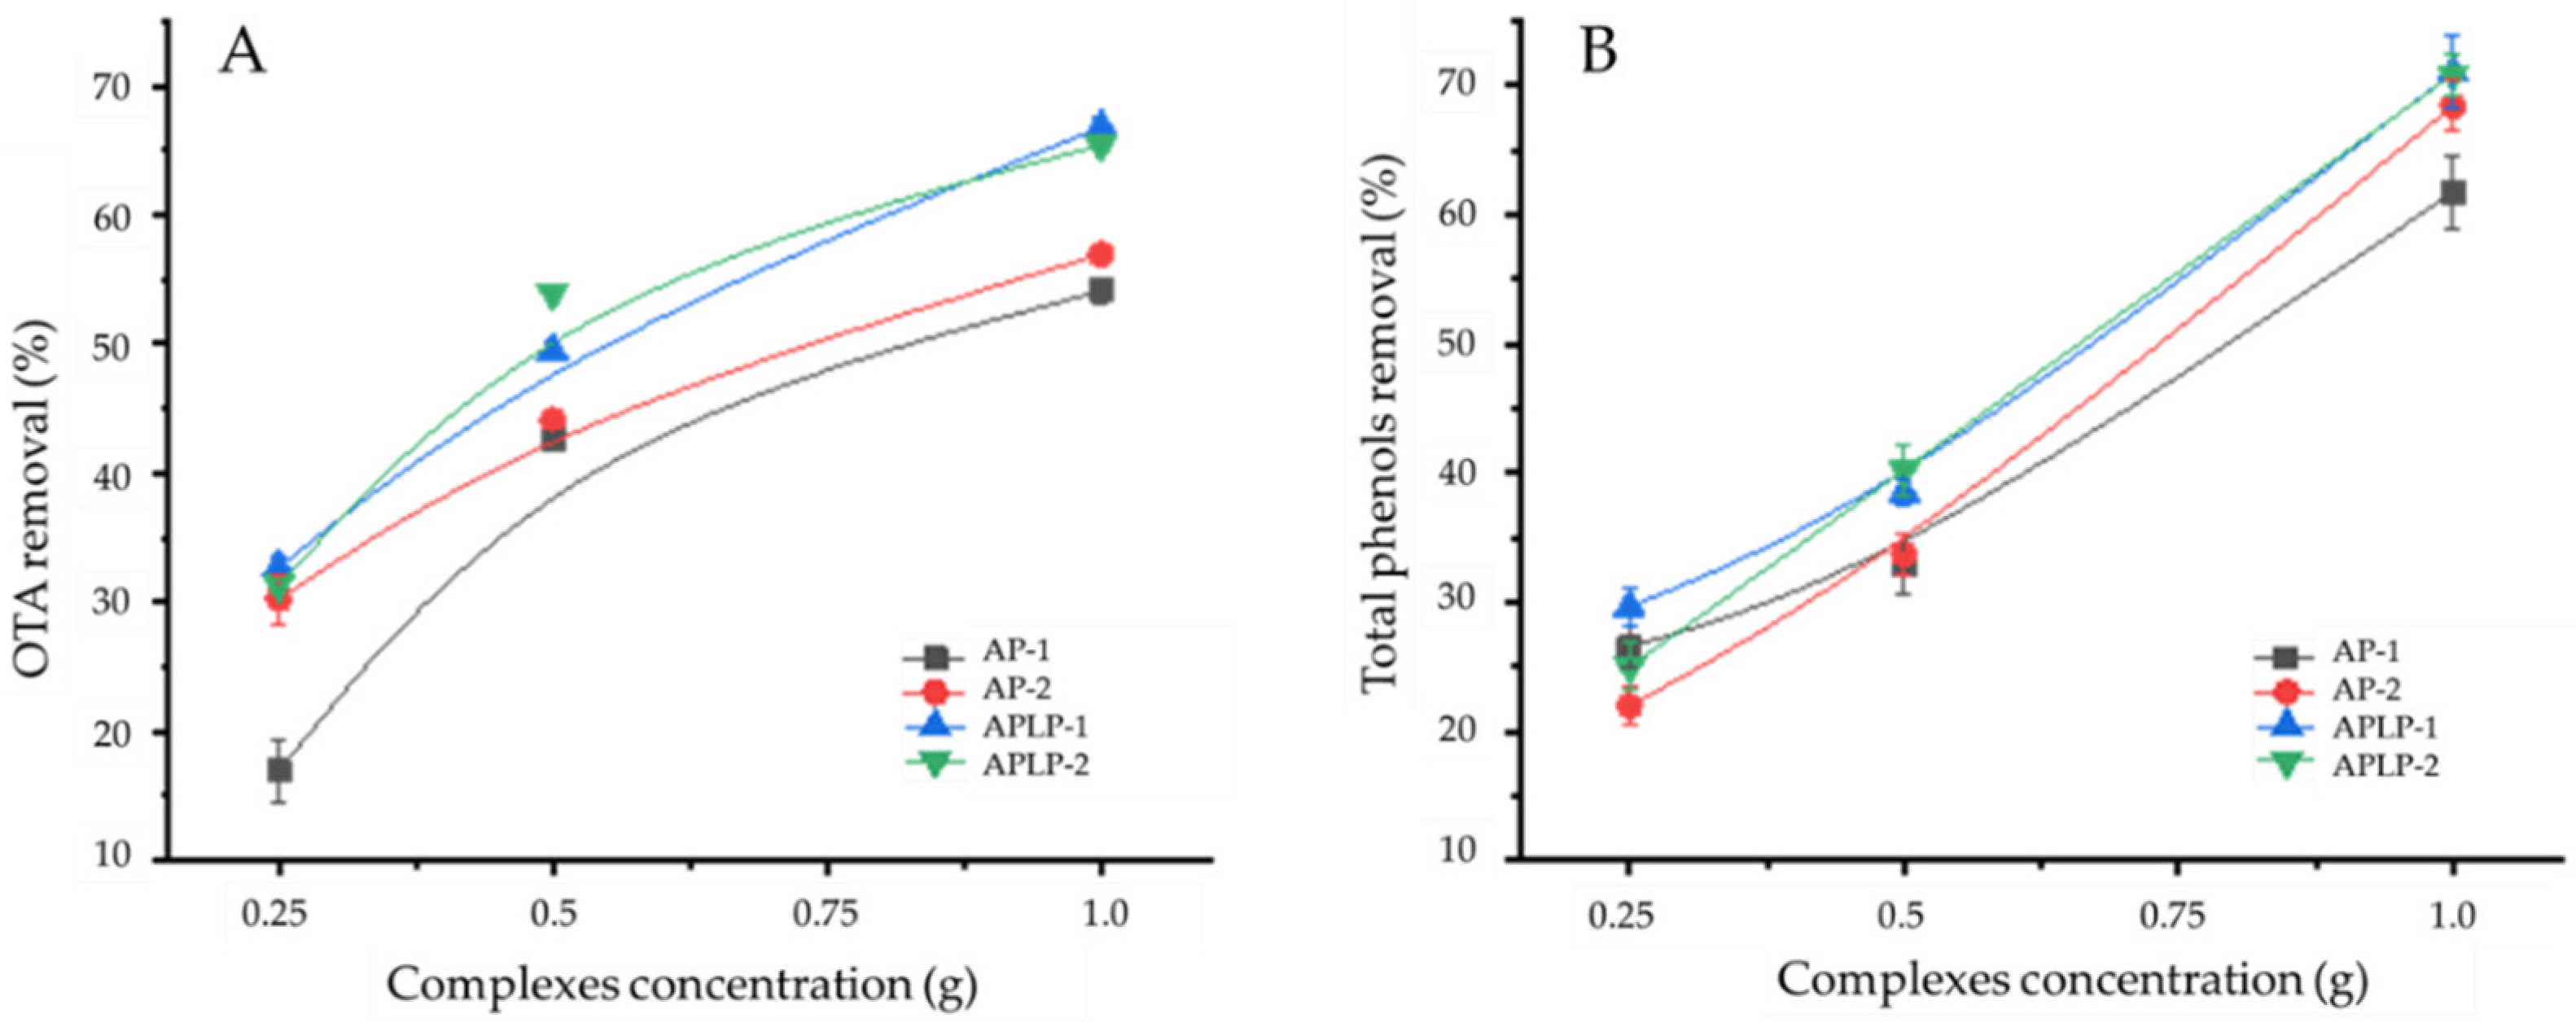
2.2.1. Study of Effects of Complex Concentration on OTA and Phenol Removal

The kinetic curves showed that APLP−1 and APLP-2 at a concentration of 1 g mL−1 removed over 60% of the OTA. However, it also removed over 60% of the total phenols. Therefore, to obtain a removal result of over 50% for OTA without substantially affecting the concentration of total phenols, we concluded that the best concentration was 0.5 g mL−1 (Figure 4).

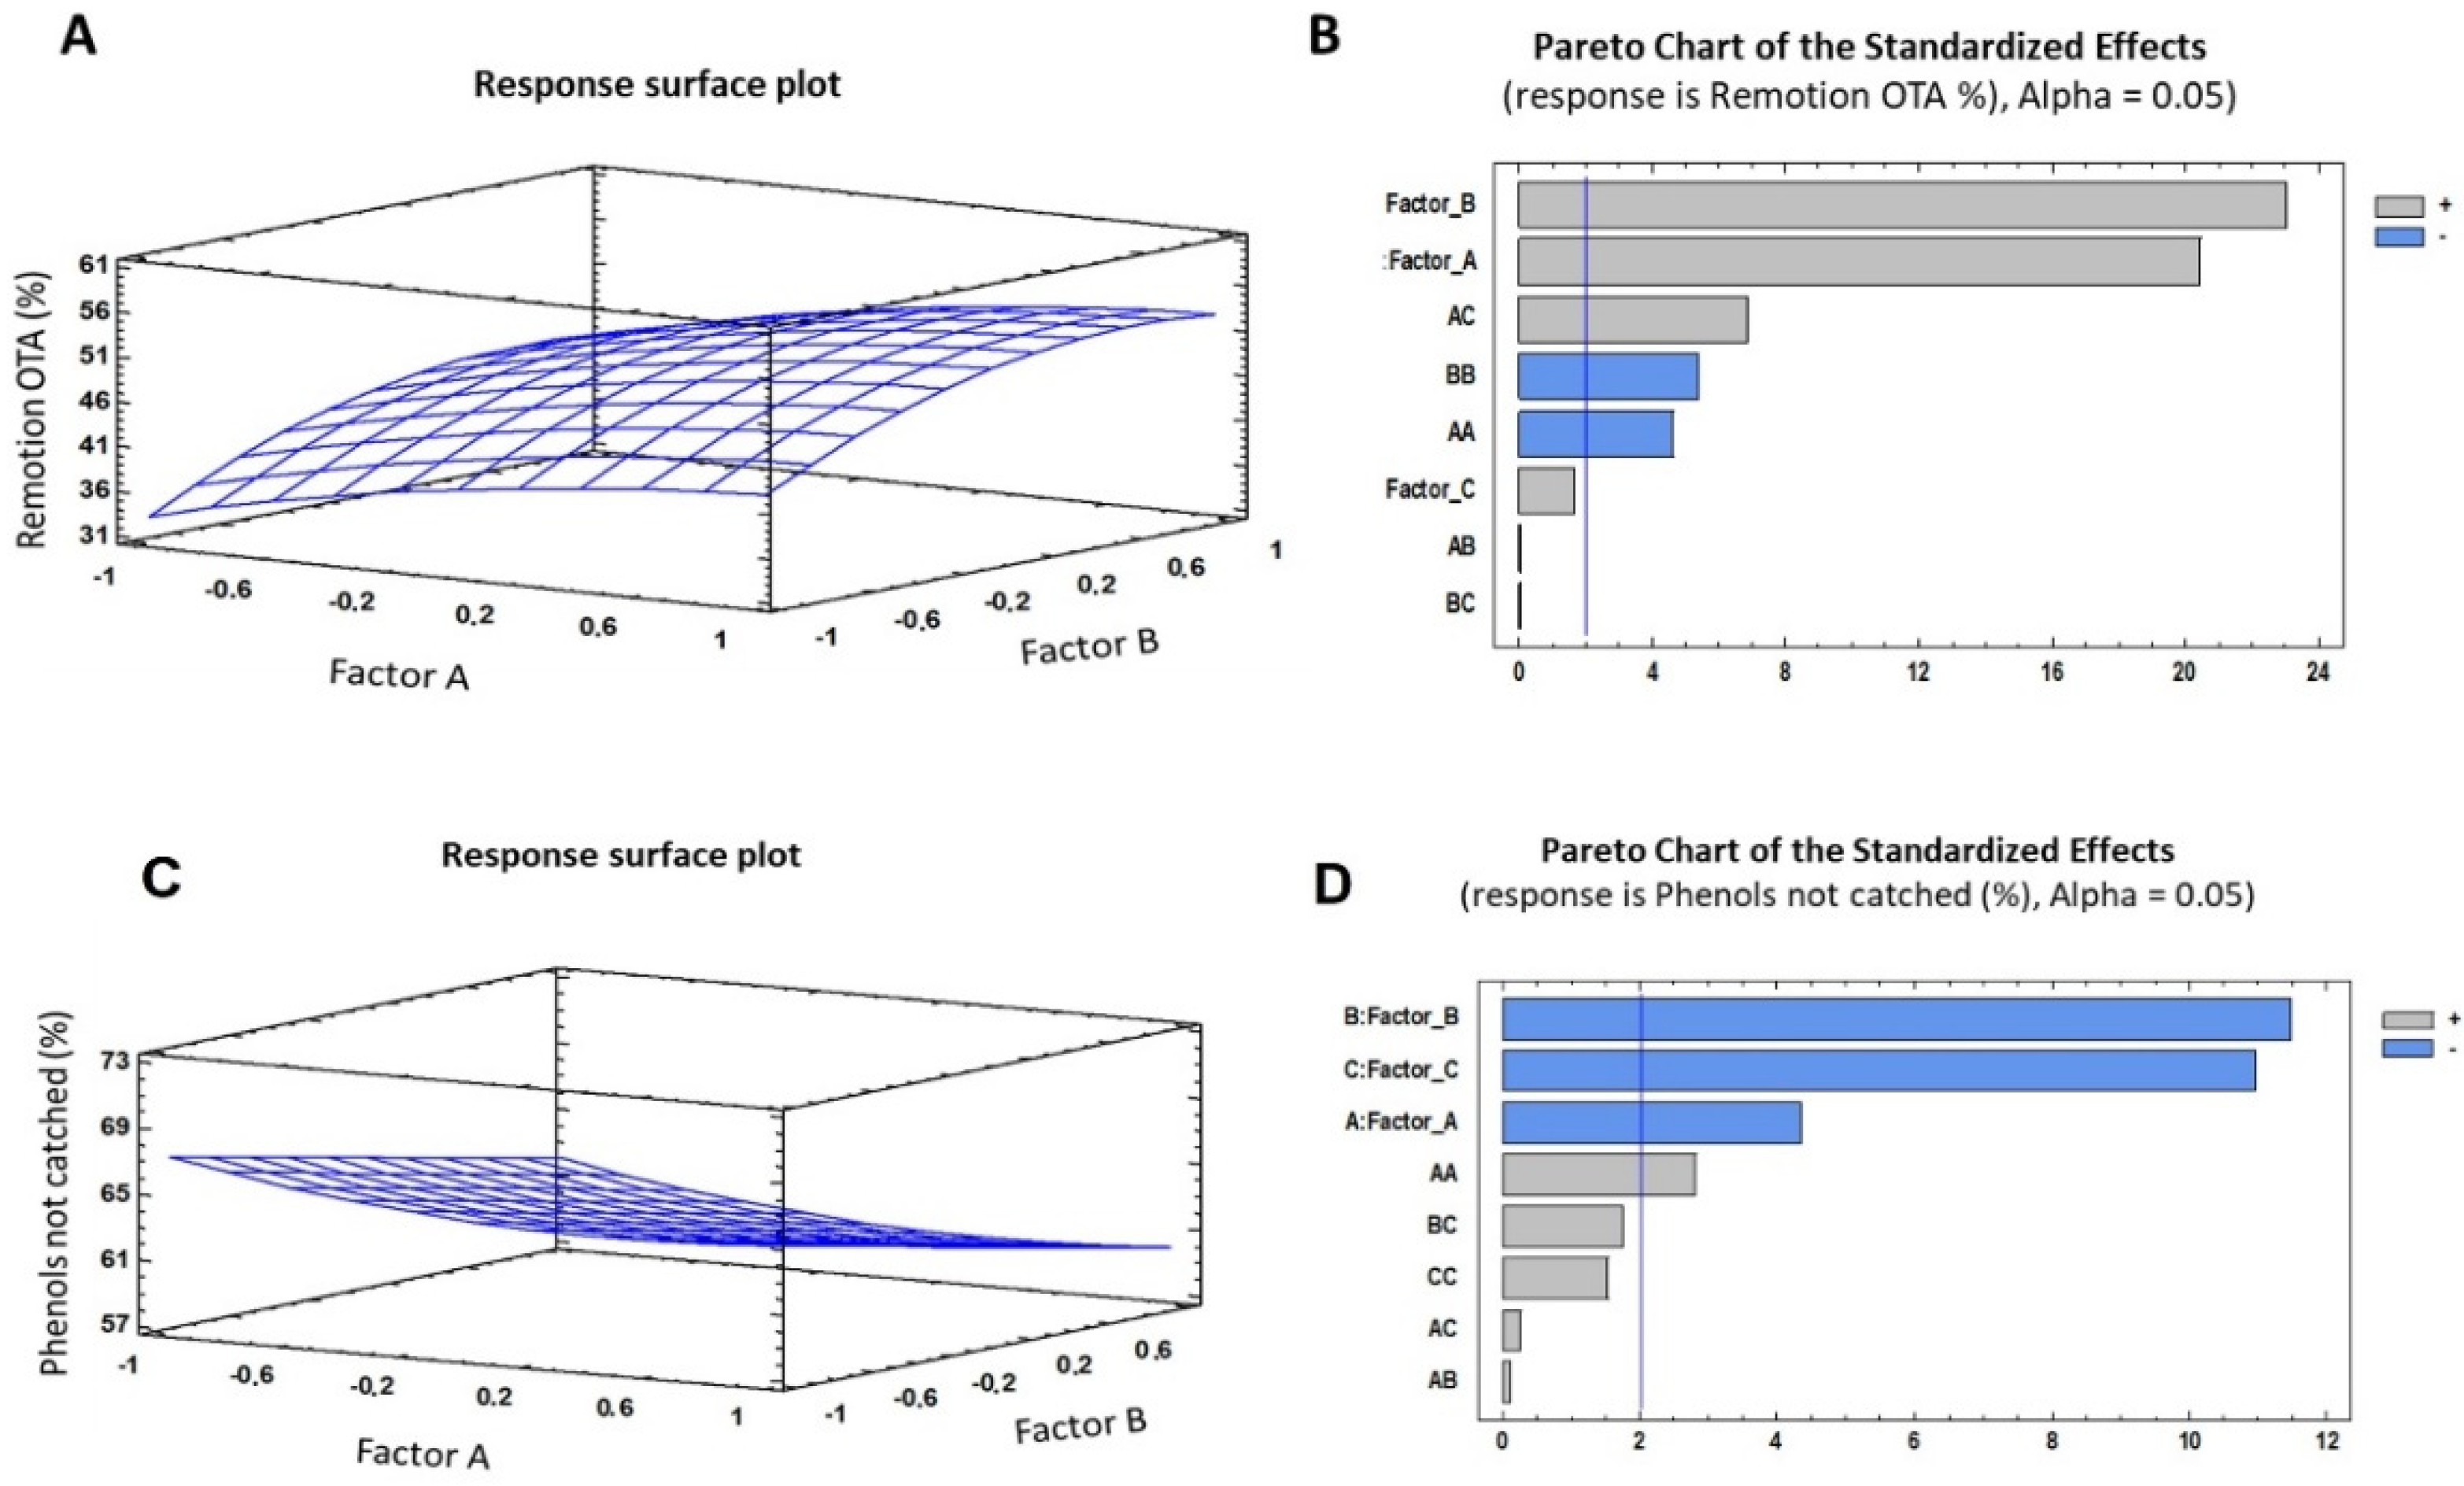
2.2.2. Optimization of OTA and Phenol Removal by APLP Complexes

An optimization assay was performed to determine the best microcapsule formation with affinity for OTA using a statistical model of 23 through a factorial analysis designed in the Statgraphics Centurium XVI program. The values obtained for OTA removal while phenols were not removed are shown in Table 2.
Regarding the OTA and phenol removal by the AP and APLP complexes, the analysis of the variance of the mathematical models obtained from the results yielded the coefficients of the response function for the dependent variables, which were determined using Statgraphics Centurium XVI. Table 3 shows the statistically significant factors, and the correlation of the models for the estimated responses.
For OTA, different response functions are described in Equation (1) for the response surface plot, which shows the complete regression model (R2 = 93.38; standard error = 1.349) obtained for the removal. Based on the regression coefficient, this model explained 93% of the responses observed in the assays.
O T A   r e m o v a l   ( % ) = 48.8701 + 4.744449 A + 5.17880 B + 0.317578 C     1.80774 A 2 + 0.0086863 A B + 1.54014 A C 3.98695 B 2 + 0.00683227   B
The analysis of the capture of phenols, expressed as non-captured phenols, was performed based on Equation (2) from the response surface plot, producing the complete regression model (R2 = 91.51; standard error = 1.239). Based on the regression coefficient, this model explained 92% of the responses observed in the assays.
P h e n o l s   n o t   c a t c h e d   ( % ) = 60.2384   0.996408   2.0083 B     2.8967 C   +   1.23333 A 2 + 0.52137 A B 0.31111 A C + 3.13105 B 2 + 0.385037   B C
The optimization for the capture of OTA and the conservation of the phenols in solution (Table 2) revealed the combination of the levels of the factors that maximized the responses for the parameters studied. For the capture and removal of OTA, it was found that the most important factors were time and concentration (Figure 5).
For L. plantarum, it is shown that its presence directly affects absorption, increasing the ability to remove OTA from wine by approximately 8%; these data agree with the studies reported by de Prete et al. (2007) [33], who studied different strains of Lactobacillus, which were capable of removing 8 to 28% of the OTA from wine depending on the strain. The theoretical analysis showed that an exposure time of 52 min was necessary to maximize the removal. These data are complemented by the thermograms (Figure 3), in which it was observed that the presence of LAB increased the system’s stability.
The mechanism by which lactic acid bacteria are capable of adsorbing OTA is believed to be the adsorption of these toxins to the surface structures of the cell wall, where peptidoglycan and exopolysaccharides would play an important role [34]. These interactions could be promoted by the hydrophobic properties of the cell wall and electron donor–acceptor and Lewis’s acid–base interactions [35].
Furthermore, the inclusion of LP in the complex facilitates OTA removal without significantly affecting phenol removal. Thus, for example, it was observed that the removal of phenols by the complex without LP at one hour of contact using AP−1 (PVA Mw ∼47,000) and AP-2 (PVA Mw ∼61,000) was 64.17 and 61.87, respectively; however, when BAL (APLP−1 and PLP-2) were added to the complexes, the removal of phenols only increased by 0.5% and 2.53%, respectively. Additionally, more thermally stable complexes were generated.
Finally, there is no doubt that the best strategy is the prevention of contamination of raw materials with fungi. However, to date, total management in the field is not possible, and removal strategies are an alternative to mitigate the final problem, as long as they go hand in hand with adequate detection strategies [36].

3. Conclusions

The APLP complexes were efficient in removing OTA from wines without substantially affecting their phenolic quality, and theoretically, a time of only 52 min was necessary to achieve the objective of removing over 50% of the OTA. Additionally, the presence of L. plantarum in the complexes increased the OTA-removal capacity without affecting the phenolic composition of the wine.
It should be considered that this was a screening study, and future studies should consider evaluating the removal of phenols individually to determine how this process affects each of them. Finally, the possibility of immobilizing lactic acid bacteria in polymeric matrices that are approved for use in the food industry is an important aspect to consider in advancing these strategies for removing mycotoxins from wines and obtaining safer beverages that do not cause damage to health.

4. Materials and Methods

4.1. Chemicals and Medium

Sodium alginate, mowiol™ 6-98 (PVA 6-98; polyvinylalcohol, Mw ∼47,000, 98% hydrolyzed), mowiol™ 10-98 (PVA 10-98; polyvinylalcohol, Mw ∼61,000, 98% hydrolyzed), calcium chloride anhydrous (CaCl2, ≥96.0%), gallic acid (≥95.0%), and boric acid (B(OH)3, ≥99.5%) were obtained from Sigma-Aldrich (St. Louis, MO, USA).
Glutardialdehyde (GA, 50% solution in water), absolute ethanol, L(+)-tartaric acid (≥99.5%), sodium hydroxide (NaOH, ≥99%), chloride acid (HCl), De Man Rogosa Sharpe (MRS) medium, solvents for HPLC analysis of chromatographic grade (ultra-pure water, H2O; acetonitrile, ACN; acetic acid, CH3COOH), Folin-Ciocalteu’s phenol reagent (≥99.5%; 2 N), and PTFE membrane filters (0.45 µm) were purchased from Merck KGaA (Darmstadt, Germany). Deionized water from a Millipore Milli-Q-P Plus system was used for preparing the aqueous solutions and for HPLC analysis.
QuEChERS extraction kits (salts—1 g of sodium citrate, 0.5 g of disodium citrate sesquihydrate, 4 g of magnesium sulfate (MgSO4), and 1 g of sodium chloride—and dispersive solid-phase extraction tubes, 900 mg of MgSO4, and 150 mg of primary secondary amine (PSA) sorbent) were purchased from Agilent Technologies (Santa Clara, CA, USA).
Ochratoxin A (from Petromyces alberiensis, ≥98%), was obtained from Sigma-Aldrich (St. Louis, MO, USA), and the stock solution (1 mg mL−1 in absolute ethanol) was stored at −20 °C.

4.2. Bacterial Strain and Culture Condition

The Lactobacillus plantarum 299v (LP) strain was obtained commercially from BION, Merck. Prior to use, the LP was stored frozen in MRS broth with 15% (v/v) glycerol. For testing, the LP were activated in MRS broth under incubation at 37 °C for 24 h in a 5% CO2 incubator, subculturing in MRS agar. Then, to obtain wet cells, L. plantarum were incubated in 500 mL Erlenmeyer flasks containing 300 mL of MRS broth at 37 °C in anaerobic conditions. After incubation for 24 h, the wet cells were collected by centrifugation at 10,000 rpm at 4 °C for 10 min [37], and the cell pellet was collected and immediately washed thrice with 0.9% sterilized sodium chloride solution [22].

4.3. Immobilization of L. plantarum in Alginate-PVA and Bacterial Delivery Assay

Alginate–PVA–L. plantarum (APLP) complexes were prepared according to the modified methodologies used by Long et al. (2004) [29] and Many et al. (2019) [38]. First, a 2% alginate (Alg) solution with 5% PVA (Mw ∼47,000 or ∼61,000) was prepared by dissolving alginate in hot distilled water and autoclaving it at 121 °C for 15 min. Then, the cell suspension containing wet cells (1 or 2 g) was added to 100 mL of Alg–PVA (AP) solution and stirred for 10 min to produce a homogeneous slurry. The mixture obtained was taken into a sterile syringe and extruded dropwise into a sterile solution composed of 10% boric acid and 2% CaCl2 (crosslinking agent) to form complexes. In order to complete the gelation, these complexes were kept in a 5% BA solution for 24 h at 4 °C. Finally, the complexes were removed and washed with distilled water. The formulation of the synthesized complexes is detailed in Table 1.
In order to determine the bacteria released from the polymeric matrix, 1 g of APLP−1 and APLP-2 complexes with 1 mL of a model wine solution (consisting of 12.5% ethanol solution (v/v), adjusted to pH 3.5 using tartaric acid (5.0 g L−1) and a 1 mM solution of sodium hydroxide) were put in contact during 60 min. After that contact time, serial dilutions were made and seeded on count agar plates to count colonies.

4.4. Complex Characterization for Thermal Analysis by Thermogravimetry (TGA)

The alginate, AP−1, AP-2, APLP−1, and APLP-2 complexes were characterized using a thermogravimetric analyzer: STD 650 TA-instruments. The samples were heated at a constant heating rate of 10 °C min−1. Heating from room temperature to 900 °C was realized in air, a reactive gas, with a mass flow of 50 mL min−1. Additionally, N2 (50 mL min−1) was used as a protection gas in the electronic balance. A 5 mg amount of the mixture was placed into a Pt crucible for each analysis.

4.5. OTA Removal from Red Wines by AP and APLP Complexes

The first OTA-removal assay was carried out to determine the concentration of complexes that would allow at least 50% of the OTA to be removed without the total phenol concentration being substantially impaired. For this, 0.25, 0.5, and 1.0 g of AP−1, AP-2, APLP−1, and APLP-2 were weighed into 12 mL glass tubes; then, 1.0 mL of red wine (Cabernet Sauvignon 2019, OTA free), spiked with 5000 ng L−1 of OTA, was added. The samples were mixed and agitated for 60 min at room temperature (20 °C), using a rock motion agitator, operating at 100 rpm. Then, the complexes and wines were separated, and the concentration of free OTA in the red wine was analyzed (see Section 4.6).
For the second OTA-removal assay, a factorial design (33) with two variables and three levels was established. Runs were performed randomly to optimize the time, bacterial concentration, and molecular weight for the PVA. The nine designed experiments were carried out in triplicate; the experimental factors (uncoded units) were transformed into coded units and coded as −1, 0, and +1. The response was expressed as the percentage of OTA removal. The data were analyzed by the analysis of variance (ANOVA), with a significance level of 95% (p ≤ 0.05).
For this, 0.5 g of each complex (Table 1) was weighed into 12 mL glass tubes, followed by adding 1.0 mL of red wine (Cabernet Sauvignon 2019, OTA free), spiked with 5000 ng L−1 of OTA. The samples were mixed and agitated for different times (15, 30, and 60 min) at room temperature (20 °C, 100 rpm). Then, the complexes and wines were separated, and the concentration of free OTA in the red wine was analyzed (see Section 4.6). The controls used were control 1 (1% LP), control 2 (2% LP), control 3 (Alg complex), control 4 (Alg–1% LP complex), and control 5 (Alg–2% LP complex).
In addition to the OTA analyses, the total phenolic concentration was determined using the Folin–Ciocalteu method [39], using a Spectroquant Pharo 300 UV–Visible spectrophotometer. The total phenolic concentration was estimated based on a standard curve of gallic acid (0–500 mg L−1).

4.6. Analysis of OTA

4.6.1. OTA Extraction and Purification from Red Wine

For extraction and purification of the OTA from the wine, we used the methodology used by Carrasco-Sánchez et al. (2018) [40]. Briefly, 1 mL of red wine samples were extracted and partitioned with 2 mL of acetonitrile/acetic acid (99/1) and 0.5 g of QuEChERS extraction salts. The mixture was stirred (10 s) and centrifuged at 1500× g for 5 min. Then, the supernatant was extracted and cleaned using 900 mg of MgSO4 and 150 mg of PSA sorbent. The mixture was then stirred and centrifuged for 2 min at 1500× g, and the supernatant was filtered through PTFE membrane filters (0.45 µm), prior to OTA analysis by high-performance liquid chromatography with a fluorescence detector (HPLC-FLD).

4.6.2. Analysis of OTA by HPLC-FLD

The OTA concentrations in the extracts obtained from the red wine samples were analyzed using an HPLC-FLD system (Agilent Technologies 1260 Infinity) equipped with a quaternary pump and autosampler. The separation was performed using a reverse-phase LiChrocart® 250-4 RP−18 (250 mm × 4 mm ID × 5 μm) column (Merck), under the following conditions: a mobile phase consisting of H2O:ACN:CH3COOH (49.5:49.5:1, v/v), operated in isocratic mode, at a flow rate of 0.9 mL min−1. The injection volume was 40 μL, and the analyte detection was performed at Ex: 334 nm and Em: 460 nm [40].

Author Contributions

Conceptualization, V.C.-S.; methodology, V.C.-S., V.F.L., C.P. and R.I.C.; software, R.I.C.; formal analysis, V.C.-S., V.F.L., C.P. and R.I.C.; resources, V.C.-S.; writing—original draft preparation, V.C.-S. and R.I.C.; writing—review and editing, V.C.-S. All authors have read and agreed to the published version of the manuscript.

Funding

This research was funded by ANID/FONDECYT N° 11181303.

Institutional Review Board Statement

Not applicable.

Informed Consent Statement

Not applicable.

Data Availability Statement

Not applicable.

Conflicts of Interest

The authors declare no conflict of interest.

References

  1. Amezqueta, S.; Schorr-Galindo, S.; Murillo-Arbizu, M.; Gonzalez-Peñas, E.; De Cerain, A.L.; Guiraud, J. OTA-producing fungi in foodstuffs: A review. Food Control 2012, 26, 259–268. [Google Scholar] [CrossRef] [Green Version]
  2. Ortiz-Villeda, B.; Lobos, O.; Aguilar-Zuniga, K.; Carrasco-Sánchez, V. Ochratoxins in wines: A review of their occurrence in the last decade, toxicity, and exposure risk in humans. Toxins 2021, 13, 478. [Google Scholar] [CrossRef] [PubMed]
  3. Var, I.; Erginkaya, Z.; Kabak, B. Reduction of ochratoxin A levels in white wine by yeast treatments. J. Inst. Brew. 2009, 115, 30–34. [Google Scholar] [CrossRef]
  4. Zimmerli, B.; Dick, R. Ochratoxin A in table wine and grape-juice: Occurrence and risk assessment. Food Addit. Contam. 1996, 13, 655–668. [Google Scholar] [CrossRef]
  5. Lasram, S.; Mani, A.; Zaied, C.; Chebil, S.; Abid, S.; Bacha, H.; Mliki, A.; Ghorbel, A. Evolution of ochratoxin A content during red and rose vinification. J. Sci. Food Agric. 2008, 88, 1696–1703. [Google Scholar] [CrossRef]
  6. Abrunhosa, L.; Fernandes, A.; Venâncio, A. Ochratoxin Aremoval during the main steps of wine making. In Proceedings of the 7 Encontro de Qu’ımica dos Alimentos, Viseu, Portugal, 13–16 April 2005; ESAV-IPV/SPQ: Viseu, Portugal, 2005. [Google Scholar]
  7. Dachery, B.; Veras, F.F.; Dal Magro, L.; Manfroi, V.; Welke, J.E. Exposure risk assessment to ochratoxin A through consumption of juice and wine considering the effect of steam extraction time and vinification stages. Food Chem. Toxicol. 2017, 109, 237–244. [Google Scholar] [CrossRef]
  8. Malir, F.; Louda, M.; Ostry, V.; Toman, J.; Ali, N.; Grosse, Y.; Malirova, E.; Pacovsky, J.; Pickova, D.; Brodak, M. Analyses of biomarkers of exposure to nephrotoxic mycotoxins in a cohort of patients with renal tumours. Mycotoxin Res. 2019, 35, 391–403. [Google Scholar] [CrossRef]
  9. Castegnaro, M.; Canadas, D.; Vrabcheva, T.; Petkova-Bocharova, T.; Chernozemsky, I.N.; Pfohl-Leszkowicz, A. Balkan endemic nephropathy: Role of ochratoxins A through biomarkers. Mol. Nutr. Food Res. 2006, 50, 519–529. [Google Scholar] [CrossRef]
  10. Pfohl-Leszkowicz, A.; Manderville, R.A. Ochratoxin A: An overview on toxicity and carcinogenicity in animals and humans. Mol. Nutr. Food Res. 2007, 51, 61–99. [Google Scholar] [CrossRef]
  11. European Commission. Commission Regulation (EC) No 123/2005 of 26 January 2005 amending regulation (EC) No 466/2001 as regards ochratoxin A. Off. J. Eur. Union 2005, 25, 3–5. [Google Scholar]
  12. European Commission. Commission Regulation EC No 1881/2006 Setting Maximum Levels for Certain Contaminants in Foodstuffs. Available online: https://eur-lex.europa.eu/legal-content/EN/TXT/PDF/?uri=CELEX:32006R0401&from=ES (accessed on 16 June 2021).
  13. Solfrizzo, M.D.; Avantaggiato, G.; Panzarini, G.; Visconti, A. Removal of ochratoxin A from contaminated red wines by repassage over grape pomaces. J. Agric. Food Chem. 2010, 58, 317–323. [Google Scholar] [CrossRef] [PubMed]
  14. Castellari, M.; Versari, A.; Fabiani, A.; Parpinello, G.P.; Galassi, S. Removal of ochratoxin A in red wines by means of adsorption treatments with commercial fining agents. J. Agric. Food Chem. 2001, 49, 3917–3921. [Google Scholar] [CrossRef] [PubMed]
  15. Quintela, S.; Villarán, M.C.; López de Armentia, I.; Elejalde, E. Ochratoxin A removal in red wine by several oenological fining agents: Bentonite, egg albumin, allergen free adsorbents, chitin and chitosan. Food Addit. Contam. 2012, 29, 1168–1174. [Google Scholar] [CrossRef] [PubMed]
  16. Piotrowska, M.; Nowak, A.; Czyzowska, A. Removal of ochratoxin A by wine Saccharomyces cerevisiae strains. Eur. Food Res. Technol. 2013, 236, 441–447. [Google Scholar] [CrossRef] [Green Version]
  17. El-Nezami, H.; Kankaanpaa, P.; Salminen, S.; Ahokas, J. Ability of dairy strains of lactic acid bacteria to bind a common food carcinogen, aflatoxin B1. Food Chem. Toxicol. 1998, 36, 321–326. [Google Scholar] [CrossRef]
  18. Pierides, M.; El-Nezami, H.; Peltonen, K.; Salminen, S.; Ahokas, J. Ability of dairy strains of lactic acid bacteria to bind aflatoxin M1 in a food model. J. Food Protect. 2000, 63, 645–650. [Google Scholar] [CrossRef]
  19. Turbic, A.; Ahokas, J.T.; Haskard, C.A. Selective in vitro binding of dietary mutagens, individually or in combination, by lactic acid bacteria. Food Addit. Contam. 2002, 19, 144–152. [Google Scholar] [CrossRef]
  20. Kabak, B.; Var, I. Binding of aflatoxin M1 by Lactobacillus and Bifidobacterium strains. Milchwissenschaft 2004, 59, 301–303. [Google Scholar]
  21. Khattab, A.A.; Ibrahim, M.I.M.; El-Kady, A.A. Ochratoxin A biosorption onto genetically improved of Lactobacillus delbrueckii mutants. Int. Food. Res. J. 2018, 25, 515–522. [Google Scholar]
  22. Liu, J.; Pan, D.; Wu, X.; Chen, H.; Cao, H.; Li, Q.X.; Hua, R. Enhanced degradation of prometryn and other s-triazine herbicides in pure cultures and wastewater by polyvinyl alcohol-sodium alginate immobilized Leucobacter sp. JW-1. Sci. Total Environ. 2018, 615, 78–86. [Google Scholar] [CrossRef]
  23. Kumar, S.S.; Kumar, M.S.; Siddavattam, D.; Karegoudar, T.B. Generation of continuous packed bed reactor with PVA-alginate blend immobilized Ochrobactrum sp. DGVK1 cells for effective removal of N,N-dimethylformamide from industrial effluents. J. Hazard. Mater. 2012, 199, 58–63. [Google Scholar] [CrossRef] [PubMed]
  24. Farbo, M.G.; Urgeghea, P.P.; Fioria, S.; Marceddu, S.; Jaoua, S.; Migheli, Q. Adsorption of ochratoxin A from grape juice by yeast cells immobilised in calcium alginate beads. Int. J. Food Microbiol. 2016, 217, 29–34. [Google Scholar] [CrossRef]
  25. Shibayama, M.; Sato, M.; Kimura, Y.; Fujiwara, H.; Nomura, S. 11B n.m.r. study on the reaction of poly(vinyl alcohol) with boric acid. Polymer 1988, 29, 336–340. [Google Scholar] [CrossRef]
  26. Hansen, E.W.; Holm, K.H.; Jahr, D.M.; Olafsen, K.; Stori, A. Reaction of poly(vinyl alcohol) and dialdehydes during gel formation probed by 1H n.m.r.—A kinetic study. Polymer 1997, 38, 4863–4871. [Google Scholar] [CrossRef]
  27. Yoon, J.; Oh, D.X.; Jo, C.; Lee, J.; Hwang, D.S. Improvement of desolvation and resilience of alginate binders for Si-based anodes in a lithium ion battery by calcium-mediated cross-linking. Phys. Chem. Chem. Phys. 2014, 16, 25628–25635. [Google Scholar] [CrossRef] [PubMed] [Green Version]
  28. Hu, C.; Lu, W.; Mata, A.; Nishinari, K.; Fang, Y. Ions-induced gelation of alginate: Mechanisms and applications. Int. J. Biol. Macromol. 2021, 177, 578–588. [Google Scholar] [CrossRef] [PubMed]
  29. Long, Z.; Huang, Y.; Cai, Z.; Cong, W.; Ouyang, F. Immobilization of Acidithiobacillus ferrooxidans by a PVA–boric acid method for ferrous sulphate oxidation. Process Biochem. 2004, 39, 2129–2133. [Google Scholar] [CrossRef]
  30. Castro, R.I.; Morales-Quintana, L.; Alvarado, N.; Guzmán, L.; Forero-Doria, O.; Valenzuela-Riffo, F.; Laurie, V.F. Design and optimization of a self-assembling complex based on microencapsulated calcium alginate and glutathione (CAG) using response surface methodology. Polymers 2021, 13, 2080. [Google Scholar] [CrossRef]
  31. Rodríguez, Y.A.N.; Castro, R.I.; Arenas, F.A.; López-Cabaña, Z.E.; Carreño, G.; Carrasco-Sánchez, V.; Marican, A.; Villaseñor, J.; Vargas, E.; Santos, L.S.; et al. Preparation of Hydrogel/silver nanohybrids mediated by tunable-size silver nanoparticles for potential antibacterial applications. Polymers 2019, 11, 716. [Google Scholar] [CrossRef] [Green Version]
  32. Chen, J.; Yang, Z.; Shi, D.; Zhou, T.; Kaneko, D.; Chen, M. High strength and toughness of double physically cross-linked hydrogels composed of polyvinyl alcohol and calcium alginate. J. Appl. Polym. Sci. 2021, 138, 49987. [Google Scholar] [CrossRef]
  33. Del Prete, V.; Rodriguez, H.; Carrascosa, A.V.; de las Rivas, B.; Garcia-Moruno, E.; Munoz, R. In vitro removal of ochratoxin a by wine lactic acid bacteria. J. Food. Prot. 2007, 70, 2155–2160. [Google Scholar] [CrossRef] [PubMed]
  34. Perczak, A.; Golinski, P.; Bryla, M.; Waskiewicz, A. The efficiency of lactic acid bacteria against pathogenic fungi and mycotoxins. Arh. Hig. Rada. Toksikol. 2018, 69, 32–45. [Google Scholar] [CrossRef] [PubMed] [Green Version]
  35. Piotrowska, M. The adsorption of ohratoxin A by Lactobacillus Species. Toxins 2014, 6, 2826–2839. [Google Scholar] [CrossRef] [PubMed] [Green Version]
  36. Nekrasov, N.; Jaric, S.; Kireev, D.; Emelianov, A.V.; Orlov, A.V.; Gadjanski, I.; Nikitin, P.I.; Akinwande, D.; Bobrinetskiy, I. Real-time detection of ochratoxin A in wine through insight of aptamer conformation in conjunction with graphene field-effect transistor. Biosen. Bioelectron. 2022, 200, 113890. [Google Scholar] [CrossRef]
  37. Sangsila, A.; Faucet-Marquis, V.; Pfohl-Leszkowicz, A.; Itsaranuwat, P. Detoxification of zearalenone by Lactobacillus pentosus strains. Food Control. 2016, 62, 187–192. [Google Scholar] [CrossRef]
  38. Many, D.A.; Ibrahim, A.S.S.; El-Diwany, A.I. Biosynthesis of alkaline protease by alkaliphilic Bacillus sp. NPST-AK15 cells immobilized in gel matrices. Egypt. Pharm. J. 2019, 18, 201–207. [Google Scholar] [CrossRef]
  39. Waterhouse, A.L. Determination of total phenolics. Curr. Protoc. Food Anal. Chem. 2002, 6, I1.1.1–I1.1.8. [Google Scholar]
  40. Carrasco-Sánchez, V.; Marican, A.; Vergara-Jaque, A.; Folch-Cano, C.; Comer, J.; Laurie, V.F. Polymeric substances for the removal of ochratoxin A from red wine followed by computational modeling of the complexes formed. Food Chem. 2018, 265, 159–164. [Google Scholar] [CrossRef]
Figure 1. Macroscopic structure of (A) alginate, and (B) APLP complexes.
Toxins 14 00230 g001
Figure 2. (A) APLP complex; (B1) formation of hemiacetal; (B2) PVA crosslinked with glutaraldehyde; (C) gelation mechanism known as an egg-box model; (D1) formation of PVA–BA complex; and (D2) hydrogen bonding between the diol complex and PVA.
Toxins 14 00230 g002
Figure 3. Thermal gravimetry curves of Alginate (Alg), AP−1, AP-2, APLP−1, and APLP-2 complexes.
Toxins 14 00230 g003
Figure 4. Influence of complex concentration on removal of (A) OTA and (B) phenols.
Toxins 14 00230 g004
Figure 5. (A,C) Graphics for the estimated response surface for OTA removal (%) and phenols unremoved respectively; (B,D) Standardized Pareto chart for OTA removal (%), and phenols unremoved. Factor A: LP concentration, Factor B: Exposition time (min), and Factor C: Molecular weight of PVA. Blue line represents critical t-value, 95% confidence.
Toxins 14 00230 g005
Table 1. Formulation of AP and APLP complexes.
ComplexesPVALP Concentration in Wet Weight
AP−15% Mowiol 6–98-
APLP−15% Mowiol 6–981%
APLP−1b5% Mowiol 6–982%
AP-25% Mowiol 10–98-
APLP-25% Mowiol 10–981%
APLP-2b5% Mowiol 10–982%
Note: AP: Alginate-PVA; APLP: Alginate-PVA-L. plantarum.
Table 2. Matrix of the experimental design for the variables; coded and uncoded values of the factors.
UncodifiedCodifiedResults
ComplexesPVA (Mw)LAB (%)Time (min)Mw PVA% LABContact TimeOTA Removal (%)Unremoved Phenols (%)
AP−147,000015−1−1−132.22 ± 0.7172.23 ± 0.61
APLP−147,000115−10−138.99 ± 0.1267.50 ± 1.65
APLP−1b47,000215−11−140.40 ± 0.7968.13 ± 1.20
AP-261,0000151−1−133.94 ± 0.4364.53 ± 0.49
APLP-261,00011510−140.52 ± 0.5362.40 ± 1.41
APLP-2b61,00021511−144.92 ± 0.3162.41 ± 0.78
AP−147,000030−1−1−0.6639.46 ± 0.2867.73 ± 0.97
APLP−147,000130−10−0.6645.45 ± 0.4467.23 ± 1.26
APLP−1b47,000230−11−0.6645.25 ± 0.2666.43 ± 2.29
AP-261,0000301−1−0.6634.69 ± 0.2962.90 ± 0.70
APLP-261,00013010−0.6642.62 ± 0.4059.17 ± 0.60
APLP-2b61,00023011−0.6647.59 ± 0.3659.03 ± 0.57
AP−147,000060−1−1145.64 ± 0.1164.17 ± 0.45
APLP−147,000160−10148.48 ± 0.3865.03 ± 0.64
APLP−1b47,000260−11150.87 ± 0.6564.77 ± 0.51
AP-261,0000601−1141.71 ± 0.8261.83 ± 1.12
APLP-261,00016010150.91 ± 0.6858.00 ± 0.46
APLP-2b61,00026011155.53 ± 0.7959.30 ± 0.82
Table 3. Analysis of variance (ANOVA) from mathematical model for OTA removal and Phenols unremoved in wines.
SourceSum of SquaresDegree’s LibertyMean SquareRazon-FValor-P
OTA
removal
A: Factor A762.0571762.057418.340.0000
B: Factor B965.551965.55530.050.0000
C: Factor C5.1215415.121542.810.1008
AA39.215139.21521.530.0000
AB0.0020738210.002073820.000.9732
AC85.3931185.393146.880.0000
BB53.0585153.058529.130.0000
BC0.0019244810.001924480.000.9742
Blocks0.098173920.04908690.030.9734
Total error78.3301431.82163
Unremoved phenolsA: Factor A33.611133.61121.860.0000
B: Factor B145.2031145.20394.450.0000
C: Factor C426.1161426.116277.170.0000
AA18.2533118.253311.870.0013
AB7.4713617.471364.860.0329
AC3.4844413.484442.270.1395
BB32.7231132,723121.280.0000
BC6.1120816.112083.980.0525
Blocks4.7777822.388891.550.2231
Total error66.108431.5374
Publisher’s Note: MDPI stays neutral with regard to jurisdictional claims in published maps and institutional affiliations.

