Article

Crystal Structures of Botulinum Neurotoxin Subtypes A4 and A5 Cell Binding Domains in Complex with Receptor Ganglioside

1
Department of Biology and Biochemistry, University of Bath, Claverton Down, Bath BA2 7AY, UK
2
Protein Sciences Department, Ipsen Bioinnovation Limited, 102 Park Drive, Milton Park, Abingdon OX14 4RY, UK
*
Author to whom correspondence should be addressed.
Toxins 2022, 14(2), 129; https://doi.org/10.3390/toxins14020129
Submission received: 7 January 2022 / Revised: 2 February 2022 / Accepted: 5 February 2022 / Published: 8 February 2022
(This article belongs to the Special Issue Structure and Function of Clostridial and Botulinum-Like Neurotoxins)

Abstract

:
Botulinum neurotoxins (BoNT) cause the potentially fatal neuroparalytic disease botulism that arises due to proteolysis of a SNARE protein. Each BoNT is comprised of three domains: a cell binding domain (HC), a translocation domain (HN), and a catalytic (Zn2+ endopeptidase) domain (LC). The HC is responsible for neuronal specificity by targeting both a protein and ganglioside receptor at the neuromuscular junction. Although highly toxic, some BoNTs are commercially available as therapeutics for the treatment of a range of neuromuscular conditions. Here we present the crystal structures of two BoNT cell binding domains, HC/A4 and HC/A5, in a complex with the oligosaccharide of ganglioside, GD1a and GM1b, respectively. These structures, along with a detailed comparison with the previously reported apo-structures, reveal the conformational changes that occur upon ganglioside binding and the interactions involved.
Key Contribution: Botulinum neurotoxin type A is a therapeutically important BoNT serotype. Crystal structures of both BoNT/A4 and /A5 in a complex with GD1a and GM1b gangliosides, respectively, reveal the residues involved in binding and the conformational changes that occur upon binding.

1. Introduction

Botulinum neurotoxin serotype A (BoNT/A) is produced by anaerobic spore forming bacteria, Clostridium botulinum, and, along with other serotypes, is responsible for the disease botulism—a neuromuscular condition that causes flaccid paralysis and can lead to death by asphyxiation if left untreated [1]. The exquisite toxicity of BoNT/A makes it one of the deadliest agents known to humankind [2]; however, at miniscule doses, they can be used as a therapeutic to treat a range of diseases associated with hyper-muscular and -glandular activity [3]. The toxin is post-translationally cleaved to form an active di-chain, comprised of a 50 kDa light chain (LC) and a 100 kDa heavy chain (HC) linked by a disulphide bond. The HC can be further divided into an N-terminal translocation domain (HN) and a C-terminal cell binding domain (HC) [4]. The mechanism of intoxication involves three general steps [5]: highly specific targeting to the neuromuscular junction by dual-receptor recognition of both a protein and ganglioside receptor by the HC domain, resulting in endocytic internalisation into an endosome [6]; pH-mediated conformational change of the HN domain that translocates the LC into the cytosol [7,8,9]; and a Zn2+-dependent endopeptidase cleavage of a soluble N-ethylmaleimide-sensitive factor attachment protein receptor (SNARE) protein by the LC [10]. This cleavage prevents vesicular fusion to the cell membrane, halting the release of presynaptic acetylcholine, and the progression of synaptic signalling at the neuromuscular junction [11].
There are many different types of BoNT and BoNT-like molecules that are categorised by sequence similarity, serological activity, and/or host source. BoNTs produced by Clostridia are categorised into serotypes /A to /G, and /X, whereas the BoNT-like molecules by non-Clostridia include BoNT/Wo (Weissella oryzae) [12], BoNT/En (Enterococcus faecium) [13], and PMP1 (Paraclostridium bifermentans) [14]. Some serotypes exist naturally as mosaics (e.g., BoNT/CD, BoNT/DC, and BoNT/FA), whereas other serotypes are divided into subtypes (e.g., BoNT/A1-/A8, /B1-/B8, /E1-/E12, /F1-/F9) due to subtle variations in amino acid sequence [15,16]. Although these subtypes arise due to only minor changes in their amino acid sequence, the toxicity of subtypes has been shown to vary significantly [17,18,19,20]. All serotypes require recognition of both a protein (Synaptic vesicle protein 2 in BoNT/A) and ganglioside receptor to initiate endocytosis, except for BoNT/C which binds to two gangliosides. Gangliosides are glycosphingolipids that are often involved in cellular-signalling pathways and are comprised of a membrane anchored hydrophilic lipid tail, and an extracellular oligosaccharide moiety [21]. Previous studies have reported the structures of the binding domain of BoNT/A1 (HC/A1) and BoNT/A3 (HC/A3) in complex with the receptor ganglioside GD1a [22,23], detailing the interactions that occur between the two. These structures reveal that the ganglioside binding site (GBS) is formed by a β-hairpin and loop in the C-terminal subdomain of HC (HCC).
We have previously reported the crystal structures of HC/A4 [24] and HC/A5 [25], and now present the crystal structures of HC/A4 in complex with GD1a, and HC/A5 in complex with GM1b, and highlight the interactions and structural changes that occur upon ganglioside binding. The structural information revealed in this report may aid in the development of future BoNT therapeutics.

2. Results and Discussion

2.1. Structure of HC/A4 in Complex with GD1a Oligosaccharide

The structure of the HC/A4:GD1a complex was solved to 2.3 Å by molecular replacement using the unbound HC/A4 structure (PDB: 6F0P) [24] as a search model. Two molecules (designated A and B) were present in the asymmetric unit (ASU) (Table 1). The overall quality of the electron density map was good with better density for molecule A (residues 994-999, 1029-1032,1047-1053, 1172-1174, and 1232-1239 could not be modelled for molecule B). Consequently, all subsequent analyses below involved molecule A. An initial inspection of the map revealed large positive electron density at the expected GBS, which indicated that GD1a had bound. Monosaccharides Sia5-Gal2 could be modelled with no ambiguity into the electron density (Figure 1A) and Glc1 partially, but there was insufficient electron density to model Sia6. A total of nine hydrogen bonding interactions were present between HC/A4 and GD1a (Figure 1B) (Table 2)—there was clear electron density for the two terminal nitrogen atoms of Arg 1282 which interact with Sia5 and Gln 1276.
The crystal packing of HC/A4 changes significantly upon binding of GD1a as evidenced by the change in both unit cell dimensions and space group. Although there is minimal overall conformational change between HC/A4:GD1a with HC/A4 alone (RMSD of 0.88 Å for all Cα atoms); there is a noticeable change in the relative position of the HCN and HCC subdomains when compared to the unbound structure (RMSD of 0.6 and 0.5 Å, respectively, for all Cα atoms after individual subdomain superimposition). Therefore, upon ganglioside binding, the two subdomains appear to rotate apart like an opening hinge (Figure 2A). There is also a noticeable conformational change to the loop spanning residues 933-946 within the HCN subdomain (Figure 2A) that may be attributed to different crystal packing in the unbound structure.
Inspection of the HC/A4:GD1a GBS residues revealed changes in the relative position of the side chains compared to HC/A4 alone; most notably Arg 1282 (which adopts two conformations in the unbound structure) and Tyr 1123. Upon GD1a binding, these residues shift to form a hydrogen bonding interaction with Sia5 (Figure 2B).

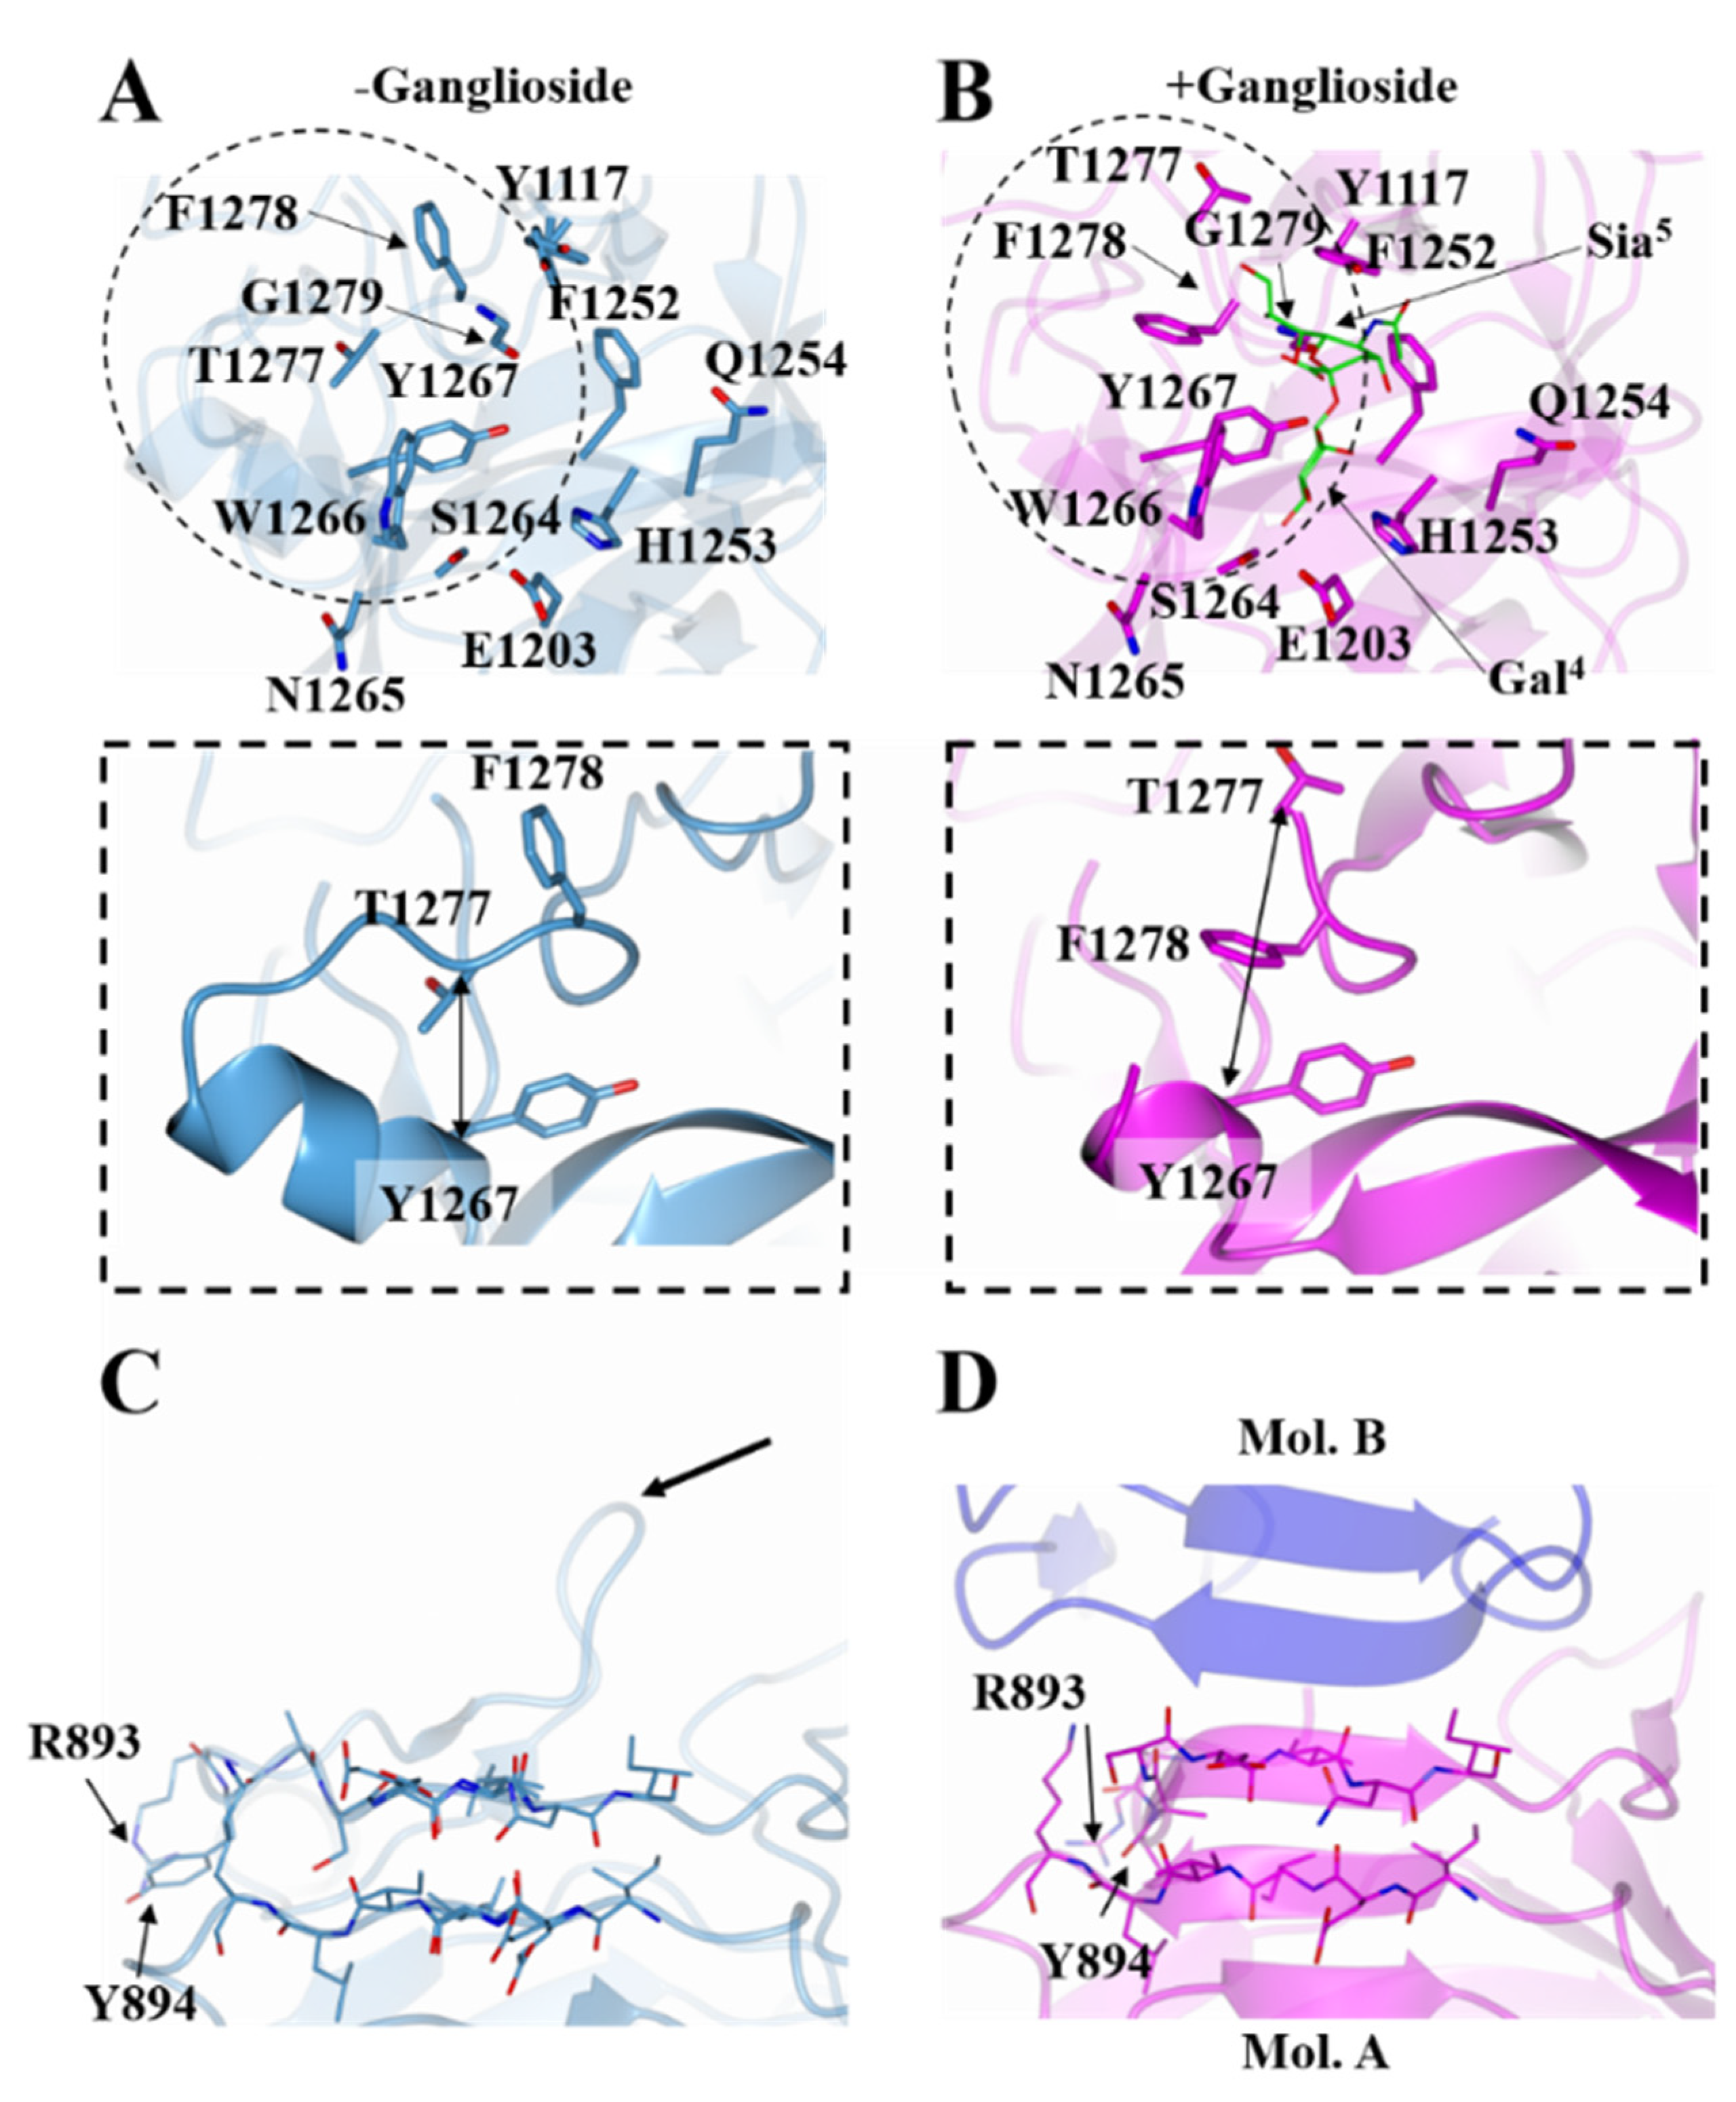
2.2. Structure of HC/A5 Co-Crystallised with GM1b Oligosaccharide

Several attempts to crystallise HC/A5 with GD1a did not yield crystals for the complex. Consequently, a smaller ganglioside, GM1b, which is identical to GD1a in terms of the expected binding portion (Sia5-GalNAc3) but lacks only Sia6 (Figure 1B), was used for co-crystallisation with HC/A5. Crystals of HC/A5:GM1b diffracted to 2.4 Å, in space group P21 (Table 1), and the structure was determined by molecular replacement with two molecules (designated A and B) in the ASU (Figure 3A). Molecule A generally showed clearer electron density throughout the structure compared to molecule B, especially the H…SxWY motif that is essential for ganglioside binding [26] which could not be modelled in molecule B. There are, however, three small loop regions in molecule A (1167-1169, 1226-1235, and 1271-1276) that showed insufficient density for modelling. It is possible that the latter loop (residues 1271-1276) is flexible due to its proximity to the GBS.
Both molecules A and B are conformationally very similar, with an RMSD of 0.68 Å for all Cα atoms. Residues 928-939, however, adopt alternative conformations—for molecule A they form a β-strand with residues 1047-1050 of the conserved jelly-roll fold, whereas for molecule B, they form an unstructured loop (Figure 3C). Inspection of the surrounding symmetry-related molecule suggests that this difference may be due to crystallographic packing.
The two molecules of the ASU form a dimer through an extended β-sheet interaction (Figure 3A, Arrow). For the interaction to occur the 882-889 loop, which extends beyond the β-sheet (Figure 4C, Arrow), has to move away to allow for the interface to form between molecule A and B. Although computational analyses [27] suggest this may also be due to crystallographic packing, the GBS in this crystal form has become accessible to ligand binding. For molecule A, some additional weak electron density was observed at the GBS that was not part of the protein. With the aid of polder maps [28] for His 1253 and Tyr 1117 [22,23,29], it was possible to model in sugars Gal4 and Sia5 (Figure 3B). Gal4 forms a total of four hydrogen bonds with residues Glu 1203, Phe 1252, His 1253, and Ser 1264, while Sia5 forms three hydrogen bonds with Tyr 1117, Tyr 1267, and Gly 1279 (Table 2). Further refinement of the Gal4 molecule with occupancies 0.6 and 1 generated average B-factors of 60.74 Å2 and 61.97 Å2, respectively, indicating that GM1b is bound at low occupancy.
The β-sheet arrangement between the two molecules of the ASU, shows a significant conformational change at the N-terminus of the HC/A5:GM1b structure when compared to HC/A5 alone (Figure 4C,D). Most prominently, the side chains of Arg 893 and Tyr 894 have rotated towards the main body of the protein structure upon GM1b binding, and there is a rotation in the protein backbone that results in a more compact structure. This closely resembles the full-length structure of BoNT/A1 (PDB:3BTA) in the absence of ganglioside.
Overall, the HC/A5:GM1b structure is very similar to the HC/A5 structure (PDB:6TWP), with RMSD values of 0.76 Å (for Cα atoms) for molecule A and 0.64 Å for molecule B (for Cα atoms). Considering that the residues of the GBS for molecule B could not be modelled, comparisons to the unbound HC/A5 structure will be made with molecule A. Most of the residues within the putative GBS show little to no conformational change, with the exception of Phe 1278 which has its side chain flipped towards the GBS (Figure 4A,B). This flip in residue positioning is accompanied by a change in the loop structure spanning residues 1260-1280, where there is an increase in the Cα distance of 4 Å between residues Tyr 1267 and Thr 1277 upon ganglioside binding (Figure 4A,B inset). This increase in Cα distance is indicative of the loop widening to accommodate the ganglioside.

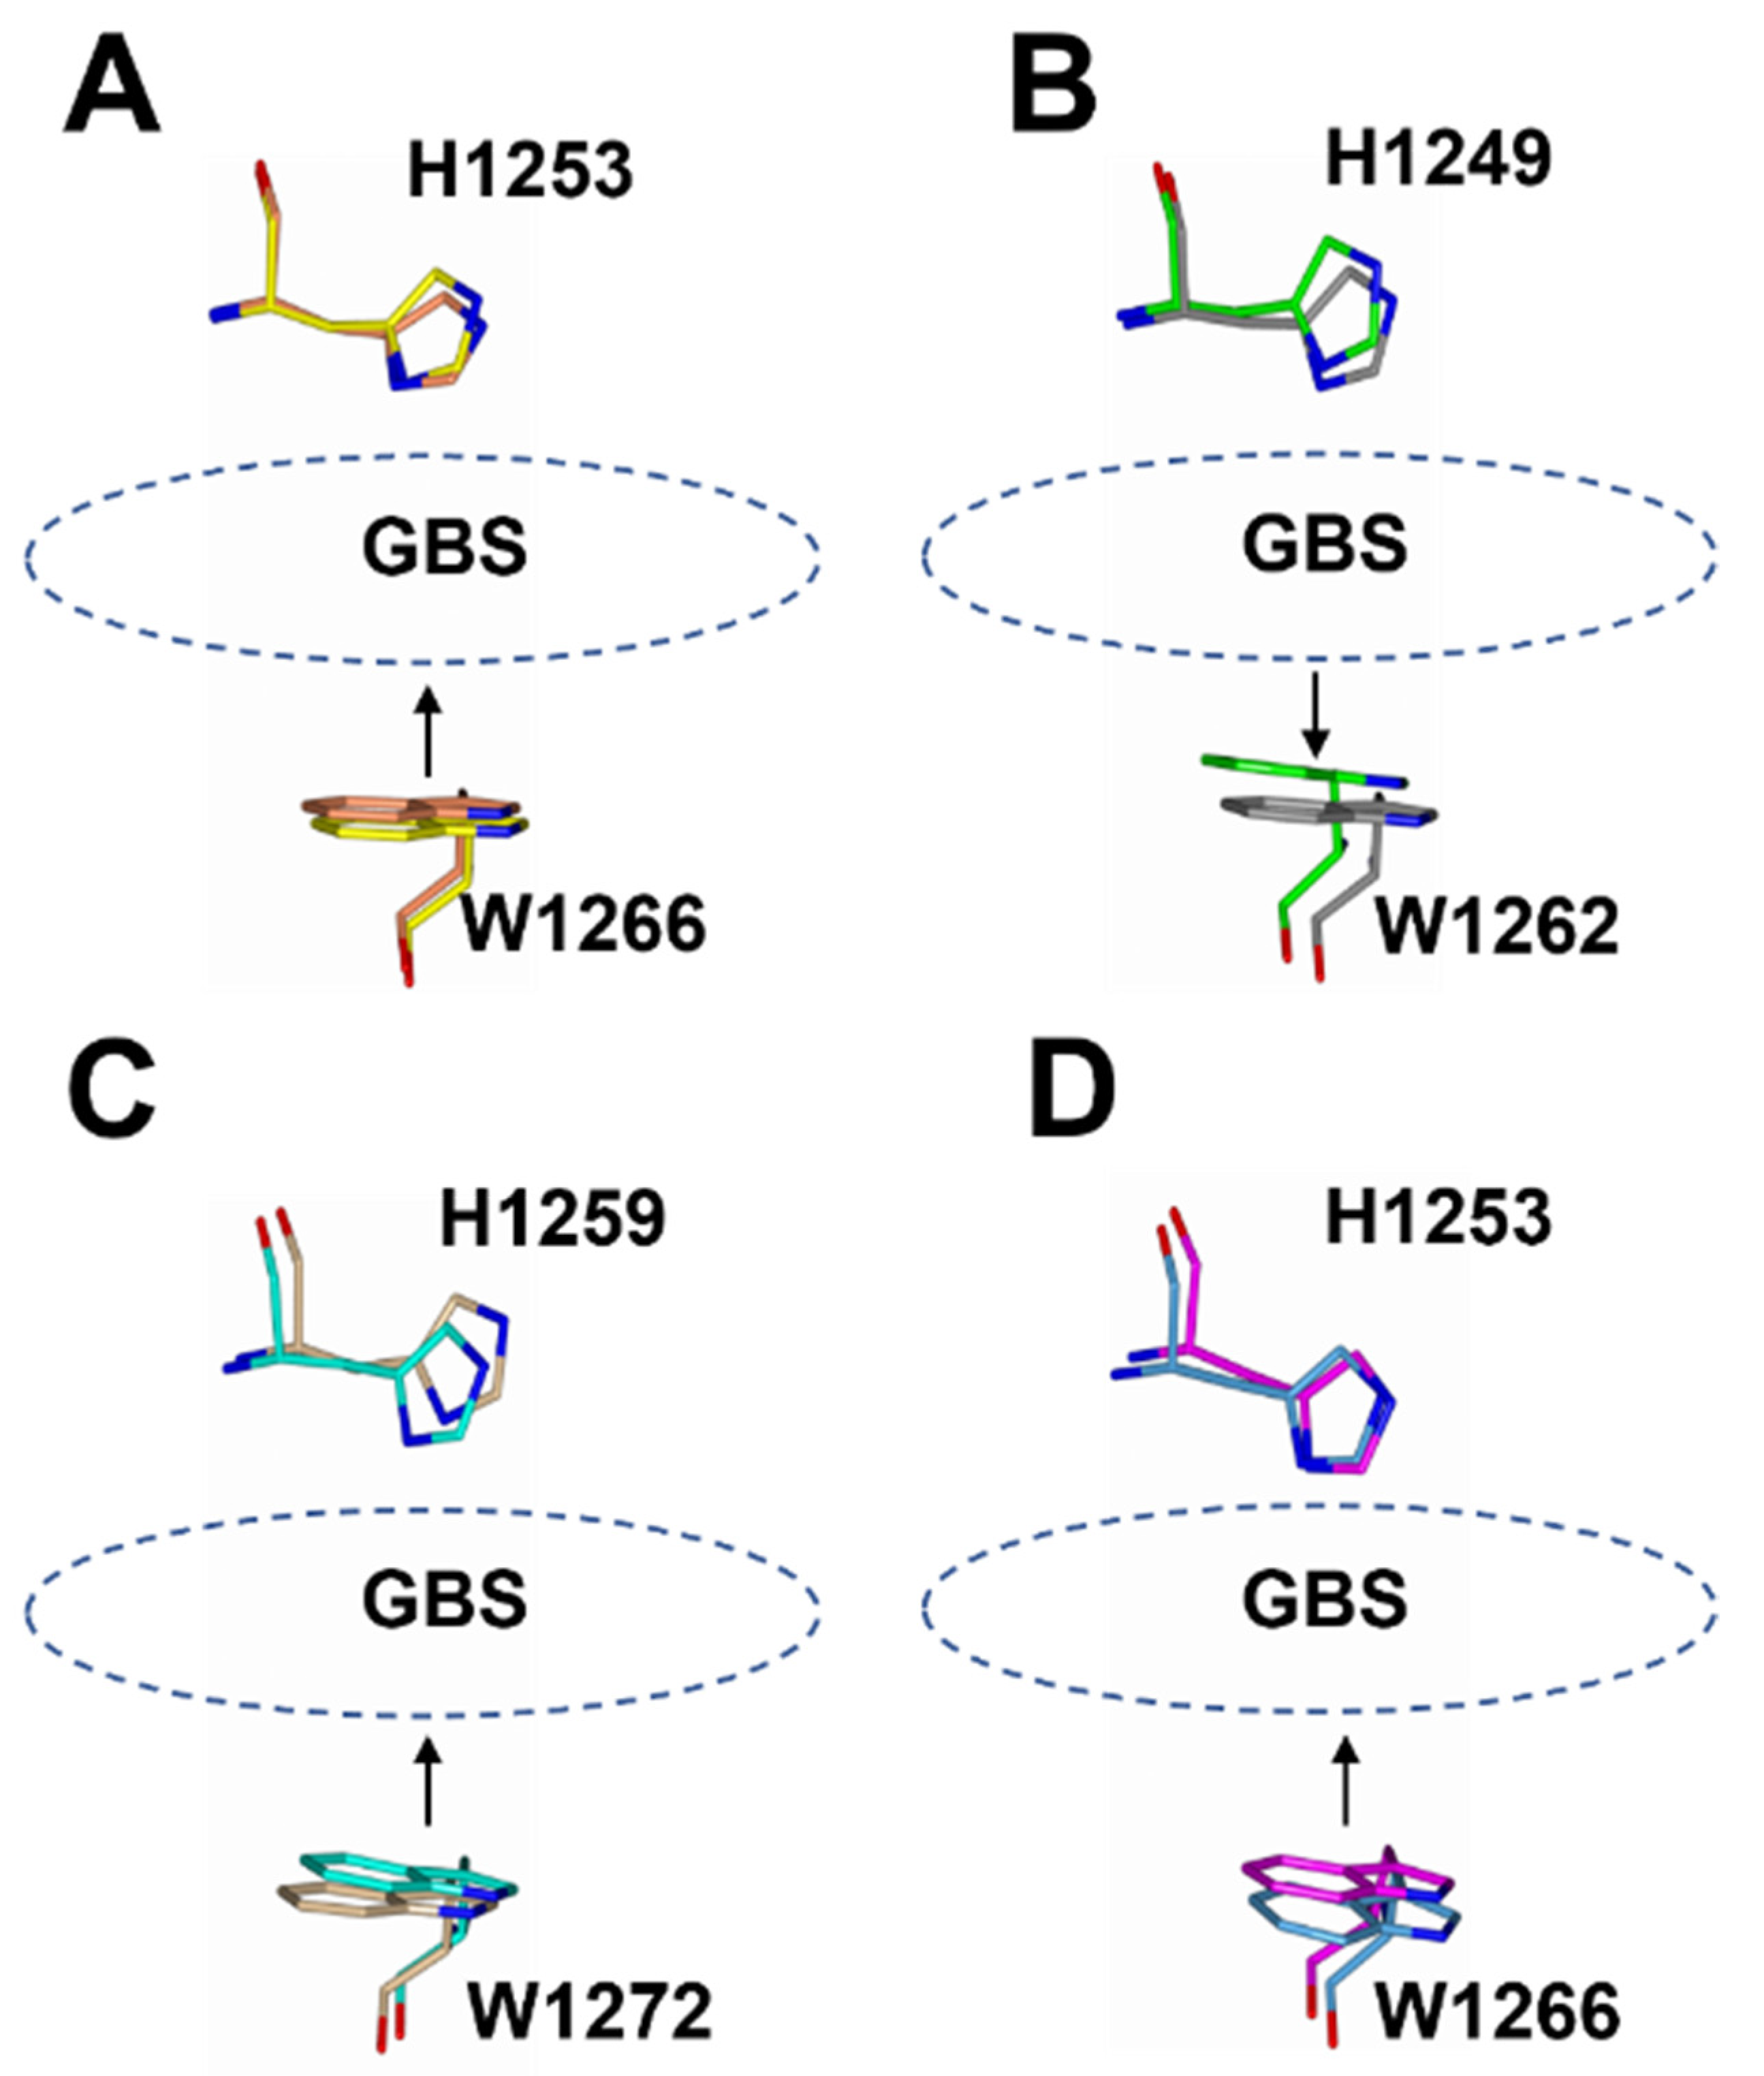
2.3. Structural Variability of HC/A Subtypes at the Ganglioside Binding Site

There appears to be some structural variation of the GBS among the HC/A subtypes as illustrated by a comparison of the HC/A1, HC/A3, HC/A4, and HC/A5 structures with and without ganglioside bound (Figure 5). The most significant variation is seen within the loop that follows the β-hairpin of the GBS for HC/A3 and HC/A5 (Figure 6A–D, Arrow). Upon binding the ganglioside, the loop widens in HC/A3 and HC/A5, as measured by an increase in the distance between Cα atoms of T1273A3/1277A5 and Y1263A3/1267A5 within the loop, to accommodate the ganglioside. In contrast, the loop in the unbound HC/A1 and HC/A4 structures, adopts a more open conformation, which suggests that it does not need to move to allow GD1a to bind. Furthermore, a comparison of the GBS opening groove, formed by the histidine and tryptophan residues of the H…SxWY motif, in the bound and unbound structures reveals that the structural changes of HC/A4 is more similar to HC/A1 than HC/A3, with the tryptophan moving towards the GBS upon ganglioside binding (Figure 7A–D). HC/A5 is somewhere in between with some conformational variation reminiscent of the HC/A3 structure, where Phe 1274A3/1278A5 appears to flip towards the GBS upon binding. This residue is not conserved across the subtypes—it appears as Leu 1278 for HC/A1 and Leu 1285 for HC/A4. Not surprisingly, there is some variation to the ganglioside interaction between subtypes. HC/A1 has a total of ten hydrogen bonding interactions with GD1a, while HC/A3 and /A4 has nine (Table 2). Furthermore, HC/A4 displays no water-mediated interactions with the ganglioside, while both HC/A1 and HC/A3 have at least two each. The occupancy of Gal4 and Sia5 in the HC/A5:GM1b structure was too low to be able to determine any water-mediated interactions that contributed to binding.

3. Conclusions

The crystal structures of HC/A4:GD1a and HC/A5:GM1b presented here reveal the interactions involved with ganglioside binding and also the conformational changes that occur. For HC/A4, eight residues form a total of nine hydrogen bonding interactions with the three principal oligosaccharides, GalNAC3, Gal4, and Sia5. However, for HC/A5, only two oligosaccharides could be modelled in the electron density map, revealing seven hydrogen bonding interactions. The low occupancy of GM1b, and multiple failed attempts of co-crystallising HC/A5 with GD1a, suggested a low affinity to the Sia-Gal-GalNAc moiety or preference for a different ganglioside.
A total of four HC/A subtype structures (HC/A1, HC/A3, HC/A4, HC/A5) have now been reported with and without ganglioside. We previously reported that the reduction in hydrogen bonding interactions of HC/A3 for GD1a compared to HC/A1, may be a contributing factor in its reduction in toxicity [23]. HC/A4 follows this trend as the structure displays a reduction in hydrogen bonding interactions with GD1a and has a reported 1000-fold lower activity in mice [30]. Furthermore, both BoNT/A3 and BoNT/A4 are significantly less active in vivo when compared to BoNT/A1, and BoNT/A4 is also less efficient at entering cells [31], with the cell binding domain contributing to this variation.

4. Materials and Methods

All reagents were purchased from Sigma-Aldrich (St. Loius, MO, USA), Fischer Scientific (Loughborough, UK), and Molecular Dimensions (Newmarket, UK) unless otherwise stated. GD1a and GM1b oligosaccharides were supplied by Elicityl (Crolles, France).

4.1. Protein Expression and Purification

The sequences of BoNT/A4 residues 870-1296 (HC/A4) and BoNT/A5 residues 871-1296 (HC/A5) were cloned into the pJ401 vector with an N-terminal hexa-histidine tag, as described previously [24,25]. Both constructs were transformed into E. coli strain BL21 and grown at 37 °C to an OD600 of 0.5 before induction with 1 mM IPTG for 16 h at 16 °C. Cells were harvested by centrifugation. Cells expressing HC/A4 were lysed in 50 mM Tris pH 7.4, 0.2 M NaCl, 10 mM trehalose and 20 mM imidazole, while cells expressing HC/A5 were lysed in 50 mM Tris pH 7.4, 0.5 M NaCl, and 20 mM imidazole. Both proteins were captured on a GE HisTrap column and further purified by gel filtration using a GE superdex 200 column. For HC/A4, the running buffer was 50 mM Tris pH 7.4, 150 mM NaCl, and 10 mM trehalose, while for HC/A5 it was 50 mM Tris pH 7.4 and 150 mM NaCl. Both proteins were concentrated to 1 mg/mL using a 10 kDa MWCO centrifugal concentrator and flash frozen in liquid nitrogen for storage at −20 °C until required for crystallisation.

4.2. Protein Crystallisation

HC/A4 and HC/A5 proteins were concentrated to 5 mg/mL and the former incubated with 5 mM GD1a oligosaccharide and the latter with 5 mM GM1b oligosaccharide for 1 h at room temperature. Crystallisation screens were setup using the sitting drop vapour diffusion method in 96-3 well intelli-plates (SWISSCI, High Wycombe, UK) with a number of high throughput crystallisation conditions (Molecular Dimensions). Both a 1:1 and 2:1 protein to reservoir ratios were screened in each case. HC/A4 crystals grew in 0.2 M NaAcO∙3H2O, 20% w/v PEG 3350 (1:1 ratio, protein:reservoir). HC/A5 crystals grew in 150 mM Li2SO4, 50 mM MgCl2∙6H2O, 0.1 M HEPES pH 7.8, 4.7% w/v PEG 8K, 4.7% PEG 10K and 4.7% PEG 8K (1:1 ratio, protein:reservoir). Crystals were mounted directly onto a cryo-loop and flash frozen for storage in liquid nitrogen.

4.3. X-ray Diffraction Data Collection and Structure Determination

Diffraction images were collected at a wavelength of 0.9785 Å with 0.1° oscillation and 0.01 s of exposure time per image on the i04 beamline at the Diamond Light Source (Harwell, Oxfordshire, UK). Crystals were kept under a jet stream of liquid nitrogen at 100 K during data collection. A total of 7200 images were collected for HC/A4:GD1a, and 3600 images for HC/A5:GM1b. Data processing was carried out in DIALS [32] and both structures were solved by molecular replacement in PHASER [33] using a previously reported structure of HC/A4 [24] and HC/A5 [25] as search models. Initial rounds of refinement were performed using REFMAC [26] as part of the CCP4 package [34] with the final round of refinement and validation performed in Phenix [35]. The structures were validated using Molprobity [36] and PDB validation. Figures were produced using ccp4mg [37] and BioRender.com (Biorender, Toronto, ON, Canada).

Author Contributions

K.S.G. purified HC/A5, performed all crystallographic analysis, wrote the manuscript, and supervised O.O.M. O.O.M. performed purification, crystallisation, and preliminary crystallographic analysis of HC/A4. S.M.L. analysed the data and edited the manuscript. K.R.A. supervised the study, analysed the data, and edited the manuscript. All authors have read and agreed to the published version of the manuscript.

Funding

K.S.G. is supported by a joint postgraduate studentship between University of Bath and Ipsen Bioinnovation Ltd.

Data Availability Statement

The atomic coordinates and structure factors of HC/A4-GD1a and HC/A5-GM1b have been deposited in the protein data bank under the accession codes 7QPT and 7QPU, respectively.

Acknowledgments

We thank Diamond Light Source for the use of beamline I04 (proposal MX23269).

Conflicts of Interest

K.S.G., O.O.M. and K.R.A. from the University of Bath declare no competing financial interests. S.M.L. is an employee of Ipsen Bioinnovation Ltd.

References

  1. Hatheway, C.L. Toxigenic clostridia. Clin. Microbiol. Rev. 1990, 3, 66–98. [Google Scholar] [CrossRef]
  2. Gill, D.M. Bacterial toxins: A table of lethal amounts. Microbiol. Rev. 1982, 46, 86–94. [Google Scholar] [CrossRef]
  3. Fonfria, E.; Maignel, J.; Lezmi, S.; Martin, V.; Splevins, A.; Shubber, S.; Kalinichev, M.; Foster, K.; Picaut, P.; Krupp, J. The expanding therapeutic utility of botulinum neurotoxins. Toxins 2018, 10, 208. [Google Scholar] [CrossRef] [Green Version]
  4. Lacy, D.B.; Tepp, W.; Cohen, A.C.; DasGupta, B.R.; Stevens, R.C. Crystal structure of botulinum neurotoxin type A and implications for toxicity. Nat. Struct. Biol. 1998, 5, 898–902. [Google Scholar] [CrossRef]
  5. Pellizzari, R.; Rossetto, O.; Schiavo, G.; Montecucco, C. Tetanus and botulinum neurotoxins: Mechanism of action and therapeutic uses. Philos. Trans. R. Soc. B Biol. Sci. 1999, 354, 259–268. [Google Scholar] [CrossRef] [Green Version]
  6. Foster, K.A. The dual-receptor recognition of botulinum neurotoxins. In Molecular Aspects of Botulinum Neurotoxin; Springer: Berlin, Germany, 2014; pp. 129–150. [Google Scholar]
  7. Schmid, M.F.; Robinson, J.P.; Dasgupta, B. Direct visualization of botulinum neurotoxin-induced channels in phospholipid vesicles. Nature 1993, 364, 827–830. [Google Scholar] [CrossRef] [PubMed]
  8. Hoch, D.H.; Romero-Mira, M.; Ehrlich, B.E.; Finkelstein, A.; DasGupta, B.R.; Simpson, L.L. Channels formed by botulinum, tetanus, and diphtheria toxins in planar lipid bilayers: Relevance to translocation of proteins across membranes. Proc. Natl. Acad. Sci. USA 1985, 82, 1692–1696. [Google Scholar] [CrossRef] [Green Version]
  9. Montal, M. Translocation of botulinum neurotoxin light chain protease by the heavy chain protein-conducting channel. Toxicon 2009, 54, 565–569. [Google Scholar] [CrossRef] [PubMed] [Green Version]
  10. Schiavo, G.; Rossetto, O.; Santucci, A.; DasGupta, B.R.; Montecucco, C. Botulinum neurotoxins are zinc proteins. J. Biol. Chem. 1992, 267, 23479–23483. [Google Scholar] [CrossRef]
  11. Lu, B. The destructive effect of botulinum neurotoxins on the SNARE protein: SNAP-25 and synaptic membrane fusion. PeerJ 2015, 3, e1065. [Google Scholar] [CrossRef] [PubMed] [Green Version]
  12. Tanizawa, Y.; Fujisawa, T.; Mochizuki, T.; Kaminuma, E.; Suzuki, Y.; Nakamura, Y.; Tohno, M. Draft genome sequence of Weissella oryzae SG25T, isolated from fermented rice grains. Genome Announc. 2014, 2, 3–4. [Google Scholar] [CrossRef] [PubMed] [Green Version]
  13. Brunt, J.; Carter, A.T.; Stringer, S.C.; Peck, M.W. Identification of a novel botulinum neurotoxin gene cluster in Enterococcus. FEBS Lett. 2018, 592, 310–317. [Google Scholar] [CrossRef] [Green Version]
  14. Contreras, E.; Masuyer, G.; Qureshi, N.; Chawla, S.; Dhillon, H.S.; Lee, H.L.; Chen, J.; Stenmark, P.; Gill, S.S. A neurotoxin that specifically targets Anopheles mosquitoes. Nat. Commun. 2019, 10, 2869. [Google Scholar] [CrossRef] [PubMed]
  15. Rasetti-Escargueil, C.; Lemichez, E.; Popoff, M.R. Variability of botulinum toxins: Challenges and opportunities for the future. Toxins 2018, 10, 374. [Google Scholar] [CrossRef] [Green Version]
  16. Hill, K.K.; Smith, T.J.; Helma, C.H.; Ticknor, L.O.; Foley, B.T.; Svensson, R.T.; Brown, J.L.; Johnson, E.A.; Smith, L.A.; Okinaka, R.T.; et al. Genetic diversity among botulinum neurotoxin-producing clostridial strains. J. Bacteriol. 2007, 189, 818–832. [Google Scholar] [CrossRef] [PubMed] [Green Version]
  17. Davies, J.R.; Liu, S.M.; Acharya, K.R. Variations in the botulinum neurotoxin binding domain and the potential for novel therapeutics. Toxins 2018, 10, 421. [Google Scholar] [CrossRef] [Green Version]
  18. Pellett, S.; Tepp, W.H.; Whitemarsh, R.C.M.M.; Bradshaw, M.; Johnson, E.A. In vivo onset and duration of action varies for botulinum neurotoxin A subtypes 1–5. Toxicon 2015, 107, 37–42. [Google Scholar] [CrossRef] [PubMed] [Green Version]
  19. Wang, D.; Krilich, J.; Pellett, S.; Baudys, J.; Tepp, W.H.; Barr, J.R.; Johnson, E.A.; Kalb, S.R. Comparison of the catalytic properties of the botulinum neurotoxin subtypes A1 and A5. Biochim. Biophys. Acta-Proteins Proteom. 2013, 1834, 2722–2728. [Google Scholar] [CrossRef] [PubMed] [Green Version]
  20. Arndt, J.W.; Jacobson, M.J.; Abola, E.E.; Forsyth, C.M.; Tepp, W.H.; Marks, J.D.; Johnson, E.A.; Stevens, R.C. A structural perspective of the sequence variability within botulinum neurotoxin subtypes A1–A4. J. Mol. Biol. 2006, 362, 733–742. [Google Scholar] [CrossRef]
  21. Ledeen, R. Gangliosides of the neuron. Trends Neurosci. 1985, 8, 169–174. [Google Scholar] [CrossRef]
  22. Hamark, C.; Berntsson, R.P.A.; Masuyer, G.; Henriksson, L.M.; Gustafsson, R.; Stenmark, P.; Widmalm, G. Glycans confer specificity to the recognition of ganglioside receptors by botulinum neurotoxin A. J. Am. Chem. Soc. 2017, 139, 218–230. [Google Scholar] [CrossRef]
  23. Gregory, K.S.; Liu, S.M.; Acharya, K.R. Crystal structure of botulinum neurotoxin subtype A3 cell binding domain in complex with GD1a co-receptor ganglioside. FEBS Open Biol. 2020, 10, 298–305. [Google Scholar] [CrossRef] [PubMed]
  24. Davies, J.R.; Rees, J.; Liu, S.M.; Acharya, K.R. High resolution crystal structures of Clostridium botulinum neurotoxin A3 and A4 binding domains. J. Struct. Biol. 2018, 202, 113–117. [Google Scholar] [CrossRef]
  25. Davies, J.R.; Britton, A.; Liu, S.M.; Acharya, K.R. High-resolution crystal structures of the botulinum neurotoxin binding domains from subtypes A5 and A6. FEBS Open Biol. 2020, 10, 1474–1481. [Google Scholar] [CrossRef] [PubMed]
  26. Popoff, M.R.; Connan, C. Absorption and transport of botulinum neurotoxins. In Molecular Aspects of Botulinum Neurotoxin; Springer: Berlin, Germany, 2014; pp. 35–68. [Google Scholar]
  27. Elez, K.; Bonvin, A.M.J.J.; Vangone, A. Biological vs. crystallographic protein interfaces: An overview of computational approaches for their classification. Crystals 2020, 10, 114. [Google Scholar] [CrossRef] [Green Version]
  28. Liebschner, D.; Afonine, P.V.; Moriarty, N.W.; Poon, B.K.; Sobolev, O.V.; Terwilliger, T.C.; Adams, P.D. Polder maps: Improving OMIT maps by excluding bulk solvent. Acta Crystallogr. Sect. D Struct. Biol. 2017, 73, 148–157. [Google Scholar] [CrossRef] [Green Version]
  29. Stenmark, P.; Dupuy, J.; Imamura, A.; Kiso, M.; Stevens, R.C. Crystal structure of botulinum neurotoxin type A in complex with the cell surface co-receptor GT1b-insight into the toxin-neuron interaction. PLoS Pathog. 2008, 4, e1000129. [Google Scholar] [CrossRef] [PubMed]
  30. Whitemarsh, R.C.M.; Tepp, W.H.; Johnson, E.A.; Pellett, S. Persistence of botulinum neurotoxin a subtypes 1–5 in primary rat spinal cord cells. PLoS ONE 2014, 9, e90252. [Google Scholar] [CrossRef] [Green Version]
  31. Whitemarsh, R.C.M.; Tepp, W.H.; Bradshaw, M.; Lin, G.; Pier, C.L.; Scherf, J.M.; Johnson, E.A.; Pellett, S. Characterization of botulinum neurotoxin A Subtypes 1 through 5 by investigation of activities in mice, in neuronal cell cultures, and in vitro. Infect. Immun. 2013, 81, 3894–3902. [Google Scholar] [CrossRef] [PubMed] [Green Version]
  32. Waterman, D.G.; Winter, G.; Gildea, R.J.; Parkhurst, J.M.; Brewster, A.S.; Sauter, N.K.; Evans, G. Diffraction-geometry refinement in the DIALS framework. Acta Crystallogr. Sect. D Struct. Biol. 2016, 72, 558–575. [Google Scholar] [CrossRef] [Green Version]
  33. McCoy, A.J.; Grosse-Kunstleve, R.W.; Adams, P.D.; Winn, M.D.; Storoni, L.C.; Read, R.J. Phaser crystallographic software. J. Appl. Crystallogr. 2007, 40, 658–674. [Google Scholar] [CrossRef] [PubMed] [Green Version]
  34. Winn, M.D.; Ballard, C.C.; Cowtan, K.D.; Dodson, E.J.; Emsley, P.; Evans, P.R.; Keegan, R.M.; Krissinel, E.B.; Leslie, A.G.W.; McCoy, A.; et al. Overview of the CCP4 suite and current developments. Acta Crystallogr. Sect. D Biol. Crystallogr. 2011, 67, 235–242. [Google Scholar] [CrossRef] [PubMed] [Green Version]
  35. Liebschner, D.; Afonine, P.V.; Baker, M.L.; Bunkoczi, G.; Chen, V.B.; Croll, T.I.; Hintze, B.; Hung, L.W.; Jain, S.; McCoy, A.J.; et al. Macromolecular structure determination using X-rays, neutrons and electrons: Recent developments in Phenix. Acta Crystallogr. Sect. D Struct. Biol. 2019, 75, 861–877. [Google Scholar] [CrossRef] [Green Version]
  36. Williams, C.J.; Headd, J.J.; Moriarty, N.W.; Prisant, M.G.; Videau, L.L.; Deis, L.N.; Verma, V.; Keedy, D.A.; Hintze, B.J.; Chen, V.B.; et al. MolProbity: More and better reference data for improved all-atom structure validation. Protein Sci. 2018, 27, 293–315. [Google Scholar] [CrossRef]
  37. McNicholas, S.; Potterton, E.; Wilson, K.S.; Noble, M.E.M. Presenting your structures: The CCP4mg molecular-graphics software. Acta Crystallogr. Sect. D Biol. Crystallogr. 2011, 67, 386–394. [Google Scholar] [CrossRef] [PubMed] [Green Version]
Figure 1. Structure of HC/A4:GD1a. (A) Crystal structure of HC/A4 in complex with GD1a oligosaccharide, the electron density map of GD1a (2FO-FC) is contoured to 1 σ; (B) schematic diagram of GD1a ganglioside; (C) LigPlot of GD1a and HC/A4 hydrogen bonding interactions.
Toxins 14 00129 g001
Figure 2. Comparison of HC/A4:GD1a with HC/A4. (A) Superimposition of the HCN (left) and HCC (right) domains of HC/A4:GD1a (cyan) and HC/A4 (burlywood; PDB: 6F0P [22]) shows a hinge movement between the subdomains; (B) Comparison of HC/A4:GD1a and HC/A4 at the ganglioside binding site.
Toxins 14 00129 g002
Figure 3. Crystal structure of HC/A5:GM1b. (A) The structure of HC/A5:GM1b was solved with two molecules in the ASU designated ‘A’ (magenta) and ‘B’ (blue). The arrow indicates the location of the crystallographic dimer interface; (B) Ganglioside binding site of molecule ‘A’. The polder maps for Gal4 (magenta) and Sia5 (blue) are contoured to 3 σ. His 1253 and Tyr 1117 have been omitted for clarity; (C) Superimposition of molecule ‘A’ and ‘B’ shows a change in conformation of the loop spanning residues 928-939.
Toxins 14 00129 g003
Figure 4. Comparison of HC/A5:GM1b with HC/A5. Structure of the GBS of HC/A5 with and without GM1b oligosaccharide (B and A (PDB: 6TWP [22]), respectively). The widening of the loop region spanning residues 1260-1280 is indicated by double-headed arrows (inset). Structure of HC/A5 N-terminus with and without GM1b oligosaccharide (D and C, respectively). The former shows the crystallographic dimer interface between molecule ‘A’ (magenta) and ‘B’ (blue). Arrow points to the location of loop 882-889.
Toxins 14 00129 g004
Figure 5. Structural comparison of the ganglioside binding site with and without oligosaccharide. HC/A1 (PDB: 2VUA [29]), HC/A1:GD1a (PDB: 5TPC [22]), HC/A3 (PDB: 6F0O [22]), HC/A3:GD1a (PDB: 6THY [22]), HC/A4 (PDB: 6F0P [24]), HC/A4:GD1a (this study), HC/A5 (PDB: 6TWP [24]), and HC/A5:GM1b (this study).
Toxins 14 00129 g005
Figure 6. Structural comparison of the loop that follows the β-hairpin of the ganglioside binding site with and without oligosaccharide. (A) HC/A1 unbound (yellow; PDB: 2VUA [29]) and bound to GD1a (orange; PDB: 5TPC [22]); (B) HC/A3 unbound (green; PDB: 6F0O [24]) and bound to GD1a (dark grey; PDB: 6THY [23]); (C) HC/A4 unbound (burlywood; PDB: 6F0P [24]) and bound to GD1a (cyan; this study); (D) HC/A5 unbound (grey; PDB: 6TWP [25]) and bound to GM1b (cyan; this study). The arrow points to the loop that follows the GBS-β hairpin; dotted lines indicate unmodeled regions of the loop.
Toxins 14 00129 g006
Figure 7. Superimposition of the opening groove between His and Trp residues of the GBS for ganglioside bound and unbound HC/A subtypes. For HC/A1 (A), HC/A4 (C), and HC/A5 (D), the Trp residue moves towards the His residue, whereas for HC/A3 (B) it moves away.
Toxins 14 00129 g007
Table 1. X-ray crystallographic data collection and refinement statistics for HC/A4:GD1a and HC/A5:GM1b. Outer shell statistics are in parentheses.
BeamlineI04
Wavelength used0.9795 Å
ProteinHC/A4:GD1aHc/A5:GM1b
Crystallographic Statistics
Space groupP61P21
Unit cell dimensions:
a, b, c (Å)94.68, 94.68, 181.2144.16, 129.40, 78.05
α, β, γ (°)90.00, 90.00, 120.0090.00, 102.96, 90.00
Resolution range (Å)90.60–2.30 (2.38–2.30)129.40–2.30 (2.49–2.40)
Rmerge0.269 (1.866)0.305 (1.586)
Rpim0.043 (0.366)0.126 (0.746)
<I/σ(I)>12.1 (1.9)4.3 (0.8)
CC1/20.998 (0.644)0.982 (0.575)
Completeness (%)99.7 (97.5)100.0 (100.0)
No. observed reflections1,594,764 (97,629)227,781 (22,543)
No. unique reflections40,672 (3862)33,451 (3528)
Multiplicity39.2 (25.3)6.8 (6.4)
Refinement Statistics
Rwork/Rfree0.203/0.2480.222/0.262
RMSD bond lengths (Å)0.0040.003
RMSD bond angles (°)0.680.55
Ramachandran plot statistics (%):
Favoured95.4495.38
Allowed4.564.34
Outliers0.001.02
Average B-Factors (Å2):
Protein atoms42.2839.10
Solvent atoms35.0432.36
GD1a atoms72.5970.99
No. Atoms:70696286
Protein66966094
Solvent237160
GD1a/GM1b carbohydrates13632
PDB code7QPT7QPU
Table 2. Hydrogen bonds for ganglioside binding in structures HC/A4:GD1a and HC/A5:GM1b (this study), compared to HC/A3:GD1a (PDB: 6THY [23]) and HC/A1:GD1a (PDB: 5TPC [22]). Water-mediated interactions are indicated by a “-H2O molecule (n1, n2)“ where n1 is the distance between the amino acid residue and the water, and n2 is the distance between the water and monosaccharide. Δ Indicates they are the equivalent water molecule for each structure. Data adapted from [23].
MonosaccharideH-Bonding Residue (Distance in Å)
HC/A5:GM1bHC/A4:GD1aHC/A3:GD1aHC/A1:GD1a
Sia6N/ANot modelledNot modelledTrp 1266 (3.5)
Sia5Tyr 1117 (2.8)Tyr 1123 (2.8) Tyr 1117 (2.9)
Tyr 1267 (2.7)Tyr 1273 (2.5)Tyr 1263 (2.7)Tyr 1267-H2O (2.5, 3.5)
Gly 1279 (3.2)Gly 1285 (3.1)Gly 1275 (2.9)Gly 1279-H2O Δ (2.6 2.8)
Leu 1250-H2O Δ (2.9, 2.8)
Arg 1282 (3.8) Arg 1276 -H2O Δ (2.8, 2.8)
Gal4Glu 1203 (2.6)Glu 1209 (2.4)Glu 1199 (2.7)Glu 1203 (2.8)
Phe 1252 (2.8)Phe 1258 (2.8)Phe 1248 (2.5)Phe 1252 (2.7)
His 1253 (3.1)His 1259 (2.7)His 1249 (3.1)His 1253 (2.7)
Ser 1264 (2.9)Ser 1270 (2.5)Ser 1260 (2.7)Ser 1264 (2.8)
Leu 1250-H2O Δ (2.9, 3.0)
GalNAc3Not modelledGlu 1209 (2.6)Glu 1199 (2.5)Glu 1203 (2.5)
Publisher’s Note: MDPI stays neutral with regard to jurisdictional claims in published maps and institutional affiliations.

