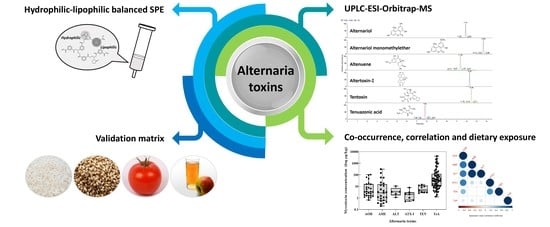
Natural Occurrence of Alternaria Toxins in Agricultural Products and Processed Foods Marketed in South Korea by LC–MS/MS

 ,
,  and
and 
Abstract
1. Introduction
2. Results and Discussion
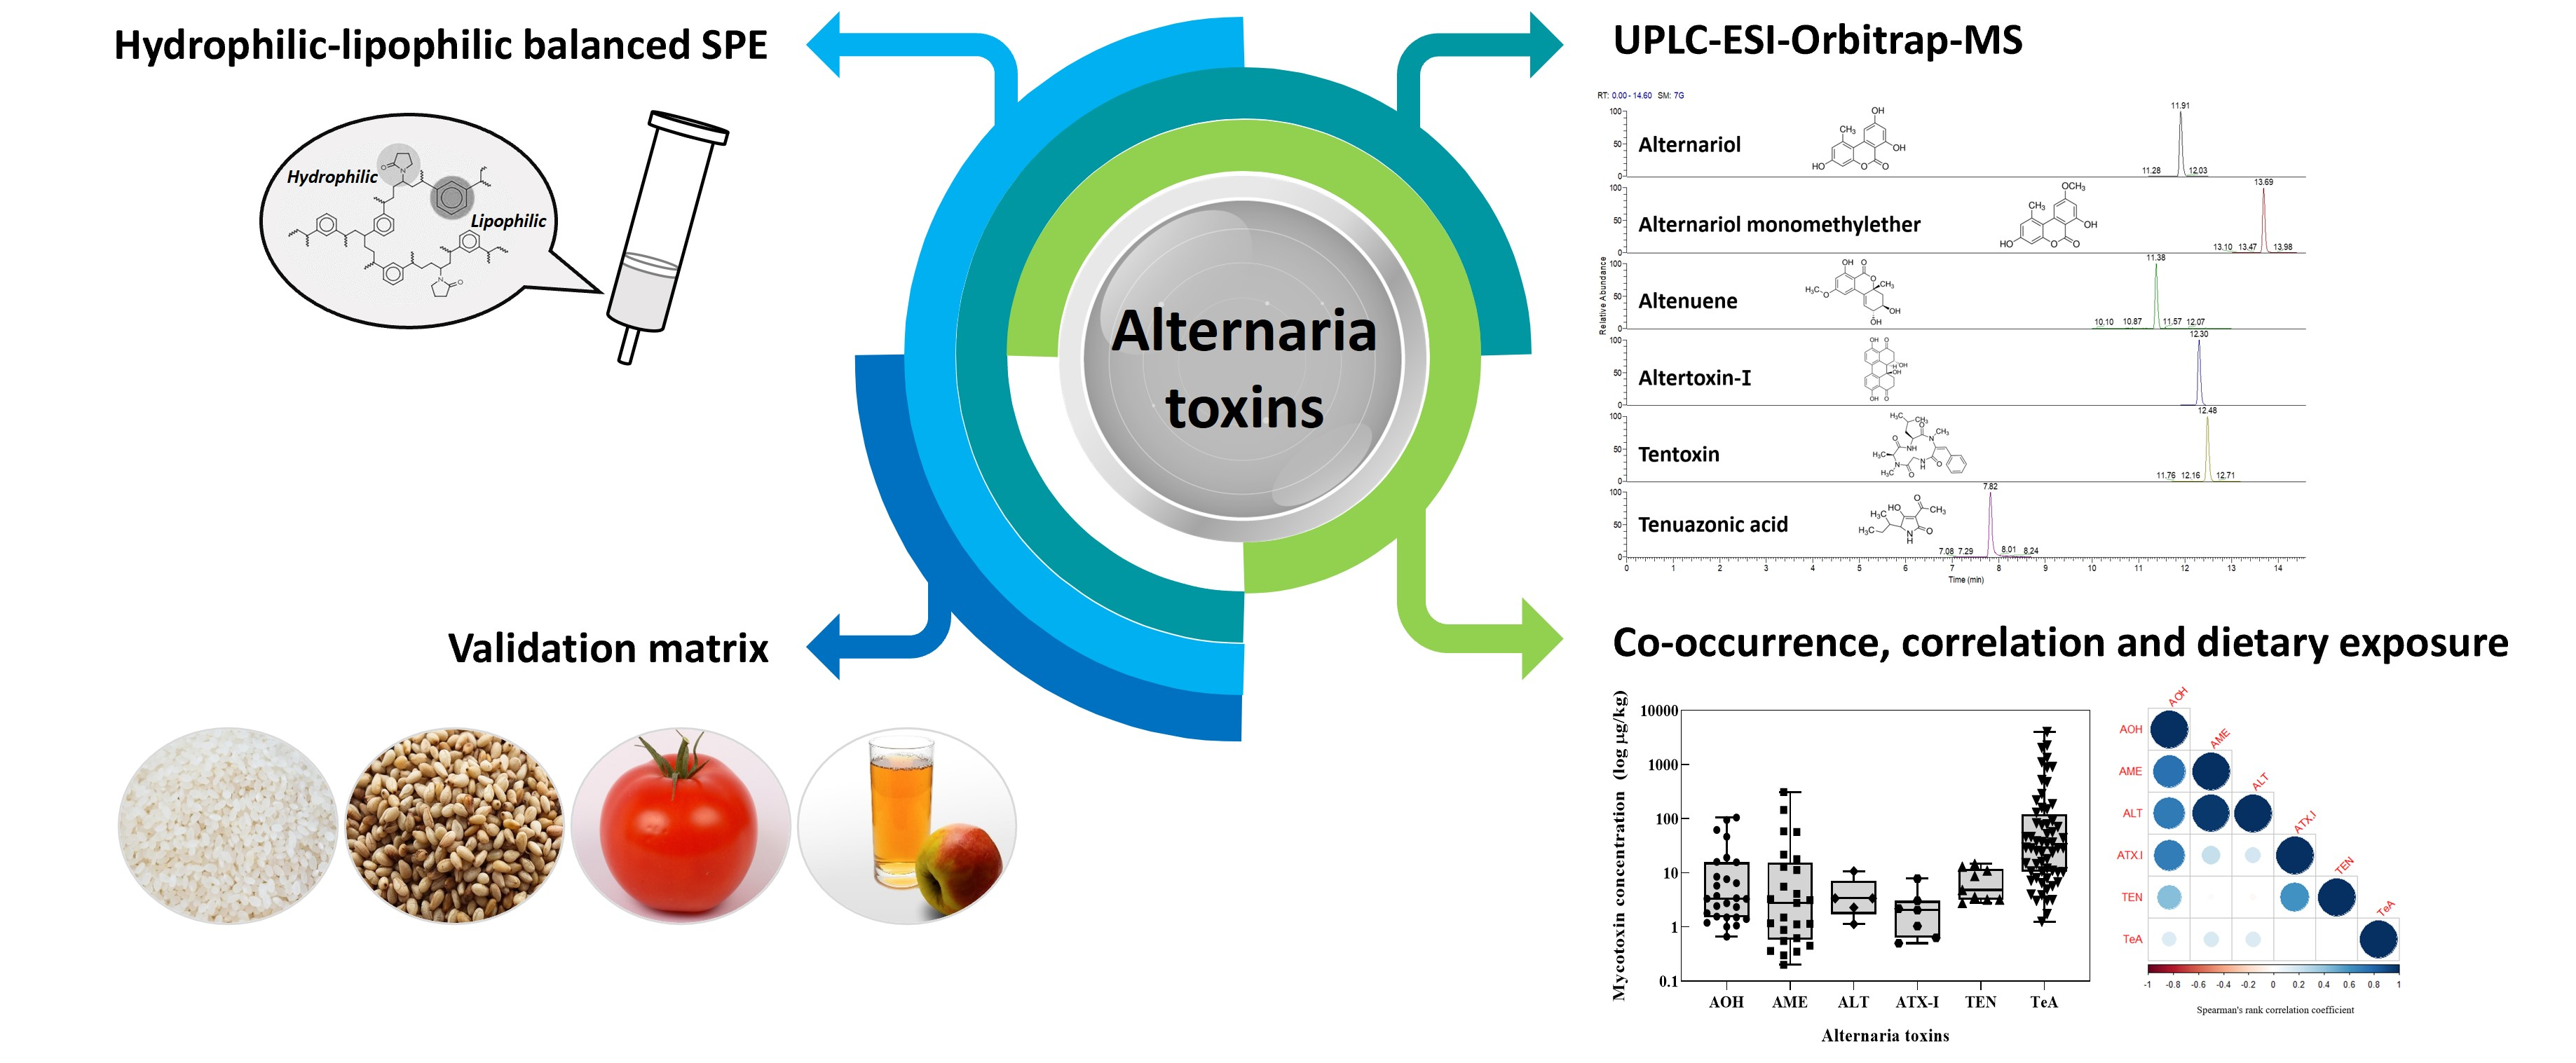
2.1. Method Validation
2.1.1. Selectivity, Linearity, Limit of Detection, and Limit of Quantification
2.1.2. Recovery and Precision
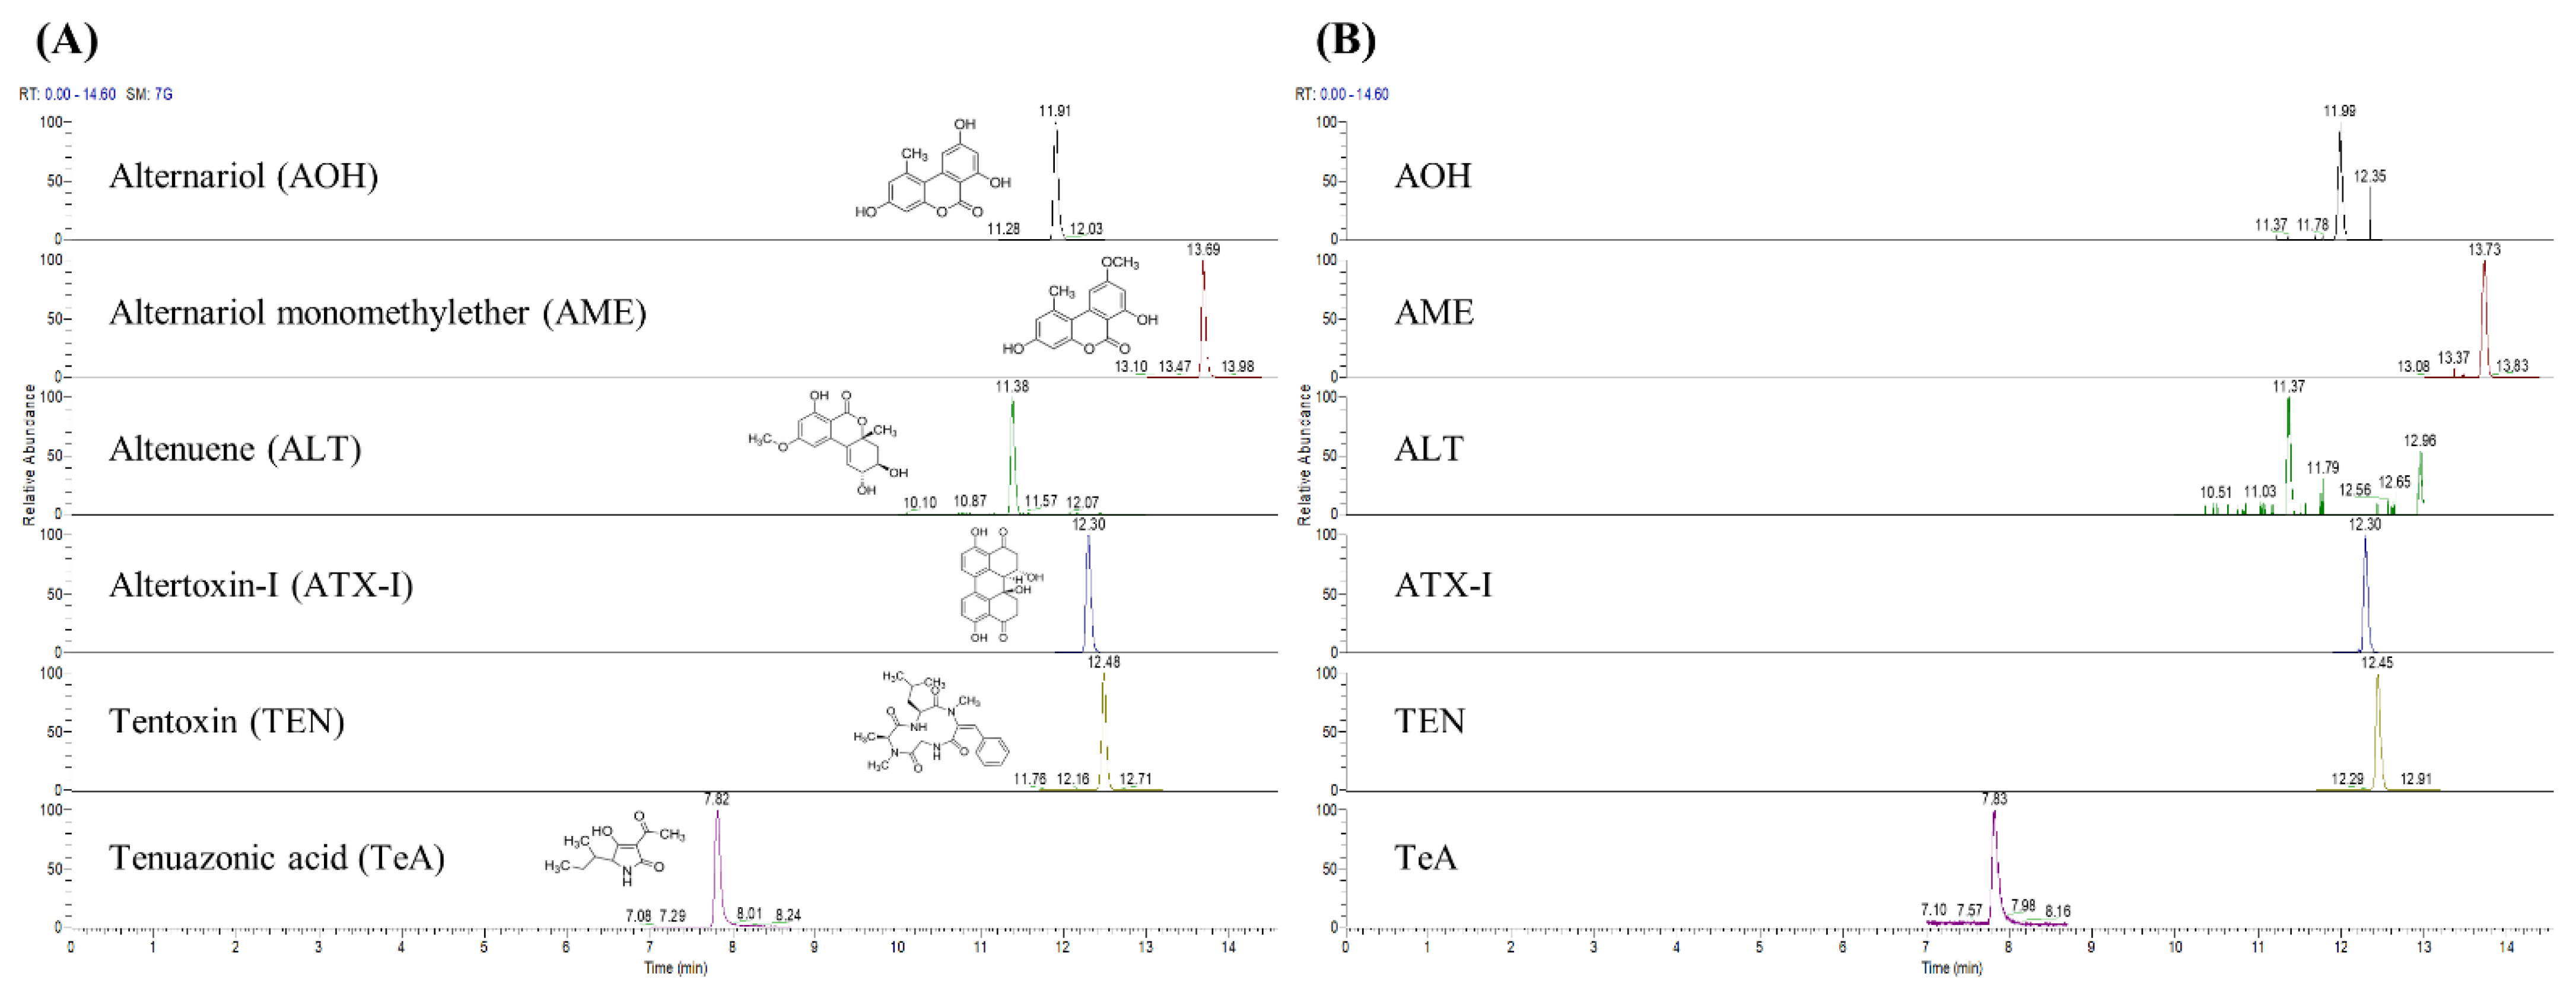
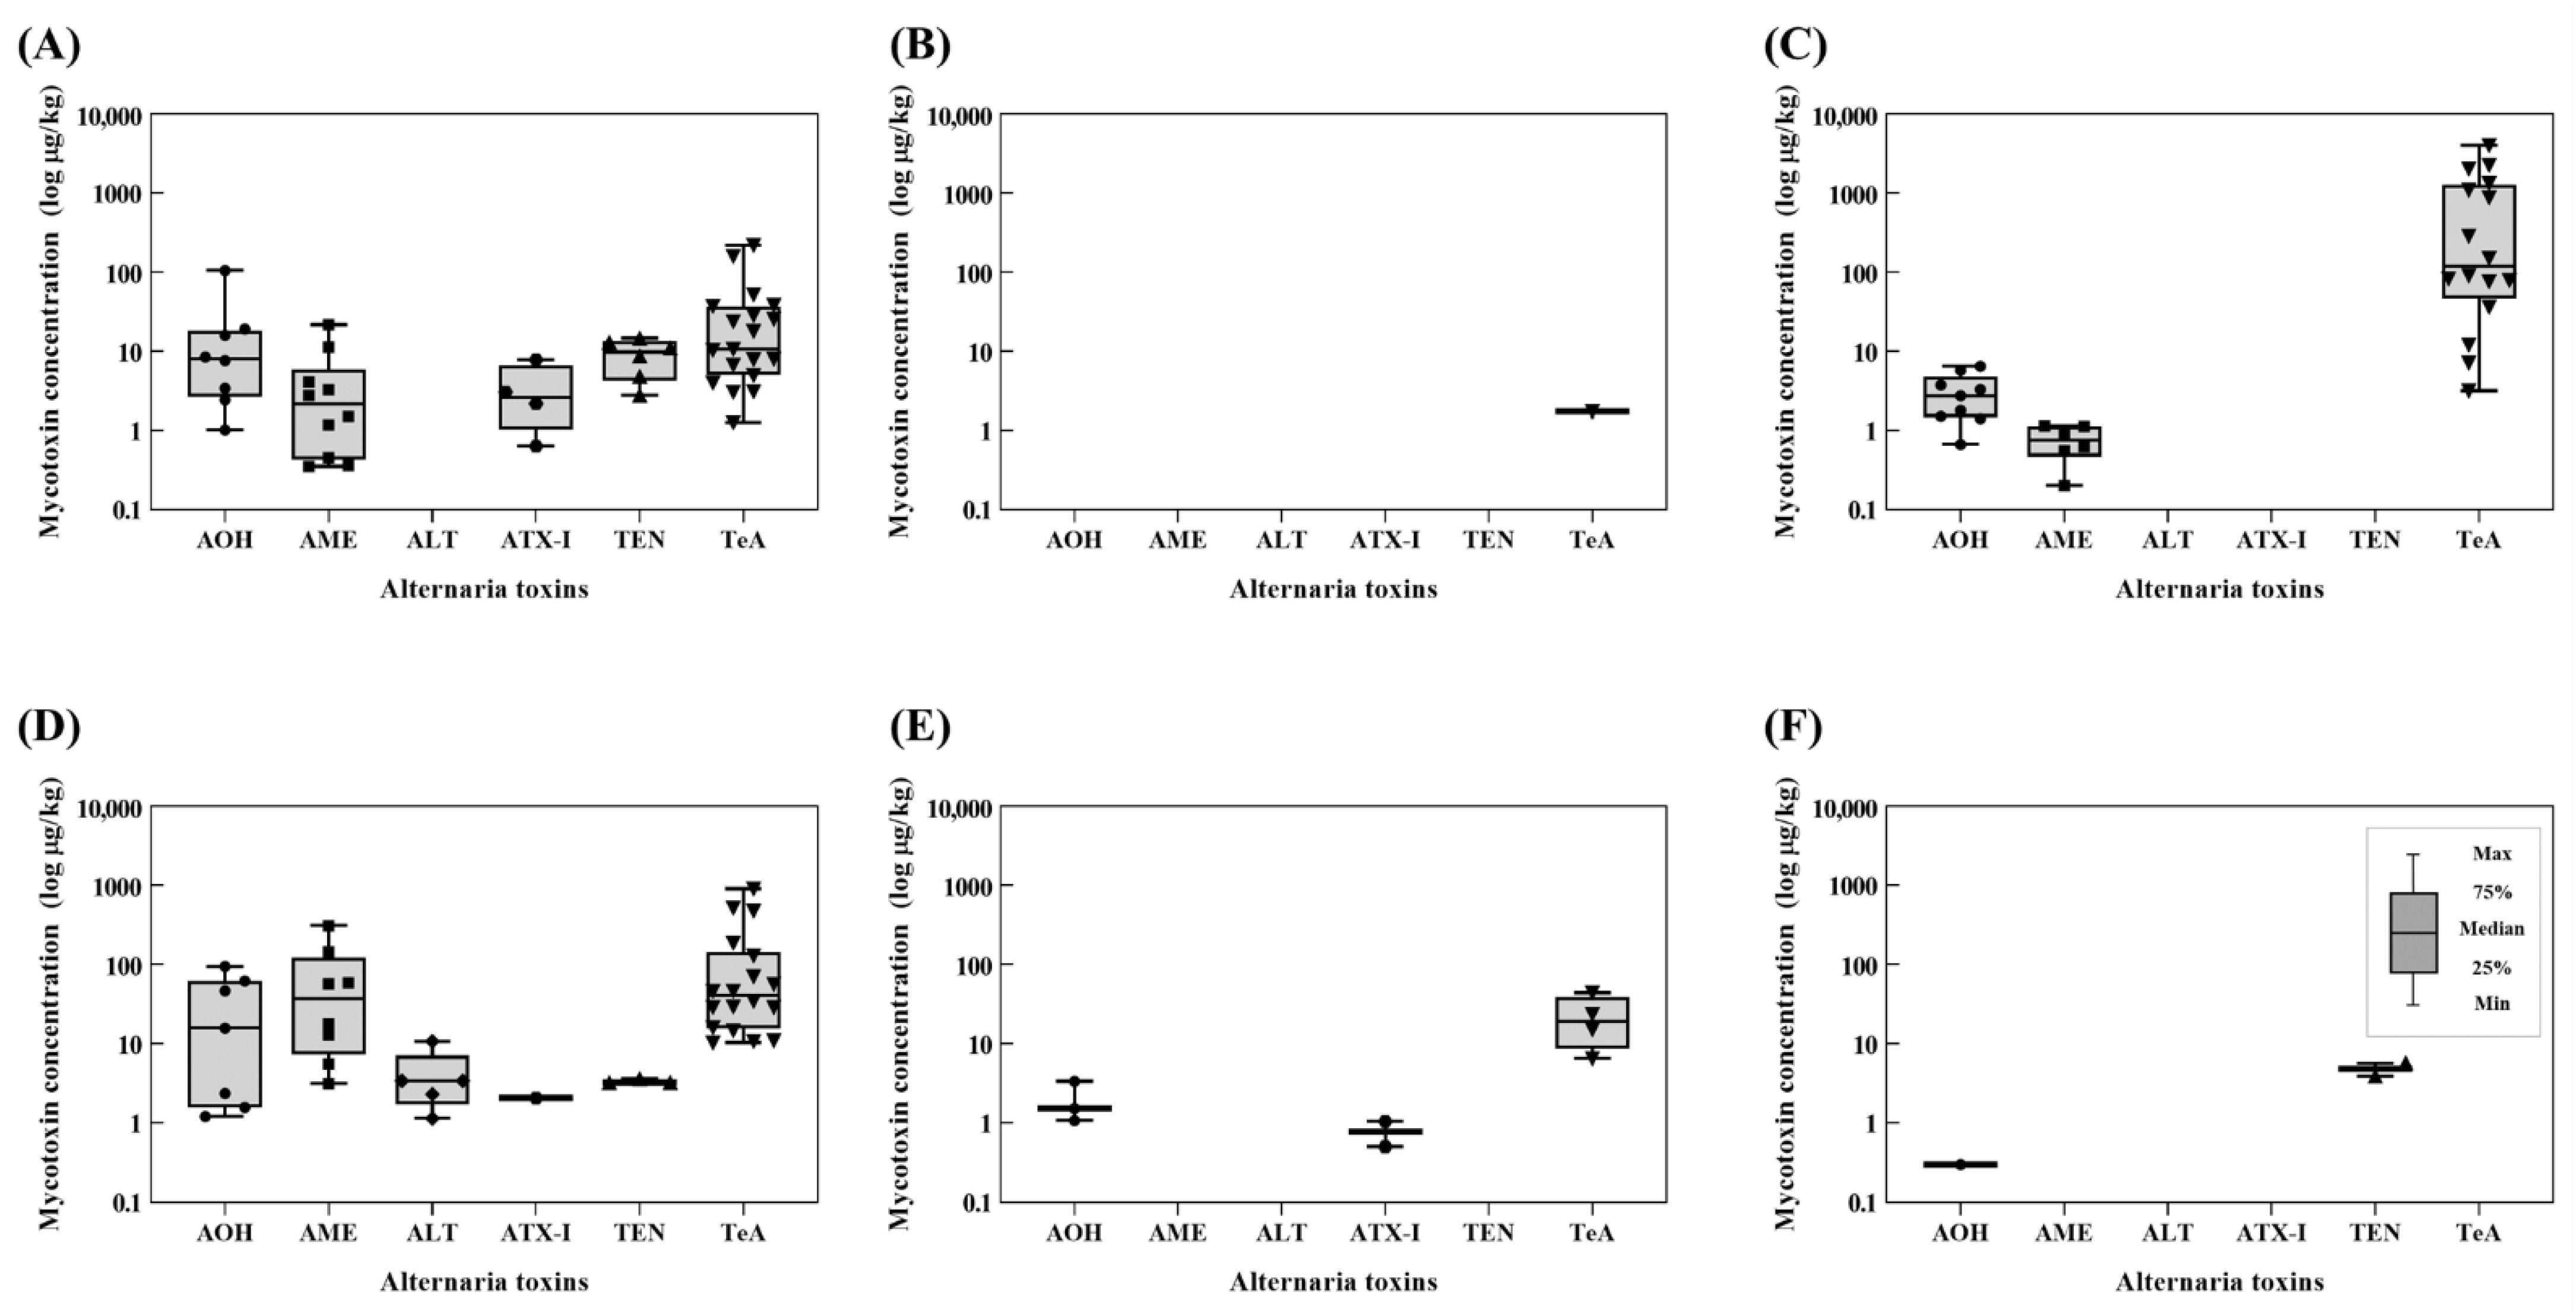
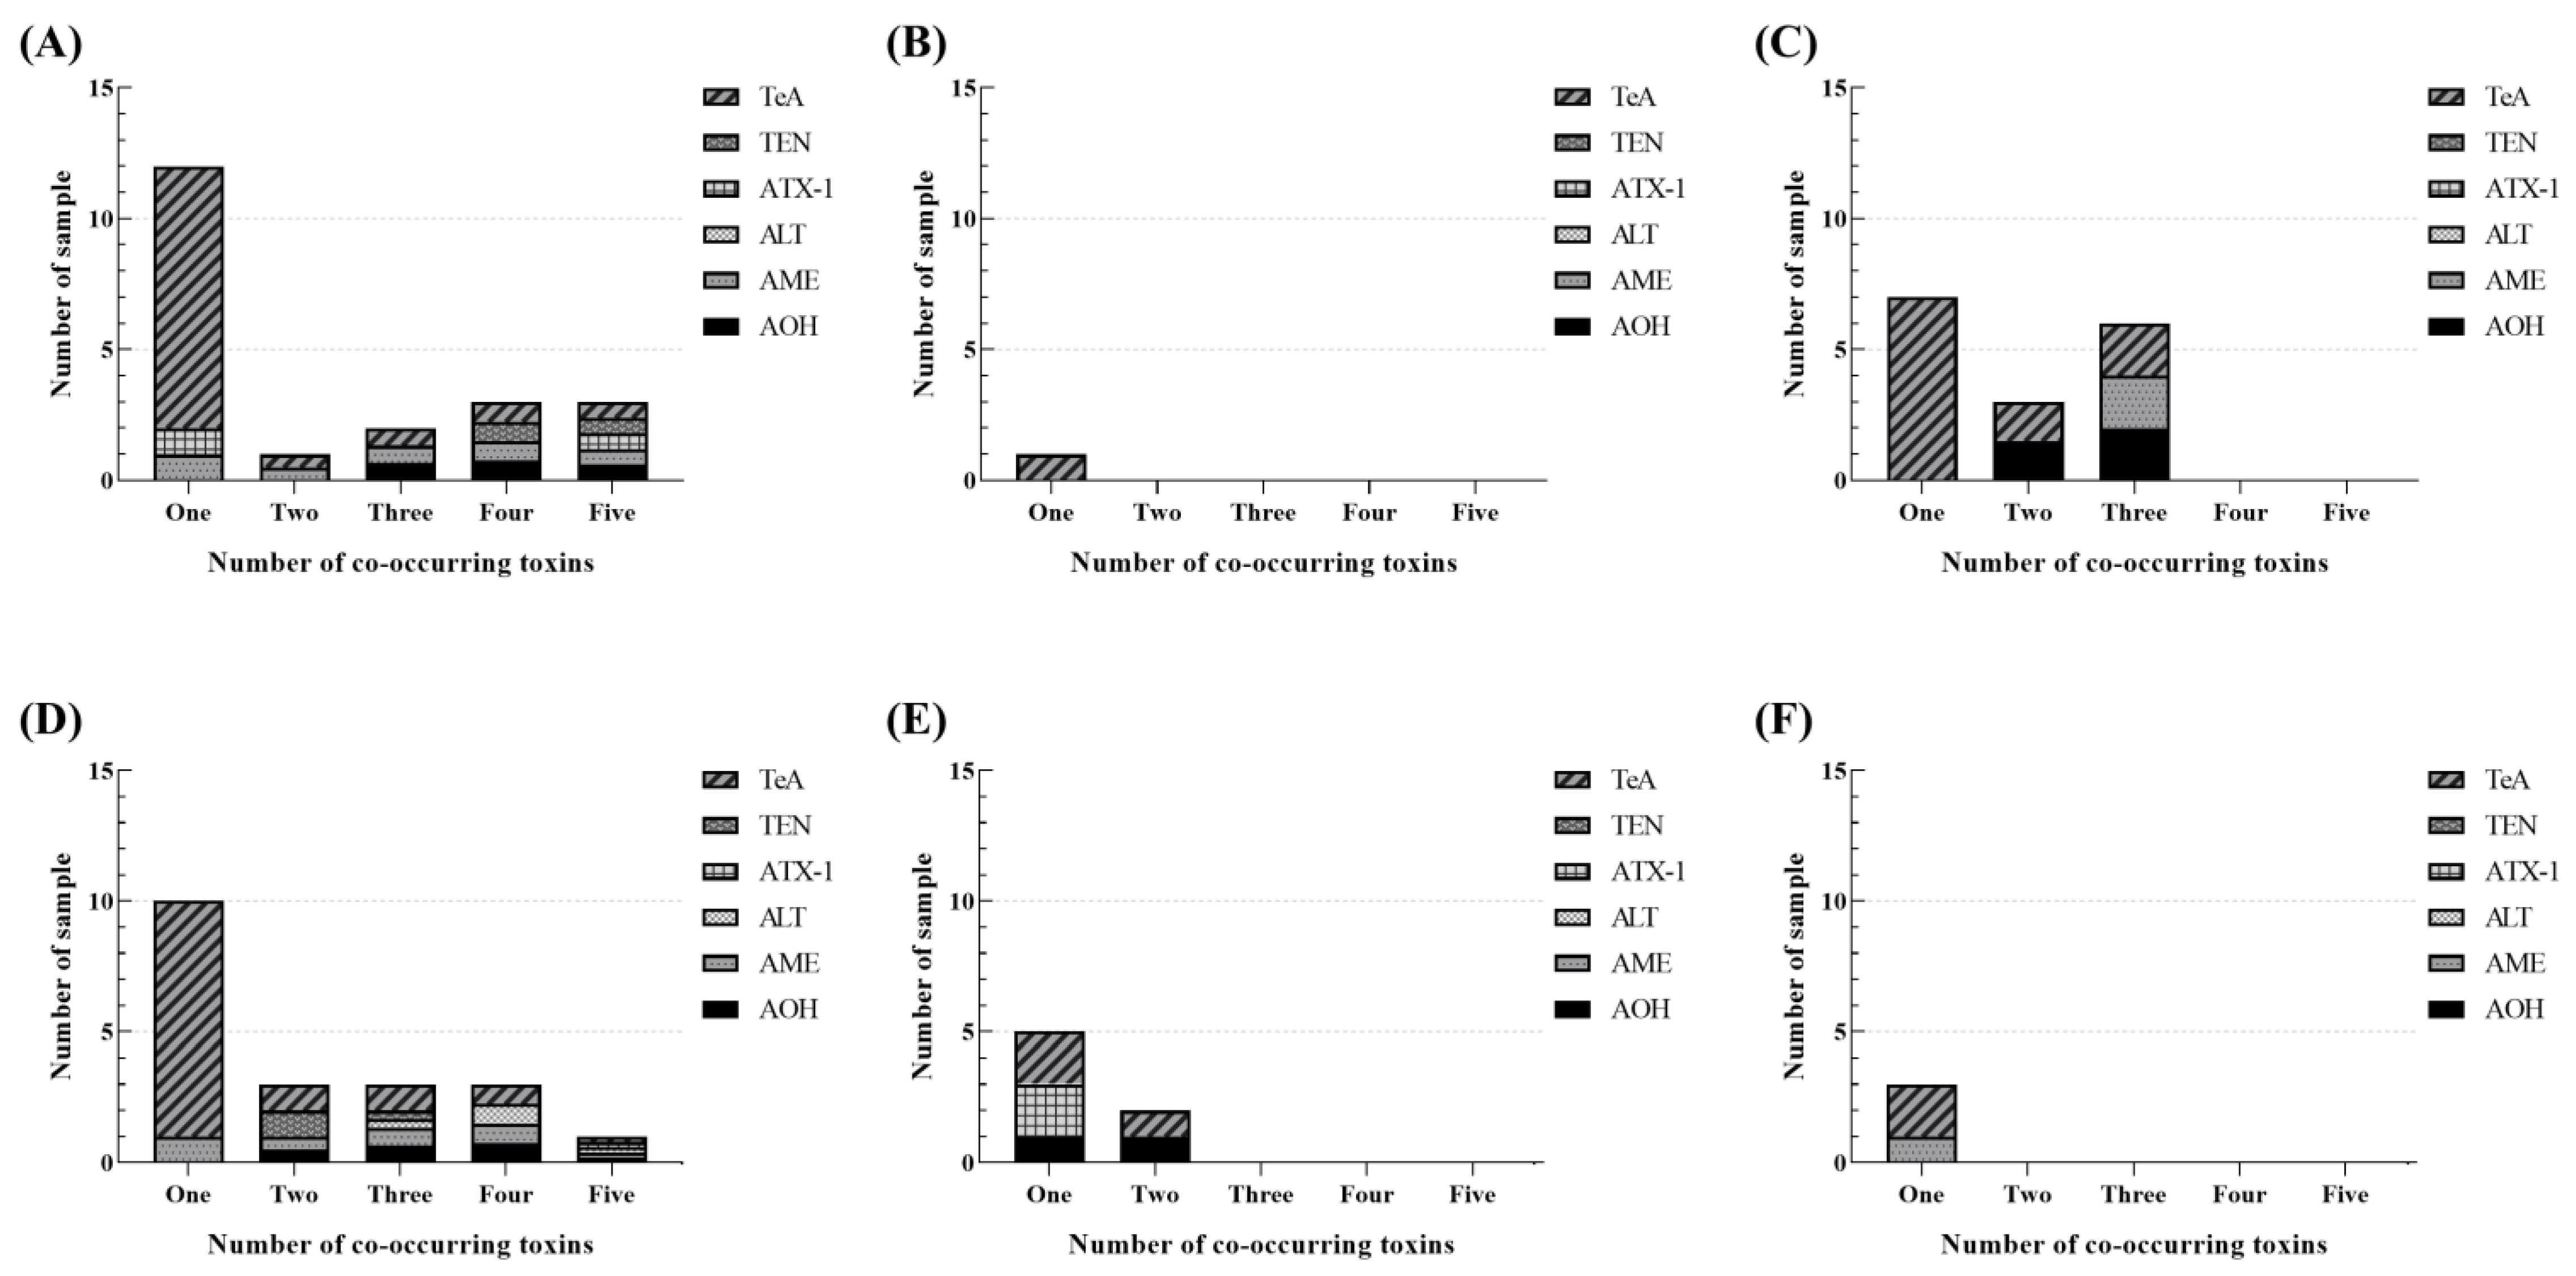
2.2. Occurrence of Alternaria Toxins in Agricultural Products and Processed Foods
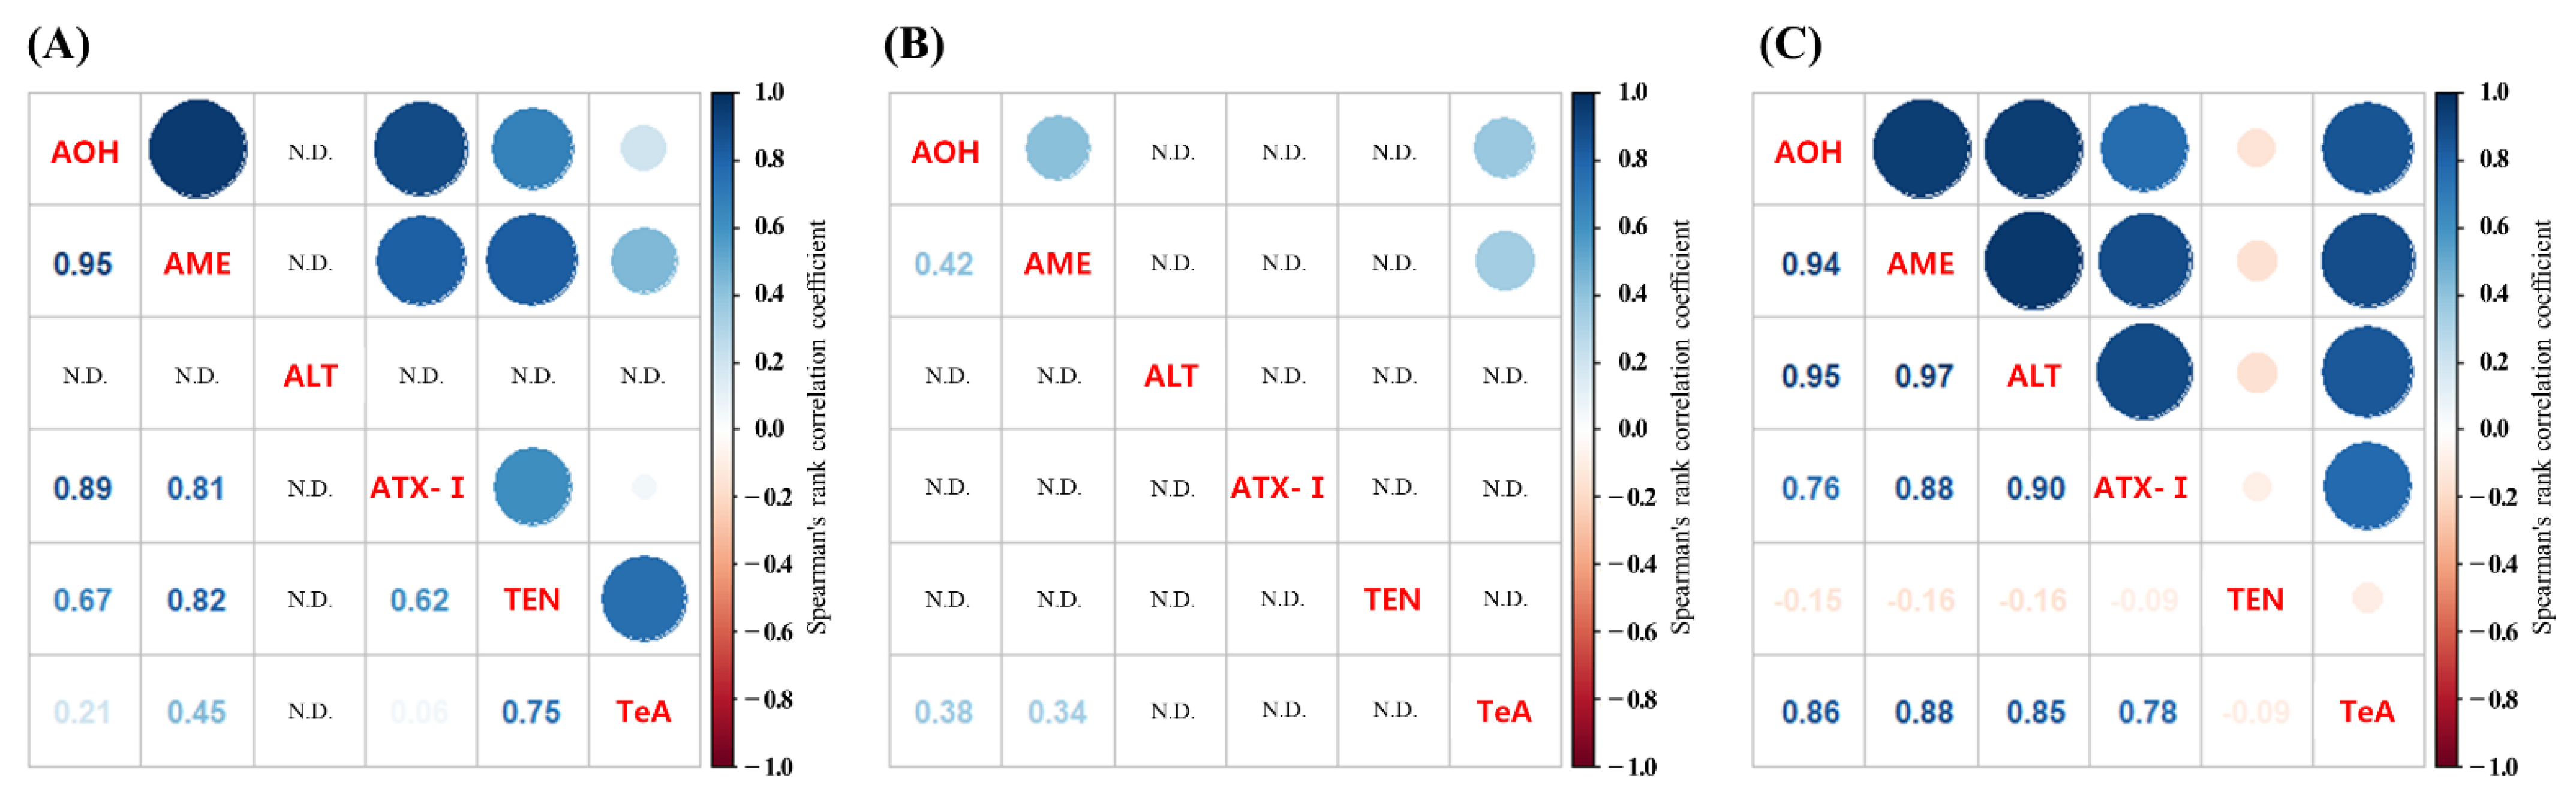
2.3. Correlation between Naturally Occurring Alternaria Toxins
2.4. Estimation of Daily Dietary Exposure to Alternaria Toxins
3. Conclusions
4. Materials and Methods
4.1. Sample Collection
4.2. Chemicals and Reagents
4.3. Sample Preparation
4.4. LC-MS/MS Equipment and Parameters
4.5. Method Validation
4.6. Estimation of Daily Dietary Exposure
Author Contributions
Funding
Institutional Review Board Statement
Informed Consent Statement
Acknowledgments
Conflicts of Interest
References
- Pinto, V.E.F.; Patriarca, A. Alternaria Species and Their Associated Mycotoxins; Humana Press: New York, NY, USA, 2017; pp. 13–32. [Google Scholar]
- Meena, M.; Samal, S. Alternaria host-specific (HSTs) toxins: An overview of chemical characterization, target sites, regulation and their toxic effects. Toxicol. Rep. 2019, 6, 745–758. [Google Scholar] [CrossRef] [PubMed]
- European Food Safety Authority; Arcella, D.; Eskola, M.; Gómez Ruiz, J.A. Dietary exposure assessment to Alternaria toxins in the European population. EFSA J. 2016, 14, e04654. [Google Scholar]
- Qiao, X.; Zhang, J.; Yang, Y.; Yin, J.; Li, H.; Xing, Y.; Shao, B. Development of a simple and rapid LC-MS/MS method for the simultaneous quantification of five Alternaria mycotoxins in human urine. J. Chromatogr. B 2020, 1144, 122096. [Google Scholar] [CrossRef] [PubMed]
- Pfeiffer, E.; Eschbach, S.; Metzler, M. Alternaria toxins: DNA strand-breaking activity in mammalian cells in vitro. Mycotoxin Res. 2007, 23, 152–157. [Google Scholar] [CrossRef]
- Schwarz, C.; Kreutzer, M.; Marko, D. Minor contribution of alternariol, alternariol monomethyl ether and tenuazonic acid to the genotoxic properties of extracts from Alternaria alternata infested rice. Toxicol. Lett. 2012, 214, 46–52. [Google Scholar] [CrossRef]
- Solhaug, A.; Wisbech, C.; Christoffersen, T.E.; Hult, L.O.; Lea, T.; Eriksen, G.S.; Holme, J.A. The mycotoxin alternariol induces DNA damage and modify macrophage phenotype and inflammatory responses. Toxicol. Lett. 2015, 239, 9–21. [Google Scholar] [CrossRef]
- Aichinger, G.; Del Favero, G.; Warth, B.; Marko, D. Alternaria toxins—Still emerging? Compr. Rev. Food Sci. Food Saf. 2021, 20, 4390–4406. [Google Scholar] [CrossRef] [PubMed]
- Schrader, T.J.; Cherry, W.; Soper, K.; Langlois, I.; Vijay, H.M. Examination of Alternaria alternata mutagenicity and effects of nitrosylation using the Ames Salmonella test. Teratog. Carcinog. Mutagen. 2001, 21, 261–274. [Google Scholar] [CrossRef] [PubMed]
- EFSA Panel on Contaminants in the Food Chain (CONTAM). Scientific opinion on the risks for animal and public health related to the presence of Alternaria toxins in feed and food. EFSA J. 2011, 9, 2407. [Google Scholar] [CrossRef]
- Chen, A.; Mao, X.; Sun, Q.; Wei, Z.; Li, J.; You, Y.; Zhao, J.; Jiang, G.; Wu, Y.; Wang, L. Alternaria mycotoxins: An overview of toxicity, metabolism, and analysis in food. J. Agric. Food Chem. 2021, 69, 7817–7830. [Google Scholar] [CrossRef]
- Scott, P.M.; Weber, D.; Kanhere, S.R. Gas chromatography-mass spectrometry of Alternaria mycotoxins. J. Chromatogr. A 1997, 765, 255–263. [Google Scholar] [CrossRef] [PubMed]
- Krska, R.; Schubert-Ullrich, P.; Molinelli, A.; Sulyok, M.; MacDonald, S.; Crews, C. Mycotoxin analysis: An update. Food Addit. Contam. 2008, 25, 152–163. [Google Scholar] [CrossRef] [PubMed]
- Woo, S.Y.; Ryu, S.Y.; Tian, F.; Lee, S.Y.; Park, S.B.; Chun, H.S. Simultaneous determination of twenty mycotoxins in the Korean soybean paste doenjang by LC-MS/MS with immunoaffinity cleanup. Toxins 2019, 11, 594. [Google Scholar] [CrossRef] [PubMed]
- Noser, J.; Schneider, P.; Rother, M.; Schmutz, H. Determination of six Alternaria toxins with UPLC-MS/MS and their occurrence in tomatoes and tomato products from the Swiss market. Mycotoxin Res. 2011, 27, 265–271. [Google Scholar] [CrossRef]
- Zhao, K.; Shao, B.; Yang, D.; Li, F.; Zhu, J. Natural occurrence of Alternaria toxins in wheat-based products and their dietary exposure in China. PLoS ONE 2015, 10, e0132019. [Google Scholar] [CrossRef]
- Xu, W.; Han, X.; Li, F.; Zhang, L. Natural occurrence of Alternaria toxins in the 2015 wheat from Anhui province, China. Toxins 2016, 8, 308. [Google Scholar] [CrossRef]
- Bansal, M.; Saifi, I.J.; Dev, I.; Sonkar, A.K.; Dixit, S.; Singh, S.P.; Ansari, K.M. Occurrence of Alternariol and Alternariolmonomethyl ether in edible oils: Their thermal stability and intake assessment in state of Uttar Pradesh, India. J. Food Sci. 2021, 86, 1124–1131. [Google Scholar] [CrossRef]
- Gonçalves, C.; Tölgyesi, Á.; Bouten, K.; Robouch, P.; Emons, H.; Stroka, J. Determination of Alternaria Toxins in Tomato, Wheat, and Sunflower Seeds by SPE and LC-MS/MS—A Method Validation Through a Collaborative Trial. J. AOAC Int. 2022, 105, 80–94. [Google Scholar]
- Zwickel, T.; Klaffke, H.; Richards, K.; Rychlik, M. Development of a high performance liquid chromatography tandem mass spectrometry based analysis for the simultaneous quantification of various Alternaria toxins in wine, vegetable juices and fruit juices. J. Chromatogr. A 2016, 1455, 74–85. [Google Scholar]
- Xing, J.; Zhang, Z.; Zheng, R.; Xu, X.; Mao, L.; Lu, J.; Shen, J.; Dai, X.; Yang, Z. Simultaneous Detection of Seven Alternaria Toxins in Mixed Fruit Puree by Ultra-High-Performance Liquid Chromatography-Tandem Mass Spectrometry Coupled with a Modified QuEChERS. Toxins 2021, 13, 808. [Google Scholar] [CrossRef]
- Ji, X.; Xiao, Y.; Jin, C.; Wang, W.; Lyu, W.; Tang, B.; Yang, H. Alternaria mycotoxins in food commodities marketed through e-commerce stores in China: Occurrence and risk assessment. Food Control 2022, 140, 109125. [Google Scholar] [CrossRef]
- Lattanzio, V.M.; Verdini, E.; Sdogati, S.; Bibi, R.; Ciasca, B.; Pecorelli, I. Monitoring Alternaria toxins in Italian food to support upcoming regulation. Food Addit. Contam. Part B 2022, 15, 42–51. [Google Scholar] [CrossRef] [PubMed]
- Janić Hajnal, E.; Kos, J.; Pezo, L.; Radić, B.; Malachová, A.; Krska, R.; Sulyok, M. Presence of Alternaria toxins in maize from Republic of Serbia during 2016–2017. J. Food Process. Preserv. 2021, 46, e15827. [Google Scholar] [CrossRef]
- AOAC International. Appendix F: Guidelines for Standard Method Performance Requirements. 2016. Available online: https://www.aoac.org/wp-content/uploads/2019/08/app_f.pdf (accessed on 7 September 2021).
- Fan, Y.; Liu, F.; He, W.; Qin, Q.; Hu, D.; Wu, A.; Jiang, W.; Wang, C. Screening of multi-mycotoxins in fruits by ultra-performance liquid chromatography coupled to ion mobility quadrupole time-of-flight mass spectrometry. Food Chem. 2022, 368, 130858. [Google Scholar] [CrossRef]
- Zhao, X.; Liu, D.; Yang, X.; Zhang, L.; Yang, M. Detection of seven Alternaria toxins in edible and medicinal herbs using ultra-high performance liquid chromatography-tandem mass spectrometry. Food Chem. X 2022, 13, 100186. [Google Scholar] [CrossRef]
- Gambacorta, L.; El Darra, N.; Fakhoury, R.; Logrieco, A.F.; Solfrizzo, M. Incidence and levels of Alternaria mycotoxins in spices and herbs produced worldwide and commercialized in Lebanon. Food Control 2019, 106, 106724. [Google Scholar] [CrossRef]
- Mujahid, C.; Savoy, M.; Baslé, Q.; Woo, P.M.; Ee, E.C.Y.; Mottier, P.; Bessaire, T. Levels of Alternaria toxins in selected food commodities including green coffee. Toxins 2020, 12, 595. [Google Scholar] [CrossRef] [PubMed]
- López, P.; Venema, D.; de Rijk, T.; de Kok, A.; Scholten, J.M.; Mol, H.G.; de Nijs, M. Occurrence of Alternaria toxins in food products in The Netherlands. Food Control 2016, 60, 196–204. [Google Scholar] [CrossRef]
- Bertuzzi, T.; Rastelli, S.; Pietri, A.; Giorni, P. Alternaria toxins in tomato products in Northern Italy in the period 2017–2019. Food Addit. Contam. Part B 2021, 14, 170–176. [Google Scholar] [CrossRef] [PubMed]
- European Committee for Standardization (CEN). Foodstuffs-Determination of Alternaria Toxins in Tomato, Wheat and Sunflower Seeds by SPE Clean-up and HPLC-MS/MS (SIST EN 17521:2021), 2021. ITEH STANDARDS. Available online: https://standards.iteh.ai/catalog/standards/cen/5b4c4bff-8ed1-40b6-8cde-193db3ca1158/en-17521-2021 (accessed on 16 November 2022).
- Korean National Health and Nutrition Examination Survey. Available online: https://www.khidi.or.kr/nutristat (accessed on 16 November 2022).


| Matrix | Chemical Group | Toxin | Slope | Intercept | R2 | LOD (μg/kg) | LOQ (μg/kg) |
|---|---|---|---|---|---|---|---|
| Rice | Dibenzo-α-pyrone derivatives | AOH | 38,024.7 | −4477.4 | 1.000 | 0.42 | 1.26 |
| AME | 557,506.5 | 525.4 | 1.000 | 0.23 | 0.69 | ||
| ALT | 21,640.4 | −5656.4 | 1.000 | 0.22 | 0.67 | ||
| Perylene quinone derivatives | ATX-I | 81,060.5 | −28,786.2 | 0.999 | 0.12 | 0.35 | |
| Cyclic tetrapeptide | TEN | 183,111.4 | 241,902.1 | 1.000 | 0.67 | 2.04 | |
| Tetramic acid | TeA | 20,620.1 | −23,613.1 | 1.000 | 0.38 | 1.16 | |
| Sesame | Dibenzo-α-pyrone derivatives | AOH | 37,644.2 | −5566.9 | 1.000 | 0.35 | 1.06 |
| AME | 481,012.8 | 296,681.0 | 0.999 | 0.62 | 1.87 | ||
| ALT | 14,857.9 | −6783.0 | 1.000 | 0.05 | 0.14 | ||
| Perylene quinone derivatives | ATX-I | 77,708.8 | −14,826.9 | 1.000 | 0.15 | 0.46 | |
| Cyclic tetrapeptide | TEN | 165,058.5 | 145,868.5 | 1.000 | 1.13 | 3.42 | |
| Tetramic acid | TeA | 18,454.9 | −2897.7 | 1.000 | 1.44 | 4.35 | |
| Tomato | Dibenzo-α-pyrone derivatives | AOH | 35,967.4 | −14,170.1 | 1.000 | 0.13 | 0.40 |
| AME | 651,313.1 | −9161.5 | 1.000 | 0.09 | 0.26 | ||
| ALT | 19,632.1 | −6452.2 | 1.000 | 0.24 | 0.72 | ||
| Perylene quinone derivatives | ATX-I | 85,741.1 | −16,991.5 | 1.000 | 0.35 | 1.05 | |
| Cyclic tetrapeptide | TEN | 239,237.6 | 194,783.3 | 1.000 | 1.42 | 4.30 | |
| Tetramic acid | TeA | 21,292.1 | −36,110.6 | 1.000 | 1.67 | 5.06 | |
| Apple juice | Dibenzo-α-pyrone derivatives | AOH | 36,592.4 | −3876.9 | 1.000 | 0.08 | 0.24 |
| AME | 460,716.3 | 80,147 | 1.000 | 0.22 | 0.67 | ||
| ALT | 18,358.9 | −3988.7 | 1.000 | 0.12 | 0.36 | ||
| Perylene quinone derivatives | ATX-I | 92,791.6 | 156.6 | 1.000 | 0.04 | 0.12 | |
| Cyclic tetrapeptide | TEN | 205,537.6 | 543,369.8 | 0.999 | 0.58 | 1.76 | |
| Tetramic acid | TeA | 20,161.3 | −21,619.0 | 1.000 | 0.55 | 1.68 |
| Matrix | Parameter | Spiking Level (μg/kg) * | Recovery (%) ± RSD% | |||||||||||||||||
|---|---|---|---|---|---|---|---|---|---|---|---|---|---|---|---|---|---|---|---|---|
| Dibenzo-α-Pyrone | Perylene Quinone | Cyclic Tetrapeptide | Tetramic Acid | |||||||||||||||||
| AOH | AME | ALT | ATX-I | TEN | TeA | |||||||||||||||
| Rice | Intra-day | I | 101.5 | ± | 11.1 | 95.3 | ± | 8.9 | 95.6 | ± | 8.9 | 114.7 | ± | 9.1 | 101.7 | ± | 9.9 | 90.4 | ± | 6.5 |
| II | 96.6 | ± | 5.3 | 89.4 | ± | 5.7 | 90.8 | ± | 4.9 | 101.3 | ± | 9.2 | 94.9 | ± | 5.0 | 87.8 | ± | 6.4 | ||
| III | 99.0 | ± | 5.0 | 93.3 | ± | 10.1 | 97.3 | ± | 4.3 | 105.6 | ± | 10.9 | 98.6 | ± | 7.6 | 88.0 | ± | 6.4 | ||
| Inter-day | I | 96.3 | ± | 12.1 | 87.0 | ± | 9.6 | 89.6 | ± | 11.9 | 102.8 | ± | 11.7 | 88.5 | ± | 11.5 | 90.1 | ± | 8.6 | |
| II | 101.8 | ± | 11.8 | 87.4 | ± | 8.6 | 96.1 | ± | 9.8 | 99.9 | ± | 13.2 | 98.7 | ± | 11.1 | 96.9 | ± | 11.1 | ||
| III | 102.2 | ± | 10.7 | 82.1 | ± | 9.3 | 100.3 | ± | 13.2 | 97.1 | ± | 11.3 | 97.0 | ± | 12.6 | 94.4 | ± | 15.6 | ||
| Sesame | Intra-day | I | 80.0 | ± | 6.3 | 82.2 | ± | 8.0 | 87.6 | ± | 5.6 | 84.3 | ± | 4.6 | 86.6 | ± | 4.6 | 94.9 | ± | 13.8 |
| II | 80.5 | ± | 5.6 | 82.0 | ± | 7.6 | 85.5 | ± | 2.5 | 82.8 | ± | 3.6 | 86.9 | ± | 2.8 | 81.5 | ± | 8.7 | ||
| III | 86.8 | ± | 8.7 | 85.4 | ± | 4.8 | 89.3 | ± | 5.1 | 86.7 | ± | 2.9 | 93.0 | ± | 3.3 | 84.9 | ± | 5.3 | ||
| Inter-day | I | 85.3 | ± | 9.6 | 86.1 | ± | 11.9 | 90.4 | ± | 9.4 | 85.7 | ± | 7.4 | 86.5 | ± | 8.5 | 91.8 | ± | 17.7 | |
| II | 82.7 | ± | 5.0 | 80.2 | ± | 6.9 | 87.8 | ± | 8.3 | 83.6 | ± | 4.8 | 86.1 | ± | 5.6 | 82.3 | ± | 8.4 | ||
| III | 89.9 | ± | 8.5 | 84.8 | ± | 6.0 | 90.2 | ± | 4.9 | 88.0 | ± | 2.9 | 94.2 | ± | 3.6 | 85.6 | ± | 9.9 | ||
| Tomato | Intra-day | I | 108.5 | ± | 11.0 | 97.2 | ± | 8.0 | 95.7 | ± | 8.0 | 96.5 | ± | 12.0 | 87.9 | ± | 8.9 | 88.0 | ± | 7.3 |
| II | 100.0 | ± | 11.7 | 91.9 | ± | 7.4 | 95.6 | ± | 11.1 | 95.7 | ± | 15.1 | 89.1 | ± | 11.2 | 84.1 | ± | 11.6 | ||
| III | 97.4 | ± | 13.7 | 104.3 | ± | 9.5 | 105.9 | ± | 7.0 | 102.5 | ± | 6.6 | 100.9 | ± | 6.9 | 90.3 | ± | 8.9 | ||
| Inter-day | I | 102.2 | ± | 10.6 | 87.2 | ± | 13.9 | 101.2 | ± | 9.2 | 92.2 | ± | 13.8 | 89.9 | ± | 6.2 | 85.0 | ± | 3.2 | |
| II | 99.4 | ± | 10.6 | 89.8 | ± | 7.8 | 92.0 | ± | 6.7 | 89.6 | ± | 6.9 | 86.6 | ± | 7.4 | 82.7 | ± | 7.4 | ||
| III | 107.1 | ± | 10.1 | 107.0 | ± | 10.5 | 110.7 | ± | 6.8 | 99.2 | ± | 9.4 | 106.3 | ± | 9.1 | 87.4 | ± | 4.1 | ||
| Apple juice | Intra-day | I | 96.0 | ± | 11.3 | 108.6 | ± | 12.9 | 114.3 | ± | 9.6 | 108.1 | ± | 9.3 | 95.5 | ± | 5.6 | 87.6 | ± | 12.2 |
| II | 92.5 | ± | 15.1 | 101.1 | ± | 12.4 | 103.1 | ± | 9.5 | 101.7 | ± | 9.9 | 92.4 | ± | 7.5 | 86.1 | ± | 9.8 | ||
| III | 104.5 | ± | 8.5 | 103.7 | ± | 12.1 | 108.9 | ± | 12.3 | 101.1 | ± | 12.7 | 93.3 | ± | 9.1 | 88.7 | ± | 6.9 | ||
| Inter-day | I | 88.6 | ± | 15.4 | 111.0 | ± | 9.7 | 105.9 | ± | 10.5 | 93.7 | ± | 10.2 | 88.0 | ± | 13.0 | 90.9 | ± | 13.9 | |
| II | 85.9 | ± | 4.1 | 105.5 | ± | 10.3 | 108.9 | ± | 14.1 | 97.5 | ± | 8.8 | 93.8 | ± | 10.9 | 88.0 | ± | 9.4 | ||
| III | 100.0 | ± | 7.5 | 110.4 | ± | 9.2 | 114.1 | ± | 5.8 | 106.8 | ± | 8.8 | 93.1 | ± | 8.1 | 95.2 | ± | 13.0 | ||
| Category | Food Product | Concentration (μg/kg) | |||||||||||||||||
|---|---|---|---|---|---|---|---|---|---|---|---|---|---|---|---|---|---|---|---|
| AOH | AME | ALT | ATX-I | TEN | TeA | ||||||||||||||
| Mean | Incidence 1 | Range | Mean | Incidence | Range | Mean | Incidence | Range | Mean | Incidence | Range | Mean | Incidence | Range | Mean | Incidence | Range | ||
| Cereal grains | Rice | . 2 | 0/6 | . | . | 0/6 | . | . | 0/6 | . | . | 0/6 | . | . | 0/6 | . | 3.84 | 5/6 | 1.26–10.68 |
| Brown rice | . | 0/5 | . | . | 0/5 | . | . | 0/5 | . | . | 0/5 | . | . | 0/5 | . | 5.18 | 2/5 | 7.89–18.01 | |
| Wheat flour | 1.53 | 1/5 | 7.63 | 0.56 | 1/5 | 2.78 | . | 0/5 | . | 0.56 | 2/5 | 0.63–2.18 | 1.74 | 1/5 | 8.72 | 32.67 | 2/5 | 4.00–159.34 | |
| Barley | . | 0/5 | . | 0.07 | 1/5 | 0.35 | . | 0/5 | . | . | 0/5 | . | . | 0/5 | . | 16.81 | 3/5 | 8.04–52.17 | |
| Sorghum | 4.53 | 3/5 | 1.01–19.17 | 2.63 | 3/5 | 0.36–11.29 | . | 0/5 | . | . | 0/5 | . | 3.48 | 2/5 | 2.77–14.64 | 51.73 | 3/5 | 10.38–219.56 | |
| Buckwheat | 26.68 | 4/5 | 3.41–105.49 | 6.18 | 5/5 | 0.45–21.89 | . | 0/5 | . | 2.17 | 2/5 | 3.06–7.81 | 5.75 | 3/5 | 4.80–13.00 | 21.65 | 4/5 | 6.73–38.51 | |
| Total | 5.28 | 8/31 | 1.01–105.49 | 1.52 | 10/31 | 0.35–21.89 | . | 0/31 | . | 0.44 | 4/31 | 0.63–7.81 | 1.77 | 6/31 | 2.77–14.64 | 21.39 | 19/31 | 1.26–219.56 | |
| Pulses | Soybean | . | 0/5 | . | . | 0/5 | . | . | 0/5 | . | . | 0/5 | . | . | 0/5 | . | . | 0/5 | . |
| Kidney bean | . | 0/5 | . | . | 0/5 | . | . | 0/5 | . | . | 0/5 | . | . | 0/5 | . | 0.35 | 1/5 | 1.75 | |
| Lentils | . | 0/5 | . | . | 0/5 | . | . | 0/5 | . | . | 0/5 | . | . | 0/5 | . | . | 0/5 | . | |
| Total | . | 0/15 | . | . | 0/15 | . | . | 0/15 | . | . | 0/15 | . | . | 0/15 | . | 0.12 | 1/15 | 1.75 | |
| Seasoning foods | Hot pepper powder | 2.08 | 4/6 | 0.66–5.76 | 0.41 | 4/6 | 0.20–1.12 | . | 0/6 | . | . | 0/6 | . | . | 0/6 | . | 1845.94 | 6/6 | 288.47–4028.18 |
| Tomato ketchup | 0.94 | 3/5 | 1.41–1.80 | 0.41 | 2/5 | 0.88–1.14 | . | 0/5 | . | . | 0/5 | . | . | 0/5 | . | 73.26 | 5/5 | 36.32–91.10 | |
| Tomato puree | 2.05 | 2/5 | 3.76–6.48 | . | 0/5 | . | . | 0/5 | . | . | 0/5 | . | . | 0/5 | . | 211.07 | 5/5 | 3.17–882.22 | |
| Total | 1.71 | 9/16 | 0.66–6.48 | 0.28 | 6/16 | 0.20–1.14 | . | 0/16 | . | . | 0/16 | . | . | 0/16 | . | 781.08 | 16/16 | 3.17–4028.18 | |
| Nuts and Seeds | Sesame | 0.17 | 1/7 | 1.41–3.30 | 11.21 | 4/7 | 3.12–56.91 | 0.16 | 1/7 | 1.13 | . | 0/7 | . | . | 0/7 | . | 15.53 | 5/7 | 10.74–56.49 |
| Perilla seed | 0.31 | 1/5 | 1.56–1.56 | . | 0/5 | . | . | 0/5 | . | . | 0/5 | . | 0.64 | 1/5 | 3.21 | 138.64 | 5/5 | 28.91–476.19 | |
| Black sesame | 43.85 | 4/5 | 15.67–94.97 | 106.49 | 4/5 | 17.82–310.82 | 3.95 | 4/5 | 2.29–10.71 | 0.41 | 1/5 | 2.04 | . | 0/5 | . | 335.66 | 5/5 | 10.31–911.63 | |
| Sunflower seed | 0.47 | 1/5 | 2.34 | . | 0/5 | . | . | 0/5 | . | . | 0/5 | . | 1.36 | 2/5 | 3.20–3.58 | 30.29 | 3/5 | 34.34–70.87 | |
| Total | 10.20 | 7/22 | 1.41–94.97 | 27.77 | 8/22 | 3.12–310.82 | 0.95 | 5/22 | 1.13–10.71 | 0.09 | 1/22 | 2.04 | 0.45 | 3/22 | 3.20–3.58 | 119.62 | 18/22 | 10.31–911.63 | |
| Beverages | Apple juice | . | 0/5 | . | . | 0/5 | . | . | 0/5 | . | . | 0/5 | . | . | 0/5 | . | . | 0/5 | . |
| Orange juice | . | 0/5 | . | . | 0/5 | . | . | 0/5 | . | . | 0/5 | . | . | 0/5 | . | 4.31 | 2/5 | 6.47–15.10 | |
| Grape juice | . | 0/5 | . | . | 0/5 | . | . | 0/5 | . | . | 0/5 | . | . | 0/5 | . | . | 0/5 | . | |
| Tomato juice | 1.18 | 3/5 | 1.06–3.32 | . | 0/5 | . | . | 0/5 | . | . | 0/5 | . | . | 0/5 | . | 13.51 | 2/5 | 23.61–43.92 | |
| Black tea | . | 0/3 | . | . | 0/3 | . | . | 0/3 | . | . | 0/3 | . | . | 0/3 | . | . | 0/3 | . | |
| Corn silk tea | . | 0/3 | . | . | 0/3 | . | . | 0/3 | . | . | 0/3 | . | . | 0/3 | . | . | 0/3 | . | |
| Barley tea | . | 0/3 | . | . | 0/3 | . | . | 0/3 | . | . | 0/3 | . | . | 0/3 | . | . | 0/3 | . | |
| Soybean milk | . | 0/3 | . | . | 0/3 | . | . | 0/3 | . | 0.52 | 2/3 | 0.50–1.04 | . | 0/3 | . | . | 0/3 | . | |
| Total | 0.18 | 3/32 | 1.06–3.32 | . | 0/32 | . | . | 0/32 | . | 0.05 | 2/32 | 0.50–1.04 | . | 0/32 | . | 2.78 | 4/32 | 6.47–43.92 | |
| Vegetables | Tomato | . | 0/6 | . | . | 0/6 | . | . | 0/6 | . | . | 0/6 | . | . | 0/6 | . | . | 0/6 | . |
| Onion | . | 0/5 | . | . | 0/5 | . | . | 0/5 | . | . | 0/5 | . | . | 0/5 | . | . | 0/5 | . | |
| Korean cabbage | . | 0/5 | . | . | 0/5 | . | . | 0/5 | . | . | 0/5 | . | . | 0/5 | . | . | 0/5 | . | |
| Total | . | 0/16 | . | . | 0/16 | . | . | 0/16 | . | . | 0/16 | . | . | 0/16 | . | . | 0/16 | . | |
| Fruits | Apple | . | 0/5 | . | 0.06 | 1/5 | 0.3 | . | 0/5 | . | . | 0/5 | . | . | 0/5 | . | 1.14 | 1/5 | 5.69 |
| Mandarin | . | 0/5 | . | . | 0/5 | . | . | 0/5 | . | . | 0/5 | . | . | 0/5 | . | . | 0/5 | . | |
| Grape | . | 0/5 | . | . | 0/5 | . | . | 0/5 | . | . | 0/5 | . | . | 0/5 | . | 0.78 | 1/5 | 3.88 | |
| Watermelon | . | 0/5 | . | . | 0/5 | . | . | 0/5 | . | . | 0/5 | . | . | 0/5 | . | . | 0/5 | . | |
| Total | . | 0/20 | . | 0.01 | 1/20 | 0.3 | . | 0/20 | . | . | 0/20 | . | . | 0/20 | . | 0.48 | 2/20 | 3.88–5.69 | |
| Scenario | Toxins | Daily Dietary Exposure (ng/kg b.w./day) | |||||||||||||
|---|---|---|---|---|---|---|---|---|---|---|---|---|---|---|---|
| Cereal Grains | Pulses | Nuts and Seeds | Beverages | Seasoning Foods | Vegetables | Fruits | |||||||||
| LB | UB | LB | UB | LB | UB | LB | UB | LB | UB | LB | UB | LB | UB | ||
| Mean food intake | AOH | 0.0255 | 0.2006 | 0.0000 | 0.0075 | 0.0041 | 0.0053 | 0.0168 | 0.0323 | 0.0362 | 0.0382 | 0.0000 | 0.0353 | 0.0000 | 0.0347 |
| AME | 0.0109 | 0.1061 | 0.0000 | 0.0041 | 0.0430 | 0.0445 | 0.0000 | 0.0446 | 0.0087 | 0.0111 | 0.0000 | 0.0245 | 0.0081 | 0.0297 | |
| ALT | 0.0000 | 0.0924 | 0.0000 | 0.0039 | 0.0008 | 0.0010 | 0.0000 | 0.0243 | 0.0000 | 0.0039 | 0.0000 | 0.0652 | 0.0000 | 0.0642 | |
| ATX-I | 0.0078 | 0.0576 | 0.0000 | 0.0021 | 0.0000 | 0.0007 | 0.0079 | 0.0156 | 0.0000 | 0.0019 | 0.0000 | 0.0951 | 0.0000 | 0.0936 | |
| TEN | 0.0267 | 0.3062 | 0.0000 | 0.0119 | 0.0008 | 0.0054 | 0.0000 | 0.1176 | 0.0000 | 0.0141 | 0.0000 | 0.3859 | 0.0000 | 0.3796 | |
| TeA | 2.2538 | 2.2865 | 0.0010 | 0.0076 | 0.2043 | 0.2057 | 0.4041 | 0.5017 | 22.9266 | 22.9266 | 0.0000 | 0.4538 | 0.1759 | 0.5676 | |
| Extreme food intake (P95) | AOH | 0.4782 | 0.9302 | 0.0000 | 0.0309 | 0.0065 | 0.0111 | 0.0168 | 0.0323 | 0.1527 | 0.1609 | 0.0000 | 0.1675 | 0.0000 | 0.2455 |
| AME | 0.2580 | 0.5018 | 0.0000 | 0.0169 | 0.1414 | 0.1470 | 0.0000 | 0.0446 | 0.0434 | 0.0552 | 0.0000 | 0.1159 | 0.0705 | 0.2192 | |
| ALT | 0.0000 | 0.2507 | 0.0000 | 0.0162 | 0.0022 | 0.0029 | 0.0000 | 0.0243 | 0.0000 | 0.0173 | 0.0000 | 0.3092 | 0.0000 | 0.4532 | |
| ATX-I | 0.0428 | 0.1759 | 0.0000 | 0.0088 | 0.0000 | 0.0024 | 0.0079 | 0.0156 | 0.0000 | 0.0078 | 0.0000 | 0.4509 | 0.0000 | 0.6609 | |
| TEN | 0.4108 | 1.1425 | 0.0000 | 0.0493 | 0.0026 | 0.0196 | 0.0000 | 0.1176 | 0.0000 | 0.0662 | 0.0000 | 1.8293 | 0.0000 | 2.6813 | |
| TeA | 11.5228 | 11.6342 | 0.0010 | 0.0287 | 0.7277 | 0.7327 | 0.4041 | 0.5017 | 86.0728 | 86.0728 | 0.0000 | 2.1514 | 1.3746 | 4.1193 | |
Publisher’s Note: MDPI stays neutral with regard to jurisdictional claims in published maps and institutional affiliations. |
© 2022 by the authors. Licensee MDPI, Basel, Switzerland. This article is an open access article distributed under the terms and conditions of the Creative Commons Attribution (CC BY) license (https://creativecommons.org/licenses/by/4.0/).
Share and Cite
Woo, S.Y.; Lee, S.Y.; Jeong, T.K.; Park, S.M.; Auh, J.H.; Shin, H.-S.; Chun, H.S. Natural Occurrence of Alternaria Toxins in Agricultural Products and Processed Foods Marketed in South Korea by LC–MS/MS. Toxins 2022, 14, 824. https://doi.org/10.3390/toxins14120824
Woo SY, Lee SY, Jeong TK, Park SM, Auh JH, Shin H-S, Chun HS. Natural Occurrence of Alternaria Toxins in Agricultural Products and Processed Foods Marketed in South Korea by LC–MS/MS. Toxins. 2022; 14(12):824. https://doi.org/10.3390/toxins14120824
Chicago/Turabian StyleWoo, So Young, Sang Yoo Lee, Tae Kyun Jeong, Su Mi Park, Joong Hyuck Auh, Han-Seung Shin, and Hyang Sook Chun. 2022. "Natural Occurrence of Alternaria Toxins in Agricultural Products and Processed Foods Marketed in South Korea by LC–MS/MS" Toxins 14, no. 12: 824. https://doi.org/10.3390/toxins14120824
APA StyleWoo, S. Y., Lee, S. Y., Jeong, T. K., Park, S. M., Auh, J. H., Shin, H.-S., & Chun, H. S. (2022). Natural Occurrence of Alternaria Toxins in Agricultural Products and Processed Foods Marketed in South Korea by LC–MS/MS. Toxins, 14(12), 824. https://doi.org/10.3390/toxins14120824