Abstract
Clostridium perfringens is a Gram-positive bacterium that possess seven toxinotypes (A, B, C, D, E, F, and G) that are responsible for the production of six major toxins, i.e., α, β, ε, ι, CPE, and NetB. The aim of this study is to find out the occurrence of toxinotypes in buffalo and cattle of Punjab province in Pakistan and their corresponding toxin-encoding genes from the isolated toxinotypes. To accomplish this aim, six districts in Punjab province were selected (i.e., Lahore, Sahiwal, Cheecha Watni, Bhakkar, Dera Ghazi Khan, and Bahawalpur) and a total of 240 buffalo and 240 cattle were selected for the collection of samples. From isolation and molecular analysis (16S rRNA), it was observed that out of seven toxinotypes (A–G), two toxinotypes (A and D) were found at most, whereas other toxinotypes, i.e., B, C, E, F, and G, were not found. The most frequently occurring toxinotype was type A (buffalo: 149/240; cattle: 157/240) whereas type D (buffalo: 8/240 cattle: 7/240) was found to occur the least. Genes encoding toxinotypes A and D were cpa and etx, respectively, whereas genes encoding other toxinotypes were not observed. The occurrence of isolated toxinotypes was studied using response surface methodology, which suggested a considerable occurrence of the isolated toxinotypes (A and D) in both buffalo and cattle. Association between type A and type D was found to be significant among the isolated toxinotypes in both buffalo and cattle (p ≤ 0.05). Correlation was also found to be positive and significant between type A and type D. C. perfringens exhibits a range of toxinotypes that can be diagnosed via genotyping, which is more reliable than classical toxinotyping.
1. Introduction
The livestock industry is one of the fastest-growing and most financially important sub-sectors of the economy in developing countries such as Pakistan, accounting for a 60.54% value addition to the Pakistani agricultural sector and contributing 11.22% to the GDP (gross domestic product). Furthermore, it makes a significant contribution to rural economic growth, where 40% of the population is dependent on livestock. Unfortunately, over the last decade, the bovine industry has significantly declined due to infectious diseases [1].
Clostridium perfringens is well known for its ability to express a wide variety of exotoxins/enzymes. The pathogenesis of C. perfringens diseases is directly associated with its prolific toxin-producing ability [2,3,4]. The epsilon toxin (ETX) is considered the most potent toxin produced by this bacteria and it has been also considered a category B toxin by the Centers for Disease Control (CDC) for its potential use in bioterrorism [5,6]. This toxin is produced by C. perfringens types B and D as a prototoxin, activated through proteolytic cleavage by the animal’s trypsin, quimotrypsin, or C. perfringens zinc-metalloprotease and then absorbed into the blood stream, affecting other organs such as the brain [6,7]. The pathogenic clostridial species can be classified into three groups based on their toxin activity (enterotoxic, histotoxic, and neurotoxic) on target tissues [8]. C. perfringens type A has been and is still frequently blamed for enteritis, abomasitis, and/or enterotoxaemia in cattle [9]. The coding gene (CPA) is highly conserved and thus present in all strains of C. perfringens [10]. CPA plays a critical role in the pathogenesis of gas gangrene in humans and animals [11,12]. However, in recent years, multiple lines of evidence from several well-designed studies mainly based on molecular Koch’s postulates demonstrated the critical role of CPA in the pathogenesis of bovine necro-hemorrhagic enteritis [13,14,15]. C. perfringens toxinotype D isolates tend to produce alpha and epsilon toxins, which are encoded by the plc and etx genes, leading to the development of enterotoxaemia (“pulpy kidney”) in sheep and goats [16,17,18]. C. perfringens type D (epsilon toxin) is responsible for enterotoxaemia in sheep, goats, and cattle [19].
Although C. perfringens can exist as part of the normal intestinal microflora, under certain conditions where the physiological balance of the intestine is altered, abnormal proliferation of this microorganism can result in the production of a wide variety of toxins. There are very few reports on the toxin profile of C. perfringens isolates recovered from buffalo and cattle in Pakistan. More comprehensive information about C. perfringens types A and D in these animals is also lacking. As such, the aim of this study is to determine the occurrence of major toxinotypes and their corresponding toxins produced by C. perfringens in buffalo and cattle. Furthermore, a molecular characterization was carried out to find out the toxin-encoding genes causing enterotoxaemia in bovines (buffalo and cattle). The statistical optimization would predict the possible occurrence of the isolated toxinotypes (A and D) in buffalo and cattle. This approach could serve as a predictor for the determination of possible occurrence in the bovine population of Punjab province, Pakistan.
2. Results
2.1. Geographical Distribution of C. perfringens Toxinotypes in Sampled Areas of Punjab Province in Pakistan
During the sample collection from six districts of Punjab province, Pakistan, we surveyed various farms and household animals for the occurrence of all C. perfringens toxinotypes (A–G). The most prevalent toxin genotypes were type A (plc) and type A (plc + β2), as most of the infected animals showed both of these genotypes at a maximum rate. In Central Punjab (Lahore, Sahiwal, and Cheecha Watni), 60% of the sampled buffalo and 73% of the sampled cattle and in Southern Punjab (Bhakkar, Dera Ghazi Khan, and Bahawalpur), 64% of sampled buffalo and 57% of the sampled cattle showed the type A (plc) genotype. In total, 149 buffalo out of 240 and 22 buffalo out of 240 showed Type A (plc + etx) and Type A (plc + β2) genotypes, respectively, whereas 157 cattle out of 240 and 21 cattle out of 240 showed type A (plc) and type A (plc + β2) genotypes, respectively, in both Central and Southern Punjab. Type D (plc + β2 + etx) showed less abundance in both buffalo and cattle (Table 1). The occurrence of these toxinotypes in both regions is illustrated in Figure 1, in which each site has its own abundance of toxinotypes of C. perfringens origin. Conclusively, toxinotype A was found more compared to toxinotype D. Other toxinotypes (B, C, E, F, and G) were not observed in either buffalo or cattle.

Table 1.
Frequency and percentage of C. perfringens toxinotypes A (plc), A (plc + β2), D (plc + etx), and D (plc + β2 + etx) isolated from buffalo and cattle in sampled areas of Central and Southern Punjab province in Pakistan.
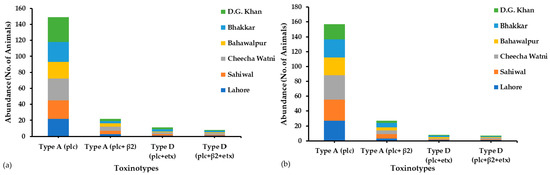
Figure 1.
Abundance of C. perfringens toxinotypes in (a) buffalo and (b) cattle samples collected from Central and Southern Punjab province, Pakistan.
2.2. Isolation of Toxinotypes Isolated from C. perfringens in Buffalo and Cattle
After the isolation of C. perfringens and identification of toxin genotypes in both buffalo and cattle, type A (plc) showed maximum incidence in both buffalo and cattle, as all the examined animals were found prone to this genotype (Figure 2). Type D (plc + β2 + etx) was found to be minimum in buffalo and cattle. Type A-based toxinotypes were found more compared to type D-based toxinotypes.
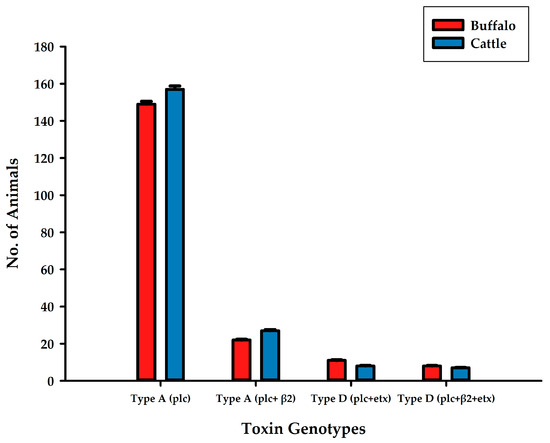
Figure 2.
Availability of toxin genotypes A (plc), A (plc + β2), D (plc + etx), D (plc + β2 + etx) isolated from C. perfringens in buffalo and cattle samples from different cities in Central and Southern Punjab province, Pakistan.
2.3. Principal Component Analysis of Toxinotypes in Buffalo and Cattle
The principal component analysis was performed to find out the relationship among the toxinotypes of C. perfringens in buffalo and cattle. According to this analysis, a PCA plot was for both Buffalo and cattle separately.
In buffalo, both principal components PC1and PC2 accounted for 32% and 26% variation among the toxinotypes of bacterial origin, respectively. Genotype A (plc) exhibited significant association with all other genotypes except type D (plc + etx), whereas a significant association was observed in the case of other genotypes among each other (p ≤ 0.05). Type A (plc + β2) and type D (plc + β2 + etx) showed slightly non-significant association and type D (plc + β2 + etx) also showed non-significant association with type A (plc + β2) but significant association was observed with type D (plc + etx). Type A (plc + β2) and (plc + β2) showed maximum response compared to genotype D (plc + etx) in contribution level (Figure 3).
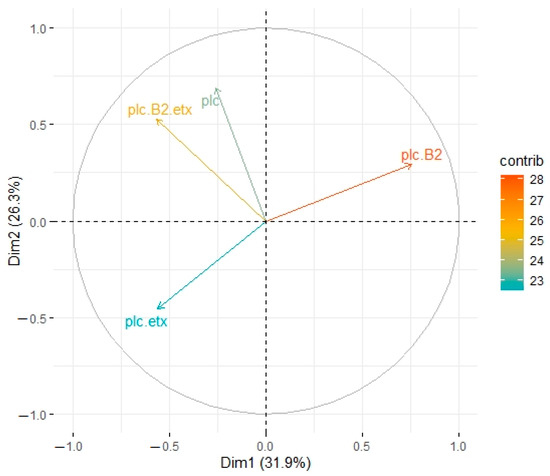
Figure 3.
Principle component analysis of toxinotypes isolated from C. perfringens in buffalo. Type A (plc) is represented by a blue line, type A (plc + β2) is represented by an orange line, type D (plc + etx) is represented by a red line, and type D (plc + β2 + etx) is represented by a green line.
In cattle, PC1 accounted for 37% whereas PC2 accounted for 25% of variation among different genotypes (Figure 4). Genotype A (plc + β2) displayed significant association with type A (plc) and type D (plc + etx), whereas non-significant connotation was observed in the case of type D (plc + β2 + etx). Type A (plc + β2) had maximum response and type A (plc), type D (plc + etx), and type D (plc + β2 + etx) were subsequently less responsive in contribution level (Figure 4).
Figure 4.
Principle component analysis of toxinotypes isolated from C. perfringens in cattle. Type A (plc) is represented by a blue line, type A (plc + β2) is represented by a blue line, type D (plc + etx) is represented by a red line, and type D (plc + β2 + etx) is represented by a green line.
From the PCA plot of both cattle and buffalo it can be assured that all the toxinotypes had significant variation.
2.4. Correlation among the Toxinotypes of C. perfringens in Buffalo
Correlation was estimated between various toxinotypes of C. perfringens in buffalo, and significant correlation was observed. A significant and positive correlation was observed between toxinotypes A (plc) and A (plc + β2) (r = 0.03), which revealed that type A (plc) and type A (plc + β2) showed slightly less correlation with each other. The correlation between genotype A (plc) and D (plc + etx) was also found to be positive and significant (r = 0.06), which revealed much less relationship among the correlated genotypes. As far as the correlation between type A (plc) and type D (plc + β2 + etx) was concerned, there existed an appropriate correlation between said genotypes. Observing these genotypes, a positive and significant correlation was observed (r = 0.11). Looking at genotype A (plc + β2) and D (plc + etx), significant and negative correlation was observed (r = –0.2). Correlation between type A (plc + β2) and type D (plc + β2 + etx) was also found to be negative and significant (r = –0.19), whereas correlation between toxinotypes D (plc + etx) and D (plc + β2 + etx) was found to be slightly negative and significant, as they were found to be inverse to each other (r = –0.02). Observing the correlation matrix among the toxin genotype clarified that the type A (plc) toxin genotype was positive and the correlations among type A (plc + β2), type D (plc + etx), and type D (plc + β2 + etx) was found to be negative and had their own significant impact (Figure 5). This relationship among the toxinotypes were also illustrated with the regression analysis, which also depicted the same response as the correlation matrix (Figure 6).
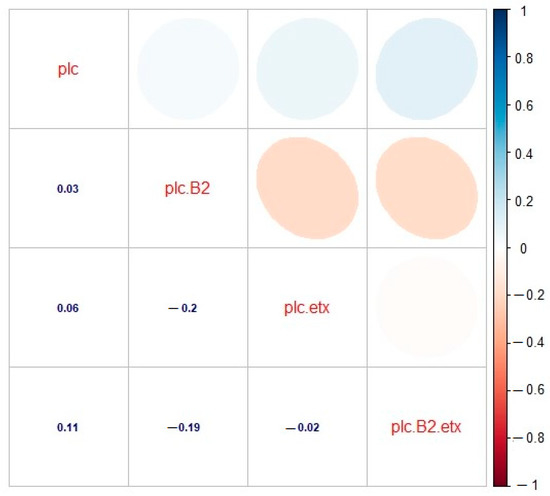
Figure 5.
Correlation analysis for toxinotypes A (plc), A (plc + β2), D (plc + etx), and D (plc + β2 + etx) of C. perfringens in buffalo. plc: type A (plc), plc.B2: type A (plc + β2), plc.etx: type D (plc + etx), plc.B2.etx: type D (plc + β2 + etx). The digits in blue depict and the ellipses describe the r value (correlation value) of the tested toxinotypes.
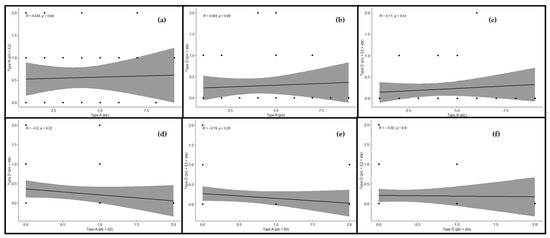
Figure 6.
Relationship among toxinotypes of C. perfringens in buffalo using regression analysis. The regression line shows the extent of correlation among the genotypes. Regression analysis between (a) type A (plc) and type A (plc + β2), (b) type A (plc) and type D (plc + etx), (c) type A (plc) and type D (plc + β2 + etx), (d) type A (plc + β2) and type D (plc + etx), (e) type A (plc + β2) and type D (plc + β2 + etx), and (f) type D (plc + etx) and type D (plc + β2 + etx). “R” depicts the extent of correlation and “p” depicts the level of significance (p ≤ 0.05).
2.5. Correlation among the Toxinotypes of C. perfringens in Cattle
In cattle, the correlation among the toxinotypes was found to be significant. The correlation between genotypes A (plc) and A (plc + β2) was found to be significant and positive (r = 0.11), as there was some relation between them. The correlation was found to be positive and significant in the case of genotypes A (plc) and D (plc + etx), as they depicted a significant correlation between them (r = 0.22). There also existed a positive and significant correlation between genotypes A (plc) and D (plc + β2 + etx), as both genotypes showed a strong relationship with each other (r = 0.26). Looking at the correlation between genotypes A (plc + β2) and D (plc + etx), a positive and significant correlation (r = 0.17) was observed, which shows some sort of significance among these genotypes. The correlation between genotypes A (plc + β2) and D (plc + β2 + etx) was found to be positive and significant, as they had an adequate relationship with each other (r = 0.02), and the correlation between genotypes D (plc + etx) and D (plc + β2 + etx) was found to be positive (r = 0.18) and significant, as their relationship was substantial (Figure 7).
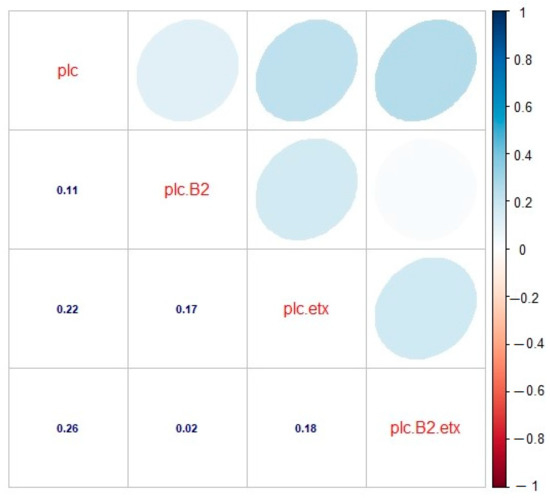
Figure 7.
Correlation analysis for toxinotypes A (plc), A (plc + β2), D (plc + etx), and D (plc + β2 + etx) of C. perfringens in cattle. plc: type A (plc), plc.B2: type A (plc + β2), plc.etx: type D (plc + etx), plc.B2.etx: type D (plc + β2 + etx). The digits in blue depict and the ellipses describe the r value (correlation value) of the tested toxinotypes.
From the correlation matrix it was confirmed that all the toxinotypes exhibited significant and positive correlation with each other. This association among the toxinotypes was also illustrated in the regression analysis, which also depicted the same response as the correlation matrix (Figure 8).
Figure 8.
Relationship among toxinotypes of C. perfringens in cattle using regression analysis. The regression line shows the extent of correlation among the genotypes. Regression analysis between (a) type A (plc) and type A (plc + β2), (b) type A (plc) and type D (plc + etx), (c) type A (plc) and type D (plc + β2 + etx), (d) type A (plc + β2) and type D (plc + etx), (e) type A (plc + β2) and type D (plc + β2 + etx), and (f) type D (plc + etx) and type D (plc + β2 + etx). “R” depicts the extent of correlation and “p” depicts the level of significance (p < 0.05).
2.6. Cluster Analysis of C. perfringens Toxinotypes in Buffalo and Cattle
For the determination of relative abundance of C. perfringens toxinotypes, a heatmap was developed that assessed the approximate amount of prevalent toxinotypes in buffalo and cattle. Type A (plc) was found to be more abundant among most buffalo and cattle. Type A (plc + β2) was found to be more abundant in both buffalo and cattle. Buffaloes with type D (plc + etx) and type D (plc + β2 + etx) were found to be less abundant compared to type A. It can be concluded that all toxinotypes showed appearance in both buffalo and cattle but type A (plc) showed maximum appearance among all the toxinotypes (Figure 9).
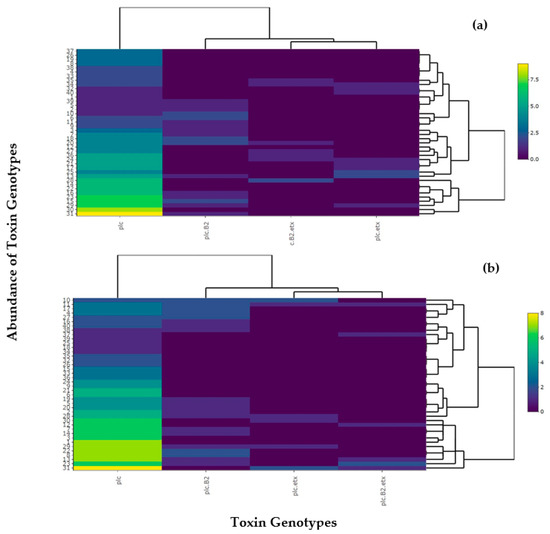
Figure 9.
Visualization of heatmap for relative abundance of toxinotypes present in C. perfringens in (a) buffalo and (b) cattle. Different colors in the figure shows the abundance of toxinotypes and the gradient shows the availability level of the toxinotypes in the animals according to the scale mentioned on the right side.
From the heatmap, toxin reactivity and interaction among the toxin was depicted and the prevalence of these toxinotypes was appropriately assessed per animal (buffalo and cattle).
2.7. Optimization of All Toxinotypes in C. perfringens of Buffalo and Cattle Using Response Surface Methodology
All the toxinotypes of C. perfringens that came under investigation were assessed based on response surface methodology via Box–Behnken design. The following quadratic response surface model was fitted to the data.
where “Y” is the abundance of toxinotypes in buffalo and cattle, “β0” is the intercept constant, and “βi”, “βii”, and “βij” are the regression coefficients. “Fi” and “Fj” re coded values of the toxinotypes and “ε” is the error term. The distribution of coded variables to the toxintotypes is mentioned in Table 2.
Table 2.
A design approach for determining the optimization of toxinotypes of C. perfringens in buffalo and cattle via Box–Behnken design.
For the optimization of toxinotypes, an analysis of variance was performed via quadratic model and the abundance of these genotypes was checked in buffalo and cattle. The following regression equation was obtained in buffalo:
Y = 2.791 + 0.417 A − 0.386 B − 0.255 C − 0.0033 D − 0.071 AB − 0.048 AC + 0.00 AD + 0.0875 BC − 0.0071 BD + 0.130 CD − 0.0011 A² + 0.0627 B² − 0.0798 C² + 0.0039 D²
According to this regression equation, type A (plc) had a positive effect as well as increasing abundance whereas type A (plc + β2) showed a negative effect. Type D (plc + etx) and type D (plc + β2 + etx) also showed a negative effect. The interaction between all toxinotypes was found to be negative whereas the interaction of type D (plc + etx) with type D (plc + β2 + etx) showed positive impact. The squares of all toxin genotypes A (plc) and D (plc + etx) showed a negative impact and the remaining genotypes showed a positive impact.
According to analysis of variance (Table 3), the model fitted was found to be significant, as the p-value was less than 0.05. All the toxinotypes were also found to be significant (p < 0.05). The interaction of all the toxinotypes was also found to be significant except for type A (plc) and type D (plc + β2 + etx), which implies that all the toxinotypes showed substantial abundance in combinations as well. This reveals that C. perfringens has an appropriate abundance of genotypes that have high infectivity.
Table 3.
Analysis of variance of C. perfringens-based toxinotypes (type A (plc), type A (plc + β2), type D (plc + etx), and type D (plc + β2 + etx)) for a quadratic model in buffalo via Box–Behnken design.
Based on the analysis of variance applied to this model, it became obvious that this model showed significant response at the 5% level of significance and this model was also very suitable and reproducible due to having very little lack of fit (p > 0.05). Thus, the optimum parameters were also defined as shown in Table 3 and Figure 10. The contour and surface plots developed based upon this analysis also show that C. perfringens has a substantial amount of toxinotypes that can pose a huge effect on the health of buffalo.
Figure 10.
Optimization of toxinotypes of C. perfringens in buffalo via response surface methodology. Contour and surface plots of (a) type A (plc) with type A (plc+ β2), (b) type A (plc) and type D (plc + etx), (c) type A (plc) and type D (plc+ β2 + etx), (d) type A (plc+ β2) and type D (plc+ β2 + etx), (e) type A (plc+ β2) and type D (plc+ β2 + etx), and (f) type D (plc + etx) and type D (plc+ β2 + etx).
According to the values mentioned in Table 4, it was concluded that in runs 5 and 11, the buffalo showed a maximum abundance of all four genotypes present in C. perfringens.
Table 4.
Observed and predicted values of C. perfringens toxinotypes (type A (plc), type A (plc + β2), type D (plc + etx), type D (plc + β2 + etx)) for a quadratic model in buffalo obtained after optimization analysis from response surface methodology via Box–Behnken design.
For the optimization of toxinotypes of C. perfringens in cattle, the following regression equation was found.
Y = 2.83 + 0.539 A − 0.586 B − 0.0768 C − 0.07685 D − 0.144 AB − 0.0208 AC − 0.0208 AD + 0.0431 BC + 0.0431 BD + 0.115 CD − 0.0135 A² + 0.1234 B² − 0.0741 C² − 0.0741 D²
According to the regression equation, all the toxinotypes showed negative responses except type A (plc). The interaction of all toxinotypes was found to be significant but negative except for type A (plc + β2) with type D (plc + etx) and type A (plc + β2) and type D (plc + β2 + etx), which were found to be positive. This shows that all the toxinotypes showed significant abundance in combinations. This reveals that C. perfringens has an appropriate abundance of genotypes in cattle that also have high infectivity. The squares of all the genotypes responded negatively except for type A (plc + β2).
All the variables, along with their interaction and squares, were found to be significant. Based on the analysis of variance (Table 5) applied to this model, it became obvious that this model showed significant response at the 5% level of significance and this model was also very suitable and reproducible due to having very little lack of fit (p > 0.05). The coefficient of determination (R2) also confirmed that with 99% surety this data is highly significant and can be applied under various conditions. Thus, the optimum parameters were also defined as shown in Table 5. The contour and surface plots (Figure 11) developed based upon this analysis also depict that C. perfringens has substantial amount of toxinotypes that can pose a huge effect on the health of cattle.
Table 5.
Analysis of variance of C. perfringens-based toxinotypes (type A (plc), type A (plc + β2), type D (plc + etx), type D (plc + β2 + etx)) for a quadratic model in cattle via Box–Behnken design.
Figure 11.
Optimization of toxinotypes of C. perfringens in cattle via response surface methodology. Contour and surface plots of (a) type A (plc) with type A (plc+ β2), (b) type A (plc) and type D (plc + etx), (c) type A (plc) and type D (plc+ β2 + etx), (d) type A (plc+ β2) and type D (plc+ β2 + etx), (e) type A (plc+ β2) and type D (plc+ β2 + etx), and (f) type D (plc + etx) and type D (plc+ β2 + etx).
According to the values mentioned in Table 6, it was concluded that in runs 9, 26, and 27, cattle showed the maximum abundance of all four genotypes present in C. perfringens.
Table 6.
Observed and predicted values of C. perfringens toxinotypes (type A (plc), type A (plc + β2), type D (plc + etx), and type D (plc + β2 + etx)) for a quadratic model in cattle obtained after optimization analysis from response surface methodology via Box–Behnken design.
Toxin genotypes were assessed using optimization by response surface methodology. All the applicable methods which can predict the occurrence of genotypes are presented in Table 7 and Figure 12.
Table 7.
Summary statistics for responses used in the models.
Figure 12.
Validation of the model for (a) buffalo (b) cattle of C. perfringens toxinotypes in Punjab province, Pakistan.
3. Discussion
C. perfringens is a bacterium that has widespread occurrence and is capable of producing certain enzymes that have hydrolytic and toxic properties. Several pathovars of this bacterium evolve due to variable regions in chromosomes that encode toxin-producing genes. Each toxin-producing gene has certain genotypes that cause specific disease symptoms. For the purpose of pathovar identification, toxin genotyping has been found to be more consistent than classical toxinotyping [20].
Depending upon the pathovars of C. perfringens there are seven toxinotypes (A, B, C, D, E, F, and G) that mostly occur worldwide and produce six major toxins, i.e., α, β, ε, ι, CPE, and NetB [21]. Upon infection with the strain, these toxins cause toxicity in the host at an exponential growth rate [22,23,24]. Each toxin has its own specific properties and every toxin is accompanied with a certain disease either in humans or in animals [25]. The most commonly occurring genotype is type A, with widespread incidence as it causes human gangrene due to its α-toxin, θ-toxin, and several hydrolytic enzymes. Furthermore, it also exhibits an enterotoxin known as CPE, which causes gastrointestinal problems, particularly food poisoning [26]. Type A consists of the cpe gene, which causes food poisoning, fattening, and diarrhea. From the cpe gene, the identification of enterotoxigenic pathovars is possible [27,28]. Another novel toxin, β-2, has been identified, originally known as toxin type C, and is involved in necrotic enteritis. The strain can be effectively managed via vaccination [29,30].
The current study was aimed at sorting out the toxinotypes based on C. perfringens origins in cattle and buffalo in Punjab province of Pakistan. Out of all the toxinotypes (A–G), the most prevalent toxin genotypes were type A (plc) and type A (plc + β2), as most of the infected animals showed both of these genotypes at a maximum rate. In Central Punjab (Lahore, Sahiwal, and Cheecha Watni), 60% of the sampled buffalo and 73% of the sampled cattle and in Southern Punjab (Bhakkar, Dera Ghazi Khan, and Bahawalpur), 64% of sampled buffalo and 57% of the sampled cattle showed the type A (plc) genotype. In total, 149 buffalo out of 240 and 22 buffaloes out of 240 showed type A (plc + etx) and type A (plc + β2) genotypes, respectively, whereas 157 cattle out of 240 and 21 cattle out of 240 showed type A (plc) and type A (plc + β2) genotypes, respectively, in both Central and Southern Punjab. Other toxinotypes (B, C, E, F, and G) were not observed after PCR detection.
These results are in some agreement with Forti et al. (2020) [31], who examined 632 C. perfrignens isolates in Italy. Through PCR, it was observed that 93% of the total strains exhibited toxinotype A, type D was found in 3% isolates, type F was observed in 2.5%, and type B and type E were found much less. Type G was not found in any of the observed strains.
Marks et al. (2002) also described that C. perfringens showed type A and type D toxin forms in dogs. When C. perfringens infected the dogs there were two genotypes that were found responsible for causing diarrhea in them [32]. Moreover, Twedt (1993) [33] also reported that the strains of C. perfringens that produce the toxins can be primarily detected via diarrhea symptoms and feces of the infected host. C. perfringens shows 30–60% infection among various species of animals and birds [34,35].
During the study, the toxinotypes were analyzed according to their principal components in both buffalo and cattle. All the toxinotypes were found to be significantly associated with each other in buffalo and cattle. These findings show an association with Ferrarezi et al. (2008), Guran et al. (2013), and Yadav et al. (2017) [36,37,38] who observed that genotypes A and D showed some association in neonatal calves and chickens along with their related genes but that their role could be varied to a certain extent. In humans, these genotypes can cause gastrointestinal diseases, and infectivity has also been observed in milk-producing animals. Miwa et al. (1997) [39] and Haque et al. (2018) [40] confirmed that C. perfringens consists of the cpe gene, which is found in various isolates. This gene produces enterotoxin, which is the main cause of disease in human and animals.
The relationship among the toxinotypes was then studied via correlation and regression analysis. These analyses confirmed that toxinotypes type A (plc) and type A (plc + β2) and type D (plc + etx) showed significant and negative correlation among each other, whereas type D (plc + β2 + etx) showed no correlation with other genotypes. These results are in some agreement with Athira et al. (2018) [41], who described the diversity of C. perfringens toxin genotypes in neonatal calves. Overall incidence of C. perfringens was found to be 37%. In this, 59% were type A and 37% were type C. Type B was around 15% and type E was 16%. Therefore, there was a diverse range of toxin genotypes in neonatal calves across Northern India.
Marks et al. (2002) [32] observed that both genotypes A and D showed some association with each other and that this association was found to be significant in causing diarrhea in dogs.
The abundance of toxinotypes isolated from C. perfringens was also assessed via heatmap, which proved that all the genotypes showed significant occurrence in buffalo and cattle, as most of the animals showed all or some signs of toxinotypes. These results show some agreement with Netherwood et al. (1998), Møller et al. (1996), Yamagishi et al. (1997), Yoo et al. (1997), Daube et al. (1996), Fach et al. (1997), and Wieckowski et al. (1998) [27,42,43,44,45,46,47], who concluded that detection of the cpe gene determines the abundance of toxinotypes in C. perfringens. The genotyping technique is more accurate and helps in increasing the accuracy of determining toxinotypes.
For the optimization of all toxinotypes to determine the abundance in buffalo and cattle, the Box–Behnken design was used. It was observed that most of the buffalo and cattle showed the presence of type A and type D toxinotypes. These results show some resemblance with Riazi et al. (2015) [48], who reported that barberry extract and grape must work as natural preservatives against C. perfringens.
Response surface methodology was established to determine the fitness of a mathematical model and its graphical representation. It is broadly used in the field of chemometrics. This consists of a group of techniques that clarifies the fitness of the empirical model in a statistical design. To achieve the objective of optimization, linear, polynomial, or quadratic equations are used to properly describe the system address consolidated variables [49,50,51].
For the application of response surface methodology, it must be kept in mind that experimental variables and the experimental region should be properly defined as the number of variables determines the order of the model either factorial or quadratic. In response to surface methodology, many designs are used to determine the optimization of variables, including Box–Behnken, central composite, and Doehlert designs [52].
In response to the surface methodology, the selection of the variable that is affecting the system is most important because the study is based on it. The selection of an appropriate variable is also needed to study experimental effects and evaluate these effects, which have major importance in the experiment. Based on this fact these variables turn their interactions giving significant impacts in the system start, especially so that practical experiments become feasible [53]. The choice of experimental design is needed for proper description and explanation of variables in a system. Afterward, the mathematical and statistical analysis to obtain the fitness of the data is necessary to get an optimal region for all the treatments applied to gain an opposite result [54].
The Box–Behnken design suggests that the point is to be selected in an experiment with three-level factorial planning. This not only helps us with an efficient estimation of the coefficients in a model but also can be assisted for figuring a large number of variables [55,56].
The contour and surface plots developed after the analysis are required to achieve the best conditions. These plots help in the visual examination of the experiment under study. For quadratic models, the minimum–maximum and critical points are needed to determine the effectiveness of the mathematical function [57].
4. Conclusions
In Pakistan, the abundance of toxin genotypes exhibited by C. perfringens poses a huge threat to successful bovine farming, as type A and type D were found, with type A being the most abundant in both buffalo and cattle. For appropriate diagnosis, genotyping could be a beneficial approach to properly understanding the occurrence of the toxin genotypes as well as the toxin encoding genes responsible for enterotoxaemia.
5. Materials and Methods
5.1. Sample Collection
This study encompassed the major livestock sites in the Punjab province of Pakistan (Figure 12). The sampled areas were divided into two regions, i.e., Central Punjab and Southern Punjab. The cities where samples were collected in Central Punjab included Lahore (31.5204° N, 74.3587° E), Cheecha Watni (30.5373° N, 72.6983° E), and Sahiwal (30.6682° N, 73.1114° E) whereas in Southern Punjab, Bhakkar (31.6082° N, 71.0854° E), Dera Ghazi Khan (30.0489° N, 70.6455° E), and Bahawalpur (29.3544° N, 71.6911° E) were the cities where samples were collected. Intestinal contents of necropsied buffalo (n = 240) and cattle (n = 240) with a history of the intestinal problems were collected and transported to the laboratory for further processing (Figure 13).
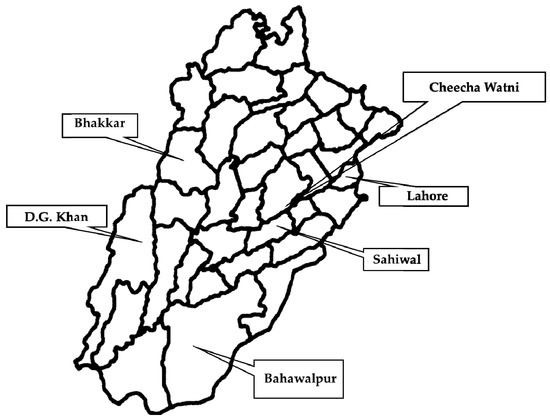
Figure 13.
Sampling sites for collection and isolation of C. perfringens-based toxinotypes from buffalo and cattle in Punjab province of Pakistan. The areas with a black square denote the sampling sites from where samples for toxinotypes of C. perfringens were collected from various household and farm buffalo and cattle.
5.2. Isolation of Bacterial Strains
Fecal swabs were inoculated into 5 5mL thioglycolateate (FTA) broth and incubated at 37 ℃ (incubation chamber: Don Whitely DG-250 anaerobic workstation, United Kingdom) for 24 h. Subsequently, 100 μL of pre-enriched FTA broth was spread on tryptose sulphite cycloserine agar base enriched with 7% egg yolk and supplemented with D-cycloserine (Solarbio, Beijing, China). A black colony showing a positive lecithinase reaction was selected and cultured. For identification and purity of C. perfringens, they were streaked on Columbia blood agar (Huan Kai Microbial (HKM) Sci & Tech, Guangzhou, China) containing 5% defibrinated sheep blood and evaluated for typical double zone hemolysis associated with C. perfringens. Additionally, Gram staining and biochemical tests including glucose, maltose, an H2S reduction test, a nitrate reduction test, gelatin liquefaction, and a saccharose test, etc. (Hangwei, Microbiological Co Ltd., Hangzhou, China) were performed to confirm the identity of the C. perfringens. Isolates were preserved in 50% glycerol at −80°C until further use.
5.3. Extraction of Bacterial DNA
Genomic DNA of C. perfringens was extracted from overnight FTA broth culture inoculated with a single colony plate by Ultraclean Microbial DNA Isolation Kit (MoBio, Germantown, MD, USA), adhering to the manufacturer’s directives with minor modifications to attain high concentration. In brief, the bacterial suspension and lysis buffer mixed in an additional 20 μL of 20 mg/mL proteinase-K (Fisher Scientific Waltham, MA, USA). The reaction mixture was then incubated at 65 ℃ for 15 min to lyse the bacterial cell wall and to preclude DNase digestion to bacterial DNA. In order to prevent DNA degradation, a tube with a reaction mixture was placed on a flat pad horizontally and vortexed for 10 min. The serial dilution of DNA was performed with 25 μL 10 mM Tris- HCl (pH 8.0), and segregated on a 0.8% agarose gel (BD Biosciences, Franklin Lakes, NJ, USA). The quality assertion and purity of extracted DNA was determined by NanoDrop™ 2000 (Thermo Scientific Inc. Waltham, MA, USA). The absorbance ratio at 260 nm and 280 nm was employed to estimate protein contamination and the recommended purity level was at the A260/A280 ratio of 1.8 to 2.2. The DNA was stored at −20 ℃ for further genotyping analysis.
5.4. 16S rRNA Gene Sequence Analysis
The 16S rRNA gene was amplified with primer from the genomic DNA of each strain using 16S rRNA gene species-specific primer [21]. The sequences of the 16S rRNA gene region were determined by Sanger sequencing (Tsingke Biotechnology Company, Xian, China). The species were recognized by nucleotide alignments with the sequences of species banked in GenBank NCBI, USA (Bethesda MD, USA).
5.5. Assessment of Toxin Production by C. perfringens Isolates
Primers corresponding to the α toxin (cpa), β toxin (cpb), or ε toxin (ε-toxin) gene were used as described by Svensson et al. (2006) [58] (Table 8). Genes encoding toxin proteins were detected by PCR [21,59].
Table 8.
Primers used for the detection of C. perfringens toxin genes
American Type Culture Collection ATCC-3624 (toxin type A, α-toxin positive) and China Institute of Veterinary Drug Control, Beijing, China, including CVCC-54 (toxin type B, α-, β- and ε-toxin positive), CVCC-61 (toxin type C, α-, and β-toxin positive) and CVCC-81 (toxin type D, α- and ε-toxin positive), were used as reference strains for toxinotyping (A, B, C, and D, respectively) and as positive controls for cpb2 and cpe. Amplification was performed in a 25 μL reaction mixture containing 50 ng template DNA, PCR Premix Taq (Ex Taq V.2.0 plus Dye Takara, Japan), and 0.5 μM of each primer on a thermocycler (Product: TaKaRa PCR Thermal Cycler DiceTM Touch Code TP350); the total reaction volume was adjusted with the addition of DNAase/RNAase (nuclease-free)-free water. The reaction conditions were as follows: initial denaturation at 96 ℃ for 5 min, 35 cycles of denaturation at 96 ℃ for 1 min., annealing at 56 ℃ for 1 min and elongation at 72 ℃ for 1 min, and a final extension at 72 ℃ for 10 min.
For ε-toxin, the assay conditions were modified as follows: initial denaturation at 95 ℃ for 3 min, 35 cycles of denaturation at 95 ℃ for 40 s, annealing at 57 ℃ for 30 s and elongation at 72 ℃ for 30 s, and a final extension at 72 ℃ for 5 min. The amplified products were analyzed on a 1.2% agarose gel stained with ethidium bromide (10 mg/mL) by GenStar, Beijing, China. PCR-amplified products on the gels were extracted and purified with the E.Z.N.A® Gel Extraction Kit (Omega Bio-Tek, Norcross, GA, USA) and sequenced (Tsingke Biotechnology Company, Xian, China) to ensure the identity with reference sequences.
5.6. Statistical Analysis
The data were subjected to statistical analysis using Statistical Package for Social Sciences (SPSS) version 26. ANOVA was performed and the means of the toxinotypes were compared using Tukey’s honestly significant difference (HSD) test. Principal component analysis (PCA), correlation, regression, and heatmaps among the toxinotypes were analyzed using R studio version 3.6.2. Optimization of all the genotypes was performed using response surface methodology via Box–Behnken design in Design Expert software version 12.
Author Contributions
Conceptualization, M.U.Z.K. and M.H.; methodology, M.U.Z.K. and S.Y.; software, M.H.; validation, M.Z.I., H.Z.-u.-F., and S.K.; formal analysis, S.Y. and T.M.; investigation, S.Y.; resources, S.Y. and J.C.; data curation, M.U.Z.K., M.H., and S.Y.; writing—original draft preparation, M.U.Z.K., M.H., and S.Y.; writing—review and editing, S.Y., S.K., H.Z.-u.-F., and M.A.A.; visualization, M.Z.I. and J.C.; supervision, J.C.; project administration, J.C.; funding acquisition, J.C. All authors edited, read, and approved the final version of the manuscript. All authors have read and agreed to the published version of the manuscript.
Funding
This study was supported by the Special Fund for Agro-Scientific Research in Public Interest (grant no. 201303044-7) and Innovative Special Project of Agricultural Sci-Tech (grant no. CAASASTIP-2014-LVRI-09). Both of these sources of funding supported Professor Jianping Cai.
Institutional Review Board Statement
Not applicable.
Informed Consent Statement
Not applicable.
Data Availability Statement
Not applicable.
Acknowledgments
We are grateful to Peter C. Thomson from School of Life and Environmental Sciences (SOLES), University of Sydney, Camden, Australia, for editorial assistance and valuable comments on the manuscript.
Conflicts of Interest
The authors declare no conflict of interest. None of the authors of this paper have a financial or personal relationship with other people or organizations that could inappropriately influence the content of this paper.
References
- GOP. Economic Survey of Pakistan; GOP: Islamabad, Pakistan, 2020.
- Rood, J.I. Virulence genes of Clostridium perfringens. Annu. Rev. Microbiol. 1998, 52, 333–360. [Google Scholar] [CrossRef] [PubMed]
- Popoff, M.R.; Bouvet, P. Clostridial toxins. Future Microbiol. 2009, 4, 1021–1064. [Google Scholar] [CrossRef] [PubMed]
- Revitt-Mills, S.A.; Rood, J.I.; Adams, V. Clostridium perfringens extracellular toxins and enzymes: 20 and counting. Microbiol. Aust. 2015, 36, 114–117. [Google Scholar] [CrossRef]
- Mantis, N.J. Vaccines against the category B toxins: Staphylococcal enterotoxin B, epsilon toxin and ricin. Adv. Drug Deliv. Rev. 2005, 57, 1424–1439. [Google Scholar] [CrossRef] [PubMed]
- Morris, W.E.; Goldstein, J.; Redondo, L.M.; Cangelosi, A.; Geoghegan, P.; Brocco, M.; Loidl, F.C.; Fernandez-Miyakawa, M.E. Clostridium perfringens epsilon toxin induces permanent neuronal degeneration and behavioral changes. Toxicon 2017, 130, 19–28. [Google Scholar] [CrossRef] [PubMed]
- Fernandez Miyakawa, M.E.; Redondo, L.M. Role of Clostridium perfringens Alpha, Beta, Epsilon and Iota Toxins in Enterotoxemia of Monogastrics and Ruminants; Springer: Dordrecht, The Netherlands, 2016. [Google Scholar]
- Rood, J.I.; McClane, B.A.; Songer, J.G.; Titball, R.W. The Clostridia: Molecular Biology and Pathogenesis; Academic Press: Cambridge, UK; London, UK, 1997; ISBN 0080542395. [Google Scholar]
- Roeder, B.L.; Chengappa, M.M.; Nagaraja, T.G.; Avery, T.B.; Kennedy, G.A. Experimental induction of abdominal tympany, abomasitis, and abomasal ulceration by intraruminal inoculation of Clostridium perfringens type A in neonatal calves. Am. J. Vet. Res. 1988, 49, 201–207. [Google Scholar]
- Canard, B.; Cole, S.T. Genome organization of the anaerobic pathogen Clostridium perfringens. Proc. Natl. Acad. Sci. USA 1989, 86, 6676–6680. [Google Scholar] [CrossRef]
- Awad, M.M.; Ellemor, D.M.; Boyd, R.L.; Emmins, J.J.; Rood, J.I. Synergistic effects of alpha-toxin and perfringolysin O in Clostridium perfringens-mediated gas gangrene. Infect. Immun. 2001, 69, 7904–7910. [Google Scholar] [CrossRef]
- Cavalcanti, M.T.H.; Porto, T.; Porto, A.L.F.; Brandi, I.V.; de Lima Filho, J.L.; Pessoa Junior, A. Large scale purification of Clostridium perfringens toxins: A review. Rev. Bras. Ciências Farm. 2004, 40, 151–164. [Google Scholar] [CrossRef]
- Verherstraeten, S.; Goossens, E.; Valgaeren, B.; Pardon, B.; Timbermont, L.; Vermeulen, K.; Schauvliege, S.; Haesebrouck, F.; Ducatelle, R.; Deprez, P. The synergistic necrohemorrhagic action of Clostridium perfringens perfringolysin and alpha toxin in the bovine intestine and against bovine endothelial cells. Vet. Res. 2013, 44, 45. [Google Scholar] [CrossRef] [PubMed]
- Goossens, E.; Verherstraeten, S.; Valgaeren, B.R.; Pardon, B.; Timbermont, L.; Schauvliege, S.; Rodrigo-Mocholí, D.; Haesebrouck, F.; Ducatelle, R.; Deprez, P.R. The C-terminal domain of Clostridium perfringens alpha toxin as a vaccine candidate against bovine necrohemorrhagic enteritis. Vet. Res. 2016, 47, 52. [Google Scholar] [CrossRef]
- Valgaeren, B.; Pardon, B.; Goossens, E.; Verherstraeten, S.; Schauvliege, S.; Timbermont, L.; Ducatelle, R.; Deprez, P.; Van Immerseel, F. Lesion development in a new intestinal loop model indicates the involvement of a shared Clostridium perfringens virulence factor in haemorrhagic enteritis in calves. J. Comp. Pathol. 2013, 149, 103–112. [Google Scholar] [CrossRef]
- Layana, J.E.; Miyakawa, M.E.F.; Uzal, F.A. Evaluation of different fluids for detection of Clostridium perfringens type D epsilon toxin in sheep with experimental enterotoxemia. Anaerobe 2006, 12, 204–206. [Google Scholar] [CrossRef] [PubMed]
- Filho, E.J.F.; Carvalho, A.U.; Assis, R.A.; Lobato, F.F.; Rachid, M.A.; Carvalho, A.A.; Ferreira, P.M.; Nascimento, R.A.; Fernandes, A.A.; Vidal, J.E. Clinicopathologic features of experimental Clostridium perfringens type D enterotoxemia in cattle. Vet. Pathol. 2009, 46, 1213–1220. [Google Scholar] [CrossRef] [PubMed]
- Raman, T.; Muthukathan, G. Field suppression of Fusarium wilt disease in banana by the combined application of native endophytic and rhizospheric bacterial isolates possessing multiple functions. Phytopathol. Mediterr. 2015, 54, 241–252. [Google Scholar] [CrossRef]
- Hornitzky, M.A.Z.; Glastonbury, J. Enterotoxaemia in sheep, goats and cattle. In Australian Standard Diagnostic Techniques for Animal Diseases; Corner, L.A., Bagust, T.J., Eds.; Standing Committee on Agricultural and Resource Management, CSIRO: Melbourne, Australia, 1993; p. 5. [Google Scholar]
- Petit, L.; Gibert, M.; Popoff, M.R. Clostridium perfringens: Toxinotype and genotype. Trends Microbiol. 1999, 7, 104–110. [Google Scholar] [CrossRef]
- Rood, J.I.; Adams, V.; Lacey, J.; Lyras, D.; McClane, B.A.; Melville, S.B.; Moore, R.J.; Popoff, M.R.; Sarker, M.R.; Songer, J.G. Expansion of the Clostridium perfringens toxin-based typing scheme. Anaerobe 2018, 53, 5–10. [Google Scholar] [CrossRef]
- Sterne, M.; Batty, I. Criteria for diagnosing clostridial infection. Pathog. Clostridia 1975, 79–122. [Google Scholar]
- Aktories, K. Bacterial Toxins: Tools in Cell Biology and Pharmacology; John Wiley & Sons, WILEY-VCH Verlag GmbH & Co. KGaA: Weinheim, Germany, 2002; ISBN 978-3-527-30881-1. [Google Scholar]
- Hatheway, C.L. Toxigenic clostridia. Clin. Microbiol. Rev. 1990, 3, 66–98. [Google Scholar] [CrossRef]
- McClane, B.A.; Uzal, F.A.; Miyakawa, M.F.; Lyerly, D.; Wilkins, T. The enterotoxic clostridia. Prokaryotes 2006, 4, 698–752. [Google Scholar]
- McClane, B.A. An overview of Clostridium perfringens enterotoxin. Toxicon 1996, 34, 1335–1343. [Google Scholar] [CrossRef]
- Netherwood, T.; Binns, M.; Townsend, H.; Wood, J.L.N.; Mumford, J.A.; Chanter, N. The Clostridium perfringens enterotoxin from equine isolates; its characterization, sequence and role in foal diarrhoea. Epidemiol. Infect. 1998, 120, 193–200. [Google Scholar] [CrossRef]
- Jestin, A.; Popoff, M.R.; Mahe, S. Epizootiologic investigations of a diarrheic syndrome in fattening pigs. Am. J. Vet. Res. 1985, 46, 2149–2151. [Google Scholar] [PubMed]
- Hunter, S.E.; Brown, J.E.; Oyston, P.C.; Sakurai, J.; Titball, R.W. Molecular genetic analysis of beta-toxin of Clostridium perfringens reveals sequence homology with alpha-toxin, gamma-toxin, and leukocidin of Staphylococcus aureus. Infect. Immun. 1993, 61, 3958–3965. [Google Scholar] [CrossRef] [PubMed]
- Gibert, M.; Jolivet-Renaud, C.; Popoff, M.R. Beta2 toxin, a novel toxin produced by Clostridium perfringens. Gene 1997, 203, 65–73. [Google Scholar] [CrossRef]
- Forti, K.; Ferroni, L.; Pellegrini, M.; Cruciani, D.; de Giuseppe, A.; Crotti, S.; Papa, P.; Maresca, C.; Severi, G.; Marenzoni, M.L.; et al. Molecular characterization of Clostridium perfringens strains isolated in Italy. Toxins 2020, 12, 650. [Google Scholar] [CrossRef] [PubMed]
- Marks, S.L.; Kather, E.J.; Kass, P.H.; Melli, A.C. Genotypic and phenotypic characterization of Clostridium perfringens and Clostridium difficile in diarrheic and healthy dogs. J. Vet. Intern. Med. 2002, 16, 533–540. [Google Scholar] [CrossRef]
- Twedt, D. Clostridium perfringens–associated diarrhea in dogs. In American College of Veterinary Medicine 11th Annual Forum, Washington, DC; ACVIM: Greenwood Village, CO, USA, 1993; pp. 121–125. [Google Scholar]
- Rahman, M.S.; Sharma, R.K.; Borah, P.; Chakraborty, A.; Devi, M.R.K.; Longjam, N. Characterization of Clostridium perfringens isolated from mammals and birds from Guwahati city, India. J. Venom. Anim. Toxins Incl. Trop. Dis. 2012, 18, 83–87. [Google Scholar] [CrossRef]
- Milton, A.A.P.; Agarwal, R.K.; Priya, G.B.; Saminathan, M.; Aravind, M.; Reddy, A.; Athira, C.K.; Ramees, T.; Sharma, A.K.; Kumar, A. Prevalence and molecular typing of Clostridium perfringens in captive wildlife in India. Anaerobe 2017, 44, 55–57. [Google Scholar] [CrossRef]
- Ferrarezi, M.C.; Cardoso, T.C.; Dutra, I.S. Genotyping of Clostridium perfringens isolated from calves with neonatal diarrhea. Anaerobe 2008, 14, 328–331. [Google Scholar] [CrossRef]
- Yadav, J.P.; Das, S.C.; Dhaka, P.; Vijay, D.; Kumar, M.; Mukhopadhyay, A.K.; Chowdhury, G.; Chauhan, P.; Singh, R.; Dhama, K. Molecular characterization and antimicrobial resistance profile of Clostridium perfringens type A isolates from humans, animals, fish and their environment. Anaerobe 2017, 47, 120–124. [Google Scholar] [CrossRef]
- Guran, H.S.; Oksuztepe, G. Detection and typing of C lostridium perfringens from retail chicken meat parts. Lett. Appl. Microbiol. 2013, 57, 77–82. [Google Scholar] [CrossRef] [PubMed]
- Miwa, N.; Nishina, T.; Kubo, S.; Honda, H. Most probable numbers of enterotoxigenic Clostridium perfringens in intestinal contents of domestic livestock detected by nested PCR. J. Vet. Med Sci. 1997, 59, 557–560. [Google Scholar] [CrossRef] [PubMed][Green Version]
- Haque, S.; Sharma, R.K.; Barman, N.N.; Devi, L.B.; Barkalita, L.M.; Hussain, I. Characterization of enterotoxin producing Clostridium perfringens isolated from foods of animal origin. Indian J. Anim. Res. 2018, 52, 111–115. [Google Scholar] [CrossRef][Green Version]
- Athira, C.K.; Milton, A.A.P.; Reddy, A.; Mekhemadhom Rajendrakumar, A.; Abhishek; Verma, M.R.; Kumar, A.; Nagaleekar, V.K.; Agarwal, R.K. Diversity of toxin-genotypes among Clostridium perfringens isolated from healthy and diarrheic neonatal cattle and buffalo calves. Anaerobe 2018, 49, 99–102. [Google Scholar] [CrossRef]
- Møller, K.; Ahrens, P. Comparison of Toxicity Neutralization-, ELISA-and PCR Tests for Typing of Clostridium perfringens and Detection of the Enterotoxin Gene by PCR. Anaerobe 1996, 2, 103–110. [Google Scholar] [CrossRef]
- Yamagishi, T.; Sugitani, K.; Tanishima, K.; Nakamura, S. Polymerase chain reaction test for differentiation of five toxin types of Clostridium perfringens. Microbiol. Immunol. 1997, 41, 295–299. [Google Scholar] [CrossRef]
- Yoo, H.S.; Lee, S.U.; Park, K.Y.; Park, Y.H. Molecular typing and epidemiological survey of prevalence of Clostridium perfringens types by multiplex PCR. J. Clin. Microbiol. 1997, 35, 228–232. [Google Scholar] [CrossRef]
- Daube, G.; Simon, P.; Limbourg, B.; Manteca, C.; Mainil, J.; Kaeckenbeeck, A. Hybridization of 2,659 Clostridium perfringens isolates with gene probes for seven toxins (alpha, beta, epsilon, iota, theta, mu, and enterotoxin) and for sialidase. Am. J. Vet. Res. 1996, 57, 496–501. [Google Scholar]
- Fach, P.; Popoff, M.R. Detection of enterotoxigenic Clostridium perfringens in food and fecal samples with a duplex PCR and the slide latex agglutination test. Appl. Environ. Microbiol. 1997, 63, 4232–4236. [Google Scholar] [CrossRef]
- Wieckowski, E.; Billington, S.; Songer, G.; McClane, B. Clostridium perfringens Type E Isolates Associated with Veterinary Infections Carry Silent Enterotoxin Gene Sequences. Zent. Fur Bakteriol. Suppl. 1998, 407–408. [Google Scholar]
- Riazi, F.; Zeynali, F.; Hoseini, E.; Behmadi, H. Determination of the Minimum Inhibitory Concentration of the Barberry Extract and the Dried Residue of Red Grape and Their Effects on the Growth Inhibition of Sausage Bacteria by Using Response Surface Methodology (RSM). Nutr. Food Sci. Res. 2015, 2, 55–63. [Google Scholar]
- Gilmour, S.G. Response surface designs for experiments in bioprocessing. Biometrics 2006, 62, 323–331. [Google Scholar] [CrossRef] [PubMed]
- Teófilo, R.F.; Ferreira, M. Quimiometria II: Planilhas eletrônicas para cálculos de planejamentos experimentais, um tutorial. Química Nova 2006, 29, 338–350. [Google Scholar] [CrossRef]
- Bruns, R.E.; Scarminio, I.S.; de Barros Neto, B. Statistical Design-Chemometrics; Elsevier: Amsterdam, The Netherlands, 2006; ISBN 0080462138. [Google Scholar]
- Hanrahan, G.; Lu, K. Application of factorial and response surface methodology in modern experimental design and optimization. Crit. Rev. Anal. Chem. 2006, 36, 141–151. [Google Scholar] [CrossRef]
- Lundstedt, T.; Seifert, E.; Abramo, L.; Thelin, B.; Nyström, Å.; Pettersen, J.; Bergman, R. Experimental design and optimization. Chemom. Intell. Lab. Syst. 1998, 42, 3–40. [Google Scholar] [CrossRef]
- Bezerra, M.A.; Santelli, R.E.; Oliveira, E.P.; Villar, L.S.; Escaleira, L.A. Response surface methodology (RSM) as a tool for optimization in analytical chemistry. Talanta 2008, 76, 965–977. [Google Scholar] [CrossRef]
- Otto, M. Chemometrics: Statistics and Computer Application in Analytical Chemistry; Wiley: Hoboken, NJ, USA, 1999. [Google Scholar]
- Ferreira, S.L.C.; Bruns, R.E.; Ferreira, H.S.; Matos, G.D.; David, J.M.; Brandao, G.C. EGP da. Silva, LA Portugal, PS dos. Reis, AS Souza and WNL dos. Santos, Box–Behnken design: An alternative for the optimization of analytical methods. Anal. Chim. Acta 2007, 597, 179–186. [Google Scholar] [CrossRef]
- López, R.; Goñi, F.; Etxandia, A.; Millán, E. Determination of organochlorine pesticides and polychlorinated biphenyls in human serum using headspace solid-phase microextraction and gas chromatography-electron capture detection. J. Chromatogr. B 2007, 846, 298–305. [Google Scholar] [CrossRef]
- Svensson, C.; Linder, A.; Olsson, S.-O. Mortality in Swedish dairy calves and replacement heifers. J. Dairy Sci. 2006, 89, 4769–4777. [Google Scholar] [CrossRef]
- Meer, R.R.; Songer, J.G. Multiplex polymerase chain reaction assay for genotyping Clostridium perfringens. Am. J. Vet. Res. 1997, 58, 702. [Google Scholar] [PubMed]


Publisher’s Note: MDPI stays neutral with regard to jurisdictional claims in published maps and institutional affiliations. |
© 2021 by the authors. Licensee MDPI, Basel, Switzerland. This article is an open access article distributed under the terms and conditions of the Creative Commons Attribution (CC BY) license (http://creativecommons.org/licenses/by/4.0/).