Can Cyanobacterial Diversity in the Source Predict the Diversity in Sludge and the Risk of Toxin Release in a Drinking Water Treatment Plant?

 ,
, 
 and
and 
Abstract
:1. Introduction
2. Results and Discussion
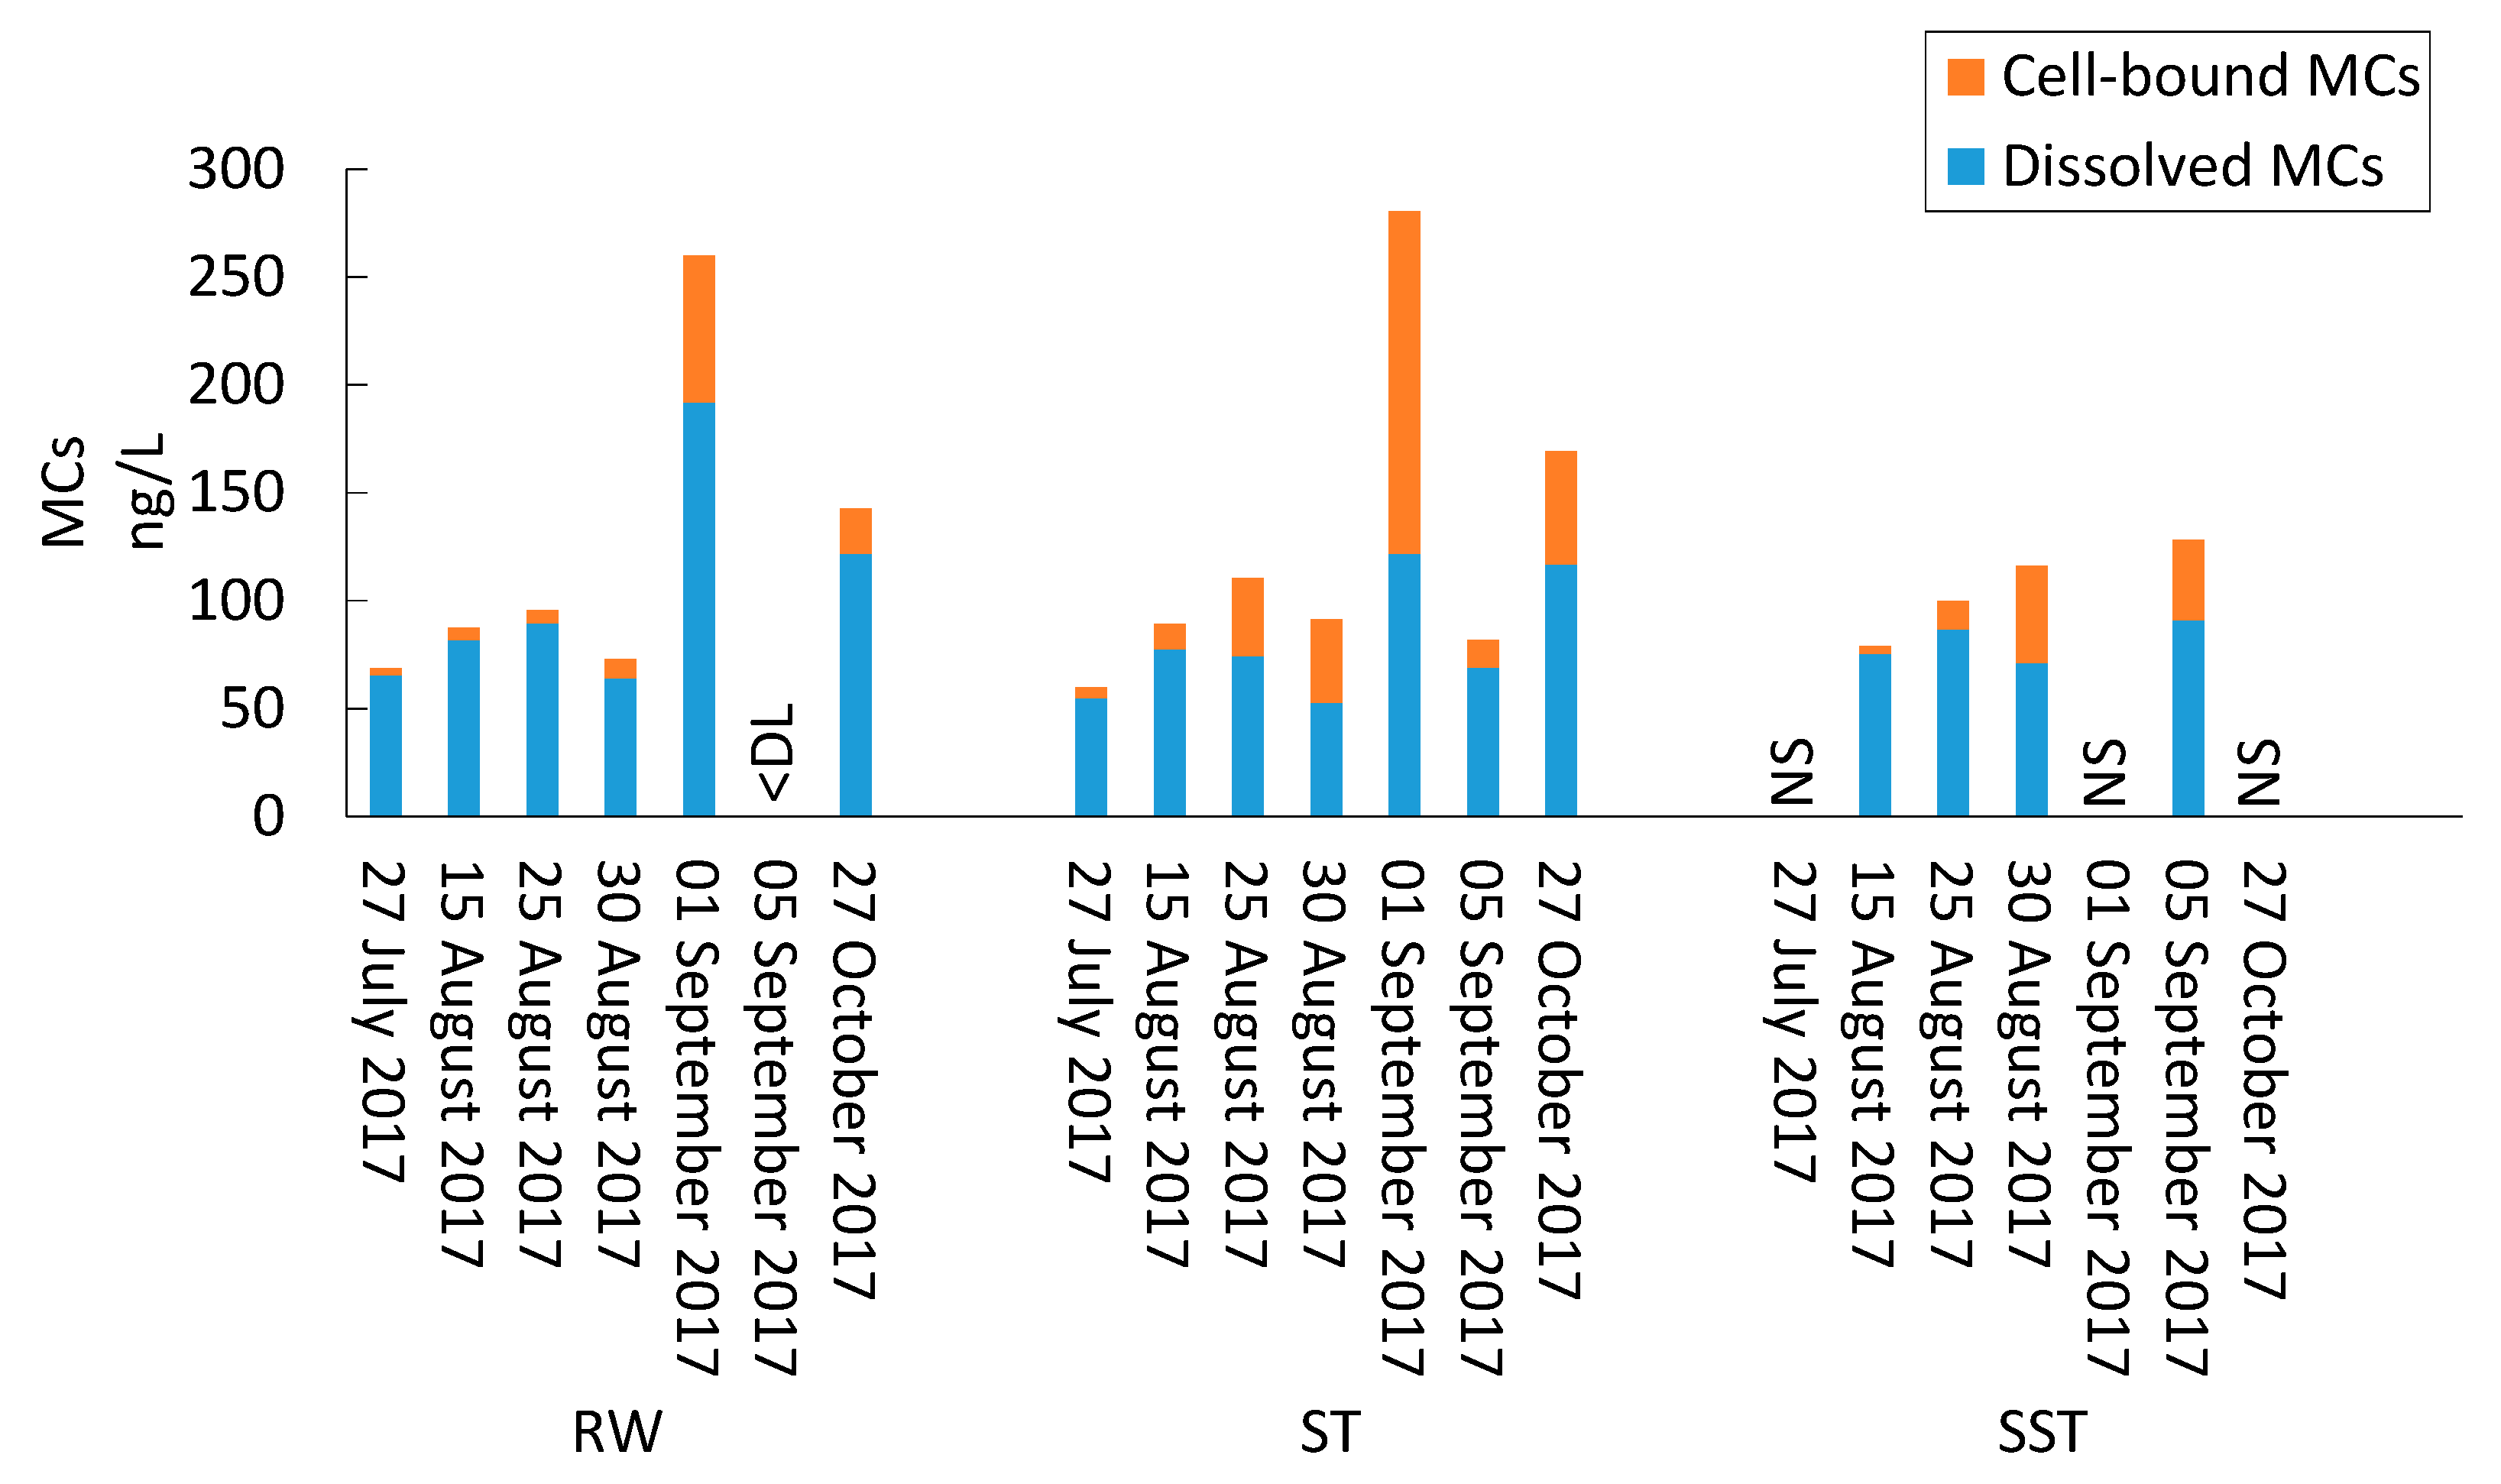
2.1. Impact of Conventional Treatment on Cyanobacteria and Cyanotoxins
2.2. Cyanobacterial Diversity in Sludge and Supernatant Assessed by Shotgun Metagenomic Sequencing
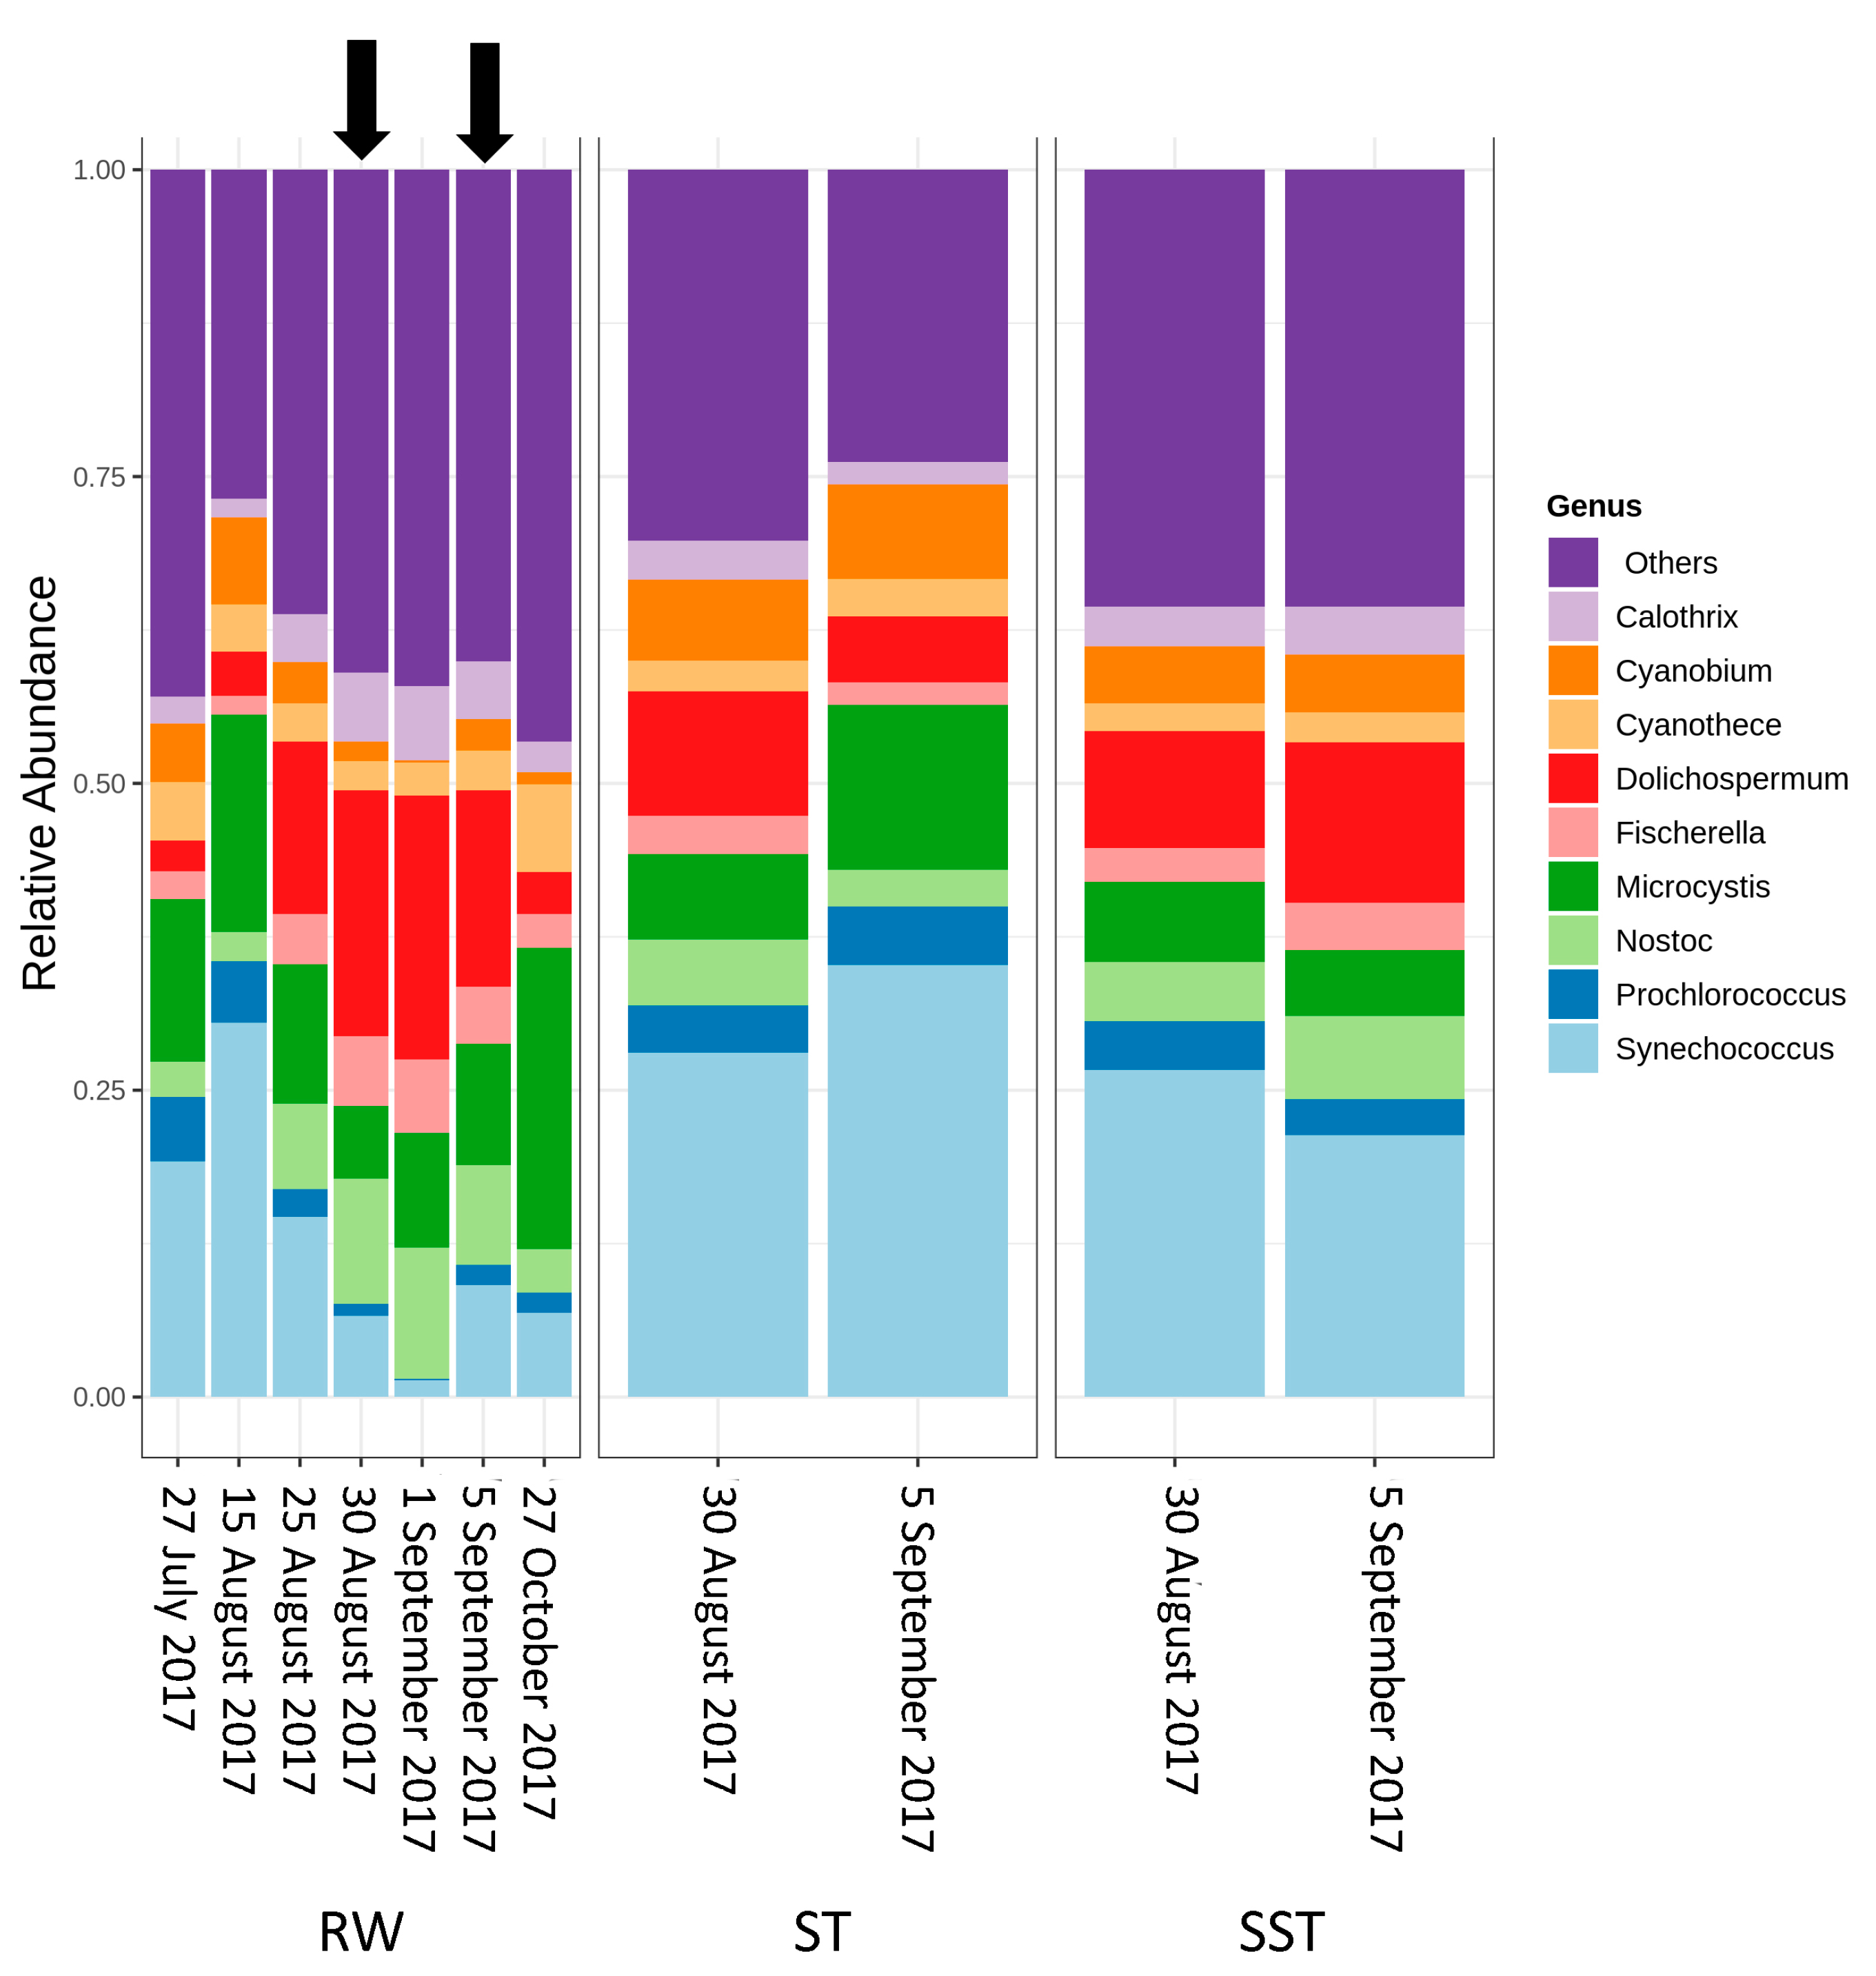
- As expected, changes in composition of RW communities were observed and affected the microbial populations in the ST. Since sludge accumulates over the period of time (1–13 days in this case), the ST profile is expected to reflect accumulative diversity considering both the relative abundance and biomass. Furthermore, the efficacy of coagulation and settling is species-dependent, as shown by [3,17]. Previous investigations also demonstrated that 96–100% of Dolichospermum and Microcystis cells were more likely to be captured by the clarifier [3,8], and that the coagulation efficiency for these genera was twice the value observed for Synechococcus [41].
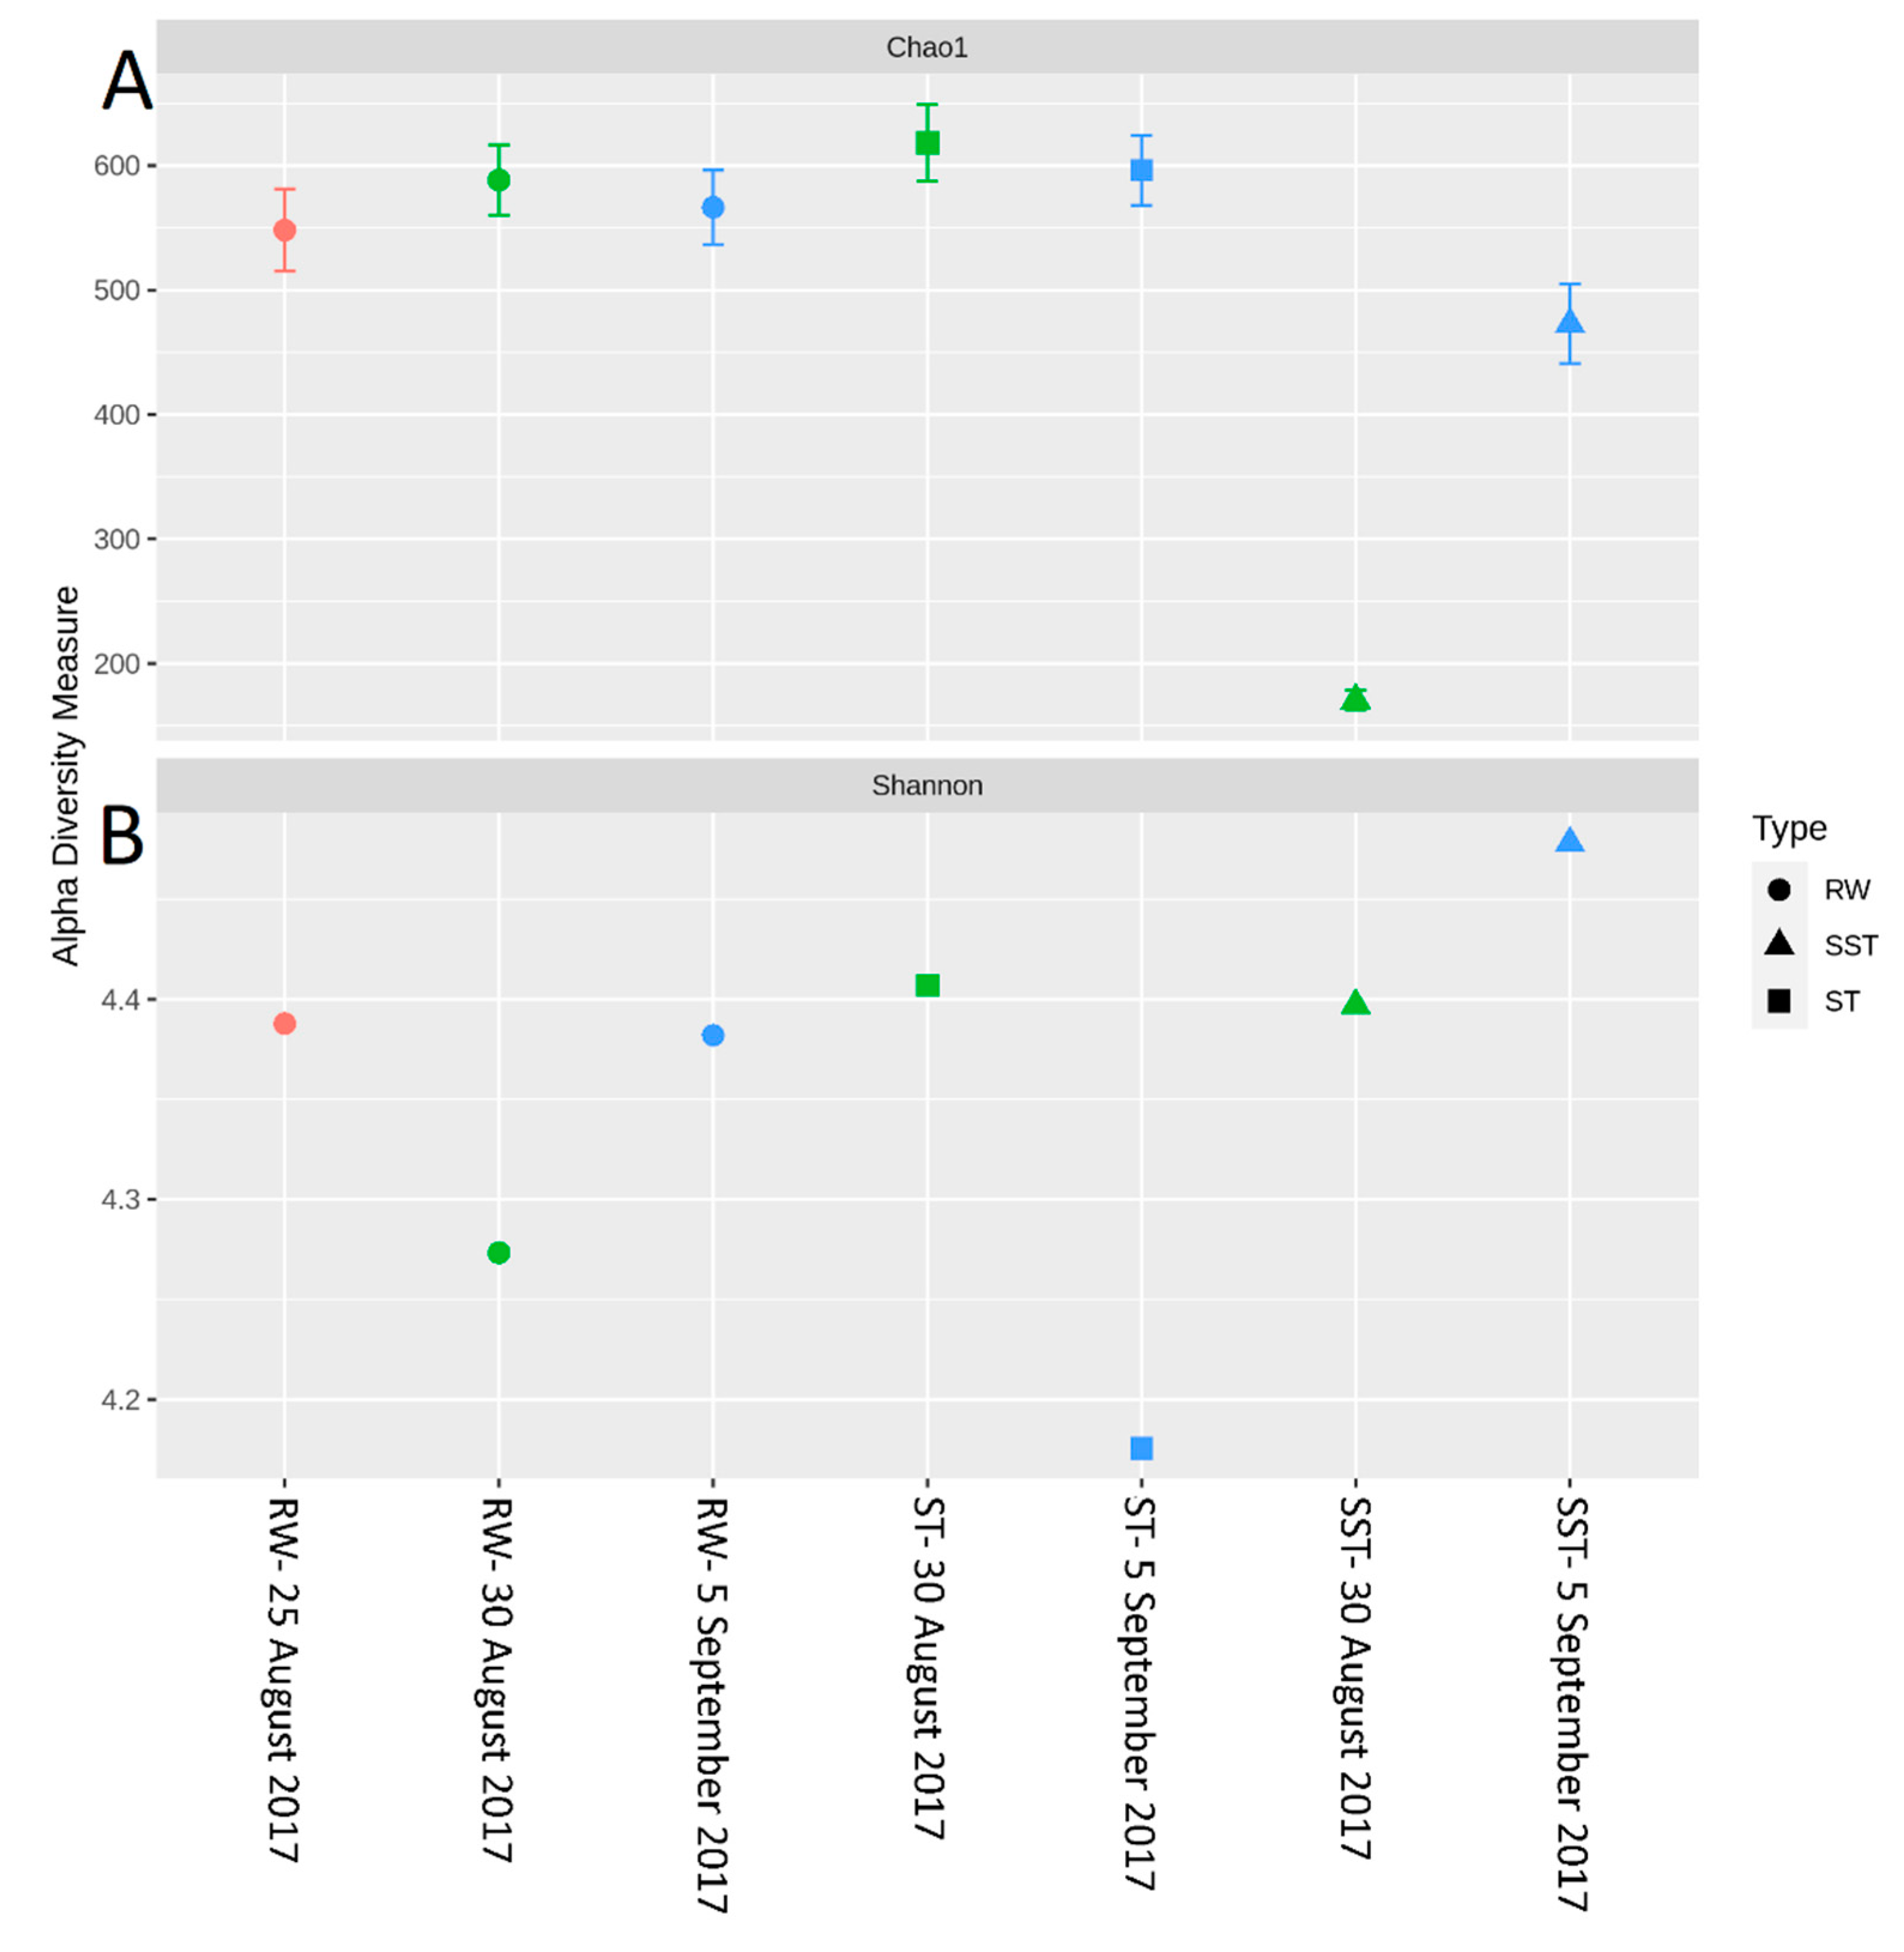
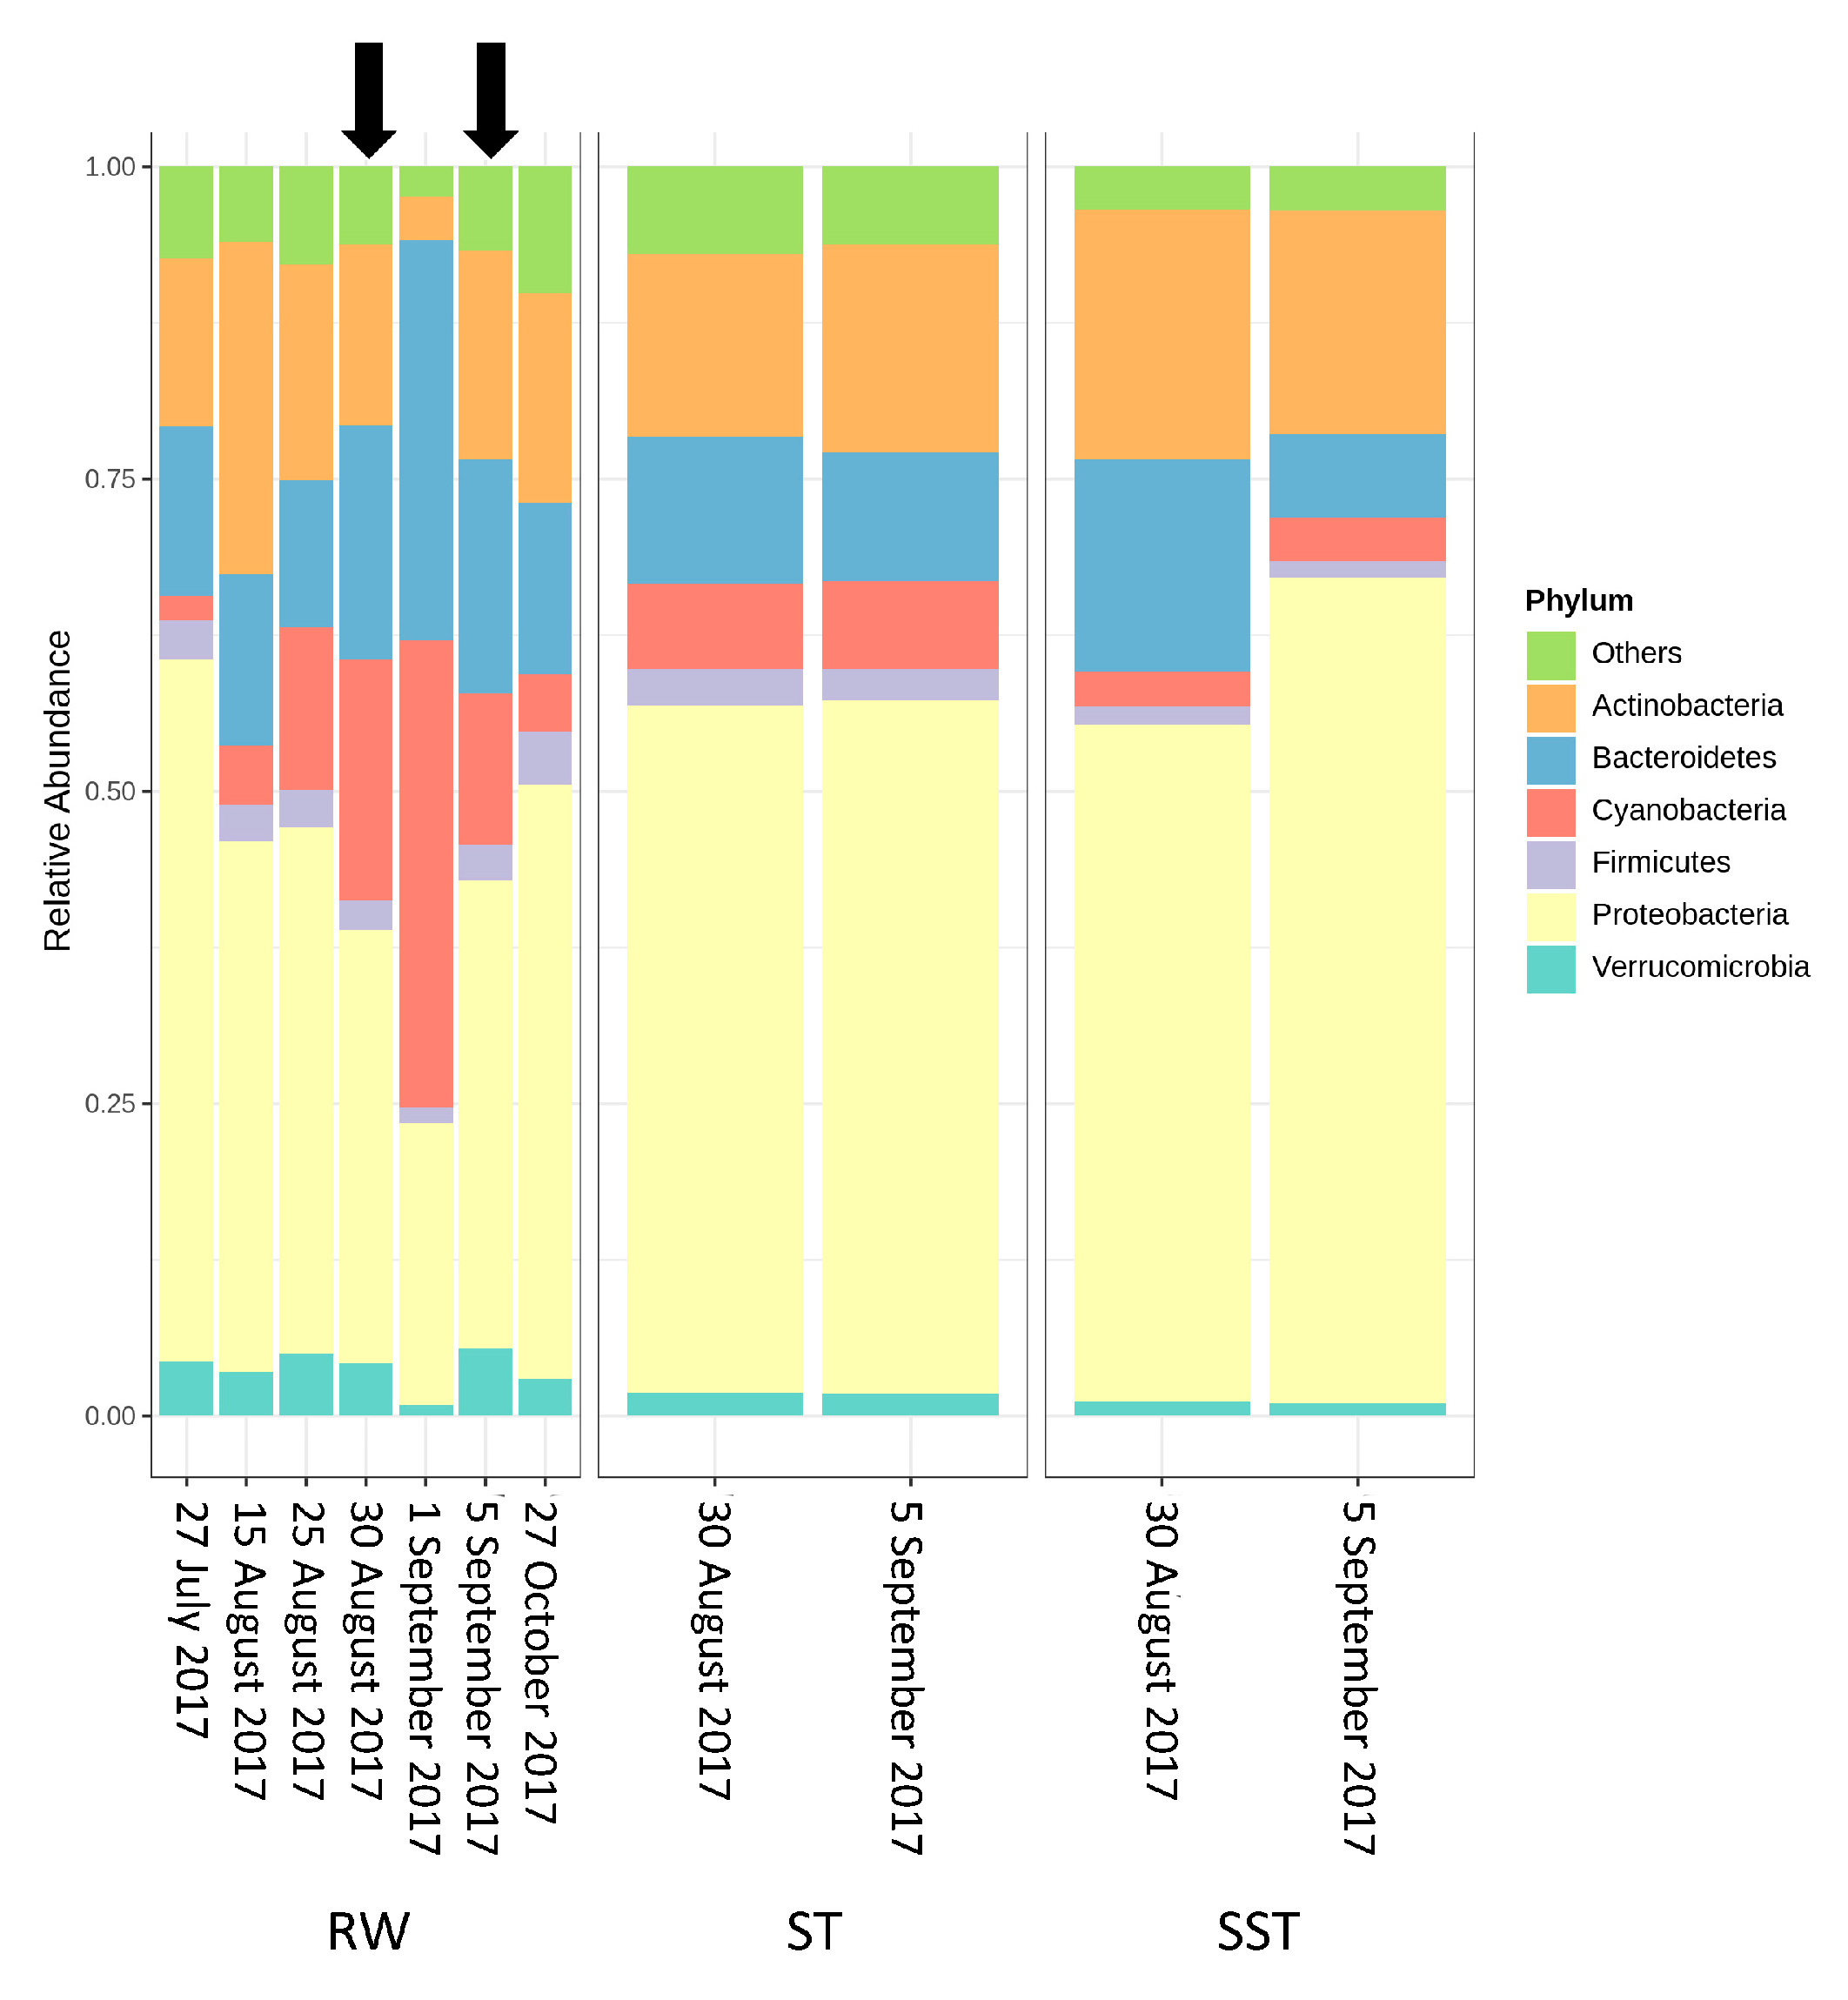
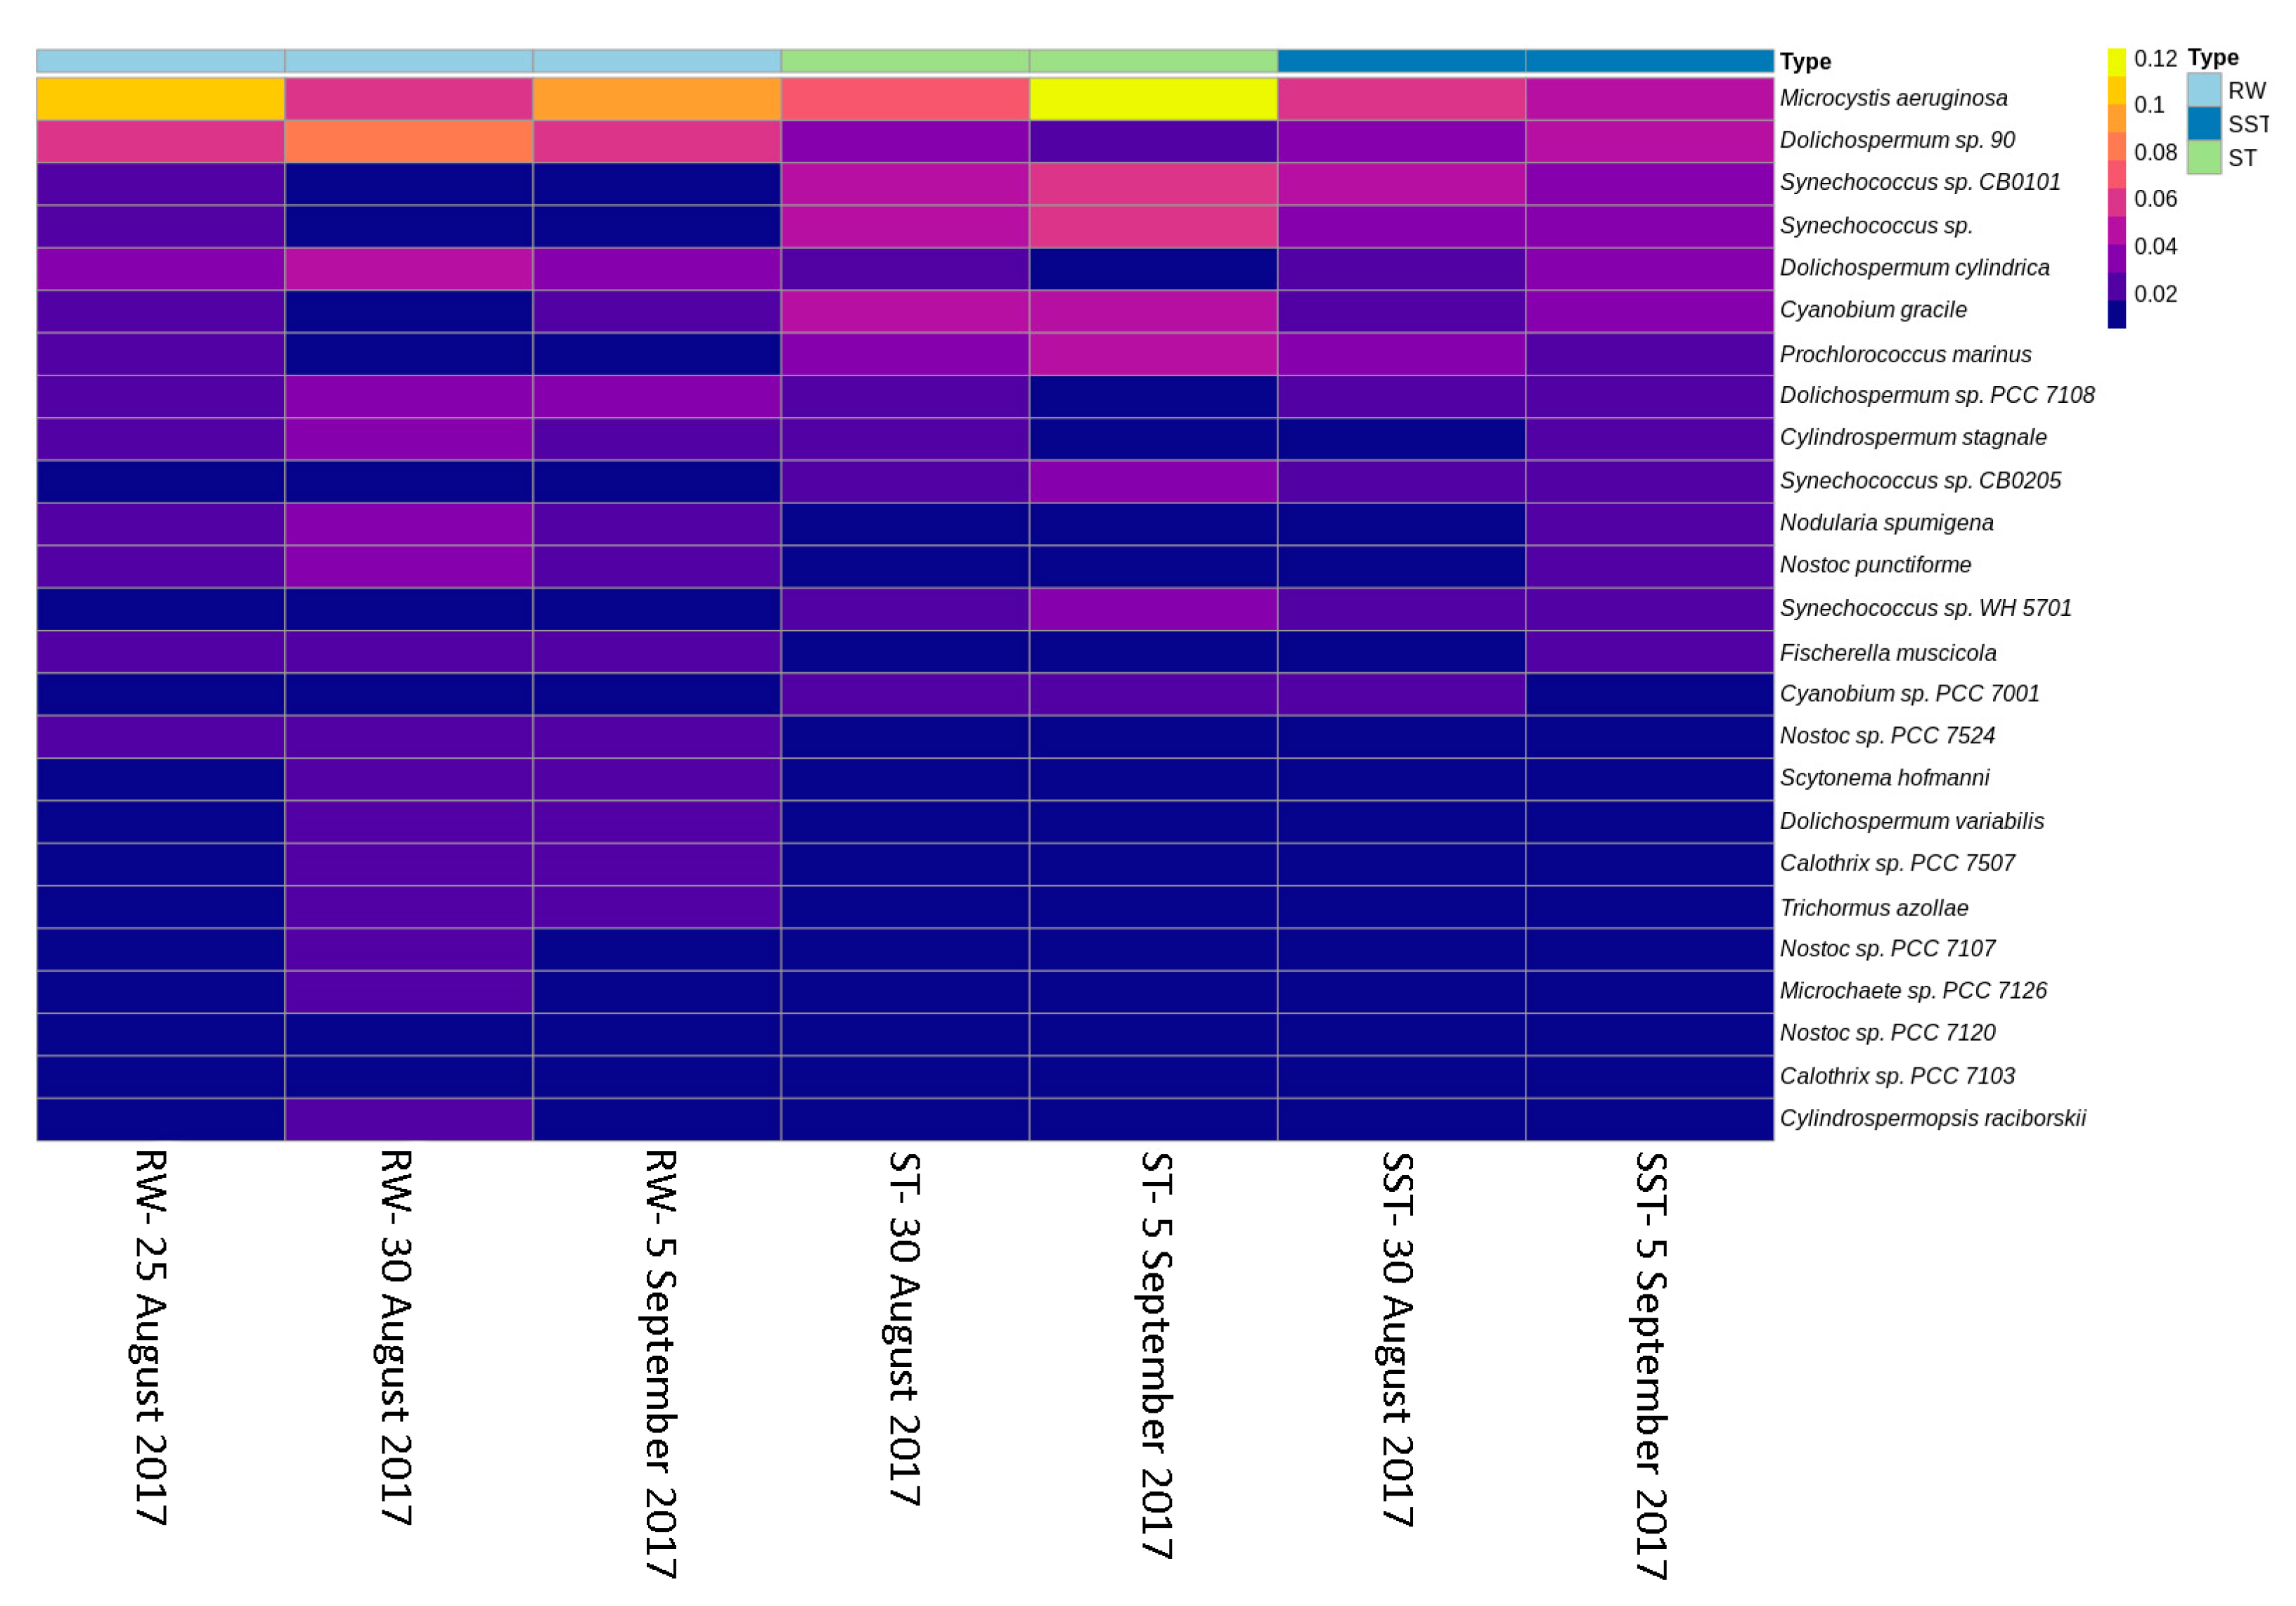
- The communities found in the ST and SST showed different trends at the phylum and genus level as shown by the Shannon index (Figure S5, Figure 4 and Figure 5). In fact, at the phylum level, Cyanobacteria was selectively removed and retained within sludge (Figure 4). The cyanobacterial community distribution in the supernatant reflects the incoming sludge and the subsequent buoyancy of the community in the sludge. Storage in the holding tank of the sludge may cause cell breakage, leading to vesicle damage [42] and interruption of buoyancy regulation [43]. This would affect the profile of the supernatant in our work. The increase in cyanobacterial richness in SST on 5 September might be due to the longer sludge storage time in the 30 August sample (13 days) compared to that of 5 September (1 day), providing more time for cell damage.
- Cell survival, re-growth, and damage might have occurred in ST during sludge storage. The longer storage of the sludge might have led to cell lysis in the sludge. These phenomena were documented in several studies for various dominant genera including the most dominant genera in this study (Microcystis and Dolichospermum) after 2 days of sludge storage [4,15,16,44]. Furthermore, trichome damage of Dolichospermum due to the treatment stress has been already reported [7]. However, there are no data on the fate of Synechococcus in stored sludge.
2.3. Comparison between Shotgun Metagenomic Sequencing and Taxonomic Cell Counts
3. Conclusions
- Bacterial communities shifted before and after the cyanobacterial bloom. Proteobacteria was the predominant phylum in RW before the bloom. Levels of Cyanobacteria and Bacteroidetes progressively increased to reach their greatest abundance on the bloom date. This high abundance of Bacteroidetes was associated with nutrient-rich conditions which occurred during the cyanobacterial bloom. After the bloom, bacterial communities returned to almost the same composition as prior to the bloom.
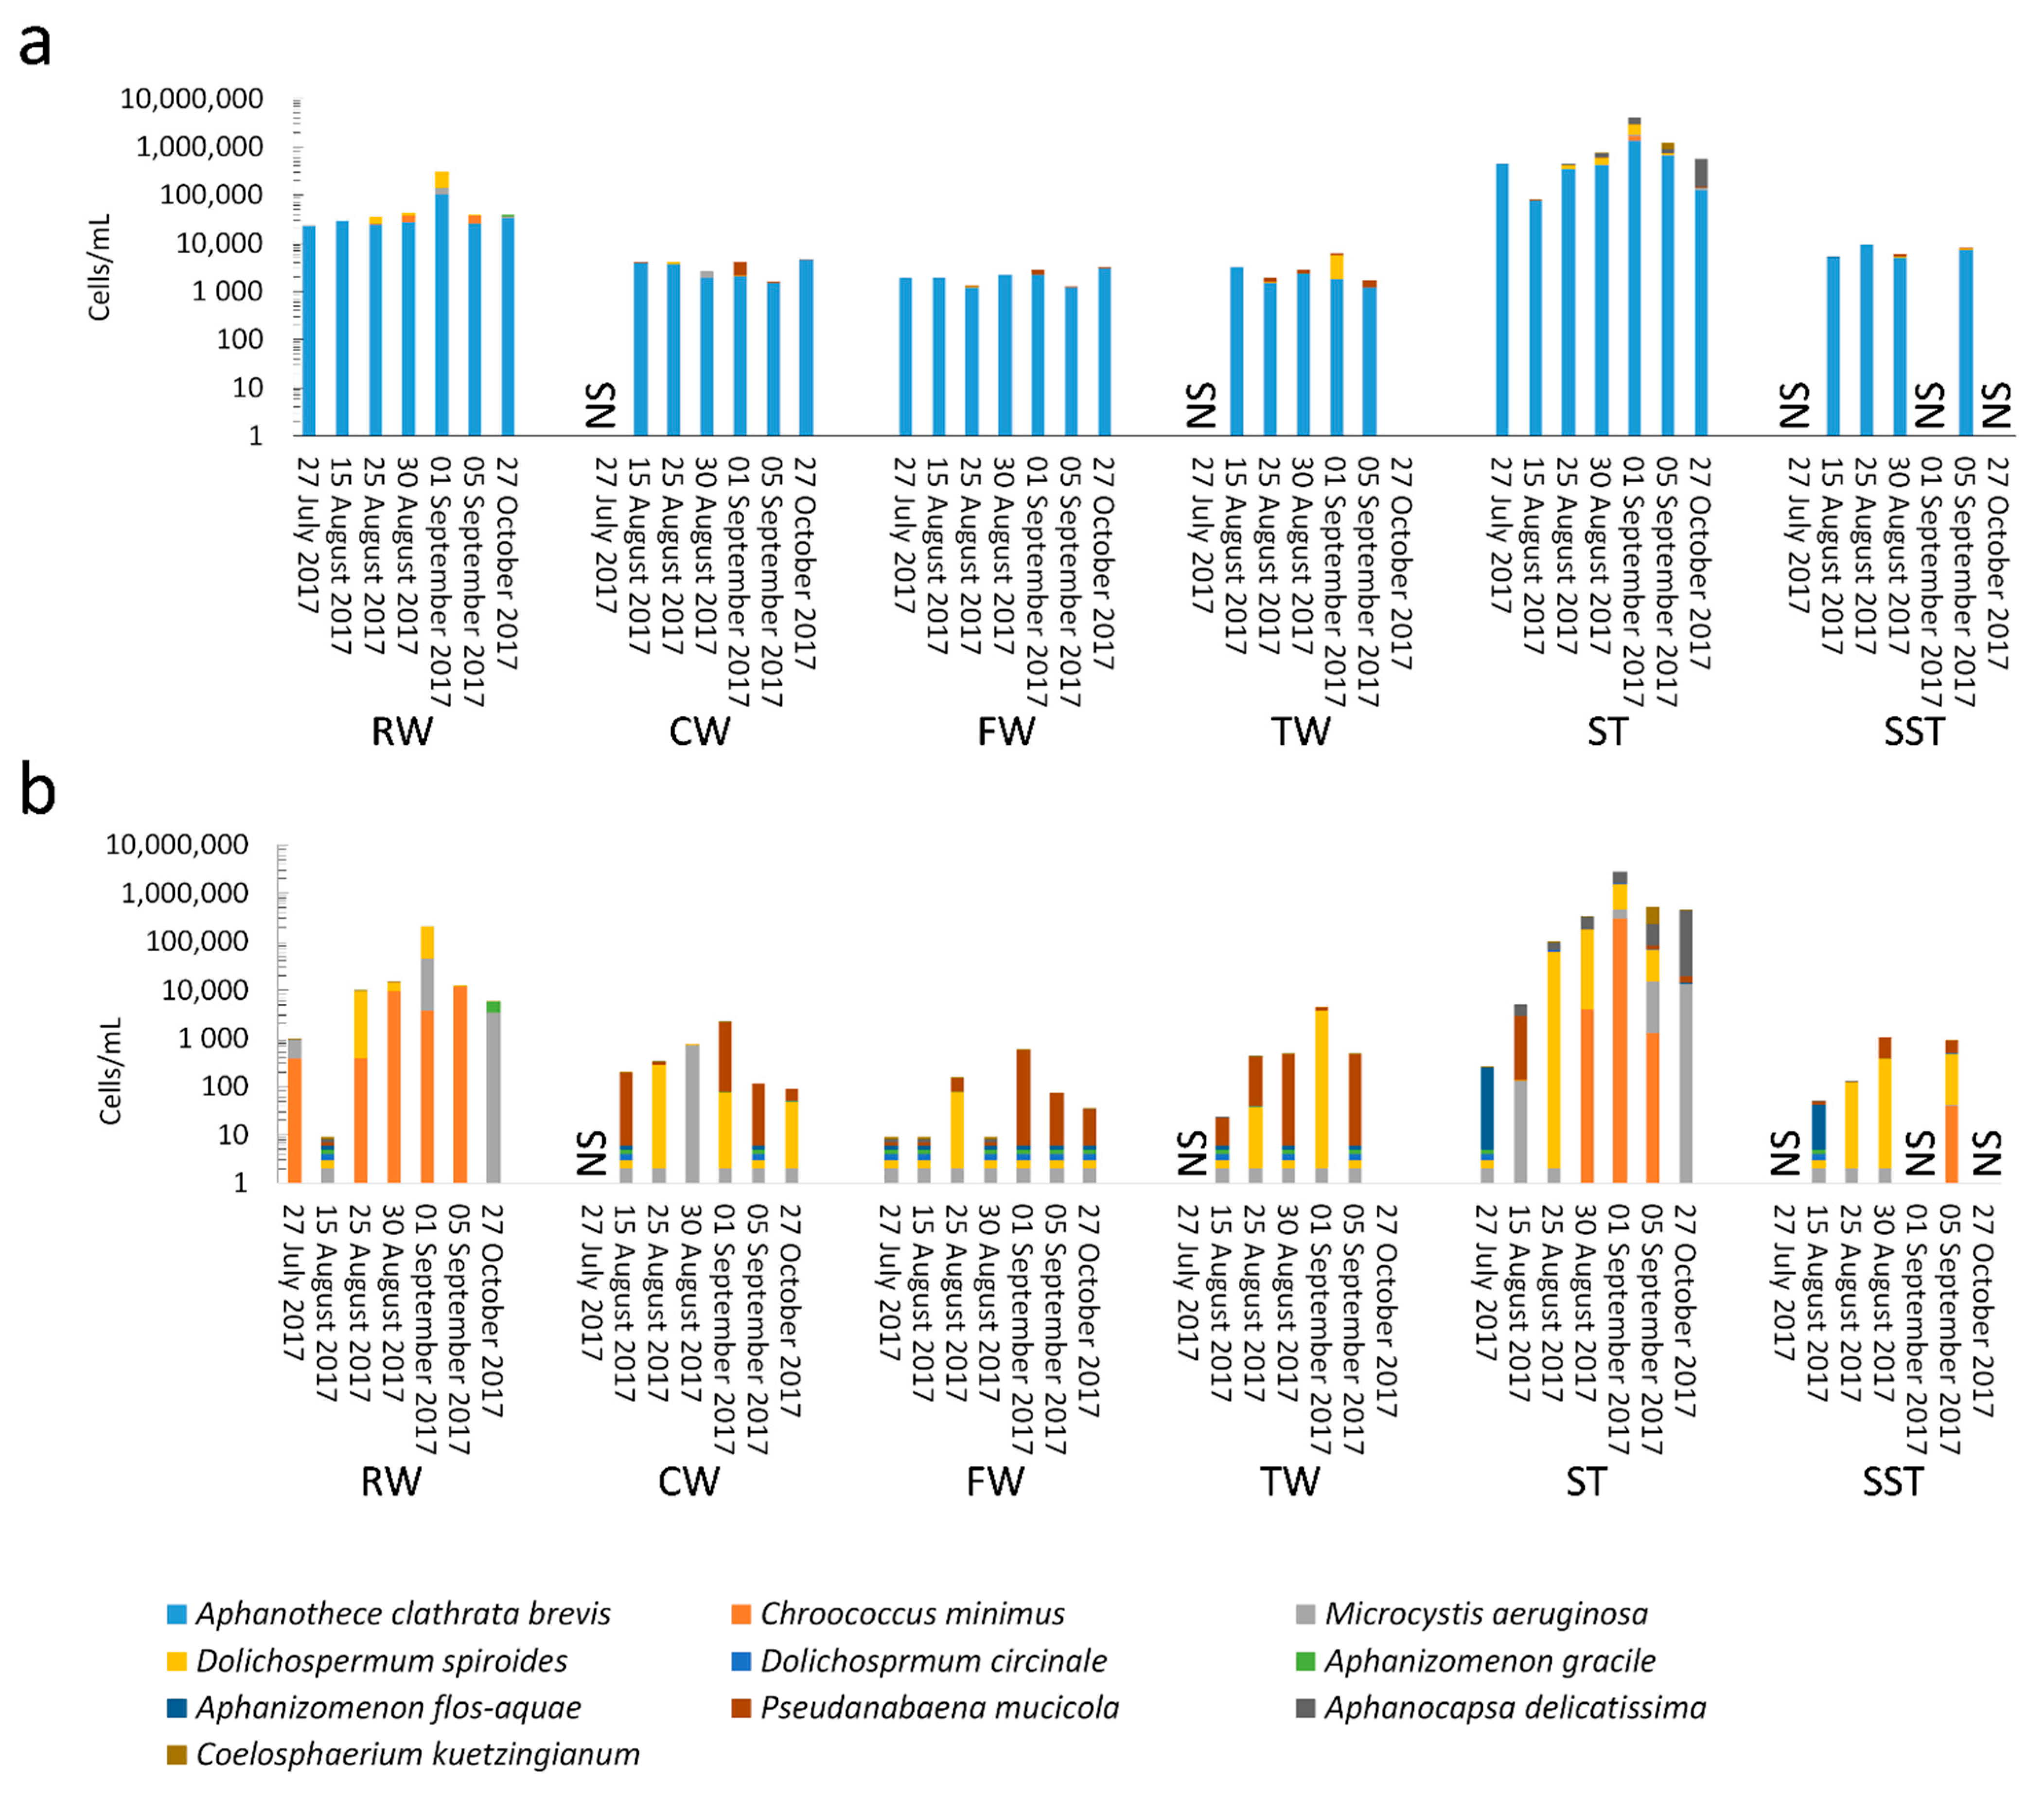
- Conventional treatment eliminated 92–97% of the cyanobacterial cells, as revealed by cell counts. Overall, 96% of Microcystis and Dolichospermum were eliminated by this process. At first glance, this is an effective approach to controlling the cyanobacterial flux. However, coagulation leads to accumulation of cyanobacterial cells in the sludge. Even a low cell number in intake water (3.9 × 10⁴ cells/mL) led to 31 times as much cell accumulation in the sludge.
- Selective removal of cyanobacteria at the genus and species levels by coagulation/sedimentation has been highlighted by both metagenomic shotgun sequencing and taxonomic cell counts. Sludge (ST) cyanobacterial composition differs from RW if only samples from the same day are considered. Sludge diversity reflects both selective removal by coagulation/sedimentation and the accumulation of captured cells over a period of time as determined by sludge age.
- Monitoring strategies focusing on sporadic measurement of the diversity in raw water cannot capture the risk associated with the storage and disposal of the sludge. Sludge community profiles also appear to be a better indicator for evaluating the influx of cyanobacterial communities in WTPs. Indeed, the sludge profile reflects a cumulative community in terms of relative abundance and biomass.
- Bacterial and cyanobacterial communities of sludge in the holding tank (ST) markedly differed from those measured in sludge supernatant (SST). The communities found in the ST and SST showed different trends at the phylum and genus level as shown by the Shannon index. The prediction of cyanobacterial communities in the supernatant remains a challenge as it is often recycled, possibly adding cyanobacteria and cyanotoxins to the intake water.
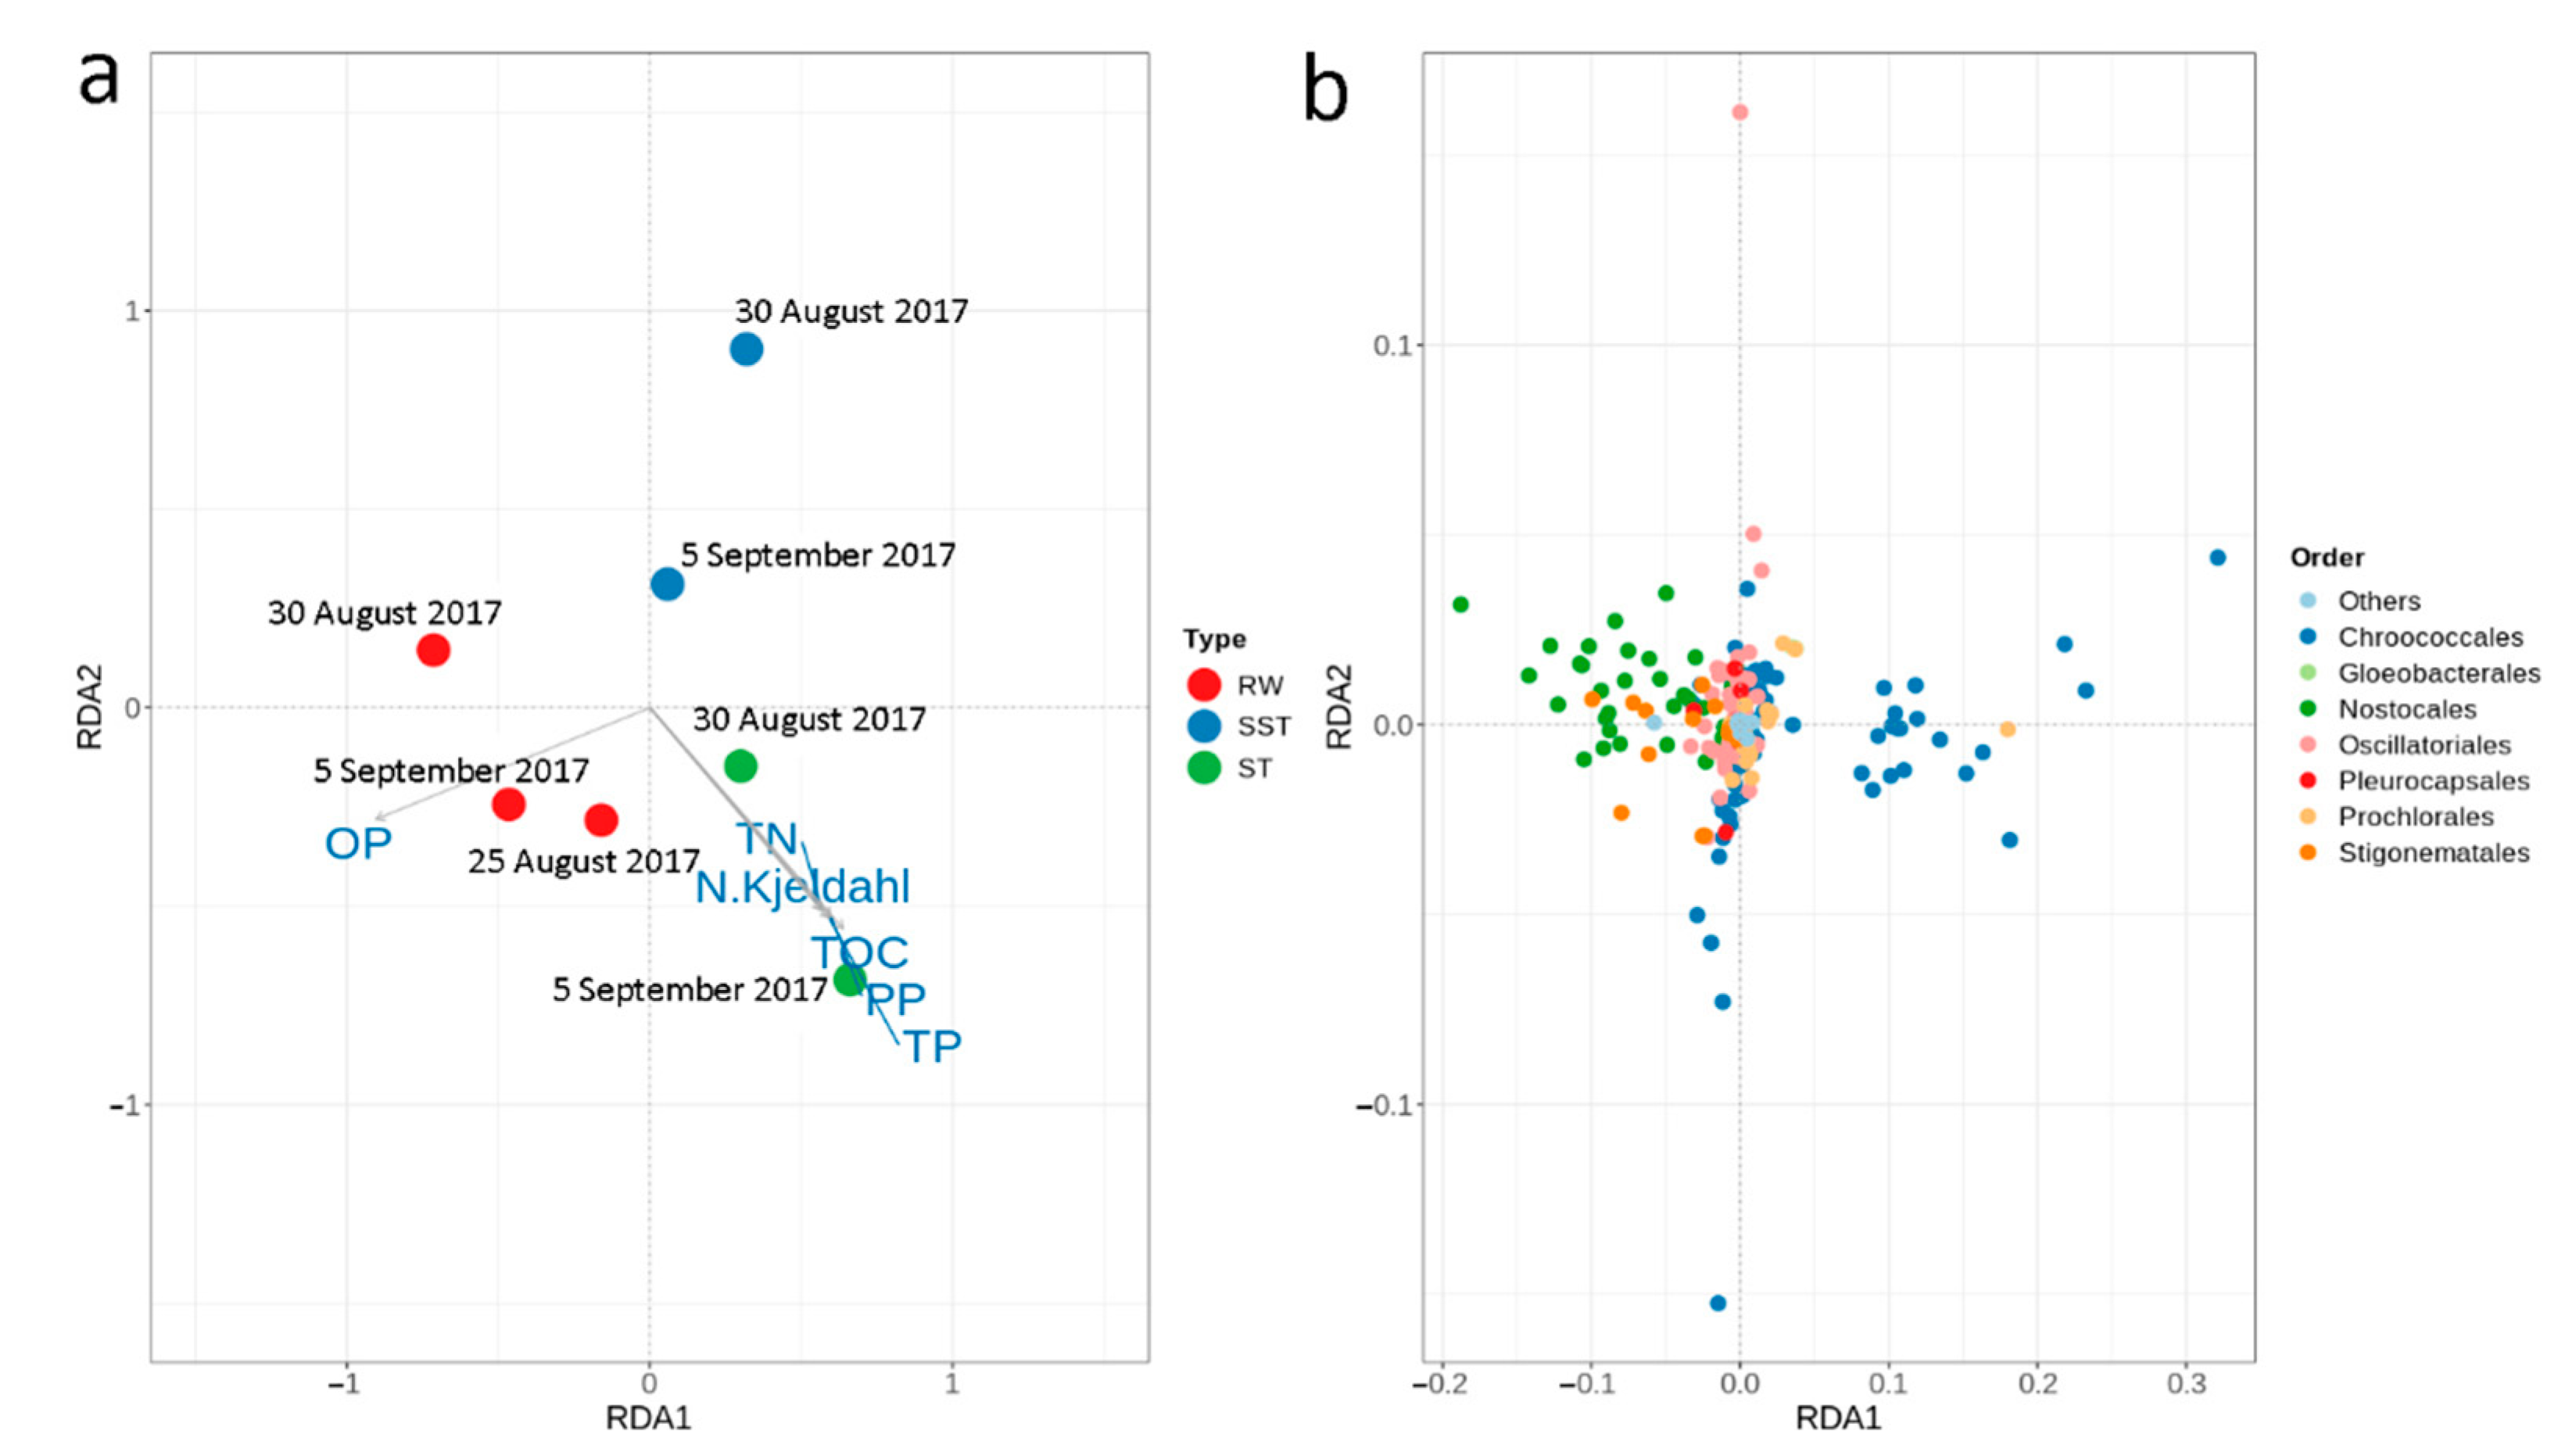
- Considering environmental parameters monitored, nutrients were the most discriminating factors affecting cyanobacterial communities. Cyanobacterial communities in RW were influenced by OP, while the sludge communities were correlated with TN, N- Kjeldahl, TP, PP, and TOC.
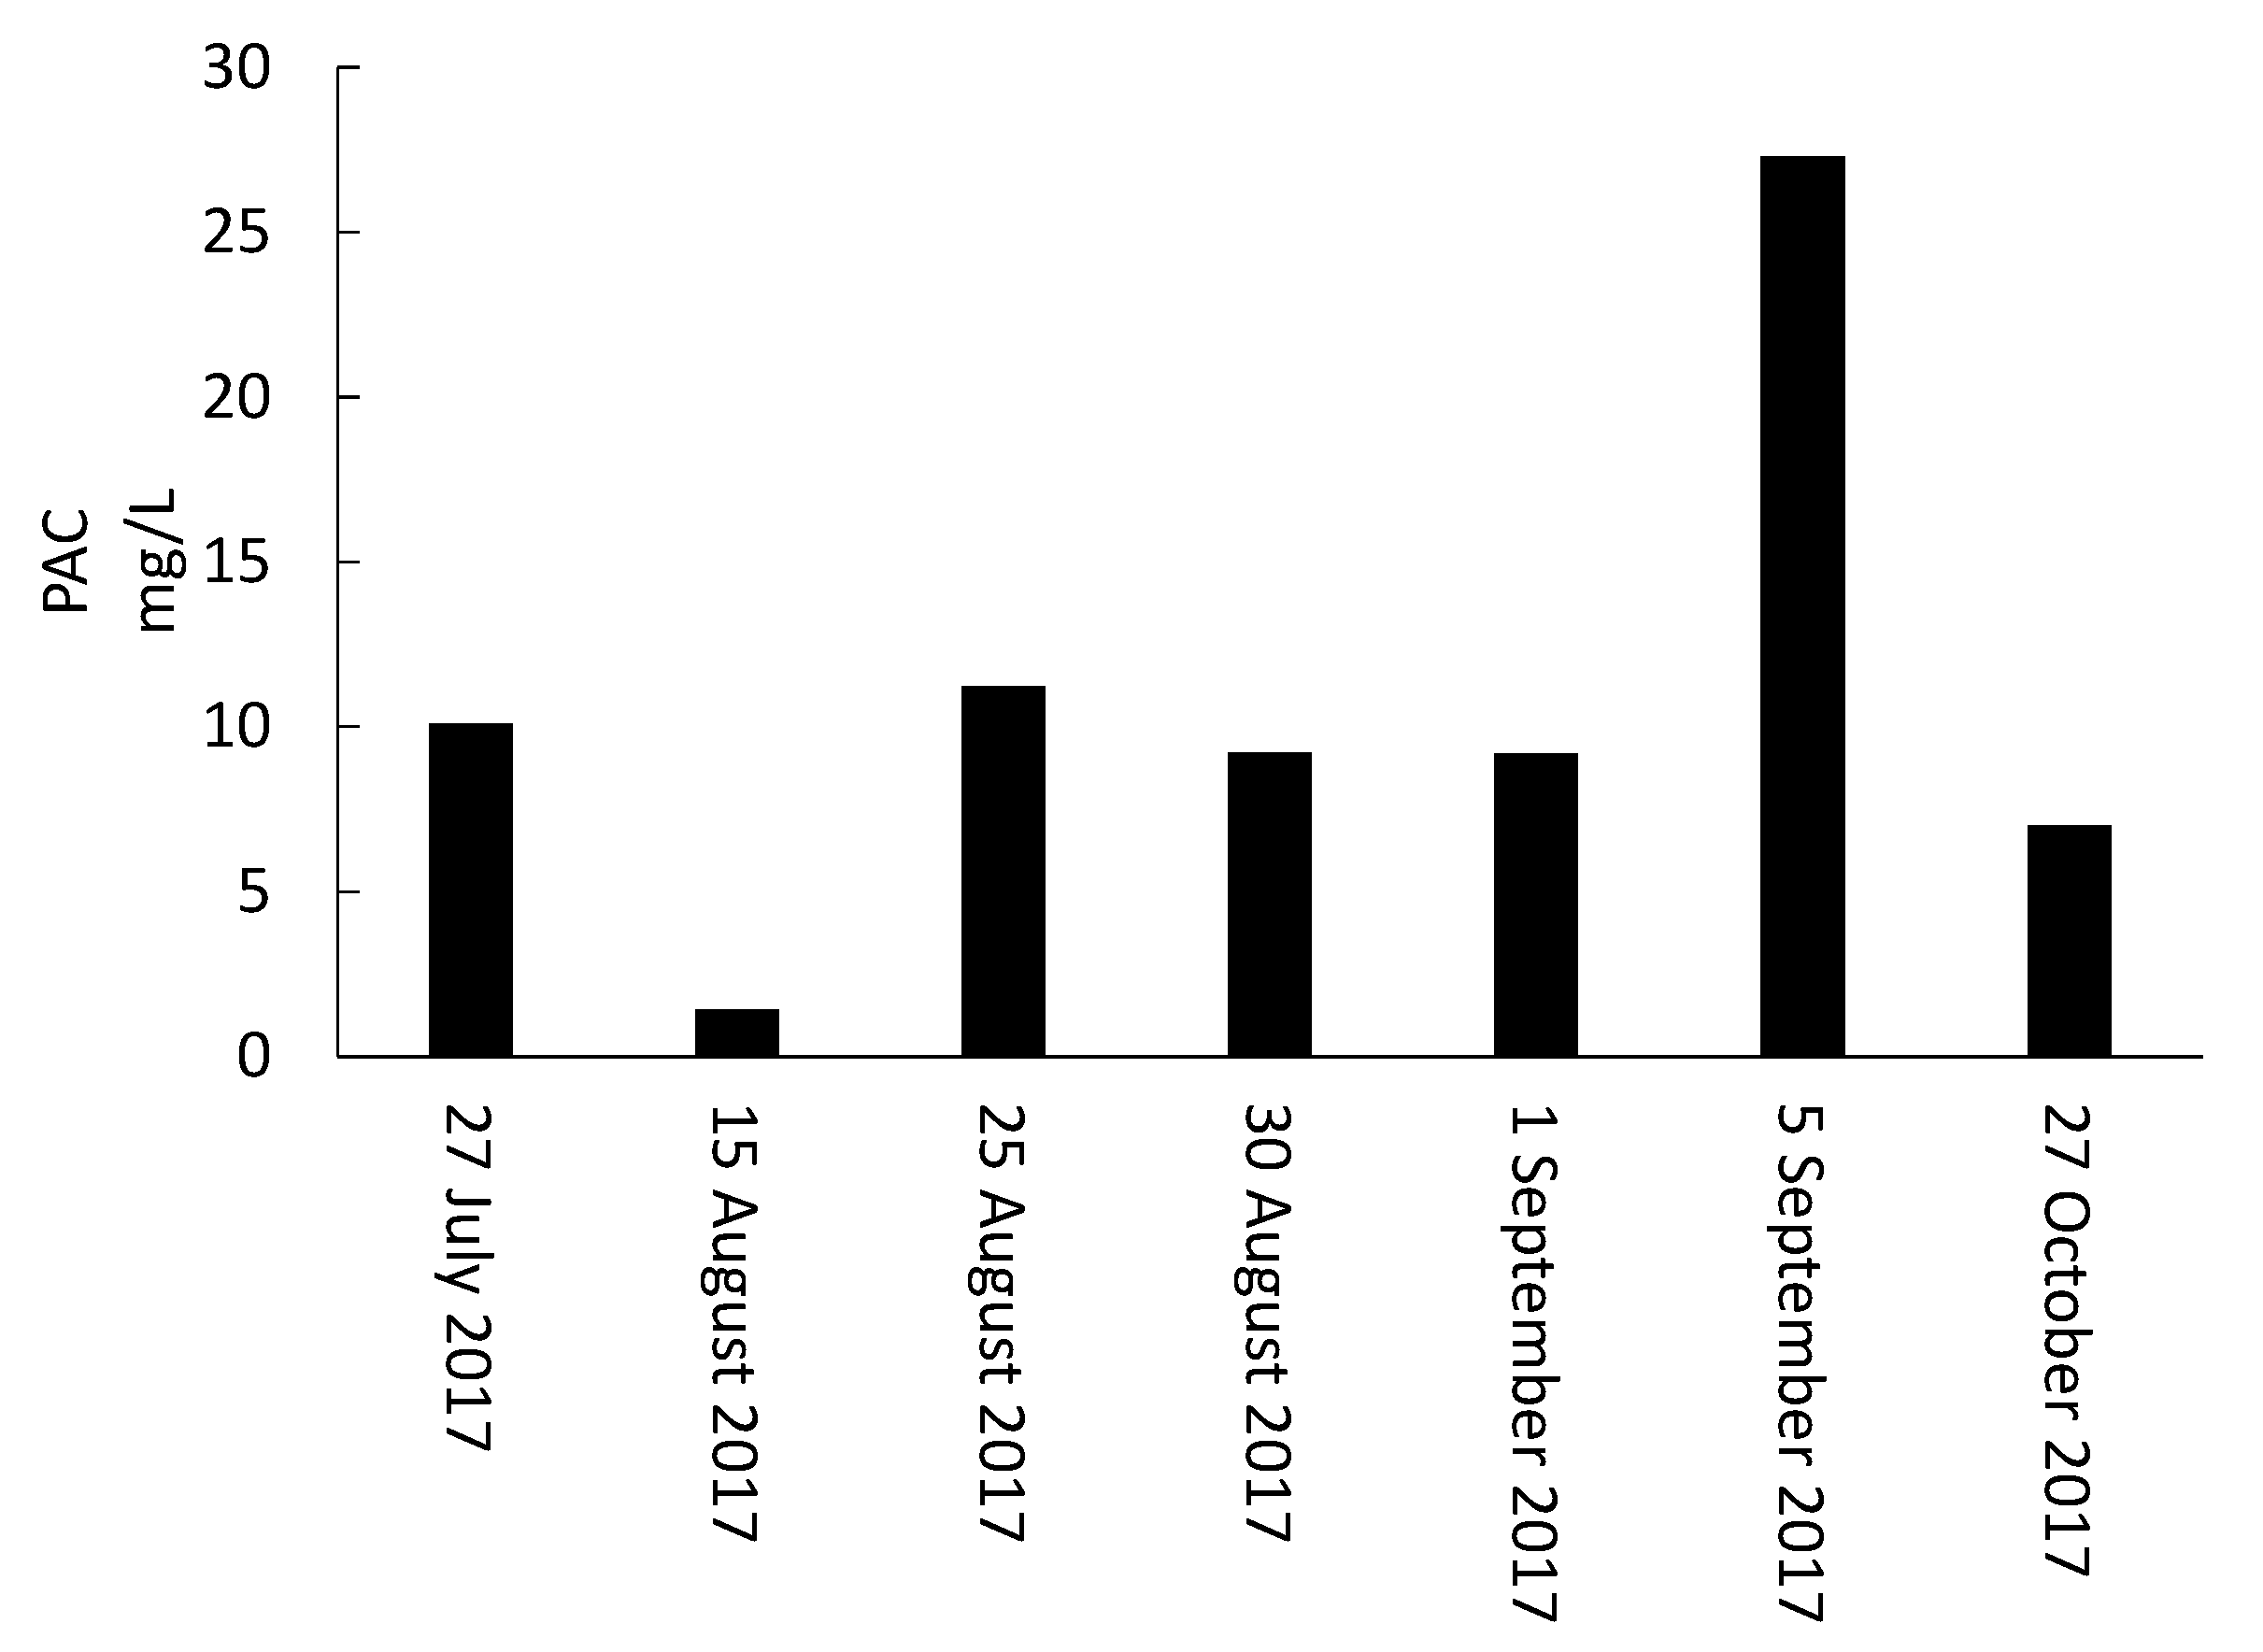
- Storage, management, and disposal of the cyanobacteria-laden sludge are technical and health-related challenges. By adjusting the storage time and adding PAC, risk assessment of supernatant recycling can be applied to minimize the impact of cyanobacteria and cyanotoxin accumulation.
4. Materials and Methods
4.1. Description of the Studied Water Body and Plant, Including Treatment Schematics
4.2. Description of the Studied Water Body and Plant Including Treatment Schematics
4.3. Description of Analytical Methods
4.3.1. Taxonomic Cell Counts
4.3.2. Microcystin Analysis
4.3.3. Nutrient Analysis
4.4. DNA Extraction and Metagenomics Preparation
4.5. Bioinformatics Analysis
4.6. Statistical Analysis
Supplementary Materials
Author Contributions
Funding
Institutional Review Board Statement
Informed Consent Statement
Data Availability Statement
Acknowledgments
Conflicts of Interest
References
- Westrick, J.A.; Szlag, D.C.; Southwell, B.J.; Sinclair, J. A review of cyanobacteria and cyanotoxins removal/inactivation in drinking water treatment. Anal. Bioanal. Chem. 2010, 397, 1705–1714. [Google Scholar] [CrossRef] [PubMed]
- Shang, L.; Feng, M.; Xu, X.; Liu, F.; Ke, F.; Li, W. Co-occurrence of microcystins and taste-and-odor compounds in drinking water source and their removal in a full-scale drinking water treatment plant. Toxins 2018, 10, 26. [Google Scholar] [CrossRef] [Green Version]
- Zamyadi, A.; Dorner, S.; Ellis, D.; Bolduc, A.; Bastien, C.; Prévost, M. Species-dependence of cyanobacteria removal efficiency by different drinking water treatment processes. Water Res. 2013, 47, 2689–2700. [Google Scholar] [CrossRef] [PubMed]
- Drikas, M.; Chow, C.W.K.; House, J.; Burch, M.D. Using coagulation, flocculation, and settling to remove toxic cyanobacteria. J. Am. Water Works Assoc. 2001, 93, 100–111. [Google Scholar] [CrossRef]
- Newcombe, G.; Nicholson, B. Water treatment options for dissolved cyanotoxins. Water Supply Res. Technol. Aqua 2004, 53, 227–239. [Google Scholar] [CrossRef]
- Pietsch, J.; Bornmann, K.; Schmidt, W. Relevance of intra- and extracellular cyanotoxins for drinking water treatment. Acta Hydrochim. Hydrobiol. 2002, 30, 7–15. [Google Scholar] [CrossRef]
- Pestana, C.J.; Capelo-Neto, J.; Lawton, L.; Oliveira, S.; Carloto, I.; Linhares, H.P. The effect of water treatment unit processes on cyanobacterial trichome integrity. Sci. Total Environ. 2019, 659, 1403–1414. [Google Scholar] [CrossRef]
- Zamyadi, A.; MacLeod, S.; Fan, Y.; McQuaid, N.; Dorner, S.; Sauvé, S.; Prévost, M. Toxic cyanobacterial breakthrough and accumulation in a drinking water plant: A monitoring and treatment challenge. Water Res. 2012, 46, 1511–1523. [Google Scholar] [CrossRef]
- Ho, L.; Dreyfus, J.; Boyer, J.E.; Lowe, T.; Bustamante, H.; Duker, P.; Meli, T.; Newcombe, G. Fate of cyanobacteria and their metabolites during water treatment sludge management processes. Sci. Total Environ. 2012, 424, 232–238. [Google Scholar] [CrossRef]
- Almuhtaram, H.; Cui, Y.; Zamyadi, A.; Hofmann, R. Cyanotoxins and cyanobacteria cell accumulations in drinking water treatment plants with a low risk of bloom formation at the source. Toxins 2018, 10, 430. [Google Scholar] [CrossRef] [Green Version]
- Zamyadi, A.; Dorner, S.; Ndong, M.; Ellis, D.; Bolduc, A.; Bastien, C.; Prévost, M. Low-risk cyanobacterial bloom sources: Cell accumulation within full-scale treatment plants. J. Am. Water Works Assoc. 2013, 102, E651–E663. [Google Scholar] [CrossRef] [Green Version]
- Li, X.; Pei, H.; Hu, W.; Meng, P.; Sun, F.; Ma, G.; Xu, X.; Li, Y. The fate of Microcystis aeruginosa cells during the ferric chloride coagulation and flocs storage processes. Environ. Technol. 2015, 36, 920–928. [Google Scholar] [CrossRef] [PubMed]
- Sun, F.; Pei, H.-Y.; Hu, W.-R.; Li, X.-Q.; Ma, C.-X.; Pei, R.-T. The cell damage of Microcystis aeruginosa in PACl coagulation and floc storage processes. Sep. Purif. Technol. 2013, 115, 123–128. [Google Scholar] [CrossRef]
- Sun, F.; Pei, H.-Y.; Hu, W.-R.; Ma, C.-X. The lysis of Microcystis aeruginosa in AlCl3 coagulation and sedimentation processes. Chem. Eng. J. 2012, 193–194, 196–202. [Google Scholar] [CrossRef]
- Water Research Foundation (WRF); Water Research Australia. Optimizing Conventional Treatment for the Removal of Cyanobacteria and Toxins; Water Research Foundation: Denver, CO, USA, 2015; p. 185. ISBN 978-1-60573-216-9. [Google Scholar]
- Pestana, C.J.; Reeve, P.J.; Sawade, E.; Voldoire, C.F.; Newton, K.; Praptiwi, R.; Collingnon, L.; Dreyfus, J.; Hobson, P.; Gaget, V.; et al. Fate of cyanobacteria in drinking water treatment plant lagoon supernatant and sludge. Sci. Total Environ. 2016, 565, 1192–1200. [Google Scholar] [CrossRef] [PubMed]
- Zamyadi, A.; Romanis, C.; Mills, T.; Neilan, B.; Choo, F.; Coral, L.A.; Gale, D.; Newcombe, G.; Crosbie, N.; Stuetz, R.; et al. Diagnosing water treatment critical control points for cyanobacterial removal: Exploring benefits of combined microscopy, next-generation sequencing, and cell integrity methods. Water Res. 2019, 152, 96–105. [Google Scholar] [CrossRef]
- Water Research Foundation (WRF); United States Environmental Protection Agency (US EPA); Veolia Water Indianapolis. Strategies for Controlling and Mitigating Algal Growth within Water Treatment Plants; Water Research Foundation: Denver, CO, USA, 2009; p. 312.
- Dreyfus, J.; Monrolin, Y.; Pestana, C.J.; Reeve, P.J.; Sawade, E.; Newton, K.; Ho, L.; Chow, C.W.K.; Newcombe, G. Identification and assessment of water quality risks associated with sludge supernatant recycling in the presence of cyanobacteria. J. Water Supply Res. Technol. Aqua 2016, 65, 441–452. [Google Scholar] [CrossRef]
- Merel, S.; Walker, D.; Chicana, R.; Snyder, S.; Baures, E.; Thomas, O. State of knowledge and concerns on cyanobacterial blooms and cyanotoxins. Environ. Int. 2013, 59, 303–327. [Google Scholar] [CrossRef]
- Cook, D.; Newcombe, G. Removal of microcystin variants with powdered activated carbon. Water Sci. Technol. Water Supply 2002, 2, 201–207. [Google Scholar] [CrossRef]
- Ho, L.; Lambling, P.; Bustamante, H.; Duker, P.; Newcombe, G. Application of powdered activated carbon for the adsorption of cylindrospermopsin and microcystin toxins from drinking water supplies. Water Res. 2011, 45, 2954–2964. [Google Scholar] [CrossRef]
- Newcombe, G.; Cook, D.; Brooke, S.; Ho, L.; Slyman, N. Treatment options for microcystin toxins: Similarities and differences between variants. Environ. Technol. 2003, 24, 299–308. [Google Scholar] [CrossRef] [PubMed]
- Tromas, N.; Fortin, N.; Bedrani, L.; Terrat, Y.; Cardoso, P.; Bird, D.; Greer, C.W.; Shapiro, B.J. Characterising and predicting cyanobacterial blooms in an 8-year amplicon sequencing time course. ISME J. 2017, 11, 1746–1763. [Google Scholar] [CrossRef] [PubMed] [Green Version]
- Berry, M.A.; Davis, T.W.; Cory, R.M.; Duhaime, M.B.; Johengen, T.H.; Kling, G.W.; Marino, J.A.; Den Uyl, P.A.; Gossiaux, D.; Dick, G.J.; et al. Cyanobacterial harmful algal blooms are a biological disturbance to Western Lake Erie bacterial communities. Environ. Microbiol. 2017, 19, 1149–1162. [Google Scholar] [CrossRef] [PubMed]
- Li, Q.; Yu, S.; Li, L.; Liu, G.; Gu, Z.; Liu, M.; Liu, Z.; Ye, Y.; Xia, Q.; Ren, L. Microbial Communities Shaped by Treatment Processes in a Drinking Water Treatment Plant and Their Contribution and Threat to Drinking Water Safety. Front. Microbiol. 2017, 8, 2465. [Google Scholar] [CrossRef] [PubMed] [Green Version]
- Pinto, A.J.; Xi, C.; Raskin, L. Bacterial community structure in the drinking water microbiome is governed by filtration processes. Environ. Sci. Technol. 2012, 46, 8851–8859. [Google Scholar] [CrossRef]
- Zhang, Y.; Oh, S.; Liu, W.T. Impact of drinking water treatment and distribution on the microbiome continuum: An ecological disturbance’s perspective. Environ. Microbiol. 2017, 19, 3163–3174. [Google Scholar] [CrossRef]
- Ma, X.; Li, G.; Chen, R.; Yu, Y.; Tao, H.; Zhang, G.; Shi, B. Revealing the changes of bacterial community from water source to consumers tap: A full-scale investigation in eastern city of China. J. Environ. Sci. 2020, 87, 331–340. [Google Scholar] [CrossRef]
- Chao, Y.; Ma, L.; Yang, Y.; Ju, F.; Zhang, X.X.; Wu, W.M.; Zhang, T. Metagenomic analysis reveals significant changes of microbial compositions and protective functions during drinking water treatment. Sci. Rep. 2013, 3, 3550. [Google Scholar] [CrossRef]
- Lautenschlager, K.; Hwang, C.; Ling, F.; Liu, W.-T.; Boon, N.; Köster, O.; Egli, T.; Hammes, F. Abundance and composition of indigenous bacterial communities in a multi-step biofiltration-based drinking water treatment plant. Water Res. 2014, 62, 40–52. [Google Scholar] [CrossRef]
- Lin, W.; Yu, Z.; Zhang, H.; Thompson, I.P. Diversity and dynamics of microbial communities at each step of treatment plant for potable water generation. Water Res. 2014, 52, 218–230. [Google Scholar] [CrossRef]
- Xu, H.; Pei, H.; Jin, Y.; Ma, C.; Wang, Y.; Sun, J.; Li, H. High-throughput sequencing reveals microbial communities in drinking water treatment sludge from six geographically distributed plants, including potentially toxic cyanobacteria and pathogens. Sci. Total Environ. 2018, 634, 769–779. [Google Scholar] [CrossRef] [PubMed]
- Pei, H.; Xu, H.; Wang, J.; Jin, Y.; Xiao, H.; Ma, C.; Sun, J.; Li, H. 16S rRNA Gene amplicon sequencing reveals significant changes in microbial compositions during cyanobacteria-laden drinking water sludge storage. Environ. Sci. Technol. 2017, 51, 12774–12783. [Google Scholar] [CrossRef] [PubMed]
- Teixeira, M.R.; Rosa, M.J. Comparing dissolved air flotation and conventional sedimentation to remove cyanobacterial cells of Microcystis aeruginosa. Part II. The effect of water background organics. Sep. Purif. Technol. 2007, 53, 126–134. [Google Scholar] [CrossRef]
- Chorus, I.; Bartram, J. Chapter 6. Situation assessment, planning and management. In Toxic Cyanobacteria in Water: A Guide to Their Public Health Consequences, Monitoring and Management; WHO: Geneva, Switzerland, 1999; p. 28. [Google Scholar]
- Maghsoudi, E.; Fortin, N.; Greer, C.; Vo Duy, S.; Fayad, P.; Sauvé, S.; Prévost, M.; Dorner, S. Biodegradation of multiple microcystins and cylindrospermopsin in clarifier sludge and drinking water source: Effects of particulate attached bacteria and phycocyanin. Ecotoxicol. Environ. Saf. 2015, 120, 409–417. [Google Scholar] [CrossRef] [PubMed]
- Guedes, I.A.; Rachid, C.; Rangel, L.M.; Silva, L.H.S.; Bisch, P.M.; Azevedo, S.; Pacheco, A.B.F. Close Link Between Harmful Cyanobacterial Dominance and Associated Bacterioplankton in a Tropical Eutrophic Reservoir. Front. Microbiol. 2018, 9, 424. [Google Scholar] [CrossRef] [PubMed]
- Kim, M.; Lee, J.; Yang, D.; Park, H.Y.; Park, W. Seasonal dynamics of the bacterial communities associated with cyanobacterial blooms in the Han River. Environ. Pollut. 2020, 266, 115198. [Google Scholar] [CrossRef]
- Cai, H.; Jiang, H.; Krumholz, L.R.; Yang, Z. Bacterial community composition of size-fractioned aggregates within the phycosphere of cyanobacterial blooms in a eutrophic freshwater lake. PLoS ONE 2014, 9, e102879. [Google Scholar] [CrossRef] [Green Version]
- Aktas, T.S.; Takeda, F.; Maruo, C.; Chiba, N.; Nishimura, O. A comparison of zeta potentials and coagulation behaviors of cyanobacteria and algae. Desalin. Water Treat. 2012, 48, 294–301. [Google Scholar] [CrossRef]
- Arii, S.; Tsuji, K.; Tomita, K.; Hasegawa, M.; Bober, B.; Harada, K. Cyanobacterial blue color formation during lysis under natural conditions. Appl. Environ. Microbiol. 2015, 81, 2667–2675. [Google Scholar] [CrossRef] [Green Version]
- Reynolds, C.S.; Oliver, R.L.; Walsby, A.E. Cyanobacterial dominance: The role of buoyancy regulation in dynamic lake environments. N. Z. J. Mar. Freshw. Res. 1987, 21, 379–390. [Google Scholar] [CrossRef]
- Sun, F.; Hu, W.; Pei, H.; Li, X.; Xu, X.; Ma, C. Evaluation on the dewatering process of cyanobacteria-containing AlCl3 and PACl drinking water sludge. Sep. Purif. Technol. 2015, 150, 52–62. [Google Scholar] [CrossRef]
- Lu, J.; Zhu, B.; Struewing, I.; Xu, N.; Duan, S. Nitrogen-phosphorus-associated metabolic activities during the development of a cyanobacterial bloom revealed by metatranscriptomics. Sci. Rep. 2019, 9, 2480. [Google Scholar] [CrossRef] [PubMed] [Green Version]
- Jankowiak, J.; Hattenrath-Lehmann, T.; Kramer, B.J.; Ladds, M.; Gobler, C.J. Deciphering the effects of nitrogen, phosphorus, and temperature on cyanobacterial bloom intensification, diversity, and toxicity in western Lake Erie. Limnol. Oceanogr. 2019, 64, 1347–1370. [Google Scholar] [CrossRef] [Green Version]
- Lopez, J.S.; Garcia, N.S.; Talmy, D.; Martiny, A.C. Diel variability in the elemental composition of the marine cyanobacteriumSynechococcus. J. Plankton Res. 2016, 38, 1052–1061. [Google Scholar] [CrossRef] [Green Version]
- Moradinejad, S.; Trigui, H.; Guerra Maldonado, J.F.; Shapiro, J.; Terrat, Y.; Zamyadi, A.; Dorner, S.; Prevost, M. Diversity Assessment of Toxic Cyanobacterial Blooms during Oxidation. Toxins 2020, 12, 728. [Google Scholar] [CrossRef] [PubMed]
- Ellegaard, M.; Clokie, M.R.J.; Czypionka, T.; Frisch, D.; Godhe, A.; Kremp, A.; Letarov, A.; McGenity, T.J.; Ribeiro, S.; John Anderson, N. Dead or alive: Sediment DNA archives as tools for tracking aquatic evolution and adaptation. Commun. Biol. 2020, 3, 169. [Google Scholar] [CrossRef] [Green Version]
- Park, J.; Kim, Y.; Kim, M.; Lee, W.H. A novel method for cell counting of Microcystis colonies in water resources using a digital imaging flow cytometer and microscope. Environ. Eng. Res. 2018, 24, 397–403. [Google Scholar] [CrossRef]
- America Water Works Association (AWWA). Algae Source to Treatment. Manual of Water Supply Practices—M57, 1st ed.; America Water Works Association: Washington, DC, USA, 2010; p. 481. [Google Scholar]
- Hawkins, P.R.; Holliday, J.; Kathuria, A.; Bowling, L. Change in cyanobacterial biovolume due to preservation by Lugol’s Iodine. Harmful Algae 2005, 4, 1033–1043. [Google Scholar] [CrossRef]
- Bag, S.; Saha, B.; Mehta, O.; Anbumani, D.; Kumar, N.; Dayal, M.; Pant, A.; Kumar, P.; Saxena, S.; Allin, K.H.; et al. An improved method for high quality metagenomics DNA extraction from human and environmental samples. Sci. Rep. 2016, 6, 26775. [Google Scholar] [CrossRef]
- Kuczynski, J.; Lauber, C.L.; Walters, W.A.; Parfrey, L.W.; Clemente, J.C.; Gevers, D.; Knight, R. Experimental and analytical tools for studying the human microbiome. Nat. Rev. Genet. 2011, 13, 47–58. [Google Scholar] [CrossRef] [Green Version]
- Gevers, D.; Pop, M.; Schloss, P.D.; Huttenhower, C. Bioinformatics for the Human Microbiome Project. PLoS Comput. Biol. 2012, 8, e1002779. [Google Scholar] [CrossRef] [PubMed] [Green Version]
- Teeling, H.; Glockner, F.O. Current opportunities and challenges in microbial metagenome analysis—A bioinformatic perspective. Brief. Bioinform. 2012, 13, 728–742. [Google Scholar] [CrossRef] [PubMed]
- Lund, J.W.G.; Kipling, C.; Le Cren, E.D. The inverted microscope method of estimating algal number and the statistical basis of estimations by counting. Hydrobiologia 1958, 11, 143–170. [Google Scholar] [CrossRef]
- Lund, J.W.G. A simple counting chamber for Nannoplankton. Limnol. Oceanogr. 1959, 4, 57–65. [Google Scholar] [CrossRef]
- Planas, D.; Desrosiers, M.; Groulx, S.R.; Paquet, S.; Carignan, R. Pelagic and benthic algal responses in eastern Canadian Boreal Shield lakes following harvesting and wildfires. Can. J. Fish. Aquat. Sci. 2000, 57, 136–145. [Google Scholar] [CrossRef]
- Munoz, G.; Vo Duy, S.; Roy-Lachapelle, A.; Husk, B.; Sauve, S. Analysis of individual and total microcystins in surface water by on-line preconcentration and desalting coupled to liquid chromatography tandem mass spectrometry. J. Chromatogr. 2017, 1516, 9–20. [Google Scholar] [CrossRef]
- Roy-Lachapelle, A.; Vo Duy, S.; Munoz, G.; Dinh, Q.T.; Bahl, E.; Simon, D.F.; Sauvé, S. Analysis of multiclass cyanotoxins (microcystins, anabaenopeptins, cylindrospermopsin and anatoxins) in lake waters using on-line SPE liquid chromatography high-resolution Orbitrap mass spectrometry. Anal. Methods 2019. [Google Scholar] [CrossRef] [Green Version]
- United States Environmental Protection Agency (USEPA). Method 350.1: Determination of Ammonia Nitrogen by Semi-Automated Colorimetry; United States Environmental Protection Agency: Washington, DC, USA, 1993; pp. 1–15.
- United States Environmental Protection Agency (USEPA). Method 353.2, Revision 2.0: Determination of Nitrate-Nitrite Nitrogen by Automated Colorimetry; United States Environmental Protection Agency: Washington, DC, USA, 1993; pp. 1–15.
- United States Environmental Protection Agency (USEPA). Method 365.3: Phosphorous, All Forms (Colorimetric, Ascorbic Acid, Two Reagent); United States Environmental Protection Agency: Washington, DC, USA, 1978; pp. 1–5.
- United States Environmental Protection Agency (USEPA). Method 415.1. Organic Carbon, Total (Combustion or Oxidation); United States Environmental Protection Agency: Washington, DC, USA, 1974; pp. 1–3.
- Cox, M.P.; Peterson, D.A.; Biggs, P.J. SolexaQA: At-a-glance quality assessment of Illumina second-generation sequencing data. BMC Bioinform. 2010, 11, 485. [Google Scholar] [CrossRef] [Green Version]
- Kim, D.; Hahn, A.S.; Wu, S.-J.; Hanson, N.W.; Konwar, K.M.; Hallam, S.J. FragGeneScan-plus for scalable high-throughput short-read open reading frame prediction. In Proceedings of the 2015 IEEE Conference on Computational Intelligence in Bioinformatics and Computational Biology (CIBCB), Niagara Falls, ON, Canada, 12–15 August 2015; pp. 1–8. [Google Scholar]
- Fu, L.; Niu, B.; Zhu, Z.; Wu, S.; Li, W. CD-HIT: Accelerated for clustering the next-generation sequencing data. Bioinformatics 2012, 28, 3150–3152. [Google Scholar] [CrossRef]
- Buchfink, B.; Xie, C.; Huson, D.H. Fast and sensitive protein alignment using DIAMOND. Nat. Methods 2015, 12, 59–60. [Google Scholar] [CrossRef]
- McMurdie, P.J.; Holmes, S. phyloseq: An R package for reproducible interactive analysis and graphics of microbiome census data. PLoS ONE 2013, 8, e61217. [Google Scholar] [CrossRef] [PubMed] [Green Version]
- Graffelman, J. Compositional data analysis in practice. Michael J.Greenacre. (2018). London: CRC Press. 136 pages, ISBN: 978-1-138-31661-4. Biom. J. 2019. [Google Scholar] [CrossRef]
- Foster, Z.S.; Sharpton, T.J.; Grunwald, N.J. Metacoder: An R package for visualization and manipulation of community taxonomic diversity data. PLoS Comput. Biol. 2017, 13, e1005404. [Google Scholar] [CrossRef] [PubMed] [Green Version]
- Blanchet, F.G.; Legendre, P.; Borcard, D. Forward selection of explanatory variables. Ecology 2008, 89, 2623–2632. [Google Scholar] [CrossRef]


Publisher’s Note: MDPI stays neutral with regard to jurisdictional claims in published maps and institutional affiliations. |
© 2021 by the authors. Licensee MDPI, Basel, Switzerland. This article is an open access article distributed under the terms and conditions of the Creative Commons Attribution (CC BY) license (http://creativecommons.org/licenses/by/4.0/).
Share and Cite
Jalili, F.; Trigui, H.; Guerra Maldonado, J.F.; Dorner, S.; Zamyadi, A.; Shapiro, B.J.; Terrat, Y.; Fortin, N.; Sauvé, S.; Prévost, M. Can Cyanobacterial Diversity in the Source Predict the Diversity in Sludge and the Risk of Toxin Release in a Drinking Water Treatment Plant? Toxins 2021, 13, 25. https://doi.org/10.3390/toxins13010025
Jalili F, Trigui H, Guerra Maldonado JF, Dorner S, Zamyadi A, Shapiro BJ, Terrat Y, Fortin N, Sauvé S, Prévost M. Can Cyanobacterial Diversity in the Source Predict the Diversity in Sludge and the Risk of Toxin Release in a Drinking Water Treatment Plant? Toxins. 2021; 13(1):25. https://doi.org/10.3390/toxins13010025
Chicago/Turabian StyleJalili, Farhad, Hana Trigui, Juan Francisco Guerra Maldonado, Sarah Dorner, Arash Zamyadi, B. Jesse Shapiro, Yves Terrat, Nathalie Fortin, Sébastien Sauvé, and Michèle Prévost. 2021. "Can Cyanobacterial Diversity in the Source Predict the Diversity in Sludge and the Risk of Toxin Release in a Drinking Water Treatment Plant?" Toxins 13, no. 1: 25. https://doi.org/10.3390/toxins13010025
APA StyleJalili, F., Trigui, H., Guerra Maldonado, J. F., Dorner, S., Zamyadi, A., Shapiro, B. J., Terrat, Y., Fortin, N., Sauvé, S., & Prévost, M. (2021). Can Cyanobacterial Diversity in the Source Predict the Diversity in Sludge and the Risk of Toxin Release in a Drinking Water Treatment Plant? Toxins, 13(1), 25. https://doi.org/10.3390/toxins13010025