Article

The Efficacy of Hydrogen Peroxide in Mitigating Cyanobacterial Blooms and Altering Microbial Communities across Four Lakes in NY, USA

by
Mark W. Lusty
and
Christopher J. Gobler
*
School of Marine and Atmospheric Sciences, Stony Brook University, Southampton, NY 11968, USA
*
Author to whom correspondence should be addressed.
Toxins 2020, 12(7), 428; https://doi.org/10.3390/toxins12070428
Submission received: 3 June 2020 / Revised: 21 June 2020 / Accepted: 22 June 2020 / Published: 29 June 2020
(This article belongs to the Special Issue Removal of Cyanobacteria and Cyanotoxins in Waters)

Abstract

:
Hydrogen peroxide (H2O2) has been proposed as an agent to mitigate toxic cyanobacterial blooms due to the heightened sensitivity of cyanobacteria to reactive oxygen species relative to eukaryotic organisms. Here, experiments were conducted using water from four diverse, eutrophic lake ecosystems to study the effects of H2O2 on cyanobacteria and non-target members of the microbial community. H2O2 was administered at 4 µg L−1 and a combination of fluorometry, microscopy, flow cytometry, and high throughput DNA sequencing were used to quantify the effects on eukaryotic and prokaryotic plankton communities. The addition of H2O2 resulted in a significant reduction in cyanobacteria levels in nearly all experiments (10 of 11), reducing their relative abundance from, on average, 85% to 29% of the total phytoplankton community with Planktothrix being highly sensitive, Microcystis being moderately sensitive, and Cylindrospermopsis being most resistant. Concurrently, eukaryotic algal levels increased in 75% of experiments. The bacterial phyla Actinobacteria, cyanobacteria, Planctomycetes, and Verrucomicrobia were most negatively impacted by H2O2, with Actinobacteria being the most sensitive. The ability of H2O2 to reduce, but not fully eliminate, cyanobacteria from the eutrophic water bodies studied here suggests it may not be an ideal mitigation approach in high biomass ecosystems.
Key Contribution: Use of high throughput DNA sequencing of the 16s RNA gene to quantify the effects of H2O2 on cyanobacteria and non-target prokaryotic plankton.

1. Introduction

Cyanobacteria, or blue-green algae, are photosynthetic prokaryotes that are ubiquitous in fresh and marine waterbodies. Blooms of cyanobacteria in eutrophic waters can be associated with light attenuation and hypoxia, and some bloom-forming cyanobacteria are capable of producing a suite of toxins, most commonly the hepatotoxin, microcystin [1]. Consequently, the World Health Organization (WHO) and US EPA have set drinking water and bathing guidance values microcystin [2,3]. In addition to exposure through drinking water and bathing, cyanotoxins can be ingested through the consumption of fish and shellfish [4,5,6]. These toxins can also affect animals; between 2007 and 2011, there were 67 cases of dog poisonings due to toxic cyanobacteria blooms across the U.S., 38 of which were fatal [7].
The occurrence of harmful cyanobacterial blooms is often linked to excessive anthropogenic eutrophication [5,8,9] but reducing nutrient loads can be a difficult and lengthy process that can involve changing fertilizer and wastewater disposal practices. Hence, there is interest in identifying mitigation approaches that can selectively target and remove toxic cyanobacterial blooms in order to prevent exposure and harm. Hydrogen peroxide (H2O2) has been considered for this role [10,11,12]. As a strong oxidant, it is known for its disinfectant capabilities, is a naturally occurring compound in aquatic systems, and quickly decomposes into water and gaseous oxygen [13]. As H2O2 decomposes, it releases hydroxyl radicals, strong reactive oxygen species known to damage cells and inhibit photosynthetic activity by causing damage to photosystem II [14,15]. H2O2 has been shown to be specifically detrimental to the growth and function of cyanobacteria and capable of reducing biomass of Microcystis and Planktothrix by 50% in less than 48 h [10,11]. Cyanobacteria are known to be more sensitive to H2O2 than eukaryotic primary producers [13,14,16], and a previous study found Microcystis aeruginosa to be ten-times more sensitive than species of green algae and diatoms [13]. This may be due, in part, to the photosystems of cyanobacteria not being protected within an organelle [14]. In addition, unlike cyanobacteria, eukaryotic phytoplankton commonly produce enzymes such as ascorbate peroxidase that break down H2O2 and protect them from damage by reactive oxygen species (ROS) such as hydroxyl radicals [17]. A whole lake study examining mesozooplankton abundances, mostly Daphnia and Diaphanosoma, found that they were unaffected at 2 mg H2O2 L−1, a concentration that inhibited the cyanobacterium Planktothrix [11].
The effects of hydrogen peroxide on cyanobacteria has been well-documented in laboratory cultures [13,18,19]. However, research assessing the effect of H2O2 on other important members of planktonic communities such as picocyanobacteria, eukaryotes, and heterotrophic bacteria has been limited. It is important that effects of H2O2 on cyanobacteria and the rest of the prokaryotic and eukaryotic community are understood before H2O2 is widely used for mitigation purposes in natural ecosystems.
This project, therefore, sought to understand the effects of H2O2 on multiple genera of toxin-producing cyanobacteria (i.e., Microcystis, Dolichospermum, Cylindrospermopsis, and Planktothrix) as well as co-occurring plankton including picocyanobacteria, eukaryotic algae, and heterotrophic bacteria. This was done through a series of incubation experiments performed using environmental samples from four contrasting water bodies across Long Island, NY, USA. Microbial communities were assessed using standard (microscopy, fluorometry) and molecular (high throughput amplicon sequencing) approaches to establish a comprehensive assessment of the efficacy of H2O2 as a mitigation approach for toxic cyanobacterial blooms.

2. Results

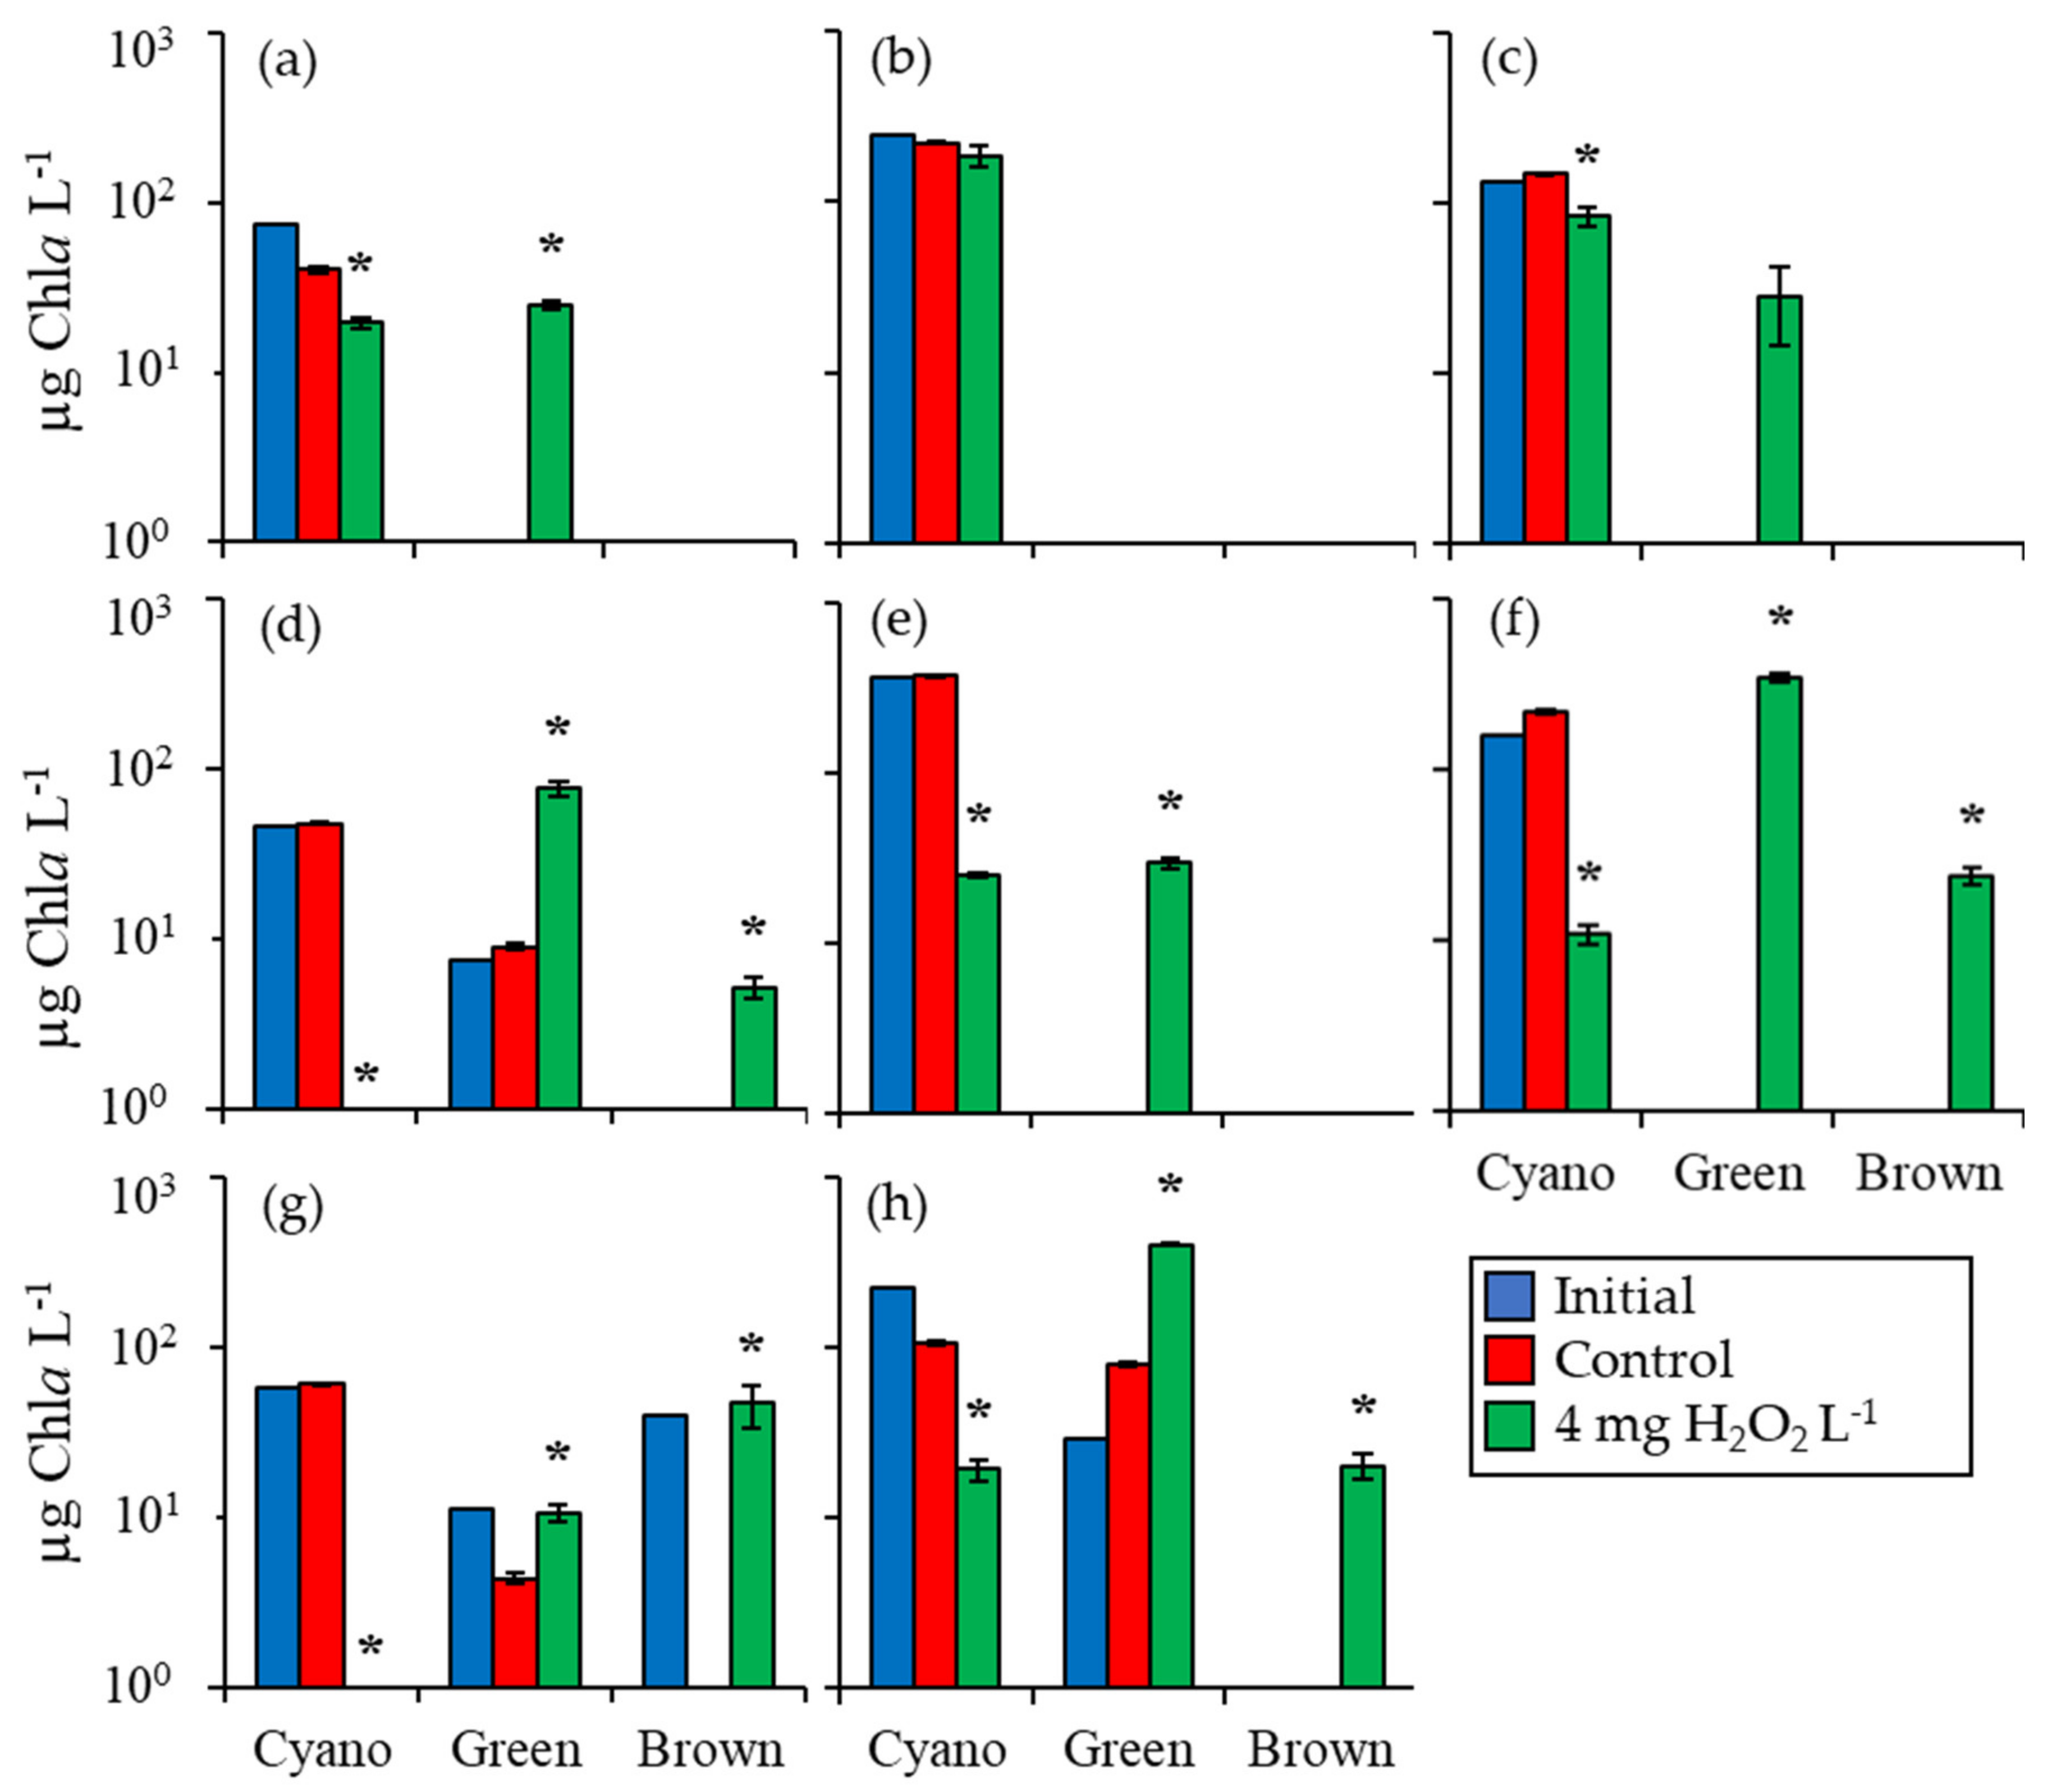
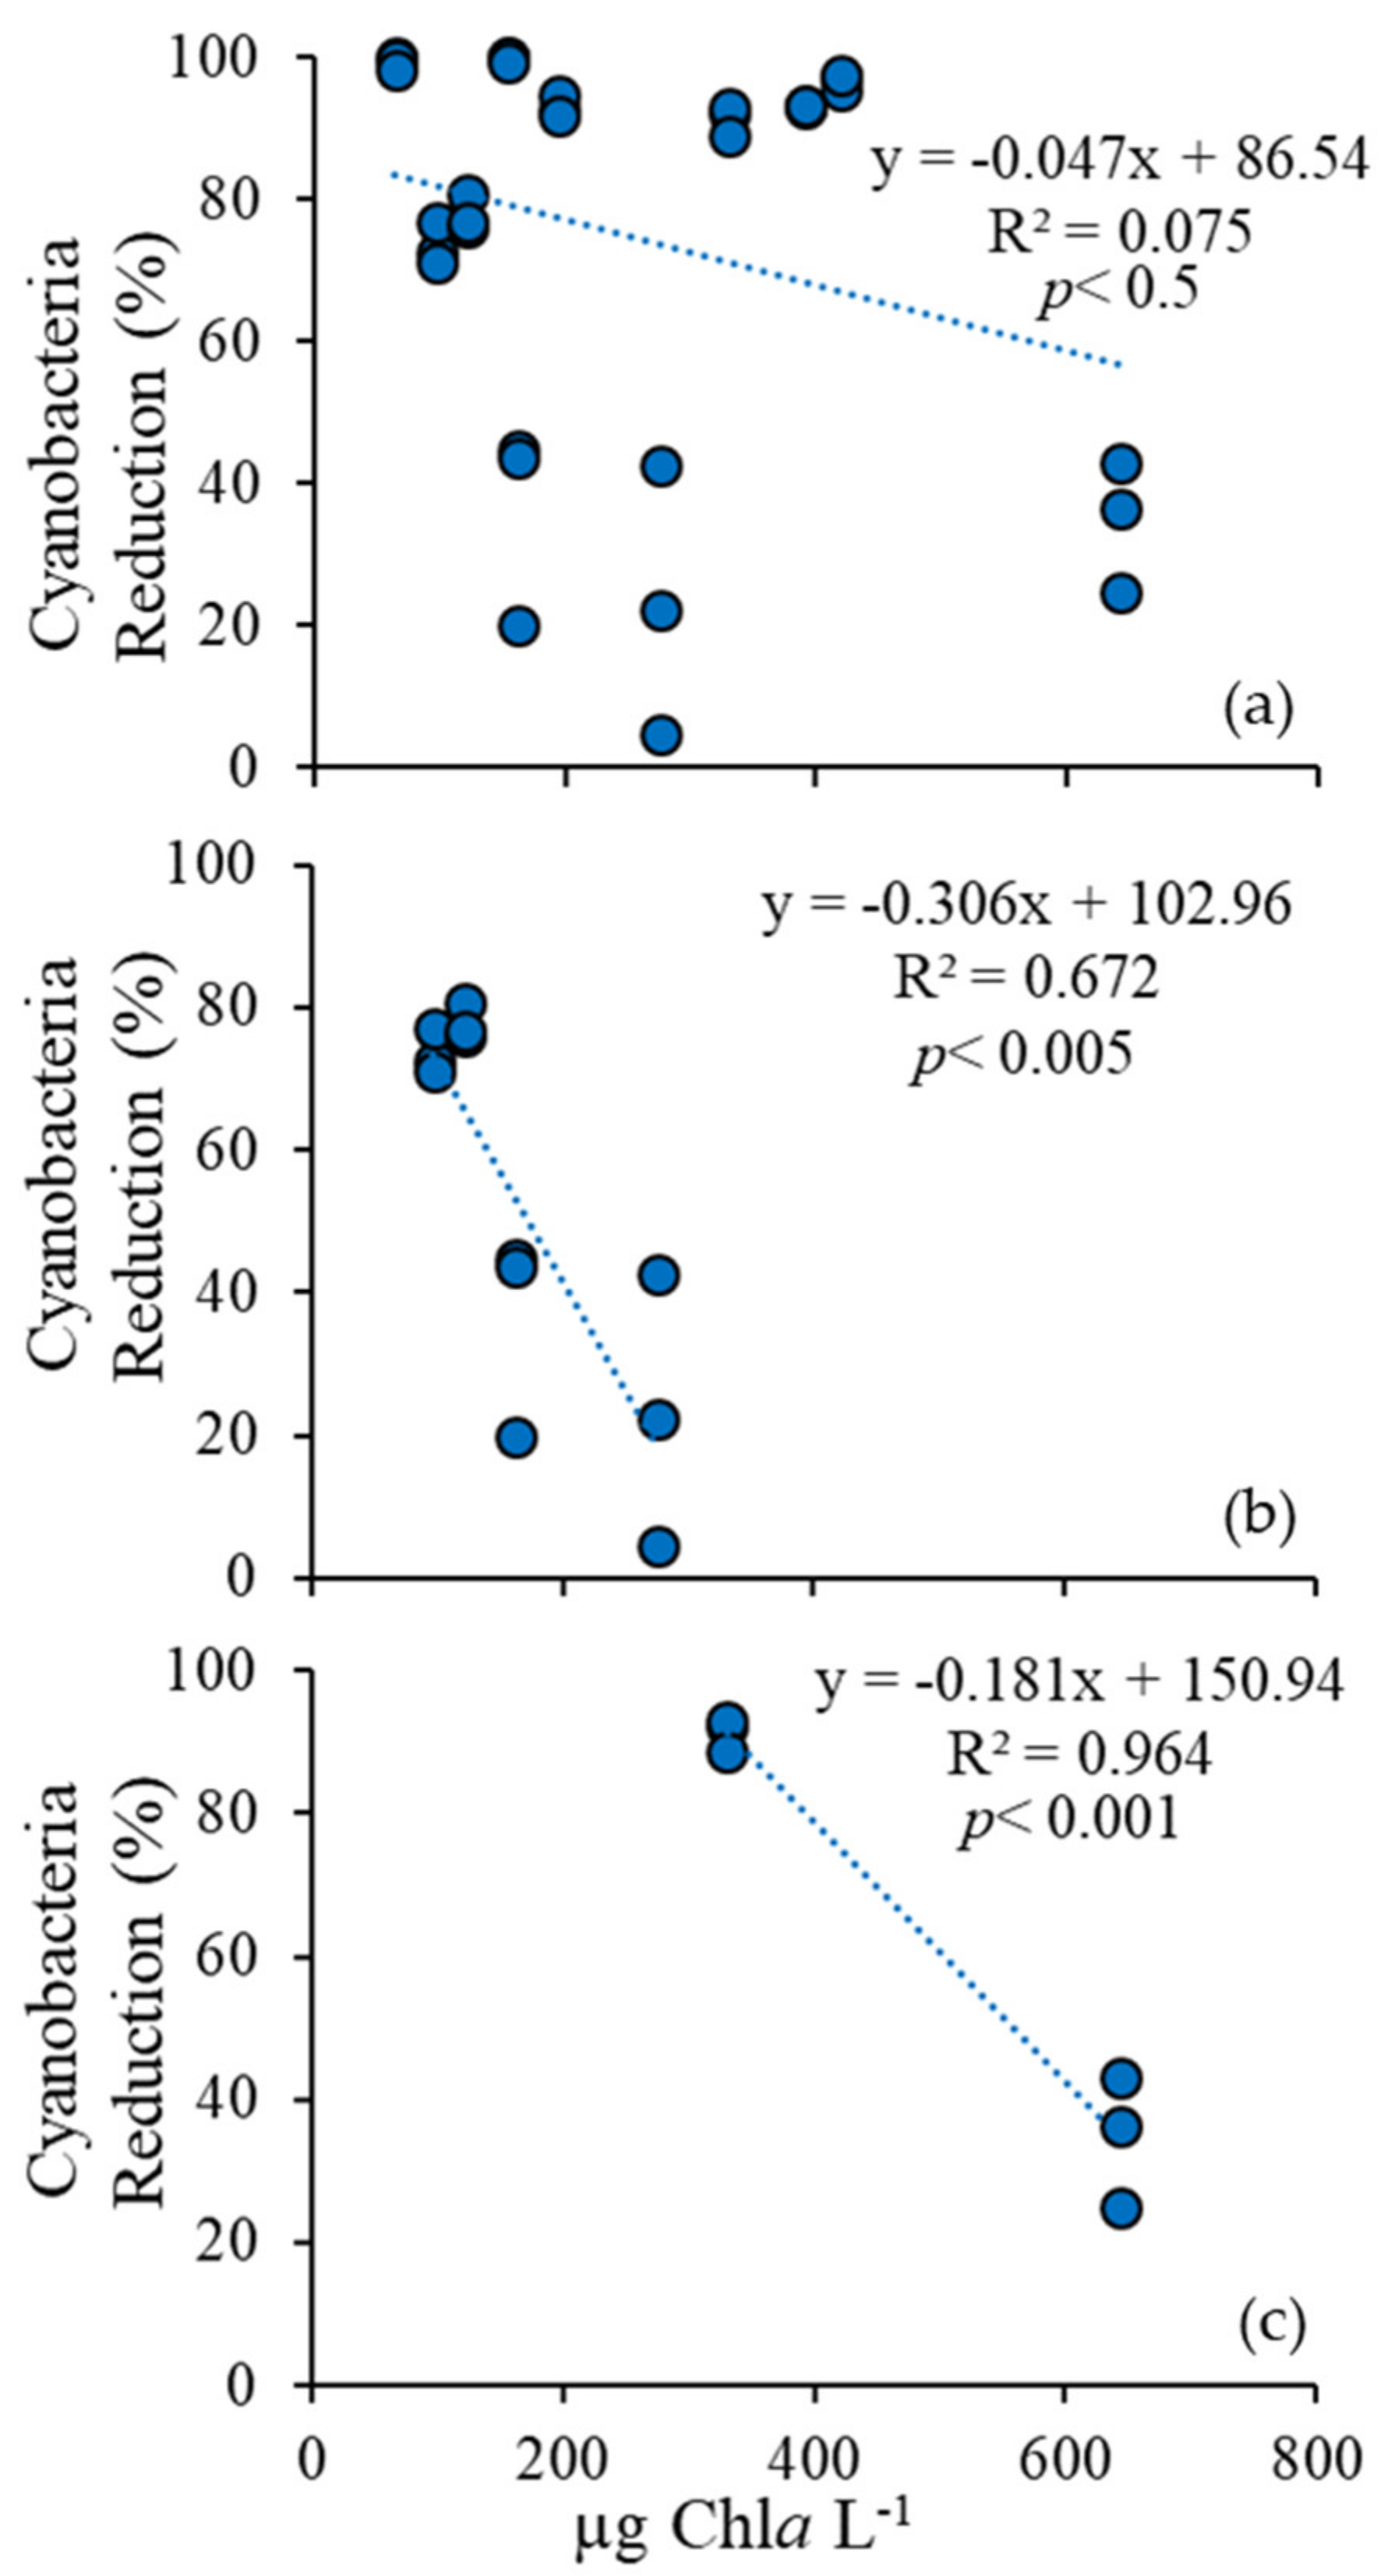
2.1. Fluorometric Response of the Phytoplankton Community

During three experiments utilizing water from Lake Agawam, initial cyanobacterial biomass ranged from 73 to 243 µg Chla L−1, dominated by mixtures of Microcystis, Planktothrix, and Dolichospermum. Cyanobacterial biomass was significantly lower four to six days after exposure to 4 mg H2O2 L−1 in two of three experiments, with concentrations 52% (p < 0.001; Figure 1a) and 43% (p < 0.005; Figure 1c) lower than the control. Cyanobacterial biomass was reduced below the New York State Department of Environmental Conservation (NYSDEC) level of concern of 25 µg Chla L−1 in the one experiment that had the lowest initial concentration of these experiments (73 µg Chla L−1; Figure 1a). Initial green algal biomass was low (0–0.24 µg Chla L−1) but was significantly higher than the control following exposure to H2O2 in one of the experiments (p < 0.001; Figure 1a). Unicellular brown algae were fluorometrically undetectable during the Lake Agawam experiments.
Initial cyanobacterial biomass for the three Mill Pond experiments ranged from 45 to 366 µg Chla L−1, dominated by Microcystis and Cylindrospermopsis. Four or seven days after exposure to H2O2, cyanobacterial biomass was significantly lower than the control in all three experiments by 99% (p < 0.001; Figure 1d), 93% (p < 0.001; Figure 1e), and 95% (p < 0.001; Figure 1f), respectively, and below the level of concern of 25 µg Chla L−1 in two experiments (Figure 1d,f). Initial biomass of green algae in Mill Pond ranged from below detection to 7.3 µg Chla L−1 and rose higher than the control to 76 ± 7 µg Chla L−1 (p < 0.001; Figure 1d), 30 ± 2 µg Chla L−1 (p < 0.001; Figure 1e), and 342 ± 18 µg Chla L−1 (p < 0.001; Figure 1f), respectively, in all three experiments following H2O2 exposure. Initial unicellular brown algae biomass levels were below detection at the start of the three experiments, but values rose significantly to 5 ± 1 µg Chla L−1 (p < 0.005) and 24 ± 3 µg Chla L−1 (p < 0.001) in two of the three experiments, but remained undetectable in the third experiment (Figure 1d,f).
For the Georgica Pond experiment, initial cyanobacterial biomass was 58 µg Chla L−1 being dominated by Aphanizomenon (Figure 1g). Four days after treatment with 4 mg H2O2 L−1, cyanobacterial biomass was 99.8% lower than the control and nearly 0 µg Chla L−1 (p < 0.001; Figure 1g). Initial green algal biomass was 11 µg Chla L−1 and was 144% higher than the control following exposure to H2O2 (p < 0.01; Figure 1g). Initial unicellular brown algae biomass was 39 µg Chla L−1 and rose to 47 ± 13 µg Chla L−1 following H2O2 exposure, significantly higher than the control where concentration had fallen (p < 0.05; Figure 1g).
For the Roth Pond experiment, initial cyanobacterial biomass was 222 µg Chla L−1 and was dominated by Microcystis and Cylindrospermopsis (Figure 1h). Cyanobacterial biomass was 82% lower than the control (p < 0.001) at 19 ± 3 µg Chla L−1 in the 4 mg H2O2 L−1 treatment after six days. Initial green algae biomass was 29 µg Chla L−1 but rose in the H2O2 treatment to 403 ± 10 µg Chla L−1, 400% higher than the control (p < 0.001; Figure 1h). Unicellular brown algae were undetectable at the start of the experiment but were significantly higher than the control at 20 ± 3 µg Chla L−1 6 days after H2O2 exposure (p < 0.005; Figure 1h).
In summary, during the eight incubation experiments among four locations assessed fluorometrically, cyanobacterial levels were significantly lowered following the addition of H2O2 than the control in seven experiments, green algae levels became significantly higher in H2O2 treatments relative to the control in six of eight experiments, and unicellular brown algae became significantly higher in H2O2 treatments relative to the control in four of eight experiments.

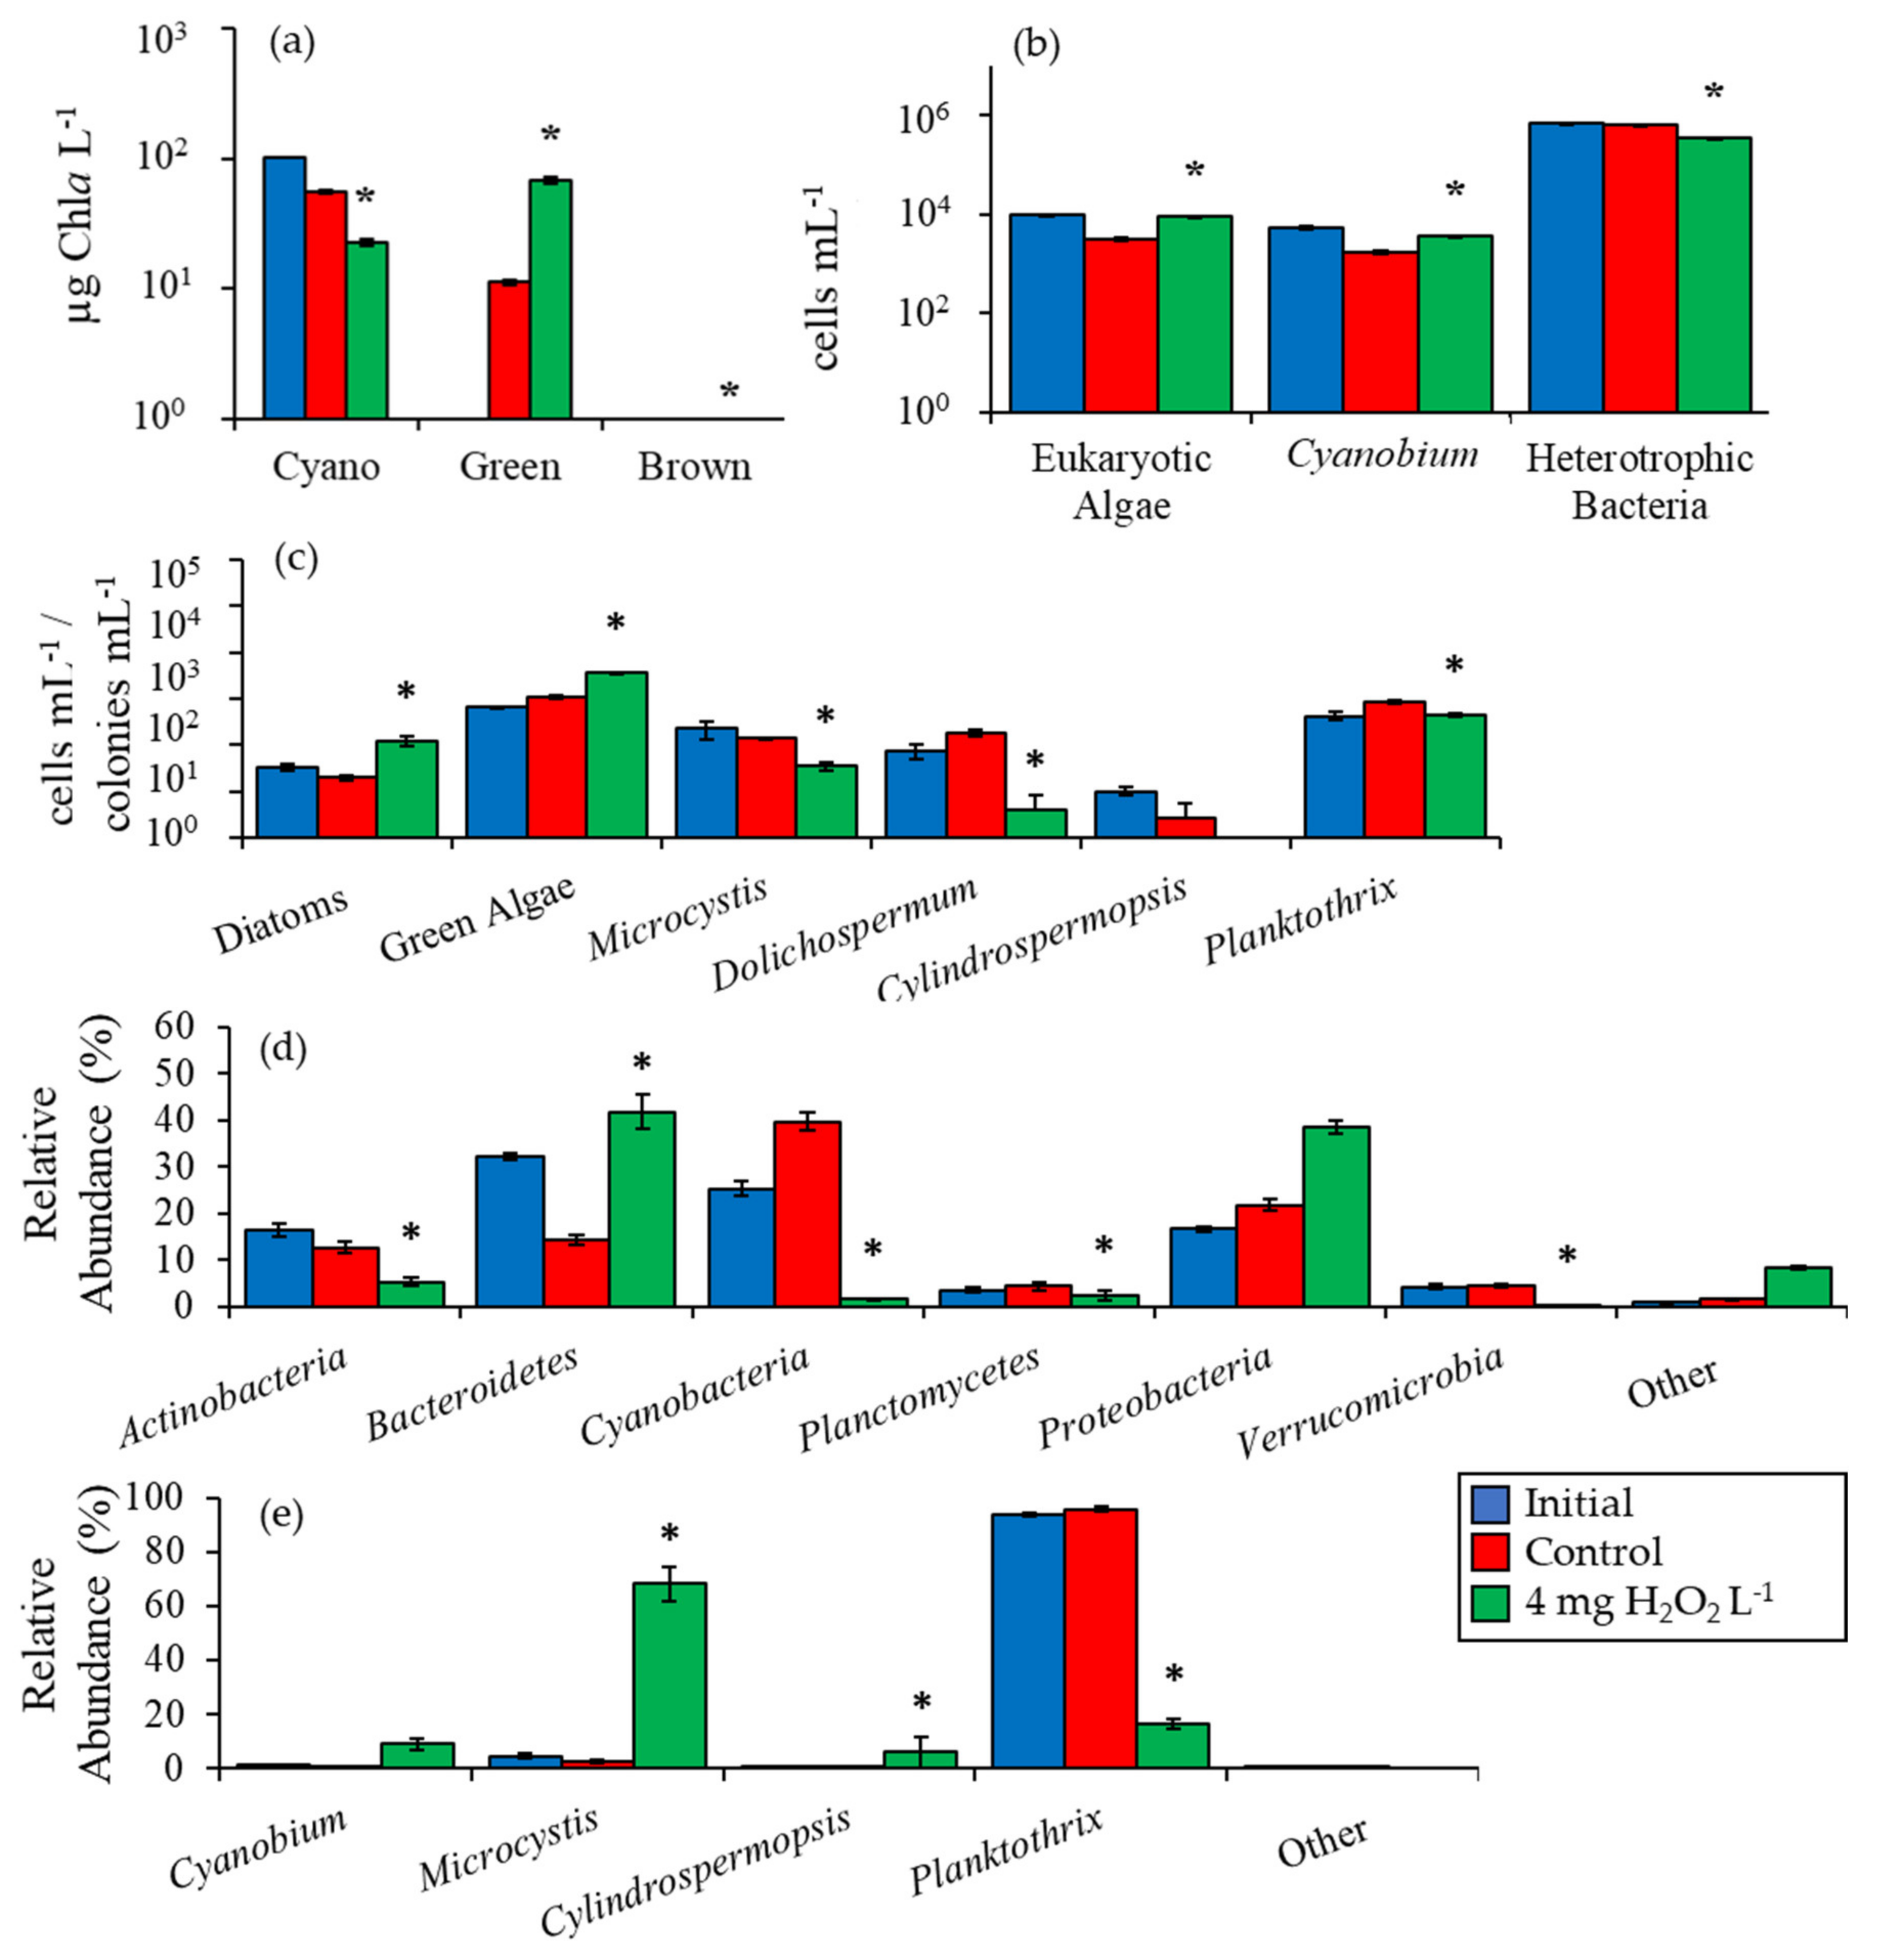
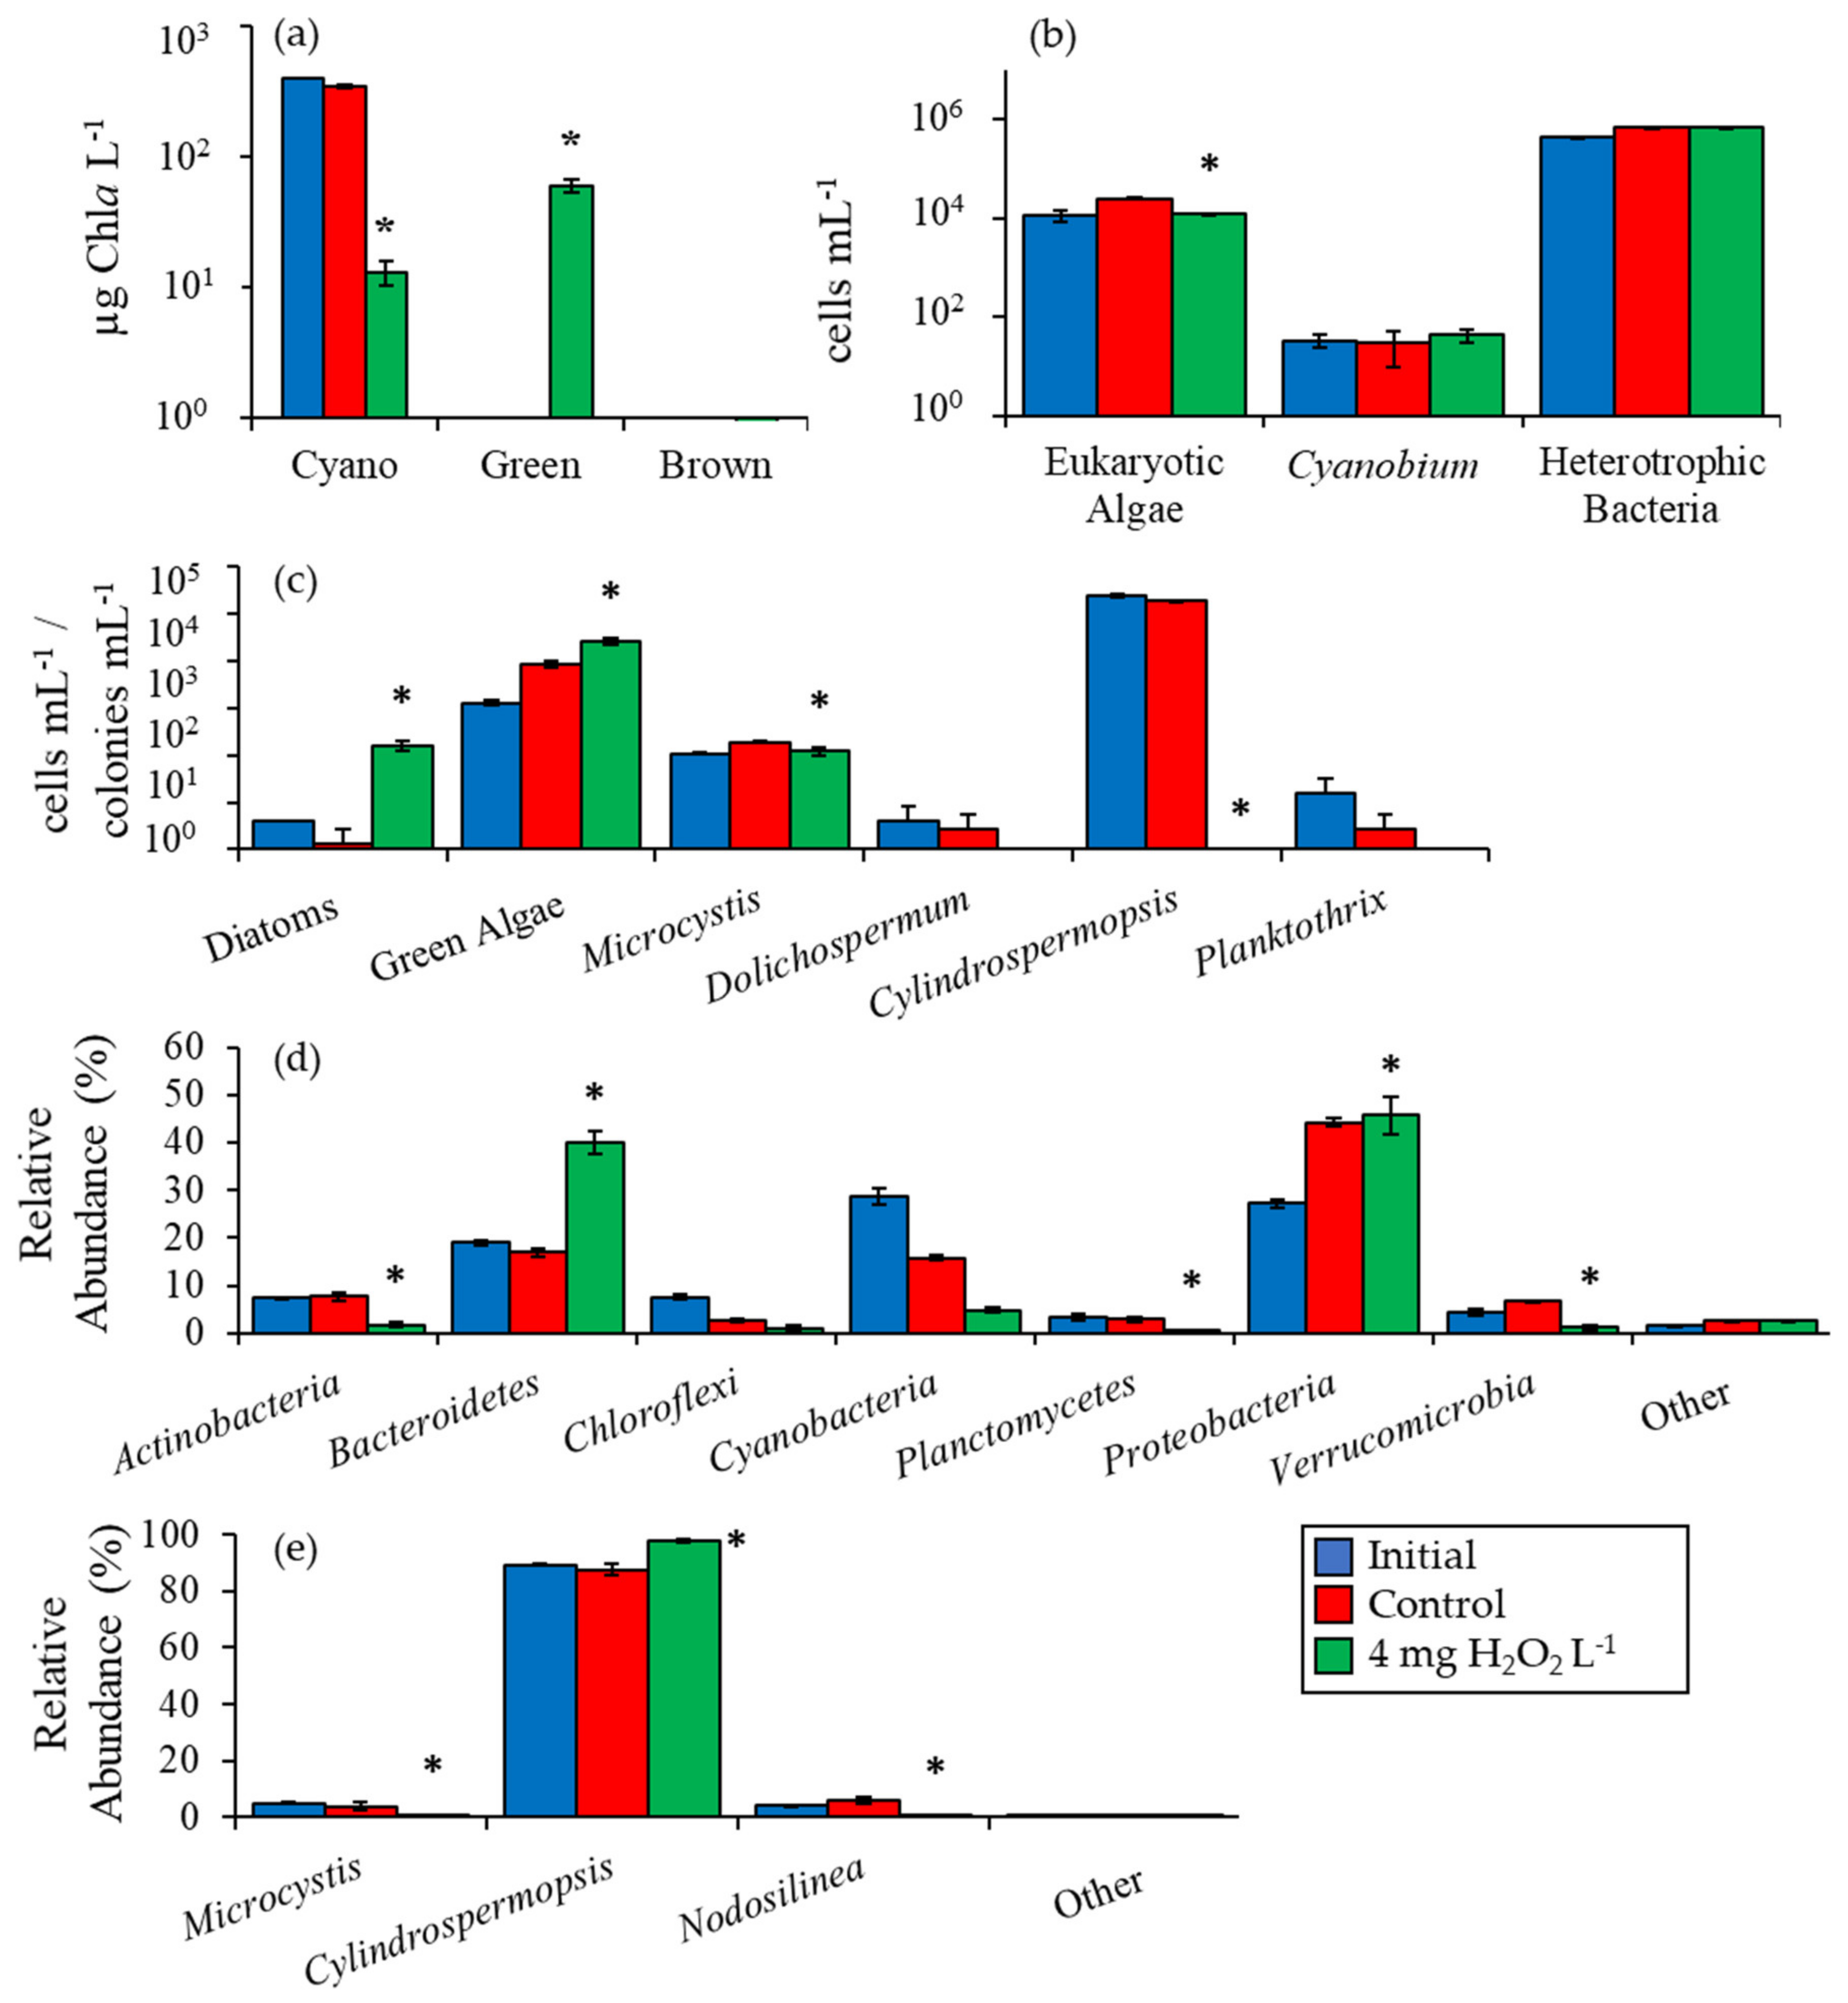
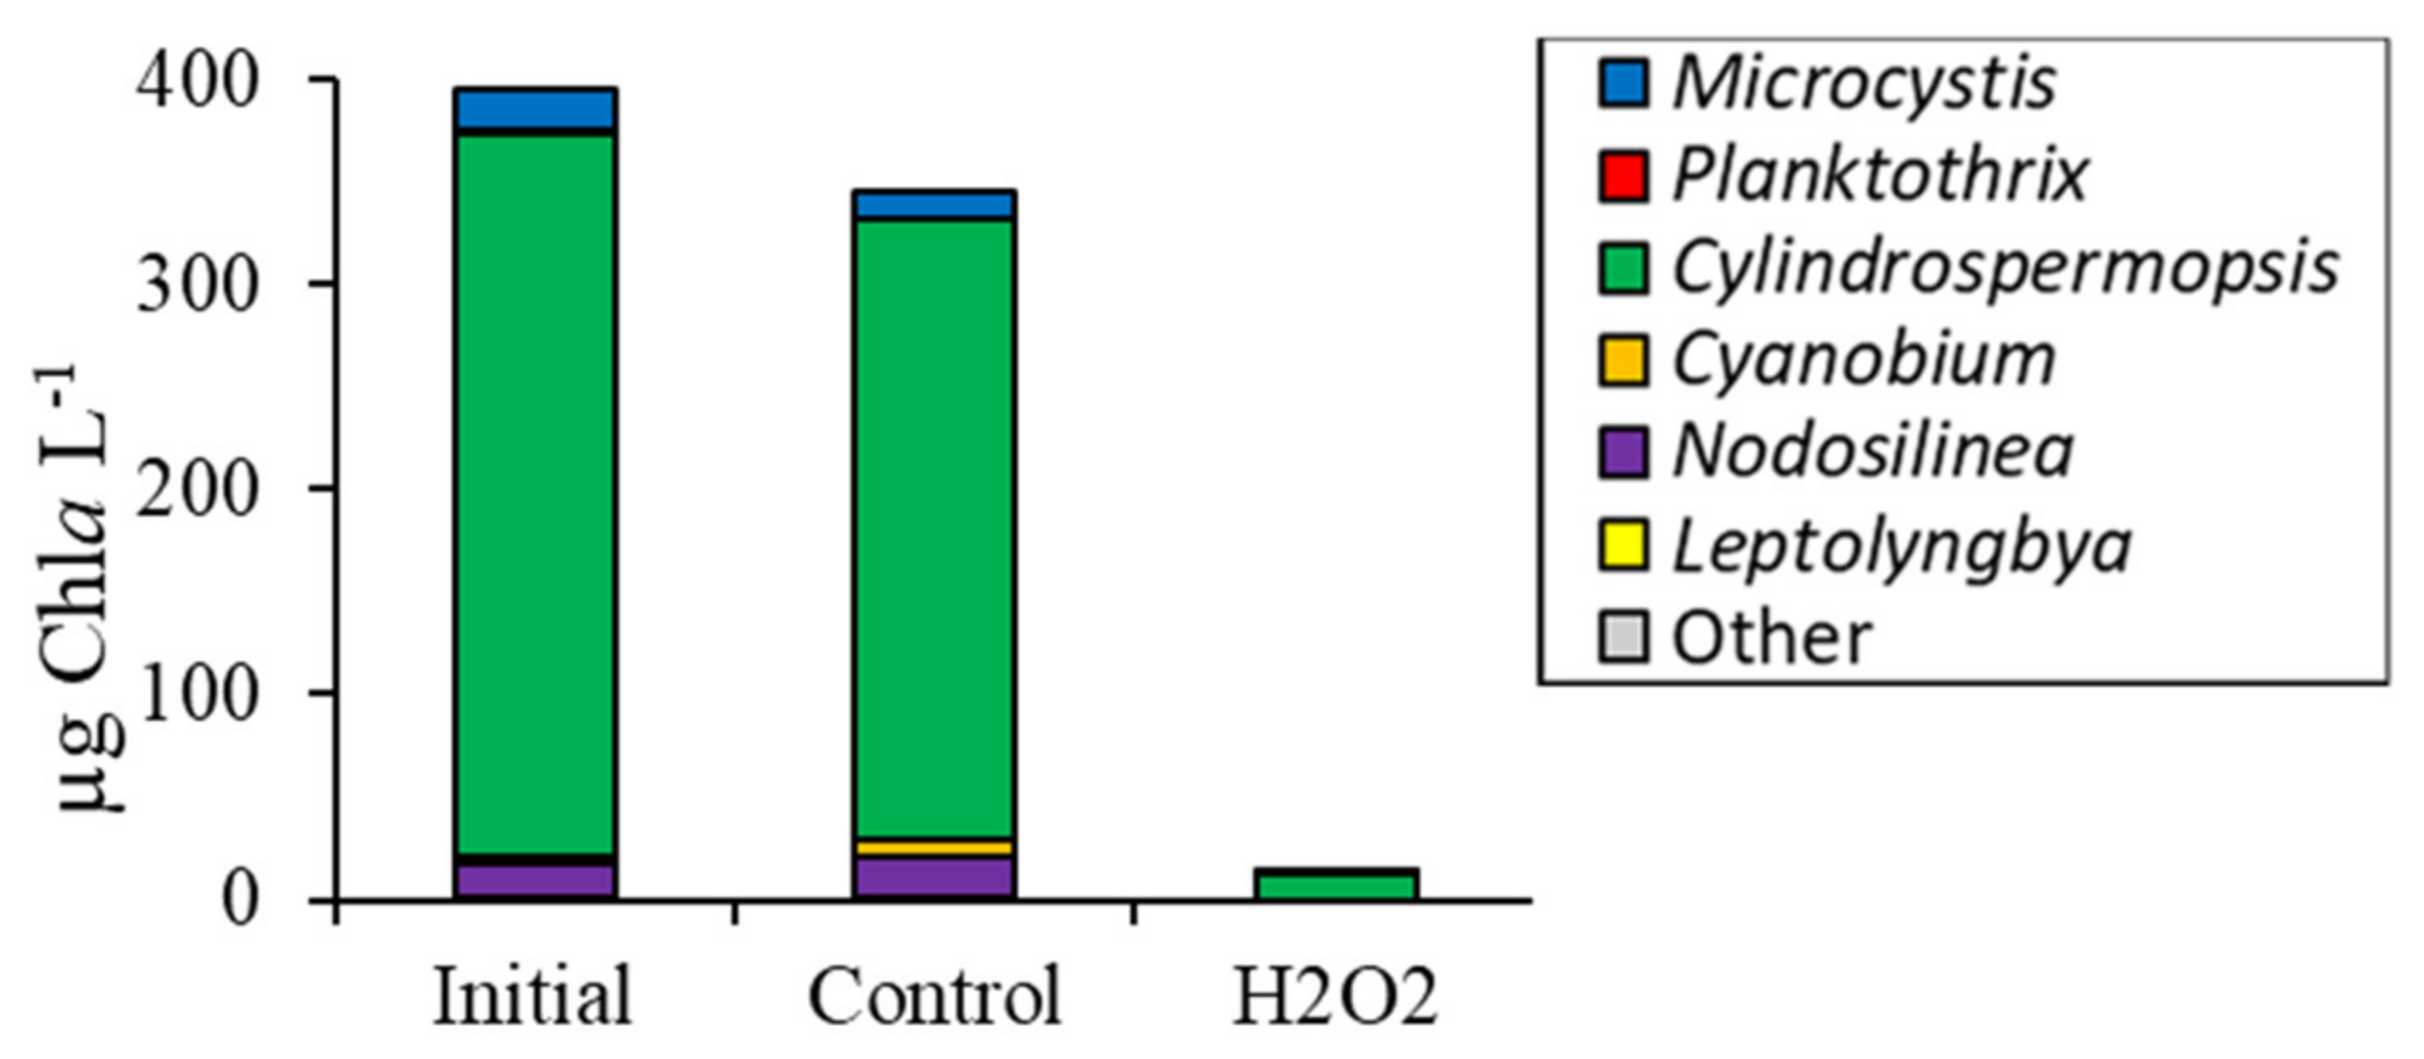
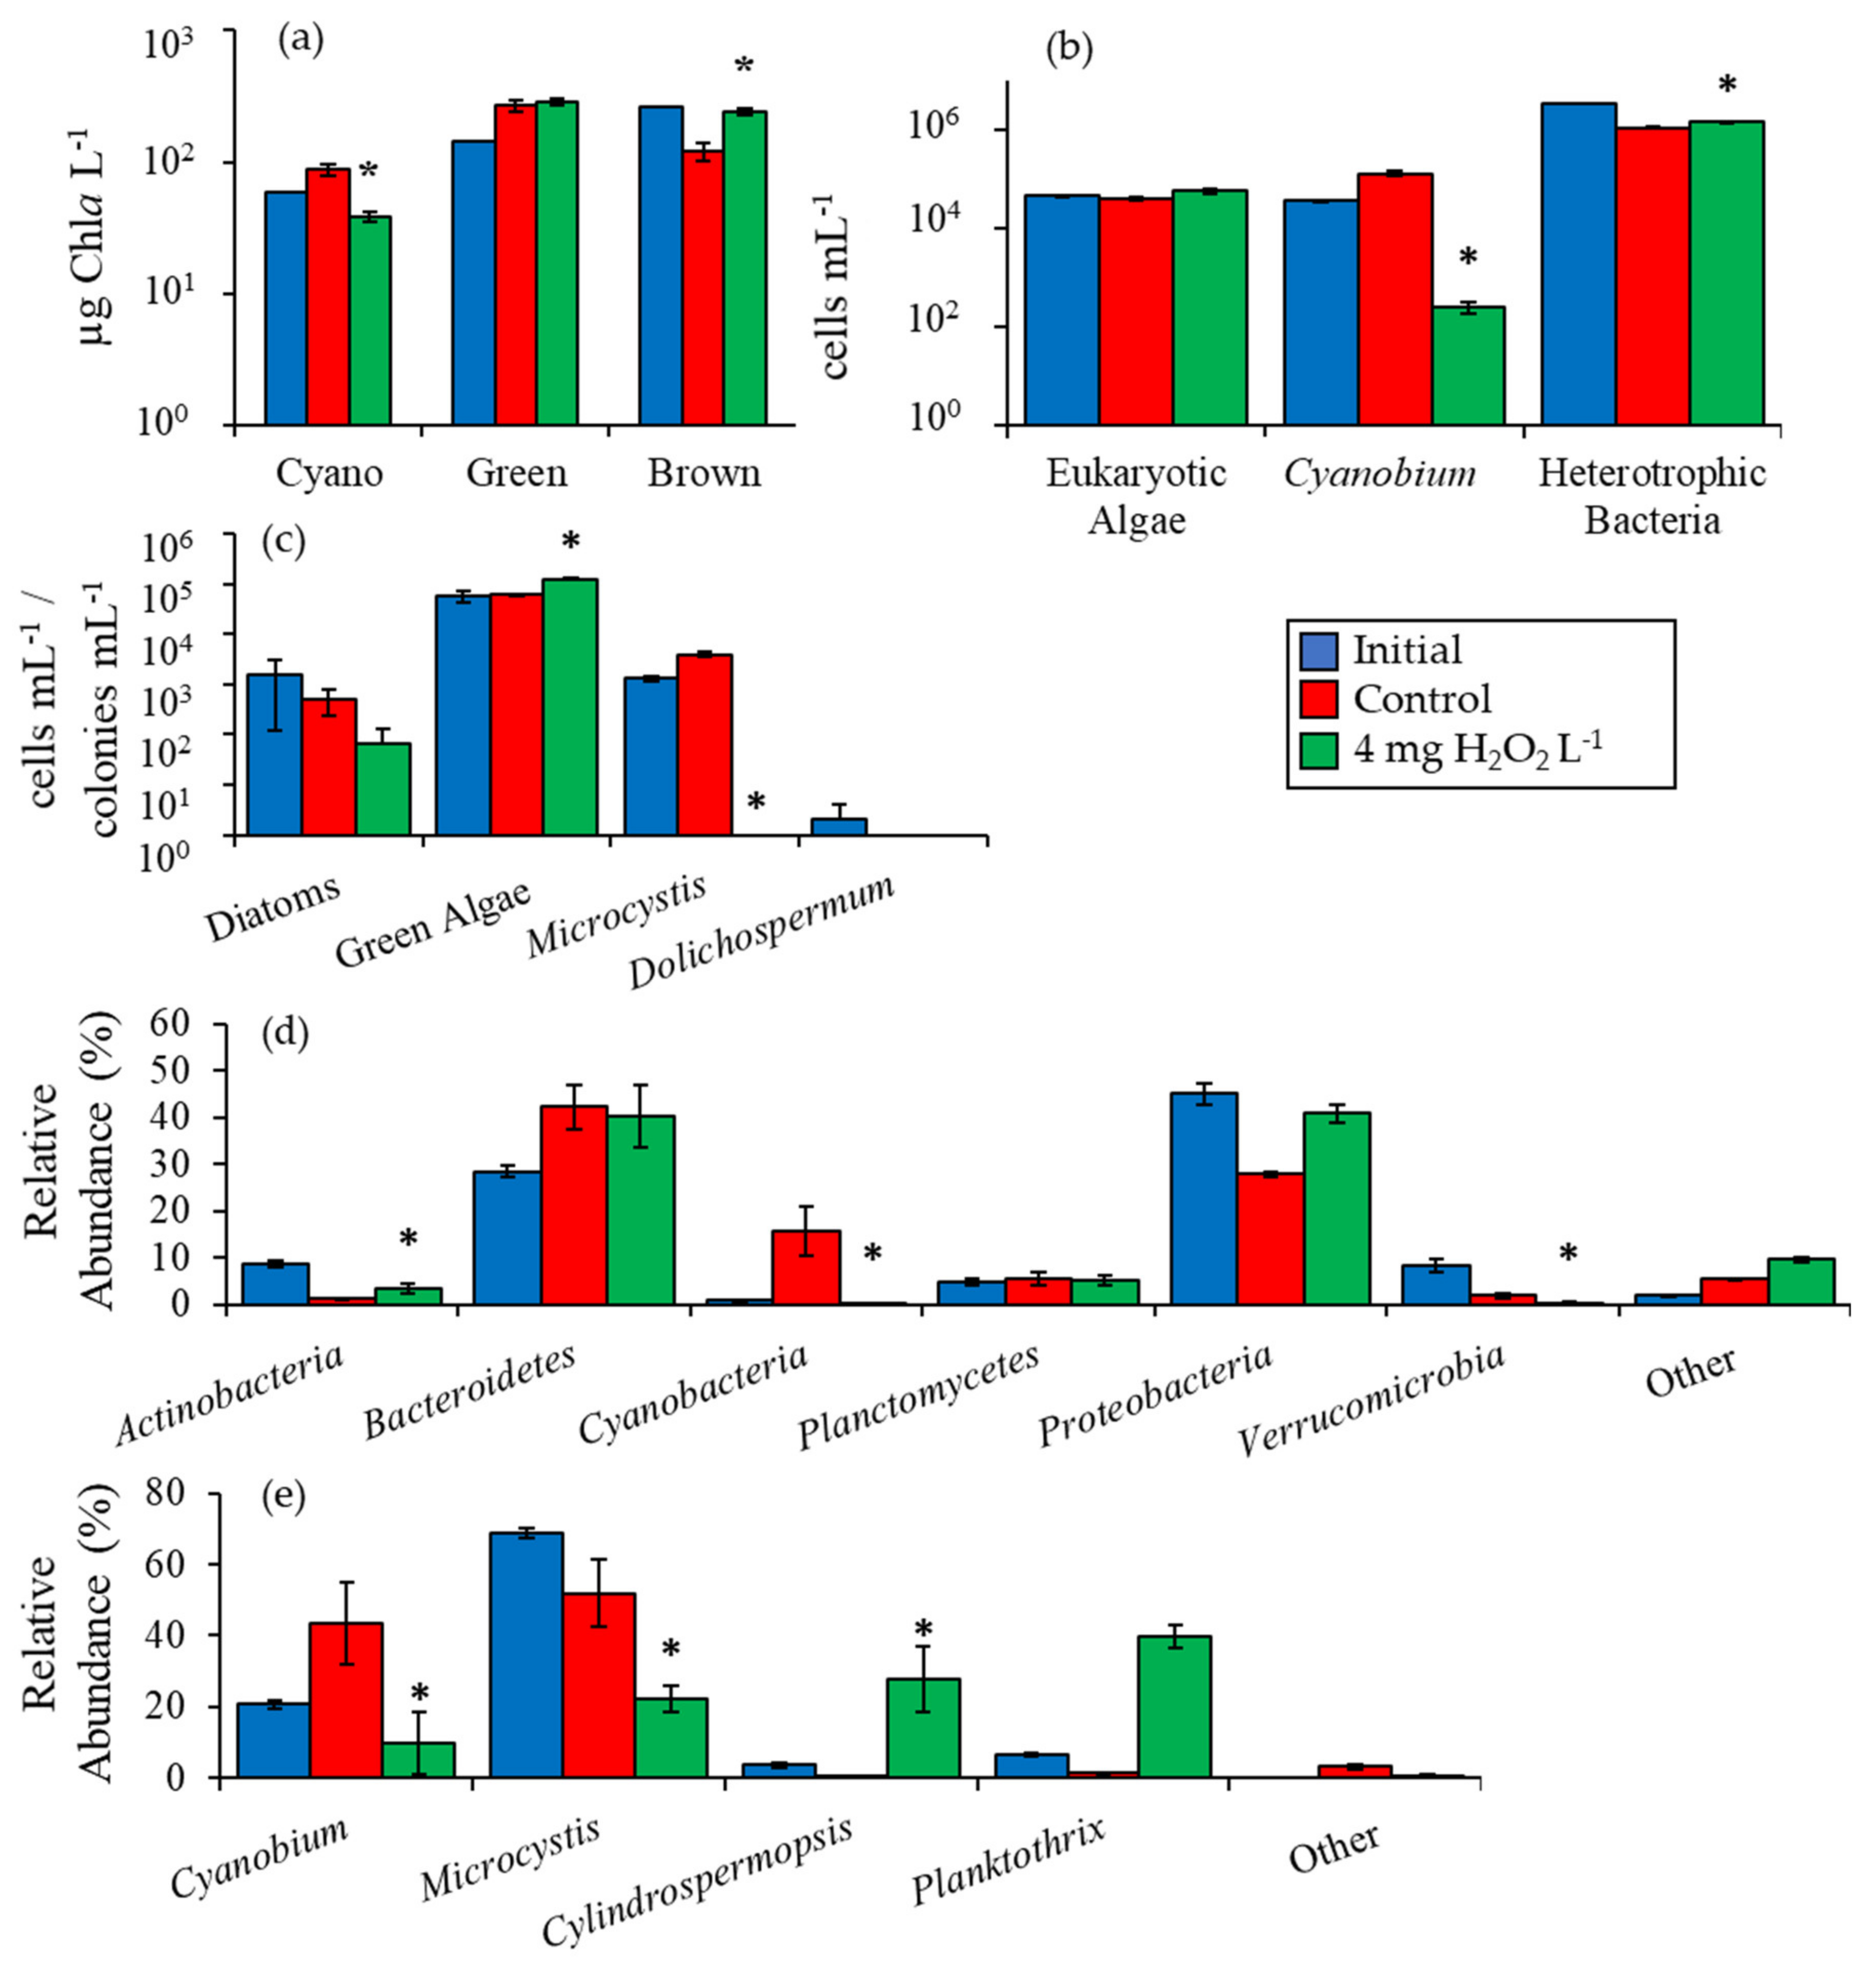
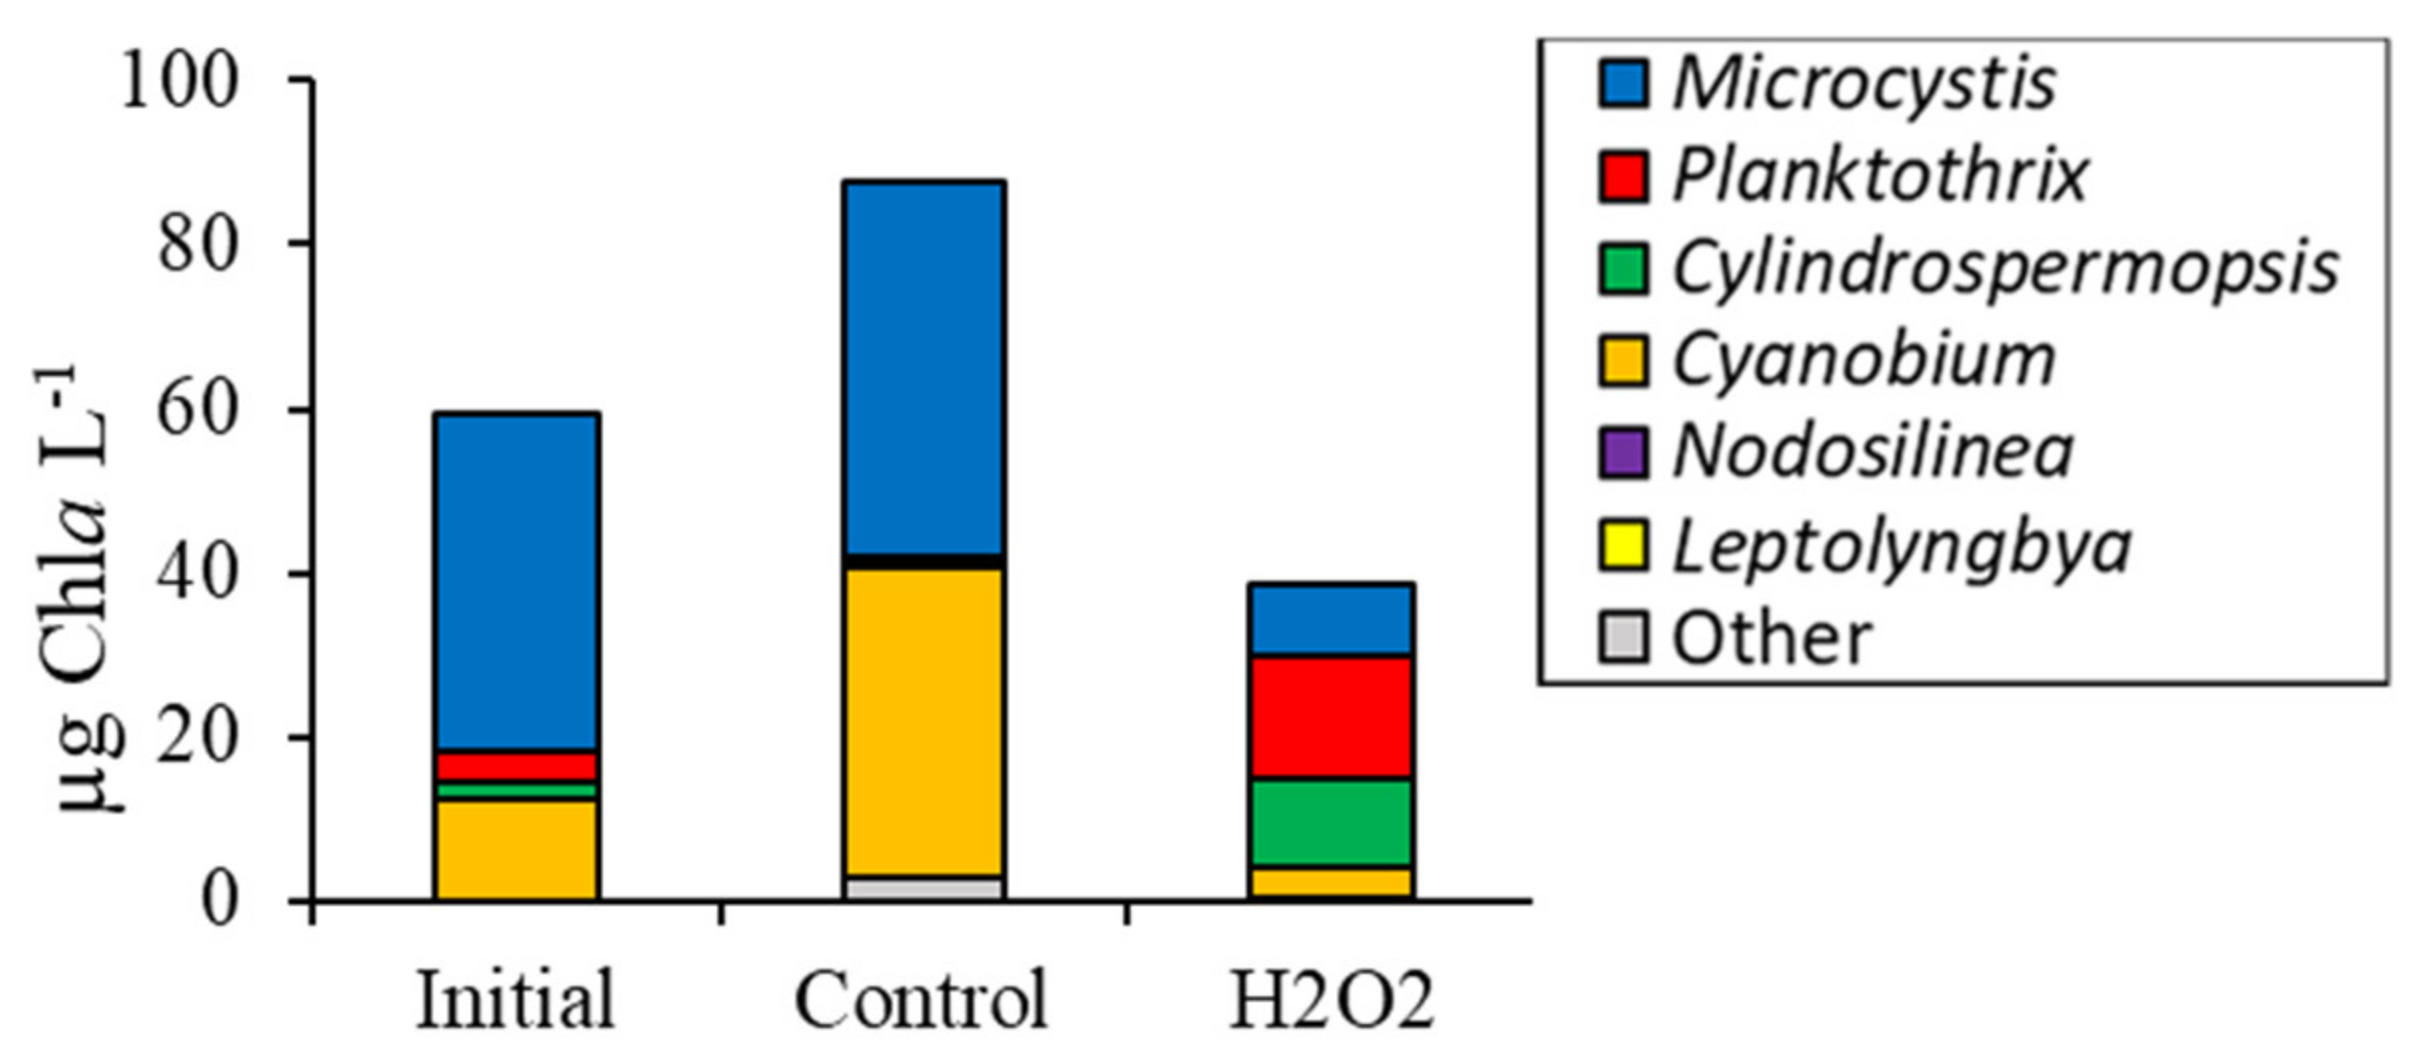
2.2. Detailed Assessment of Planktonic Responses to H2O2

Given the strong and significant effects of H2O2 on plankton communities during this first set of experiments, three additional experiments were performed utilizing water from three ecosystems with additional analyses performed to more fully assess the response of plankton communities to H2O2. In the first of these experiments from Lake Agawam, the initial cyanobacterial biomass was 103 µg Chla L−1 and five days following exposure to 4 mg H2O2 L−1 was significantly lower than the control at 23 ± 2 µg Chla L−1 (p < 0.001; Figure 2a). Initial green algae biomass concentration was undetectable but rose to 69 ± 4 µg Chla L−1 after treatment with H2O2, a level significantly higher than the control (p < 0.001; Figure 2a). Unicellular brown algae biomass was undetectable at the start of the experiment but rose to levels significantly higher than the control at 0.4 ± 0.2 µg Chla L−1 in the H2O2 treatment (p < 0.05; Figure 2a). Picocyanobacteria (Cyanobium) concentrations in Lake Agawam were initially 5,340 ± 360 cells mL−1 and decreased in the control to 1690 ± 80 cells mL−1 (Figure 2b). The H2O2 treatment was reduced by less, and was 110% higher relative to the control with a final concentration of 3,560 ± 90 cells mL−1 (p < 0.001; Figure 2b). Eukaryotic algae concentrations were 193% higher in the H2O2 treatment than the control at 9,090 ± 150 cells mL−1 (p < 0.001; Figure 2b). The initial concentration of heterotrophic bacteria was 7.0 × 10⁵ cells mL−1 and was 44% lower than the control after the addition of H2O2 at 3.45 × 10⁵ cells mL−1 (p < 0.001; Figure 2b). Diatom densities in Lake Agawam were 34 cells mL−1 and levels rose to be significantly higher in the treatment (p < 0.05) relative to the control to 120 ± 28 cells mL−1 (Figure 2c). Green algae concentrations were initially 657 cells mL−1 and were nearly six-fold higher in the treatment compared to the control at 3,700 ± 50 cells mL−1 (p < 0.001; Figure 2c). Initial Microcystis concentrations were 222 colonies mL−1 and were significantly reduced by H2O2 to below the control to 34 ± 7 colonies mL−1 (p < 0.001; Figure 2c). There were 76 Dolichospermum chains mL−1 at the start of the experiment and concentrations sharply declined to 4 ± 4 chains mL−1 following H2O2 addition, a level significantly lower than the control (p < 0.005; Figure 2c). Finally, following H2O2 addition Planktothrix concentrations were 50% of the control at 439 ± 43 chains mL−1 (p < 0.01; Figure 2c).
High throughput sequencing of the 16S rDNA gene indicated that the relative abundance of Actinobacteria in Lake Agawam was initially 17 ± 1% and dropped to 5 ± 1% five days after exposure to 4 mg H2O2 L−1, significantly lower than the control (p < 0.001). Planctomycetes was 4 ± 1% initially and was significantly reduced to 2 ± 1%, significantly lower than the control (p < 0.001), while Verrucomicrobia was 4 ± 1% and was reduced to 0.4 ± 0.1%, significantly lower than the control (p < 0.001; Figure 2d). The sequenced relative abundance of Bacteroidetes in Lake Agawam was significantly higher than the control after the addition of H2O2 at 42 ± 4% compared to an initial of 32 ± 1% (p < 0.001; Figure 2d). The sequenced relative abundance of Proteobacteria and other less abundant taxa abundances were not significantly altered by H2O2 (Figure 2d).
Among all prokaryotes, the sequenced relative abundance of cyanobacteria was initially 25 ± 2% but was reduced to lower than the control to 2 ± 1% after H2O2 exposure (p < 0.001). Among the cyanobacteria, Planktothrix was the most abundant taxa in the Lake Agawam experiment with an initial relative abundance of 94 ± 1% that was significantly lower than the control at 17 ± 2% following the addition of H2O2 (p < 0.001; Figure 2e). In contrast, Microcystis had an initial abundance of 4 ± 1% that was higher relative to the control at 68 ± 6% in the H2O2 treatment (p < 0.001; Figure 2e).
Cylindrospermopsis made up only 0.2 ± 0.1% of initial cyanobacterial sequences but was higher than the control at 6 ± 6% following the H2O2 addition (p < 0.001; Figure 2e). Multiplying cyanobacterial Chla values by sequenced relative abundances provided an estimate of individual biomasses and revealed that Planktothrix biomass decreased significantly (p < 0.001), while Microcystis (p < 0.001) and Cylindrospermopsis (p < 0.001) biomasses increased (Figure 3).
For the experiment that provided a detailed assessment from the Mill Pond planktonic community, initial cyanobacterial biomass was 394 µg Chla L−1 and was 96% lower than the control after five days following exposure to H2O2 at 13 ± 3 µg Chla L−1 (p < 0.001; Figure 4a). Green algae were below detectable levels in Mill Pond at the start of the experiment but were significantly higher at 60 ± 7 µg Chla L−1 (p < 0.001) following H2O2 treatment; unicellular brown algae were fluorometrically undetectable in this experiment (Figure 4a). Initial eukaryotic algae concentrations were 1.14 ± 0.30 × 10⁴ cells mL−1 and were unchanged by H2O2 but were 52% lower relative to the control (p < 0.001; Figure 4b).
Cyanobium and heterotrophic bacteria concentrations in the H2O2 treatment were not significantly different from the control (Figure 4b). Levels of diatoms were low in Mill Pond prior to the experiment (< 10 cells mL−1) but increased and were significantly higher than the control after the H2O2 addition with a final concentration of 157 ± 35 cells mL−1 (p < 0.01; Figure 4c). Green algae cell densities were initially 1290 ± 140 cells mL−1 and were significantly higher in the H2O2 treatment compared to the control at 2.65 ± 0.37 × 10⁴ cells mL−1 (p < 0.01; Figure 4c). Initial Microcystis concentrations were 108 ± 4 colonies mL−1 and were significantly lower than the control following exposure to H2O2 (p < 0.05; Figure 4c). Cylindrospermopsis initial concentration was 2.45 ± 0.14 × 10⁵ chains mL−1 and significantly decreased by 100% following exposure to H2O2 (p < 0.001; Figure 4c) while Dolichospermum and Planktothrix levels were unaffected.
High throughput sequencing revealed that H2O2 caused a significant decline in the sequenced relative abundance of several bacterial groups in Mill Pond including Actinobacteria, Planctomycetes, and Verrucomicrobia (p < 0.005; Figure 4d). In contrast, the sequenced relative abundances of Bacteroidetes and Proteobacteria were higher in the H2O2 treatment relative to the control (p < 0.001; Figure 4d). Among cyanobacteria identified via sequencing of 16S rDNA, Cylindrospermopsis was the dominant operational taxonomic unit (OTU) (88 ± 1% of cyanobacteria sequences) in initial sequences and increased in relative abundance following H2O2 addition to 98 ± 1%, significantly higher than the control (p < 0.001). In contrast, the sequenced relative abundances of Microcystis and Nodosilinea were significantly lowered by H2O2 relative to the control (p < 0.001; Figure 4e). Estimated changes in absolute abundances based on fluorometry and sequencing revealed that, despite the differential sensitivities of differing cyanobacterial groups to H2O2, the biomass of Cylindrospermopsis (p < 0.001), Microcystis (p < 0.01), and Nodosilinea (p < 0.001) all significantly declined in the treatment relative to the initial levels and the control (Figure 5).
Finally, during the Roth Pond experiment, initial cyanobacteria biomass was 59 µg Chla L−1 and was significantly lower in H2O2 treatments at 39 ± 3 µg Chla L−1 relative to the control seven days after exposure (p < 0.01; Figure 6a). Initial green algae biomass was 141 µg Chla L−1 but was not significantly altered by H2O2, while unicellular brown algal biomass levels were 100% higher in the H2O2 treatment compared to the control at 239 ± 12 µg Chla L−1 (p < 0.01; Figure 6a). Flow cytometrically quantified Cyanobium concentrations in the Roth Pond were 99.8% lower in the H2O2 treatment compared to the control (p < 0.001) whereas levels of eukaryotic algae were unchanged (Figure 6b). Levels of heterotrophic bacteria were 33% higher than the controls seven days after the addition of H2O2 (p < 0.005; Figure 6b). Green algae identified microscopically were 111% higher in the H2O2 treatment compared to the control at 1.28 ± 0.06 × 10⁵ cells mL−1 (p < 0.001; Figure 6c), while diatom levels were unchanged (Figure 6c). Microcystis concentrations were 1320 ± 180 colonies mL−1 and were reduced by 100% by H2O2 (p < 0.001) while Dolichospermum concentrations were unchanged (Figure 6c). Final, total concentration of microcystin was 0.56 ± 0.13 µg L−1 in the control, and significantly higher at 0.85 ± 0.06 µg L−1 in the H2O2 treatment (p < 0.005).
Sequencing of the 16S rDNA indicated Actinobacteria were significantly higher in the H2O2 treatment compared to the control (p < 0.001) whereas cyanobacteria and Verrucomicrobia relative abundances were significantly lower than the control (p < 0.001; Figure 6e). Among the cyanobacteria, Microcystis and Cyanobium were the two most abundant genera in Roth Pond and the relative abundance of both was lower in the H2O2 treatment compared to the control (p < 0.001; Figure 6e). In contrast, Cylindrospermopsis relative abundance was initially 4 ± 1% and increased to 28 ± 9% following in the H2O2 treatment and was significantly higher than the control (p < 0.001). Despite the lower relative and absolute abundances of Microcystis during this experiment, the concentration of the cyanotoxin, microcystin, was marginally higher in the H2O2 treatment than the control, at 0.9 ± 0.1 µg L−1 compared to 0.6 ± 0.1 µg L−1 (p < 0.05). The individual biomasses (relative abundance multiplied by cyanobacterial Chla) for Microcystis (p < 0.05) and Cyanobium (p < 0.005) significantly declined in response to H2O2, while total biomass of Planktothrix (p < 0.01) and Cylindrospermopsis (p < 0.1) increased (Figure 7).

3. Discussion

During this study, H2O2 was used to mitigate cyanobacterial populations in environmental samples from four water bodies. H2O2 almost always reduced the levels of cyanobacteria and increased the abundances of eukaryotic algae. Effects on non-photosynthetic prokaryotes were complex, as some bacteria were consistently inhibited by H2O2 while others were promoted. Collectively, these findings provide new insight into the complex manner in which H2O2 can alter the composition of microbial communities dominated by cyanobacteria.

3.1. Cyanobacteria vs. Eukaryotes

Cyanobacterial biomass and cell abundance were significantly reduced by H2O2 in a majority of experiments (91%, 10 of 11), and eukaryotic green and unicellular brown algae were significantly increased in 73% and 55% of experiments, and did not decline significantly in any experiment. The ability of H2O2 to significantly reduce concentrations of cyanobacteria relative to eukaryotic algae is consistent with previous observations [11,13,14]. Across all experiments, the fluorometric relative abundance of cyanobacteria was significantly reduced from 85 ± 8% to 29 ± 10% (p < 0.005). The trend was also reflected in microscopy, with significant cyanobacterial reductions and significant increases of eukaryotic algae in all experiments quantified. Differences in flow cytometry were more varied, with Cyanobium and eukaryotic algae counts each significantly lower than control in one experiment, and significantly higher in another. A lack of ascorbate peroxidases in cyanobacteria, which are common in eukaryotes, has been offered as one possible factor contributing to their greater sensitivity [20,21]. Additionally, photosystem II of cyanobacteria is not protected within a cell organelle, making it physically more susceptible to damage from H2O2 [22].
Despite the common reduction in cyanobacterial biomass in experiments, it was reduced to levels below detection limit in only two out of 11 experiments and reduced below 25 µg Chla L−1 (NYSDEC guidance value for cyanobacterial blooms) in one other. The inability to completely eliminate cyanobacteria may result in their resurgence over a short period of time [11]. While microcystin was only quantified once in this study, whole-water concentrations slightly increased (0.6 to 0.9 µg L−1) in that experiment, a finding that slightly contrasts with prior studies [11] but is perhaps not completely surprising given the dynamics of cyanobacteria in that experiment. While total cyanobacterial biomass decreased in that experiment, it was one of the smallest declines in this study (33%). Further, while one microcystin producer, Microcystis [1], significantly declined in relative abundance during that experiment, another, Planktothrix [1], significantly increased and seemingly contributed to the slightly higher toxicity observed at the end of this experiment.

3.2. Comparing Cyanobacterial Genera

While cyanobacterial biomass and cell densities were reduced in a majority of experiments, the reductions varied between genera. Although cyanobacteria do not usually produce ascorbate peroxidases, they are capable of producing a suite of other anti-oxidant enzymes, including catalases, peroxidases, and peroxiredoxins [21]. While peroxiredoxins are ubiquitously present across cyanobacteria, other enzymes can vary between genera and strains, which may account for some of the variability in relative reductions observed [21].
Microcystis was the most ubiquitous of the cyanobacteria during this study and was significantly reduced in microscopic counts to levels less than control in all experiments, but was reduced below detection in only one. Microcystis was reduced to a significantly lower relative and absolute abundance compared to the unamended controls in two of the three experiments where sequencing was performed and was higher with H2O2 in the experiment where Planktothrix was dominant. In contrast to Microcystis, Cyanobium and Cylindrospermopsis were more resistant to H2O2. Cyanobium was the second most abundant cyanobacteria in Roth Pond, behind Microcystis, and cell concentrations were significantly lower relative to the control in one experiment, and significantly higher in another. The sequenced relative abundance of Cyanobium was significantly lower in one of the three experiments. A prior laboratory study found Cyanobium four-fold less sensitive to H2O2 than Microcystis [13]. Cylindrospermopsis concentrations in microscopy were detected in two experiments, and were significantly reduced in only one (Figure 4c). The sequenced relative abundance of Cylindrospermopsis in H2O2 treatments was higher than the control in all three experiments, including one where it was dominant over Microcystis, though it was still reduced in absolute abundance (Figure 4c and Figure 5).
The heightened sensitivity of Microcystis to H2O2 relative to other genera may be related to its deficient antioxidant systems as some strains of Microcystis lack typical cyanobacterial catalases [21]. Importantly, however, while Microcystis densities were significantly reduced by initial treatment with H2O2, it often remained one of the most abundant cyanobacterial genera in experiments where it dominated and was never fully eliminated. Microcystis commonly forms large globular colonies with cells embedded in and surrounded by polysaccharide mucous [23]. The extracellular polymeric substances of this mucous have strong H2O2 scavenging abilities and provide an antioxidant buffer for the cells within [24]. This additional protection may partly explain the perseverance of Microcystis during experiments. In addition, it has been shown that some strains of Microcystis incapable of microcystin synthesis have high levels of thioredoxin and peroxiredoxin, enzymes involved in H2O2 degradation [19] making these strains more likely to survive repeated H2O2 doses than toxic strains. Hence, the persistence of Microcystis may be partly facilitated by shifts among differing strains.
The relative H2O2 resistance of Cylindrospermopsis among cyanobacteria may be due, in part, to their ability to produce superoxide dismutase, catalase, and ascorbate peroxidase [25]. The ability to produce ascorbate peroxidase in Cylindrospermopsis is somewhat unique, as it was believed to be lacking in other cyanobacteria, and therefore contributes to the reduced effectiveness of peroxide against this genus [17,20]. In addition, Cylindrospermopsis can produce single cell akinetes which it uses to survive unfavorable conditions [26]. Akinete production may also account for differences between gene detection and microscopic counts where Cylindrospermopsis reduced was below microscopic detection, as the visible trichomes may have fragmented into akinetes or small, morphologically unidentifiable fragments [27]. It is unlikely the 16S rDNA of Cylindrospermopsis persisted after the cells were destroyed by H2O2, as DNA often degrades within 24 h in freshwater [28,29].
Planktothrix dominated the Lake Agawam experiment that was examined in detail and displayed the largest relative decline in sequenced abundance of any microbe, dropping from 94% to 17% in the H2O2 treatment. In the Roth Pond experiment, Planktothrix increased slightly in relative and absolute abundance of sequences but was below detection levels in microscopic counts. H2O2 has been shown to be effective in controlling Planktothrix in lakes and ponds at similar concentrations to those used here [11,30,31]. This experiment where Planktothrix declined by nearly 80% in relative abundance was also the only instance when the sequenced relative abundance of Microcystis among the cyanobacteria increased following treatment with H2O2, despite its absolute decline, supporting the hypothesis that Planktothrix is more sensitive to H2O2 than Microcystis [30,32], and in assessing all available literature [11,31,32], may be the most sensitive of the cyanobacterial genera to H2O2.
The collective response of these experiments leads evidence to support an ‘open niche’ hypothesis [33]. with regard to the effects of H2O2 on cyanobacteria. While different cyanobacteria are likely differentially sensitive to H2O2, it also seems that the effects of H2O2 are somewhat conditional upon the original community composition. That is, in many cases the dominant cyanobacterial genus is most reduced by H2O2, perhaps by providing the most organic surface area for the H2O2 to react with, allowing genera at lower relative abundances to fill the niche left open by the formerly dominant genera.

3.3. Heterotrophic Bacteria

The net effect of H2O2 on bacteria during this study was inconclusive, as concentrations of heterotrophic bacteria were significantly lower than the control in one of three experiments, and significantly higher in another. In contrast, high throughput sequencing of 16S rDNA revealed that, beyond with changes in total bacterial densities, there were pronounced shifts within prokaryotic communities following treatment with H2O2. The prokaryote taxa identified here were categorized at the phylum level; some traits discussed below may not be indicative of all taxa within a phylum, especially for the very diverse Proteobacteria, but offer some insight to potential strategies employed.
Consistent with fluorometric and microscopic evaluations, the sequenced relative abundance of cyanobacteria made up an average 18 ± 9% of initial abundances and was significantly reduced in two of three experiments. The relative abundance of Actinobacteria, which made up an average 11 ± 3% of initial abundances, was likewise reduced in two of three experiments of experiments, demonstrating that strains of bacteria within this phylum are susceptible to H2O2. In lakes, Actinobacteria are small, thin walled, free-living ultramicrobia (< 0.1µm3) that are abundant in the epilimnion [34]. Actinobacteria are obligate aerobes [35], and densities decrease with decreasing oxygen levels and depth [34,36]. They are defense specialists that are relatively resistant to grazing, but have slow growth rates compared to other bacteria [34,37]. These slow growth rates may make them less likely to recover from initial populations declines induced by H2O2.
Planctomycetes and Verrucomicrobia, which have a close phylogenetic relationship [38], made up a smaller portion of the total bacterial community (< 5%) but also appeared susceptible to H2O2, significantly decreasing in sequenced relative abundance in two of three experiments, and in all experiments, respectively. Verrucomicrobia are usually found throughout the water column and are associated with high-nutrient environments and algal blooms [34]. Prior mesocosm experiments have shown Verrucomicrobia to strongly increase in response to Microcystis degradation [39]. Planctomycetes similarly are capable of breaking down high-molecular weight organic compounds [40,41]. Both phyla are also capable of producing bifunctional catalase-peroxidases [42]. Peroxide resistance, benefitting from organic carbon, and declining Microcystis abundances should have all theoretically promoted these groups. The absence of such a response in their sequenced relative abundance may have been a function of a larger increase or lesser decline in other bacterial groups or a stronger negative effect of H2O2 relative to any benefit derived from algal organic matter.
Proteobacteria increased significantly in sequenced relative abundances in one of three experiments. Proteobacteria were one of the most abundant prokaryotes, making up 30 ± 8% of initial abundances. Proteobacteria have a relatively short generation time, allowing them to respond rapidly to changing conditions [34] and are copiotrophic, able to assimilate small organic acids as well as degrade complex organic compounds [34,40,41]. Proteobacteria also contain catalase-peroxidases and manganese catalases that protect them from oxidative stress [42].
The average initial relative abundance of Bacteroidetes was 27 ± 4%, and values were significantly higher following H2O2 exposure in two of three experiments. Bacteroidetes are usually particle associated and chemoorganotrophic [34], and are capable of degrading complex, high-molecular weight organic compounds [34,40,41]. Bacteroidetes become abundant when DOC or algae-derived DOC are high [34], and Bacteroidetes abundances often increase during the degradation of Microcystis blooms [39]. Their ability to benefit from H2O2 in two experiments and to be unaffected in a third may relate to their exploitation of DOC released by lysing cyanobacteria and/or their association with particles that might scavenge some H2O2 and thereby protect attached cells.
The findings presented here contrast slightly with Lin et al. (2018) who similarly performed mesocosm experiments and analyzed the 16S rDNA for bacterial community shifts in response to 8mg H2O2 L−1. While Firmicutes increased in sequenced relative abundance in that study, Proteobacteria and Bacteroidetes were reduced [32], whereas these two groups increased or were generally unchanged in the present study. Those results, however, emanated from a single experiment that was performed in winter in Dianchi Lake, China, where the temperature was 10 °C [32]. Moreover, changes in relative abundance can be complex as changes in relative abundance of any one group is also dependent on the response of other groups.

3.4. Comparison Among Ecosystems

The reactivity of H2O2 is influenced by its rate of decay, which can be affected by oxidation-reduction processes and the organic matter content of water bodies [43,44]. The nearest measure of organic matter concentration this study performed was algal biomass. Georgica Pond samples had the lowest total biomass with a concentration of 97 µg Chla L−1, and a cyanobacterial biomass of 73 µg Chla L−1, which was reduced 99.8% by H2O2. Lake Agawam was the next densest, with an average total biomass of 164 µg Chla L1, 138 µg Chla L−1 of which was cyanobacteria, which was reduced by 53%. Mill Pond experiments had an average total biomass of 267 µg Chla L−1, with an average cyanobacterial concentration of 241 µg Chla L−1, which was reduced by 96%. Roth Pond was the densest and most mixed, with an average total biomass of 486 µg Chla L−1, and an average cyanobacterial concentration of 140 µg Chla L−1, which was reduced by 67%. Across these four systems, there was no significant relationship between effectiveness of H2O2 in reduction of cyanobacterial biomass and total biomass (Figure 8a), and, therefore, other factors may have had a greater influence on efficacy. For some individual systems, specifically Lake Agawam and Roth Pond, increasing levels of algal biomass were significantly correlated with decreasing reductions on cyanobacterial biomass during H2O2 treatments (Lake Agawam, p < 0.005, Figure 8b; Roth Pond, p < 0.001, Figure 8c), meaning H2O2 became less effective at controlling cyanobacteria as total algal biomass increased. This trend was not detected in water from Mill Pond or Georgica Pond. Regardless, the findings for Lake Agawam and Roth Pond samples suggest that the efficacy of H2O2 in controlling cyanobacteria can depending on the levels of total algal biomass, but that the relationship is partly conditional upon other factors that may differ independently across ecosystems including levels of total organic carbon in the water column and the inventory of organic matter within sediments.
Across all experiments, initial reductions in cyanobacterial biomass persisted during the four-to-seven-day incubations. Other long-term studies from lakes and wastewater stabilization ponds dominated by Planktothrix found the effects of H2O2 persisted for five to seven weeks [11,31], and in a mixed assemblage of Microcystis and Planktothrix persisted for three weeks [17]. Longer observations would be required to determine the ability of the cyanobacteria to recover and the time frame within which such a recovery would occur.

4. Conclusions

This study demonstrated that H2O2 administered at a moderate dose (4 mg L−1) consistently inhibits cyanobacteria and promotes the growth of eukaryotic algae, primarily green algae. H2O2 significantly reduced heterotrophic bacterial densities, with the phylum Actinobacteria most consistently reduced. Other bacterial phyla also declined, but were relatively less impacted, potentially due to their antioxidant enzymes and recovery fueled by use of cyanobacterial-derived organic matter, with some phyla increasing in relative abundance following the addition of H2O2. H2O2 did not successfully reduce cyanobacteria levels below detection or guidance levels in a majority of experiments at the concentrations used here (4 mg L−1). While the elimination of cyanobacteria might have been achieved with higher doses of H2O2, prior research has suggested that such levels may cause collateral damage on non-target organisms [11,12]. The use of bottle experiments here, however, likely maximized contact between H2O2 and the plankton community, while minimizing scavenging by sediments. Future, larger scale and whole ecosystem experiments may provide deeper insight with regard the true effect and effectiveness of H2O2 in altering plankton community structure and mitigating cyanobacterial blooms.

5. Materials and Methods

Bottle incubation experiments were performed within four study systems: Georgica Pond (latitude, longitude = 40.938671, −72.230216), Mill Pond (40.914848, −72.358037), Lake Agawam (40.875074, −72.391942), and Roth Pond (40.911734, −73.123772). Lake Agawam, Mill Pond, and Georgica Pond are shallow (2–3 m) natural freshwater (Lake Agawam, Mill Pond) or brackish (Georgica Pond; salinity 0–20 PSU) water bodies located on Long Island’s south shore and are 0.24 km2, 0.49 km2, and 1.17 km2, respectively, and known to experience repeated cyanobacterial blooms [45,46]. Roth Pond is a man-made, 3 × 10⁻³ km2, 1 m deep water body on the campus of Stony Brook University, in Stony Brook, NY, USA.
This study presents 11 experiments performed in two rounds (Table 1). The first round of experiments consisted of three experiments from Lake Agawam, three experiments from Mill Pond, one experiment from Roth Pond, and one experiment from Georgica Pond that were evaluated for changes in phytoplankton communities in response to H2O2 using a bbe Moldaenke (Kiel, Germany) Fluoroprobe. The second round of experiments were performed at Lake Agawam, Mill Pond, and Roth Pond and involved in-depth and detailed investigations of the prokaryotic and eukaryotic plankton communities’ responses to H2O2 using fluorometry, microscopy, flow cytometry, and high-throughput amplicon sequencing.
Surface water was collected using 20 L carboys from each site experiencing a cyanobacterial bloom defined as > 25 µg Chla L−1 from cyanobacteria as quantified on a bbe Fluoroprobe according to the (NYSDEC; details below). Bloom water was transferred from the carboys into 4-L polycarbonate bottles using acid-washed Tygon tubing placed at the bottom of the bottle to reduce bubbling and disturbance of the plankton. Each bottle experiment consisted of two treatments, with three replicate bottles each: an unamended control, and 4 mg H2O2 L−1 treatment achieved via the addition of a 3% w/v H2O2 solution. These H2O2 levels have been previously shown to reduce levels of Planktothrix but not eukaryotes in a matter of days in European lakes [11,12]. Bottles were incubated for four-to-seven days under ambient light and temperature conditions in an outdoor flow-through table, constantly flushed with water from Old Fort Pond, Southampton, NY, which maintains water temperatures comparable to the shallow lakes and ponds studied here (Figure 9). Initial and final timepoint samples were obtained and preserved for microscopy (5% Lugol’s iodine), flow cytometry (10% buffered formalin stored at −80 °C), and the extraction of DNA (50 mL onto a 0.2 µm, 47 mm Isopore polycarbonate filter frozen at −80 °C). Lugol’s iodine preserved samples were analyzed using a Sedgewick Rafter slide to quantify cyanobacteria at the genus level as well as eukaryotic algae that were broadly categorized as unicellular green algae (chlorophytes) or diatoms. Formalin-preserved samples were used to quantify the abundances of phycocyanin-containing pico-cyanobacteria, pico- and nano-eukaryotic phytoplankton, and SYBR Green I-stained heterotrophic bacteria on a CytoFLEX flow cytometer (Beckman Coulter, Indianapolis, IN, USA) based on fluorescence patterns and particle size [47]. Pico-cyanobacteria are identified here as Cyanobium based on high-throughput sequencing identification results. Fluorescence measurements were made on initial and final live samples on a BBE Fluoroprobe which categorizes algal biomass (Chla) based on the fluorescence signatures of green algae, cyanobacteria, and unicellular brown algae (diatoms, dinoflagellates, raphidophytes) [48]. Whole-water samples (1 mL) were collected and frozen for one experiment for analysis of the cyanobacterial toxin, microcystin, via an Abraxis Microcystins ELISA assay which included lysing cells for a total concentration [49]. Differences between treatments and controls for each parameter measured in the experiments were assessed via a one-way ANOVA. Values below detection were entered as zero.

DNA Extraction, Sequencing, and Analysis

DNA barcoding analysis was performed to assess changes in community composition of cyanobacteria and other prokaryotes. Samples were initially heated in a water bath to 65° for 10 min to aid in lysing, and extractions were performed using a Qiagen DNeasy® PowerWater® Kit. Double-stranded DNA was quantified on a Qubit® fluorometer using a dsDNA BR Assay kit. Aliquots were normalized to an equal quantity of DNA, and sent to Molecular Research Laboratories (Shallowater, TX, USA) for amplicon sequencing. Paired-end sequencing was performed on an Illumina MiSeq (2 × 300bp) following the manufacturer’s guidelines. The 16S rRNA gene V4 variable region (~252bp) was amplified using universal primers 515F: 5’-GTG YCA GCM GCC GCG GTAA-3′ [50] and 806RB: 5´-GGA CTA CNV GGG TWT CTA AT-3′ [51]. For each sample, an identifying barcode was placed on the forward primer and a 30 cycle PCR using the HotStarTaq Plus Master Mix Kit (Qiagen, Valencia, CA, USA) was performed. The following PCR conditions were used: 94 °C for 3 min, followed by 28 cycles of 94 °C for 30 s, 53 °C for 40 s and 72 °C for 1 min, and a final elongation step at 72 °C for 5 min. Samples were purified using calibrated Ampure XP beads and subsequently used to prepare an Illumina DNA library.
Sequence data was processed using the Quantitative Insights into Microbial Ecology QIIME 1 (v1.9.1) and QIIME 2 (v2019.1.0) following the “Moving Pictures” pipeline (QIIME, http://qiime.org; [52]). Raw sequences were depleted of sample barcodes in QIIME 1. Paired-end reads were demultiplexed in QIIME 2 using the DEMUX plugin, and were depleted of primers using the Cutadapt Plugin. The library was filtered for chimeric sequences, denoised and dereplicated using the DADA2 plugin. A naïve Bayes classifier was trained using the SILVA rRNA (16S SSU) v132 reference database at 99% similarity, and was used with the q2-feature-classifier and classify-sklearn plugins to assign taxonomies. The dataset was filtered to remove mitochondria and chloroplast features. Prokaryotic OTUs were examined at the phylum level and were expressed as relative abundance of each. Cyanobacteria OTUs were then examined at the genus level, also expressed as relative abundance. For each set, prokaryote OTUs and cyanobacteria OTUs, relative abundances exceeding 5% were compared, and the remaining were grouped as “other”. Statistical analysis of diversity, as well as shifts in relative abundance were performed in QIIME 2. Absolute abundances of cyanobacterial genera were estimated by multiplying the Fluoroprobe quantified levels of cyanobacterial fluorescence by the relative abundance of each genera exceeding 5% of the total OTU reads. Raw sequencing data was deposited to the NCBI Sequence Read Archive (SRA) under accession number PRJNA642309.

Author Contributions

Conceptualization, M.W.L. and C.J.G.; Methodology, M.W.L. and C.J.G.; Validation, C.J.G.; Formal analysis, M.W.L. and C.J.G.; Investigation, M.W.L.; Resources, C.J.G.; Data curation, M.W.L.; Writing—Original draft preparation, M.W.L.; Writing—Review and editing, C.J.G.; Visualization, M.W.L.; Supervision, C.J.G; Project administration, C.J.G.; Funding acquisition, C.J.G. All authors have read and agreed to the published version of the manuscript.

Funding

This research was funded by the New York State Department of Environmental Conservation, the Tamarind Foundation, and NOAA’s MERHAB program.

Acknowledgments

We acknowledge the support of the New York State Department of Environmental Conservation for support of this project, the New York State Center for Clean Water Technology in making measurements of hydrogen peroxide, and Solitude Lake Management for performing whole lake applications of hydrogen peroxide.

Conflicts of Interest

The authors declare no conflicts of interest.

References

  1. Backer, L.C.; McGillicuddy, D.J., Jr. Harmful algal blooms: At the interface between coastal oceanography and human health. Oceanography 2006, 19, 94. [Google Scholar] [CrossRef] [PubMed]
  2. Bartram, J.; Chorus, I. Toxic Cyanobacteria in Water: A Guide to their Public Health Consequences, Monitoring and Management; CRC Press: London, UK, 1999. [Google Scholar]
  3. United States Environmental Protection Agency. Drinking Water Health Advisory for the Cyanobacterial Microcystin Toxins; United States Environmental Protection Agency: Washington DC, USA, 2015. [Google Scholar]
  4. Bukaveckas, P.A.; Lesutienė, J.; Gasiūnaitė, Z.R.; Ložys, L.; Olenina, I.; Pilkaitytė, R.; Pūtys, Ž.; Tassone, S.; Wood, J. Microcystin in aquatic food webs of the Baltic and Chesapeake Bay regions. Estuar. Coast. Shelf Sci. 2017, 191, 50–59. [Google Scholar] [CrossRef] [Green Version]
  5. Ibelings, B.W.; Chorus, I. Accumulation of cyanobacterial toxins in freshwater “seafood” and its consequences for public health: A review. Environ. Pollut. 2007, 150, 177–192. [Google Scholar] [CrossRef] [PubMed]
  6. Poste, A.E.; Hecky, R.E.; Guildford, S.J. Evaluating microcystin exposure risk through fish consumption. Environ. Sci. Technol. 2011, 45, 5806–5811. [Google Scholar] [CrossRef] [Green Version]
  7. Backer, L.C.; Landsberg, J.H.; Miller, M.; Keel, K.; Taylor, T.K. Canine cyanotoxin poisonings in the United States (1920s–2012): Review of suspected and confirmed cases from three data sources. Toxins 2013, 5, 1597–1628. [Google Scholar] [CrossRef]
  8. Harke, M.J.; Steffen, M.M.; Gobler, C.J.; Otten, T.G.; Wilhelm, S.W.; Wood, S.A.; Paerl, H.W. A review of the global ecology, genomics, and biogeography of the toxic cyanobacterium, Microcystis spp. Harmful Algae 2016, 54, 4–20. [Google Scholar] [CrossRef] [Green Version]
  9. Paerl, H.W. Nuisance phytoplankton blooms in coastal, estuarine, and inland waters 1. Limnol. Oceanogr. 1988, 33, 823–843. [Google Scholar] [CrossRef]
  10. Barrington, D.J.; Ghadouani, A.; Ivey, G.N. Environmental factors and the application of hydrogen peroxide for the removal of toxic cyanobacteria from waste stabilization ponds. J. Environ. Eng. 2011, 137, 952–960. [Google Scholar] [CrossRef]
  11. Matthijs, H.C.; Visser, P.M.; Reeze, B.; Meeuse, J.; Slot, P.C.; Wijn, G.; Talens, R.; Huisman, J. Selective suppression of harmful cyanobacteria in an entire lake with hydrogen peroxide. Water Res. 2012, 46, 1460–1472. [Google Scholar] [CrossRef]
  12. Matthijs, H.C.; Jančula, D.; Visser, P.M.; Maršálek, B. Existing and emerging cyanocidal compounds: New perspectives for cyanobacterial bloom mitigation. Aquat. Ecol. 2016, 50, 443–460. [Google Scholar] [CrossRef] [Green Version]
  13. Drábková, M.; Admiraal, W.; Maršálek, B. Combined exposure to hydrogen peroxide and light selective effects on cyanobacteria, green algae, and diatoms. Environ. Sci. Technol. 2007, 41, 309–314. [Google Scholar] [CrossRef] [PubMed]
  14. Barrington, D.J.; Ghadouani, A. Application of hydrogen peroxide for the removal of toxic cyanobacteria and other phytoplankton from wastewater. Environ. Sci. Technol. 2008, 42, 8916–8921. [Google Scholar] [CrossRef] [PubMed]
  15. Samuilov, V.; Timofeev, K.; Sinitsyn, S.; Bezryadnov, D. H2O2-induced inhibition of photosynthetic O2 evolution by Anabaena variabilis cells. Biochemistry 2004, 69, 926–933. [Google Scholar]
  16. Drabkova, M.; Maršálek, B.; Admiraal, W. Photodynamic therapy against cyanobacteria. Environ. Toxicol. Int. J. 2007, 22, 112–115. [Google Scholar] [CrossRef] [PubMed]
  17. Barrington, D.J.; Reichwaldt, E.S.; Ghadouani, A. The use of hydrogen peroxide to remove cyanobacteria and microcystins from waste stabilization ponds and hypereutrophic systems. Ecol. Eng. 2013, 50, 86–94. [Google Scholar] [CrossRef]
  18. Zilliges, Y.; Kehr, J.-C.; Meissner, S.; Ishida, K.; Mikkat, S.; Hagemann, M.; Kaplan, A.; Borner, T.; Dittmann, E. The Cyanobacterial Hepatotoxin Microcystin Binds to Proteins and Increases the Fitness of Microcystis under Oxidative Stress Conditions. PLoS ONE 2011, 6, e17615. [Google Scholar] [CrossRef] [Green Version]
  19. Schuurmans, J.M.; Brinkmann, B.W.; Makower, A.K.; Dittmann, E.; Huisman, J.; Matthijs, H.C. Microcystin interferes with defense against high oxidative stress in harmful cyanobacteria. Harmful Algae 2018, 78, 47–55. [Google Scholar] [CrossRef]
  20. Passardi, F.; Zamocky, M.; Favet, J.; Jakopitsch, C.; Penel, C.; Obinger, C.; Dunand, C. Phylogenetic distribution of catalase-peroxidases: Are there patches of order in chaos? Gene 2007, 397, 101–113. [Google Scholar] [CrossRef]
  21. Bernroitner, M.; Zamocky, M.; Furtmüller, P.G.; Peschek, G.A.; Obinger, C. Occurrence, phylogeny, structure, and function of catalases and peroxidases in cyanobacteria. J. Exp. Bot. 2009, 60, 423–440. [Google Scholar] [CrossRef] [Green Version]
  22. Barroin, G.; Feuillade, M. Hydrogen peroxide as a potential algicide for Oscillatoria rubescens DC. Water Res. 1986, 20, 619–623. [Google Scholar] [CrossRef]
  23. Lürling, M.; Meng, D.; Faassen, E.J. Effects of hydrogen peroxide and ultrasound on biomass reduction and toxin release in the cyanobacterium, Microcystis aeruginosa. Toxins 2014, 6, 3260–3280. [Google Scholar] [CrossRef] [PubMed] [Green Version]
  24. Gao, L.; Pan, X.; Zhang, D.; Mu, S.; Lee, D.-J.; Halik, U. Extracellular polymeric substances buffer against the biocidal effect of H2O2 on the bloom-forming cyanobacterium Microcystis aeruginosa. Water Res. 2015, 69, 51–58. [Google Scholar] [CrossRef] [PubMed]
  25. Schrader, K.K.; Dayan, F.E. Antioxidant enzyme activities in the cyanobacteria Planktothrix agardhii, Planktothrix perornata, Raphidiopsis brookii, and the green alga Selenastrum capricornutum. In Handbook on Cyanobacteria: Biochemistry, Biotechnology, and Applications; Nova Science Publishers: Hauppauge, NY, USA, 2010; pp. 473–483. [Google Scholar]
  26. Moore, D.; O’Donohue, M.; Garnett, C.; Critchley, C.; Shaw, G. Factors affecting akinete differentiation in Cylindrospermopsis raciborskii (Nostocales, Cyanobacteria). Freshw. Biol. 2005, 50, 345–352. [Google Scholar] [CrossRef]
  27. Moustaka-Gouni, M.; Kormas, K.A.; Vardaka, E.; Katsiapi, M.; Gkelis, S. Raphidiopsis mediterranea Skuja represents non-heterocytous life-cycle stages of Cylindrospermopsis raciborskii (Woloszynska) Seenayya et Subba Raju in Lake Kastoria (Greece), its type locality: Evidence by morphological and phylogenetic analysis. Harmful Algae 2009, 8, 864–872. [Google Scholar] [CrossRef]
  28. Nielsen, K.M.; Johnsen, P.J.; Bensasson, D.; Daffonchio, D. Release and persistence of extracellular DNA in the environment. Environ. Biosaf. Res. 2007, 6, 37–53. [Google Scholar] [CrossRef] [Green Version]
  29. Zulkefli, N.; Kim, K.-H.; Hwang, S.-J. Effects of Microbial Activity and Environmental Parameters on the Degradation of Extracellular Environmental DNA from a Eutrophic Lake. Int. J. Environ. Res. Public Health 2019, 16, 3339. [Google Scholar] [CrossRef] [Green Version]
  30. Yang, Z.; Buley, R.P.; Fernandez-Figueroa, E.G.; Barros, M.U.G.; Rajendran, S.; Wilson, A.E. Hydrogen peroxide treatment promotes chlorophytes over toxic cyanobacteria in a hyper-eutrophic aquaculture pond. Environ. Pollut. 2018, 240, 590–598. [Google Scholar] [CrossRef]
  31. Sinha, A.K.; Eggleton, M.A.; Lochmann, R.T. An environmentally friendly approach for mitigating cyanobacterial bloom and their toxins in hypereutrophic ponds: Potentiality of a newly developed granular hydrogen peroxide-based compound. Sci. Total Environ. 2018, 637, 524–537. [Google Scholar] [CrossRef]
  32. Lin, L.; Shan, K.; Xiong, Q.; Zhou, Q.; Li, L.; Gan, N.; Song, L. The ecological risks of hydrogen peroxide as a cyanocide: Its effect on the community structure of bacterioplankton. J. Oceanol. Limnol. 2018, 36, 2231–2242. [Google Scholar] [CrossRef]
  33. Smayda, T.J.; Reynolds, C.S. Strategies of marine dinoflagellate survival and some rules of assembly. J. Sea Res. 2003, 49, 95–106. [Google Scholar] [CrossRef]
  34. Newton, R.J.; Jones, S.E.; Eiler, A.; McMahon, K.D.; Bertilsson, S. A guide to the natural history of freshwater lake bacteria. Microbiol. Mol. Biol. Rev. 2011, 75, 14–49. [Google Scholar] [CrossRef] [PubMed] [Green Version]
  35. Den Hengst, C.D.; Buttner, M.J. Redox control in actinobacteria. Biochim. Biophys. Acta (BBA)-Gen. Subj. 2008, 1780, 1201–1216. [Google Scholar] [CrossRef] [PubMed]
  36. Taipale, S.; Jones, R.I.; Tiirola, M. Vertical diversity of bacteria in an oxygen-stratified humic lake, evaluated using DNA and phospholipid analyses. Aquat. Microb. Ecol. 2009, 55, 1–16. [Google Scholar] [CrossRef]
  37. Šimek, K.; Horňák, K.; Jezbera, J.; Nedoma, J.; Vrba, J.; Straškrábová, V.; Macek, M.; Dolan, J.R.; Hahn, M.W. Maximum growth rates and possible life strategies of different bacterioplankton groups in relation to phosphorus availability in a freshwater reservoir. Environ. Microbiol. 2006, 8, 1613–1624. [Google Scholar] [CrossRef]
  38. Wagner, M.; Horn, M. The Planctomycetes, Verrucomicrobia, Chlamydiae and sister phyla comprise a superphylum with biotechnological and medical relevance. Curr. Opin. Biotechnol. 2006, 17, 241–249. [Google Scholar] [CrossRef]
  39. Shao, K.; Gao, G.; Chi, K.; Qin, B.; Tang, X.; Yao, X.; Dai, J. Decomposition of Microcystis blooms: Implications for the structure of the sediment bacterial community, as assessed by a mesocosm experiment in Lake Taihu, China. J. Basic Microbiol. 2013, 53, 549–554. [Google Scholar] [CrossRef]
  40. Nold, S.C.; Zwart, G. Patterns and governing forces in aquatic microbial communities. Aquat. Ecol. 1998, 32, 17–35. [Google Scholar] [CrossRef]
  41. DeLong, E.F.; Franks, D.G.; Alldredge, A.L. Phylogenetic diversity of aggregate-attached vs. free-living marine bacterial assemblages. Limnol. Oceanogr. 1993, 38, 924–934. [Google Scholar] [CrossRef] [Green Version]
  42. Zámocký, M.; Gasselhuber, B.; Furtmüller, P.G.; Obinger, C. Molecular evolution of hydrogen peroxide degrading enzymes. Arch. Biochem. Biophys. 2012, 525, 131–144. [Google Scholar] [CrossRef] [Green Version]
  43. Cooper, W.J.; Zepp, R.G. Hydrogen peroxide decay in waters with suspended soils: Evidence for biologically mediated processes. Can. J. Fish. Aquat. Sci. 1990, 47, 888–893. [Google Scholar] [CrossRef]
  44. Häkkinen, P.J.; Anesio, A.M.; Granéli, W. Hydrogen peroxide distribution, production, and decay in boreal lakes. Can. J. Fish. Aquat. Sci. 2004, 61, 1520–1527. [Google Scholar] [CrossRef] [Green Version]
  45. Gobler, C.J.; Davis, T.W.; Coyne, K.J.; Boyer, G.L. Interactive influences of nutrient loading, zooplankton grazing, and microcystin synthetase gene expression on cyanobacterial bloom dynamics in a eutrophic New York lake. Harmful Algae 2007, 6, 119–133. [Google Scholar] [CrossRef]
  46. Davis, T.W.; Berry, D.L.; Boyer, G.L.; Gobler, C.J. The effects of temperature and nutrients on the growth and dynamics of toxic and non-toxic strains of Microcystis during cyanobacteria blooms. Harmful Algae 2009, 8, 715–725. [Google Scholar] [CrossRef]
  47. Kang, Y.; Koch, F.; Gobler, C.J. The interactive roles of nutrient loading and zooplankton grazing in facilitating the expansion of harmful algal blooms caused by the pelagophyte, Aureoumbra lagunensis, to the Indian River Lagoon, FL, USA. Harmful Algae 2015, 49, 162–173. [Google Scholar] [CrossRef]
  48. Jankowiak, J.; Hattenrath-Lehmann, T.; Kramer, B.J.; Ladds, M.; Gobler, C.J. Deciphering the effects of nitrogen, phosphorus, and temperature on cyanobacterial bloom intensification, diversity, and toxicity in western Lake Erie. Limnol. Oceanogr. 2019, 64, 1347–1370. [Google Scholar] [CrossRef] [Green Version]
  49. Harke, M.J.; Gobler, C.J. Daily transcriptome changes reveal the role of nitrogen in controlling microcystin synthesis and nutrient transport in the toxic cyanobacterium, Microcystis aeruginosa. BMC Genom. 2015, 16, 1068. [Google Scholar] [CrossRef] [PubMed] [Green Version]
  50. Parada, A.E.; Needham, D.M.; Fuhrman, J.A. Every base matters: Assessing small subunit rRNA primers for marine microbiomes with mock communities, time series and global field samples. Environ. Microbiol. 2016, 18, 1403–1414. [Google Scholar] [CrossRef] [PubMed]
  51. Klindworth, A.; Pruesse, E.; Schweer, T.; Peplies, J.; Quast, C.; Horn, M.; Glöckner, F.O. Evaluation of general 16S ribosomal RNA gene PCR primers for classical and next-generation sequencing-based diversity studies. Nucleic Acids Res. 2012, 41, e1. [Google Scholar] [CrossRef]
  52. Caporaso, J.G.; Kuczynski, J.; Stombaugh, J.; Bittinger, K.; Bushman, F.D.; Costello, E.K.; Fierer, N.; Peña, A.G.; Goodrich, J.K.; Gordon, J.I.; et al. QIIME allows analysis of high-throughput community sequencing data. Nat. Methods 2010, 7, 335–336. [Google Scholar] [CrossRef] [PubMed] [Green Version]
Figure 1. Fluoroprobe biomass measurements for bottle experiments from Lake Agawam (a) 7/21/16, (b) 10/20/16, (c) 6/9/17; Mill Pond (d) 7/21/16, (e) 10/20/16, (f) 6/30/17; (g) Georgica Pond 7/21/16; and (h) Roth Pond 6/9/17. Asterisks show significant changes (p < 0.05) in treatments relative to control. Error bars show standard error.
Toxins 12 00428 g001
Figure 2. (a) Fluoroprobe biomass, (b) flow cytometry, (c) microscopy, (d) phylum level relative abundance, and (e) genus level cyanobacteria relative abundance for Lake Agawam experiment, 10/3/16. Asterisks show significant changes (p < 0.05) in treatments relative to control. Error bars show standard error.
Toxins 12 00428 g002
Figure 3. Absolute abundance (relative abundance multiplied by biomass) of cyanobacteria for Lake Agawam experiment, 10/3/16.
Toxins 12 00428 g003
Figure 4. (a) Fluoroprobe biomass, (b) flow cytometry, (c) microscopy, (d) phylum level relative abundance, and (e) genus level cyanobacteria relative abundance for Mill Pond experiment, 10/3/16. Asterisks show significant changes (p < 0.05) in treatments relative to control. Error bars show standard error.
Toxins 12 00428 g004
Figure 5. Absolute abundance (relative abundance multiplied by biomass) of cyanobacteria for Mill Pond experiment 10/3/16.
Toxins 12 00428 g005
Figure 6. (a) Fluoroprobe biomass, (b) flow cytometry, (c) microscopy, (d) phylum level relative abundance, and (e) genus level cyanobacteria relative abundance for Roth Pond experiment, 6/30/17. Asterisks show significant changes (p < 0.05) in treatments relative to control. Error bars show standard error.
Toxins 12 00428 g006
Figure 7. Absolute abundance (relative abundance multiplied by biomass) of cyanobacteria for Roth Pond experiment, 6/30/17.
Toxins 12 00428 g007
Figure 8. Regression plots for percent cyanobacterial reduction per initial unit biomass (µg Chla L−1) following the addition of 4 mg L−1 H2O2 for all experiments (a), Lake Agawam experiments (b), and Roth Pond experiments (c).
Toxins 12 00428 g008
Figure 9. Outdoor flow-through table, and 4 L bottles used for incubation experiments. Example of pigment change between control and H2O2 treatments.
Toxins 12 00428 g009
Table 1. Overview of experiments and analysis performed for each waterbody.
WaterbodyDatesAnalysis
Lake Agawam7/21/16
10/20/16
6/9/17
Fluorescence only
10/3/16Full1
Mill Pond7/21/16
10/20/16
6/30/17
Fluorescence only
10/3/16Full1
Georgica Pond7/21/16Fluorescence only
Roth Pond6/9/17Fluorescence only
6/30/17Full1
1 Fluorescence, microscopy, flow cytometry, DNA sequencing.

