Extending Metabolomic Studies of Apis mellifera Venom: LC-MS-Based Targeted Analysis of Organic Acids


Abstract

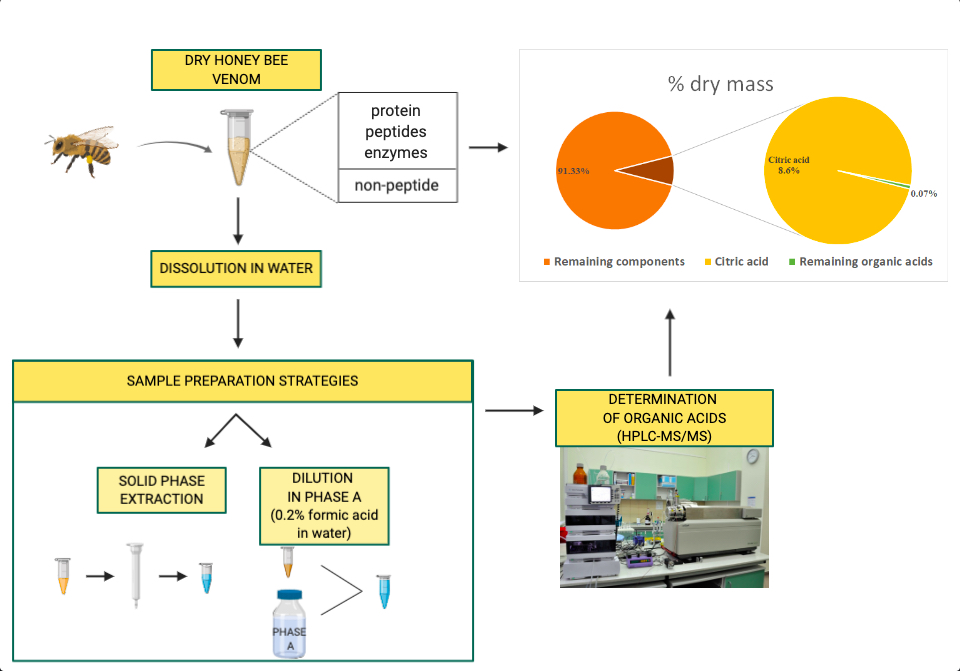
1. Introduction
2. Results
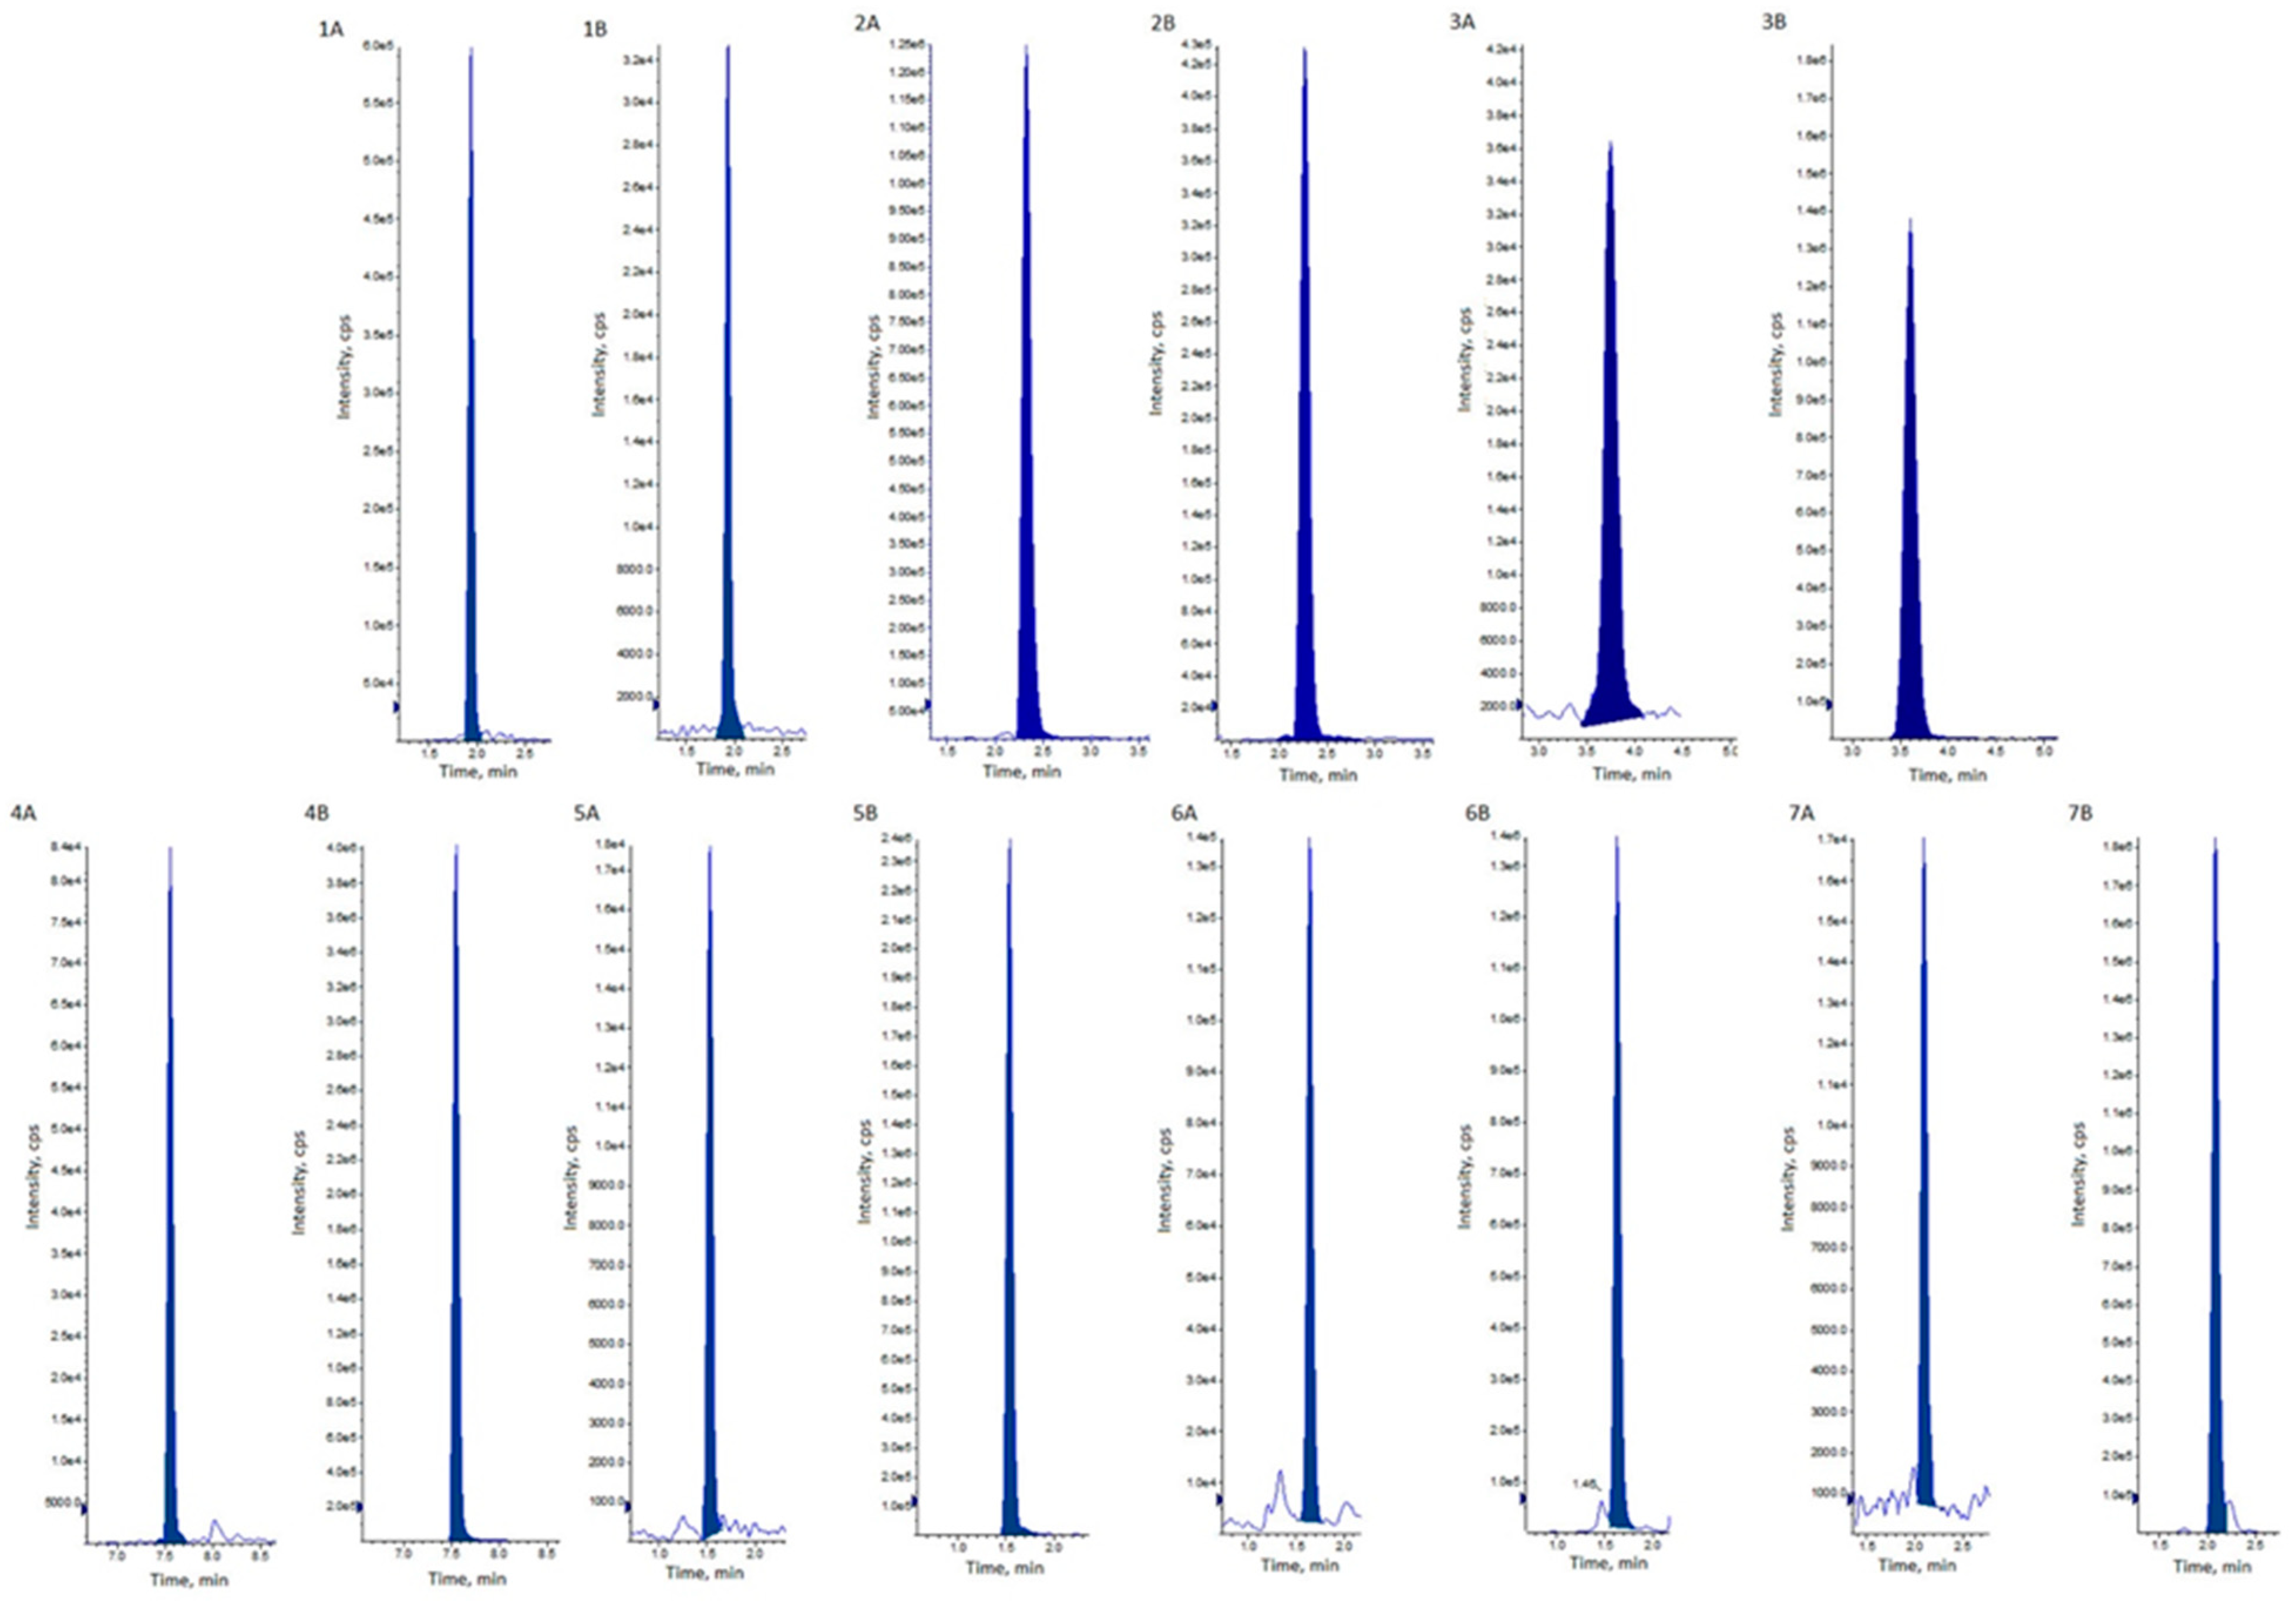
2.1. Method Validation
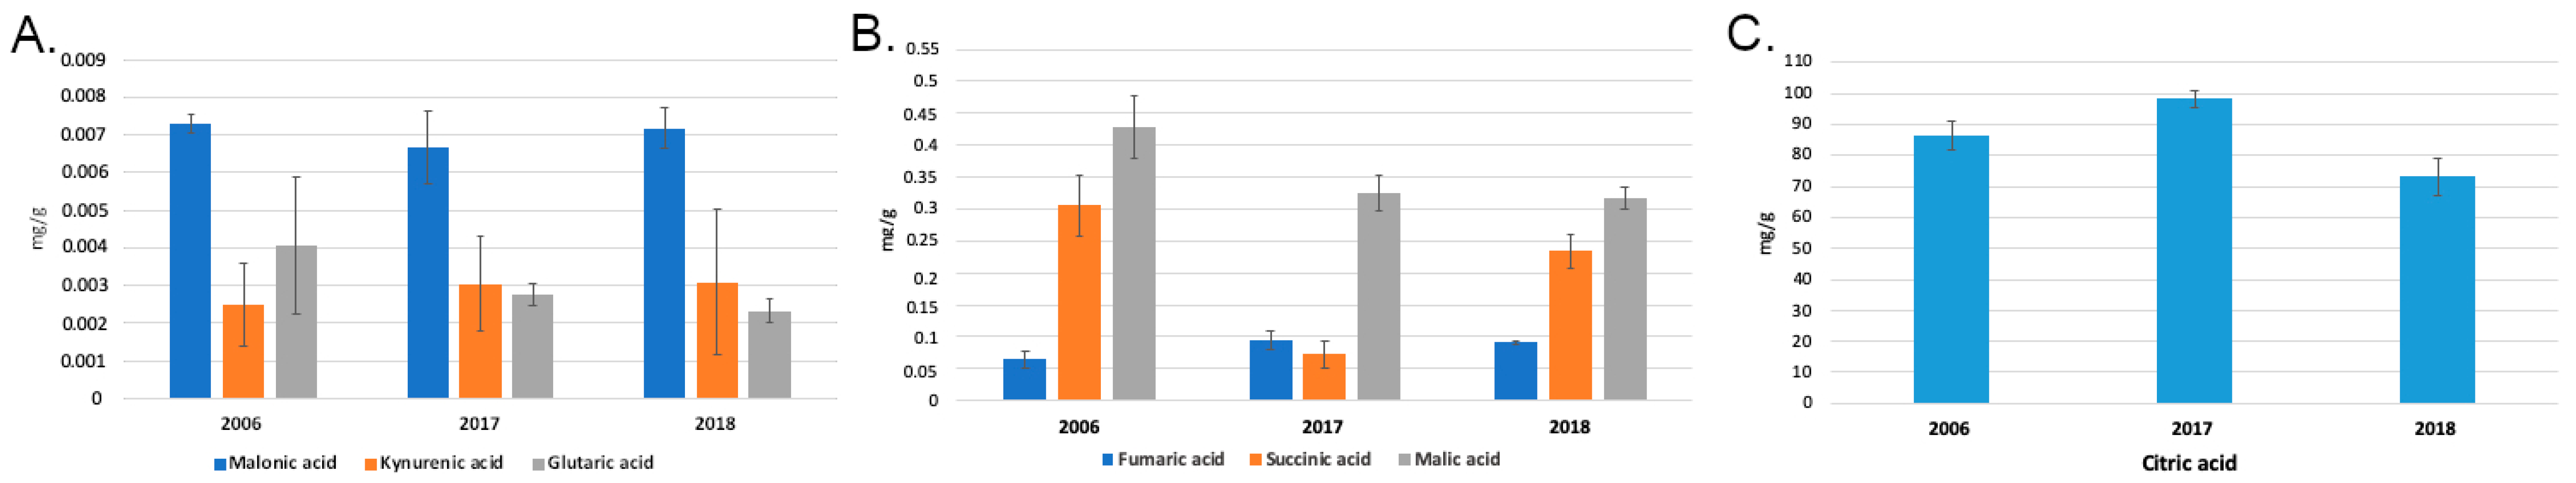
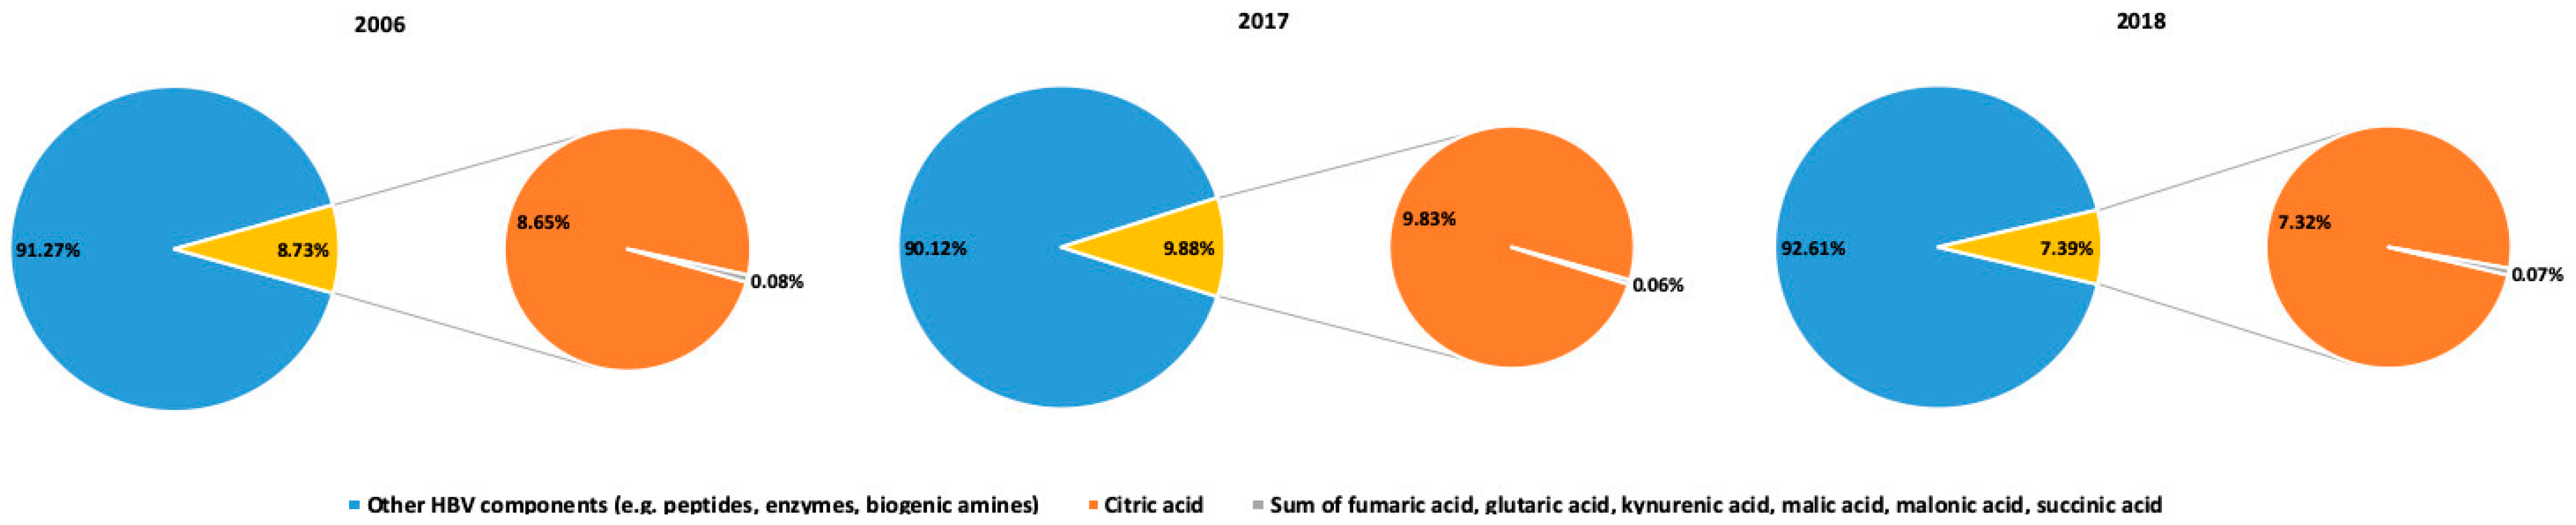
2.2. Organic Acid Profiles of HBV Samples
3. Discussion
4. Conclusions
5. Materials and Methods
5.1. Reagents and Standards
5.2. Sample Collection and Preparation
5.3. Liquid Chromatography
5.4. Mass Spectrometry
5.5. Method Validation
Author Contributions
Acknowledgments
Conflicts of Interest
References
- De Lima, P.R.; Brochetto-Braga, M.R. Hymenoptera venom review focusing on Apis mellifera. J. Venom. Anim. Toxins Incl. Trop. Dis. 2003, 9, 149–162. [Google Scholar]
- Alvarez-Fischer, D.; Noelker, C.; Vulinović, F.; Grünewald, A.; Chevarin, C.; Klein, C.; Oertel, W.H.; Hirsch, E.C.; Michel, P.P.; Hartmann, A. Bee Venom and Its Component Apamin as Neuroprotective Agents in a Parkinson Disease Mouse Model. PLoS ONE 2013, 8, e61700. [Google Scholar] [CrossRef] [PubMed]
- Karimi, A.; Ahmadi, F.; Parivar, K.; Nabiuni, M.; Haghighi, S.; Imani, S.; Afrouzi, H. Effect of honey bee venom on Lewis rats with experimental allergic encephalomyelitis, a model for multiple sclerosis. Iran. J. Pharm. Res. 2012, 11, 671. [Google Scholar] [PubMed]
- Oršolić, N. Bee venom in cancer therapy. Cancer Metastasis Rev. 2012, 31, 173–194. [Google Scholar] [CrossRef] [PubMed]
- Park, J.H.; Kim, K.H.; Kim, S.J.; Lee, W.R.; Lee, K.G.; Park, K.K. Bee venom protects hepatocytes from tumor necrosis factor-α and actinomycin D. Arch. Pharm. Res. 2010, 33, 215–223. [Google Scholar] [CrossRef] [PubMed]
- Kim, H.; Park, S.Y.; Lee, G. Potential therapeutic applications of bee venom on skin disease and its mechanisms: A literature review. Toxins 2019, 11, 374. [Google Scholar] [CrossRef] [PubMed]
- Kang, S.Y.; Roh, D.H.; Yoon, S.Y.; Moon, J.Y.; Kim, H.W.; Lee, H.J.; Beitz, A.J.; Lee, J.H. Repetitive treatment with diluted bee venom reduces neuropathic pain via potentiation of locus coeruleus noradrenergic neuronal activity and modulation of spinal NR1 phosphorylation in rats. J. Pain 2012, 13, 155–166. [Google Scholar] [CrossRef] [PubMed]
- Ridolo, E.; Pellicelli, I.; Kihlgren, P.; Nizi, M.C.; Pucciarini, F.; Senna, G.; Incorvaia, C. Immunotherapy and biologicals for the treatment of allergy to Hymenoptera stings. Expert Opin. Biol. Ther. 2019, 19, 919–925. [Google Scholar] [CrossRef]
- Li, R.; Zhang, L.; Fang, Y.; Han, B.; Lu, X.; Zhou, T.; Feng, M.; Li, J. Proteome and phosphoproteome analysis of honeybee (Apis mellifera) venom collected from electrical stimulation and manual extraction of the venom gland. BMC Genomics 2013, 14, 766. [Google Scholar] [CrossRef]
- Lariviere, W.R.; Melzack, R. The bee venom test: A new tonic-pain test. Pain 1996, 66, 271–277. [Google Scholar] [CrossRef]
- Wehbe, R.; Frangieh, J.; Rima, M.; El Obeid, D.; Sabatier, J.M.; Fajloun, Z. Bee venom: Overview of main compounds and bioactivities for therapeutic interests. Molecules 2019, 24, 2997. [Google Scholar] [CrossRef] [PubMed]
- Frangieh, J.; Salma, Y.; Haddad, K.; Mattei, C.; Legros, C.; Fajloun, Z.; Obeid, D. El First characterization of the venom from apis mellifera syriaca, a honeybee from the middle east region. Toxins 2019, 11, 191. [Google Scholar] [CrossRef] [PubMed]
- Silva, J.; Monge-Fuentes, V.; Gomes, F.; Lopes, K.; dos Anjos, L.; Campos, G.; Arenas, C.; Biolchi, A.; Gonçalves, J.; Galante, P.; et al. Pharmacological alternatives for the treatment of neurodegenerative disorders: Wasp and bee venoms and their components as new neuroactive tools. Toxins 2015, 7, 3179–3209. [Google Scholar] [CrossRef] [PubMed]
- Lee, G.; Bae, H. Anti-inflammatory applications of melittin, a major component of bee venom: Detailed mechanism of action and adverse effects. Molecules 2016, 21, 616. [Google Scholar] [CrossRef] [PubMed]
- Lee, G.; Bae, H. Bee venom phospholipase A2: Yesterday’s enemy becomes today’s friend. Toxins 2016, 8, 48. [Google Scholar] [CrossRef]
- Hider, R.C. Honeybee venom: A rich source of pharmacologically active peptides. Endeavour 1988, 12, 60–65. [Google Scholar] [CrossRef]
- Peiren, N.; Vanrobaeys, F.; De Graaf, D.C.; Devreese, B.; Van Beeumen, J.; Jacobs, F.J. The protein composition of honeybee venom reconsidered by a proteomic approach. Biochim. Biophys. Acta Proteins Proteomics 2005, 1752, 1–5. [Google Scholar] [CrossRef]
- Matysiak, J.; Hajduk, J.; Pietrzak, Ł.; Schmelzer, C.E.H.; Kokot, Z.J. Shotgun proteome analysis of honeybee venom using targeted enrichment strategies. Toxicon 2014, 90, 255–264. [Google Scholar] [CrossRef]
- Klupczynska, A.; Pawlak, M.; Kokot, Z.J.; Matysiak, J. Application of metabolomic tools for studying low molecular-weight fraction of animal venoms and poisons. Toxins 2018, 10, 306. [Google Scholar] [CrossRef]
- Utkin, Y.N. Modern trends in animal venom research—omics and nanomaterials. World J. Biol. Chem. 2017, 8, 4. [Google Scholar] [CrossRef]
- Villar-Briones, A.; Aird, S.D. Organic and peptidyl constituents of snake venoms: The picture is vastly more complex than we imagined. Toxins 2018, 10, 392. [Google Scholar] [CrossRef] [PubMed]
- Deka, A.; Gogoi, A.; Das, D.; Purkayastha, J.; Doley, R. Proteomics of Naja kaouthia venom from North East India and assessment of Indian polyvalent antivenom by third generation antivenomics. J. Proteomics 2019, 207, 103463. [Google Scholar] [CrossRef] [PubMed]
- Matysiak, J.; Hajduk, J.; Światły, A.; Naskret, N.; Kokot, Z.J. Proteomic analysis of Apis mellifera venom determined by liquid chromatography (LC) coupled with nano-LC-MALDI-TOF/TOF MS. Acta Pol. Pharm. Drug Res. 2017, 74, 53–65. [Google Scholar]
- Tasoulis, T.; Isbister, G.K. A review and database of snake venom proteomes. Toxins 2017, 9, 290. [Google Scholar] [CrossRef] [PubMed]
- Fenton, A.W.; West, P.R.; Odell, G.V.; Hudiburg, S.M.; Ownby, C.L.; Mills, J.N.; Scroggins, B.T.; Shannon, S.B. Arthropod venom citrate inhibits phospholipase A2. Toxicon 1995, 33, 763–770. [Google Scholar] [CrossRef]
- Matysiak, J.; Schmelzer, C.E.H.; Neubert, R.H.H.; Kokot, Z.J. Characterization of honeybee venom by MALDI-TOF and nanoESI-QqTOF mass spectrometry. J. Pharm. Biomed. Anal. 2011, 54, 273–278. [Google Scholar] [CrossRef] [PubMed]
- Freitas, M.A.; Geno, P.W.; Sumner, L.W.; Cooke, M.E.; Hudiburg, S.A.; Ownby, C.L.; Kaiser, I.I.; Odell, G.V. Citrate is a major component of snake venoms. Toxicon 1992, 30, 461–464. [Google Scholar] [CrossRef]
- Schroeder, F.C.; Taggi, A.E.; Gronquist, M.; Malik, R.U.; Grant, J.B.; Eisner, T.; Meinwald, J. NMR-spectroscopic screening of spider venom reveals sulfated nucleosides as major components for the brown recluse and related species. Proc. Natl. Acad. Sci. USA 2008, 105, 14283–14287. [Google Scholar] [CrossRef]
- Kuhn-Nentwig, L.; Stöcklin, R.; Nentwig, W. Venom composition and strategies in spiders. is everything possible? In Advances in Insect Physiology; Academic Press: Cambridge, MA, USA, 2011. [Google Scholar]
- Odell, G.V.; Ferry, P.C.; Vick, L.M.; Fenton, A.W.; Decker, L.S.; Cowell, R.L.; Ownby, C.L.; Gutierrez, J.M. Citrate inhibition of snake venom proteases. Toxicon 1998, 36, 1801–1806. [Google Scholar] [CrossRef]
- Odell, G.V.; Fenton, A.W.; Ownby, C.L.; Doss, M.P.; Schmidt, J.O. The role of venom citrate. Toxicon. 1999, 37, 407–409. [Google Scholar]
- Mariano, D.O.C.; Yamaguchi, L.F.; Jared, C.; Antoniazzi, M.M.; Sciani, J.M.; Kato, M.J.; Pimenta, D.C. Pipa carvalhoi skin secretion profiling: Absence of peptides and identification of kynurenic acid as the major constitutive component. Comp. Biochem. Physiol. Part C Toxicol. Pharmacol. 2015, 167, 1–6. [Google Scholar] [CrossRef] [PubMed]
- Wishart, D.S.; Feunang, Y.D.; Marcu, A.; Guo, A.C.; Liang, K.; Vázquez-Fresno, R.; Sajed, T.; Johnson, D.; Li, C.; Karu, N.; et al. HMDB 4.0: The human metabolome database for 2018. Nucleic Acids Res. 2017, 46, D608–D617. [Google Scholar] [CrossRef] [PubMed]
- Moroni, F.; Cozzi, A.; Sili, M.; Mannaioni, G. Kynurenic acid: A metabolite with multiple actions and multiple targets in brain and periphery. J. Neural. Transm. 2012, 119, 133–139. [Google Scholar] [CrossRef] [PubMed]
- Touchard, A.; Aili, S.R.; Fox, E.G.P.; Escoubas, P.; Orivel, J.; Nicholson, G.M.; Dejean, A. The biochemical toxin arsenal from ant venoms. Toxins 2016, 8, 30. [Google Scholar] [CrossRef]


| Analyte | Concentration Level (ng/mL) | Accuracy | Precision | Method Calibration Range (ng/mL) | Linearity (r) | LOQ (ng/mL) | ||
|---|---|---|---|---|---|---|---|---|
| Intra-batch (RSD, %) | Inter-batch (RSD, %) | Intra-batch (RSD, %) | Inter-batch (RSD, %) | |||||
| Citric acid | 200 | 99.17 | 87.92 | 6.82 | 15.36 | 25–4000 | 0.9943 | 25 |
| 750 | 96.22 | 89.33 | 7.50 | 12.85 | ||||
| 1500 | 104.78 | 111.98 | 14.63 | 15.61 | ||||
| Fumaric acid | 50 | 92.80 | 107.30 | 2.96 | 10.25 | 25–2500 | 0.9947 | 25 |
| 200 | 113.50 | 101.75 | 9.23 | 3.30 | ||||
| 750 | 93.39 | 82.05 | 9.16 | 9.00 | ||||
| Glutaric acid | 50 | 91.00 | 116.50 | 11.21 | 11.95 | 10–1000 | 0.9990 | 10 |
| 200 | 87.25 | 100.50 | 2.07 | 12.93 | ||||
| 750 | 87.67 | 93.50 | 8.98 | 6.74 | ||||
| Kynurenic acid | 50 | 92.56 | 91.71 | 15.13 | 12.52 | 5–1000 | 0.9993 | 5 |
| 200 | 92.64 | 102.39 | 9.48 | 10.59 | ||||
| 750 | 88.30 | 101.07 | 4.87 | 11.59 | ||||
| Malic acid | 100 | 100.80 | 121.17 | 3.45 | 16.39 | 5–1000 | 0.9987 | 5 |
| 200 | 99.60 | 105.50 | 9.19 | 12.35 | ||||
| 750 | 94.51 | 107.20 | 7.32 | 14.82 | ||||
| Malonic acid | 50 | 86.00 | 108.00 | 4.79 | 18.76 | 5–1000 | 0.9926 | 5 |
| 200 | 88.50 | 89.50 | 0.63 | 12.59 | ||||
| 750 | 81.71 | 80.38 | 1.69 | 12.19 | ||||
| Succinic acid | 100 | 87.30 | 86.70 | 2.99 | 2.91 | 5–1000 | 0.9969 | 5 |
| 200 | 95.32 | 94.96 | 2.52 | 14.19 | ||||
| 750 | 100.35 | 93.29 | 1.95 | 8.89 | ||||
| Organic Acid | 2006 | 2017 | 2018 | ||||||
|---|---|---|---|---|---|---|---|---|---|
| AVERAGE (mg/g) | SD (mg/g) | RSD(%) | AVERAGE (mg/g) | SD (mg/g) | RSD(%) | AVERAGE (mg/g) | SD (mg/g) | RSD(%) | |
| Citric acid | 86.5333 | 8.3363 | 9.6336 | 98.2667 | 4.8881 | 4.9743 | 73.2000 | 10.5357 | 14.3930 |
| Fumaric acid | 0.0643 | 0.0222 | 34.4324 | 0.0937 | 0.0255 | 27.2133 | 0.0904 | 0.0053 | 5.8660 |
| Glutaric acid | 0.0041 | 0.0031 | 77.0317 | 0.0028 | 0.0005 | 17.1915 | 0.0023 | 0.0005 | 22.4465 |
| Kynurenic acid | 0.0025 | 0.0019 | 76.7334 | 0.0030 | 0.0022 | 70.5674 | 0.0031 | 0.0034 | 108.3253 |
| Malic acid | 0.4287 | 0.0858 | 20.0258 | 0.3246 | 0.0481 | 14.8040 | 0.3170 | 0.0295 | 9.3062 |
| Malonic acid | 0.0073 | 0.0004 | 5.5610 | 0.0067 | 0.0017 | 25.0431 | 0.0072 | 0.0009 | 13.0087 |
| Succinic acid | 0.3051 | 0.0826 | 27.0575 | 0.0726 | 0.0364 | 50.0559 | 0.2339 | 0.0468 | 20.0149 |
| Compound | Molecular Weight (Da) | Retention Time (min) | Precursor Ion (m/z) | Product Ion (m/z) | DP (V) | EP (V) | CE (V) | CXP (V) |
|---|---|---|---|---|---|---|---|---|
| Citric acid | 192.12 | 1.92 | 190.9 | 86.9 | −53 | −10 | −24 | −24 |
| Fumaric acid | 116.07 | 2.28 | 115.0 | 71.0 | −42 | −10 | −12 | −12 |
| Glutaric acid | 132.11 | 3.69 | 131.0 | 86.8 | −40 | −10 | −17 | −17 |
| Kynurenic acid | 189.17 | 7.56 | 187.9 | 144.0 | −45 | −10 | −23 | −23 |
| Malic acid | 134.09 | 1.52 | 132.9 | 115.0 | −40 | −6 | −16 | −16 |
| Malonic acid | 104.06 | 1.65 | 102.9 | 59.0 | −35 | −12 | −14 | −14 |
| Succinic acid | 118.09 | 2.17 | 117.0 | 73.0 | −45 | −9 | −18 | −18 |
| Kynurenic acid-d5* | 194.20 | 7.46 | 192.9 | 148.9 | −55 | −7 | −20 | −13 |
| Methyl-d3-malonic acid* | 121.11 | 2.82 | 119.9 | 76 | −33 | −10 | −15 | −12 |
© 2019 by the authors. Licensee MDPI, Basel, Switzerland. This article is an open access article distributed under the terms and conditions of the Creative Commons Attribution (CC BY) license (http://creativecommons.org/licenses/by/4.0/).
Share and Cite
Pawlak, M.; Klupczynska, A.; Kokot, Z.J.; Matysiak, J. Extending Metabolomic Studies of Apis mellifera Venom: LC-MS-Based Targeted Analysis of Organic Acids. Toxins 2020, 12, 14. https://doi.org/10.3390/toxins12010014
Pawlak M, Klupczynska A, Kokot ZJ, Matysiak J. Extending Metabolomic Studies of Apis mellifera Venom: LC-MS-Based Targeted Analysis of Organic Acids. Toxins. 2020; 12(1):14. https://doi.org/10.3390/toxins12010014
Chicago/Turabian StylePawlak, Magdalena, Agnieszka Klupczynska, Zenon J Kokot, and Jan Matysiak. 2020. "Extending Metabolomic Studies of Apis mellifera Venom: LC-MS-Based Targeted Analysis of Organic Acids" Toxins 12, no. 1: 14. https://doi.org/10.3390/toxins12010014
APA StylePawlak, M., Klupczynska, A., Kokot, Z. J., & Matysiak, J. (2020). Extending Metabolomic Studies of Apis mellifera Venom: LC-MS-Based Targeted Analysis of Organic Acids. Toxins, 12(1), 14. https://doi.org/10.3390/toxins12010014