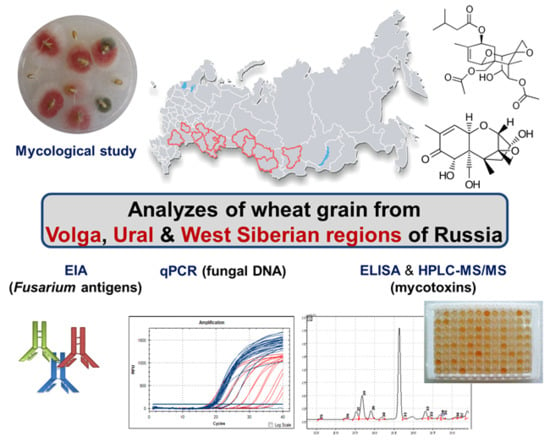
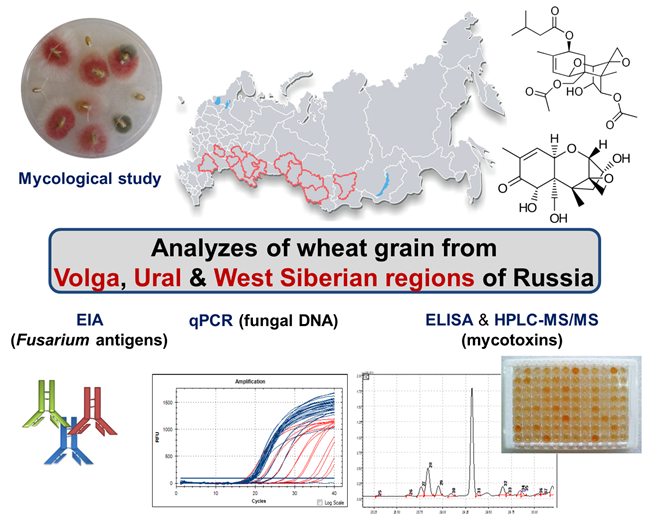
Analysis of Toxigenic Fusarium Species Associated with Wheat Grain from Three Regions of Russia: Volga, Ural, and West Siberia

 ,
,  ,
, 
Abstract
1. Introduction
2. Results
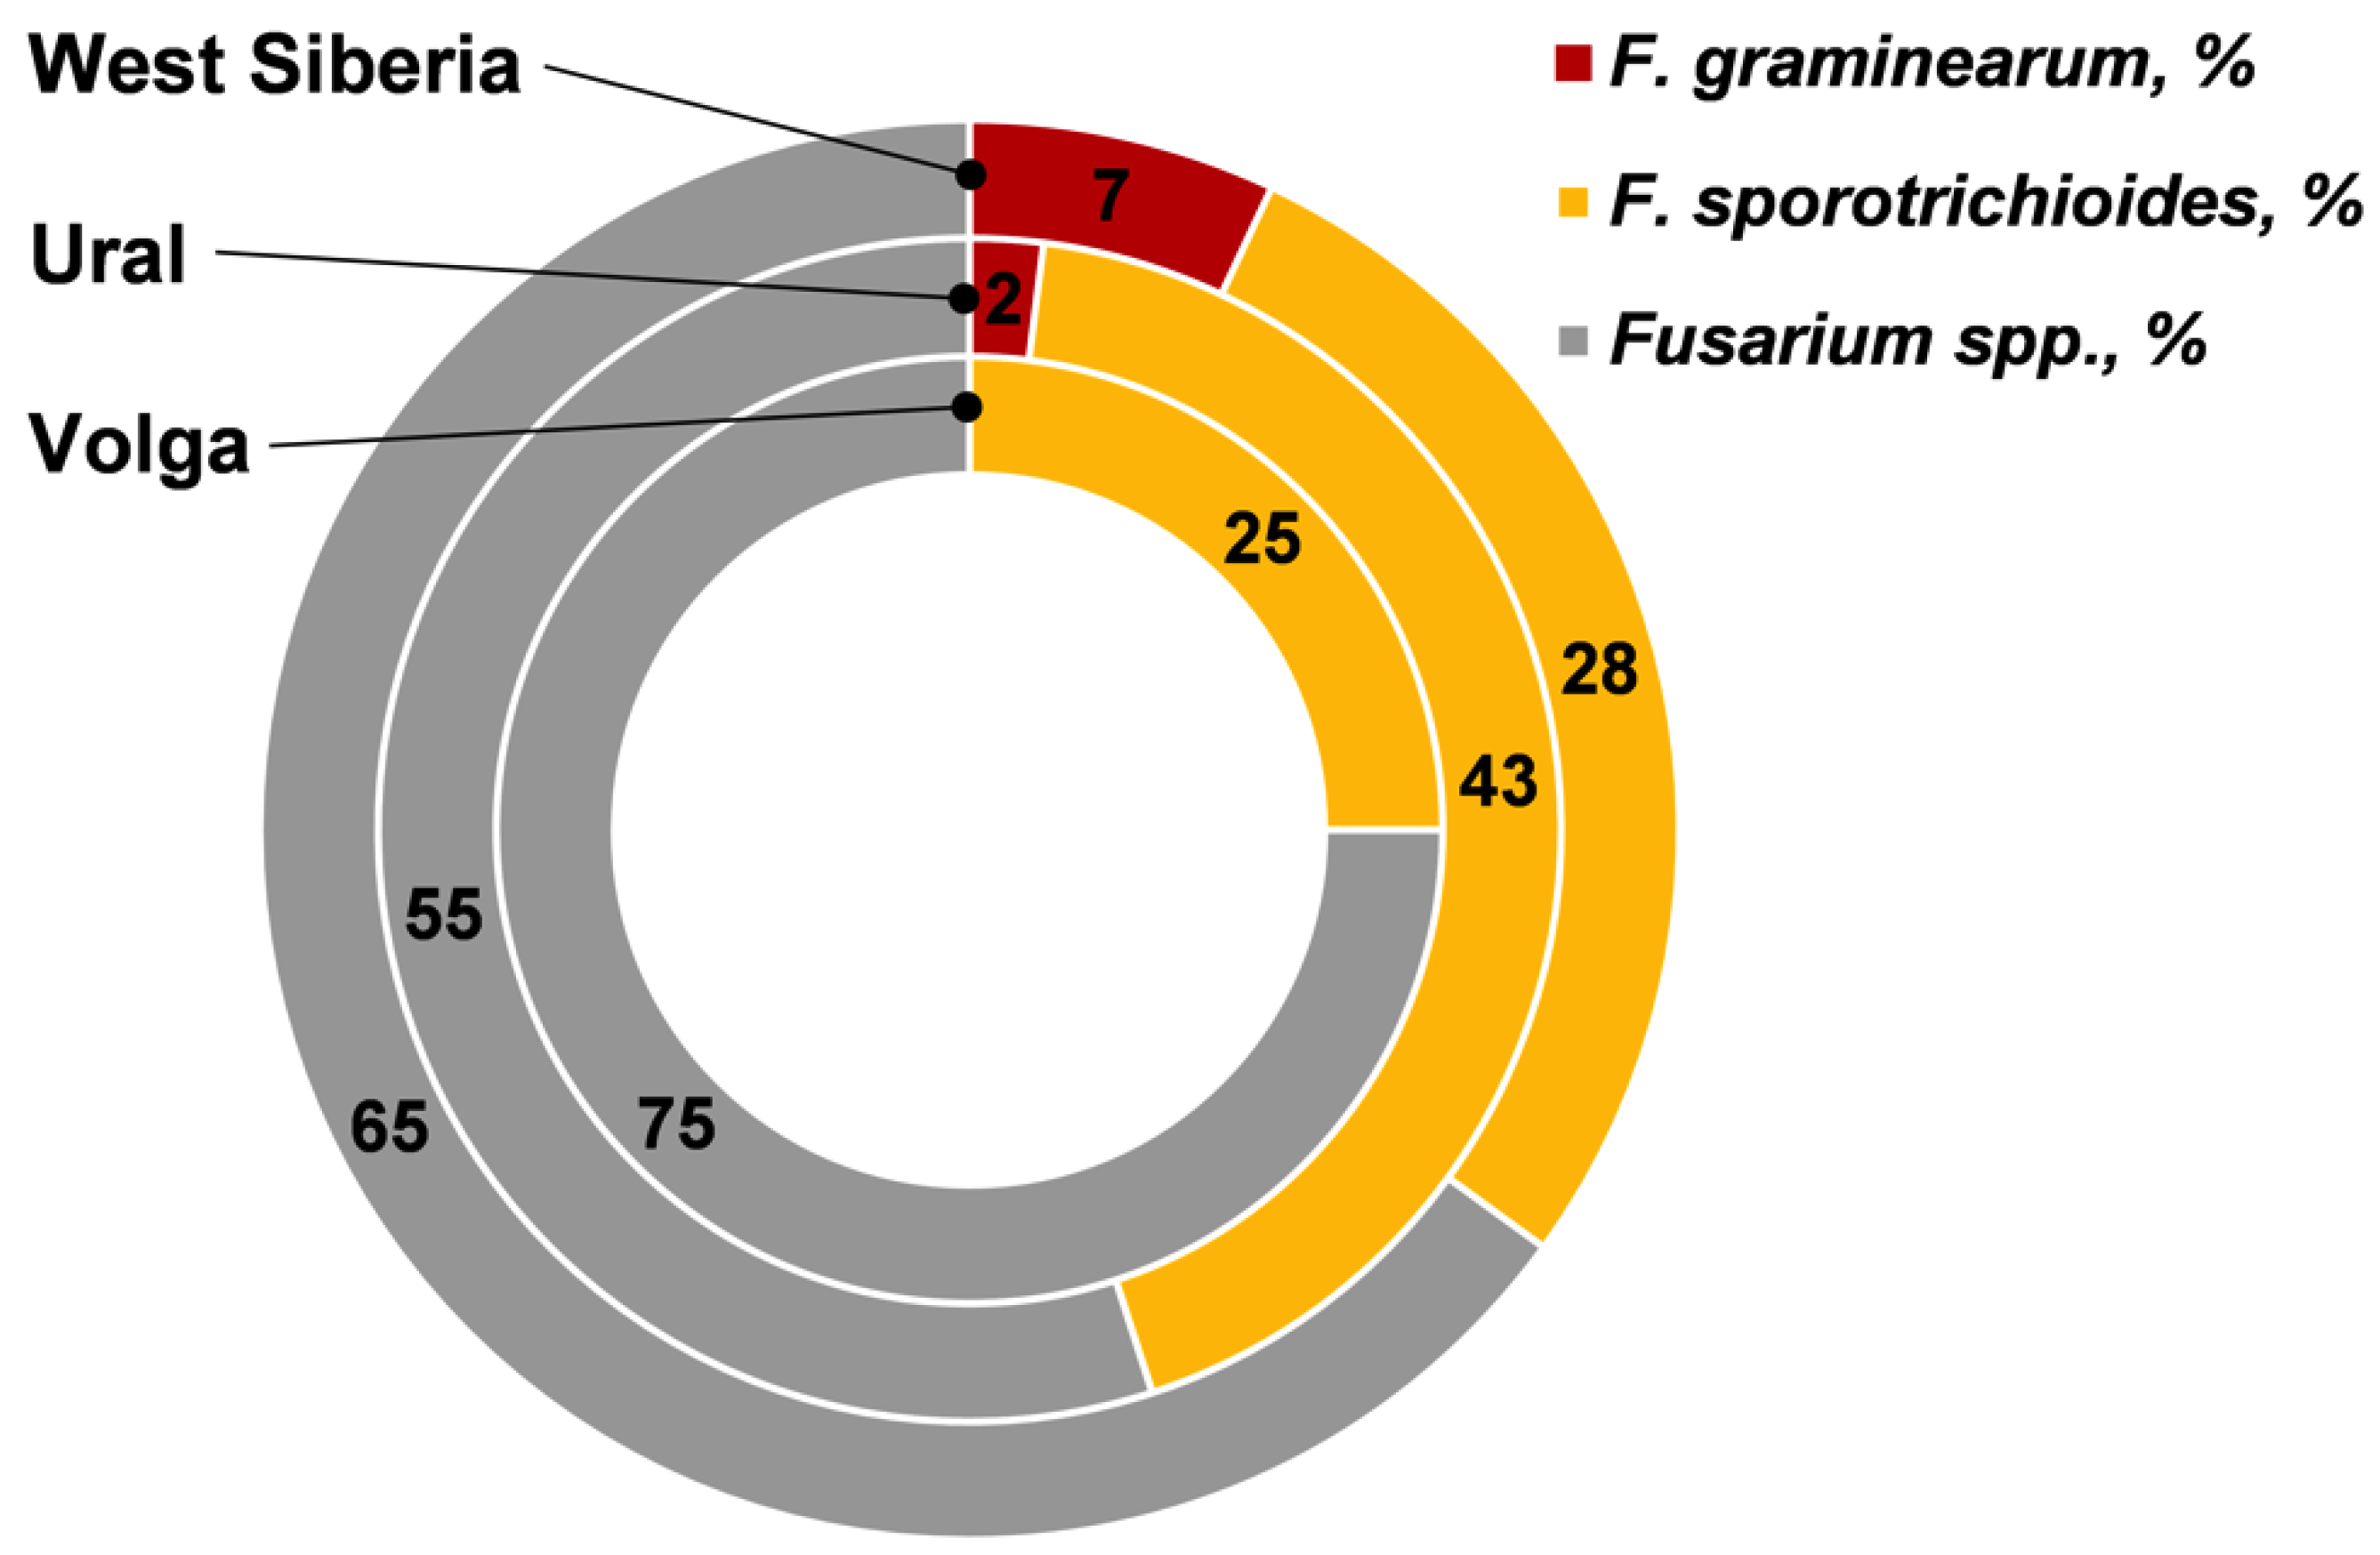
2.1. Detection of Grain Infection with Fusarium Fungi
2.2. Quantification of Fusarium Biomass
2.3. Detection of Fusarium Mycotoxins
2.4. Relationship between Fusarium Fungi Presence and Their Mycotoxins
3. Discussion
4. Conclusions
5. Materials and Methods
5.1. Wheat Grain Samples
5.2. Isolation and Morphological Characterization of Fusarium spp. in Wheat Grain
5.3. Sample Preparation for Molecular and Biochemical Analysis
5.4. DNA Extraction and Quantitative PCR
5.5. Immunoassays for Detection of Fusarium Biomass
5.6. Mycotoxin Analysis
5.7. Statistical Analysis
Supplementary Materials
Author Contributions
Funding
Acknowledgments
Conflicts of Interest
References
- Vogelgsang, S.; Sulyok, M.; Bänziger, I.; Krska, R.; Schuhmacher, R.; Forrer, H.R. Effect of fungal strain and cereal substrate on in vitro mycotoxin production by Fusarium poae and Fusarium avenaceum. Food Addit. Contam. Part A 2008, 25, 745–757. [Google Scholar] [CrossRef]
- Chandelier, A.; Nimal, C.; André, F.; Planchon, V.; Oger, R. Fusarium species and DON contamination associated with head blight in winter wheat over a 7-year period (2003–2009) in Belgium. Eur. J. Plant Pathol. 2011, 130, 403–414. [Google Scholar] [CrossRef]
- Nazari, L.; Pattori, E.; Somma, S.; Manstretta, V.; Waalwijk, C.; Moretti, A.; Meca, G.; Rossi, V. Infection incidence, kernel colonisation, and mycotoxin accumulation in durum wheat inoculated with Fusarium sporotrichioides, F. langsethiae or F. poae at different growth stages. Eur. J. Plant Pathol. 2019, 153, 715–729. [Google Scholar] [CrossRef]
- Nicolaisen, M.; Suproniene, S.; Nielsen, L.K.; Lazzaro, I.; Spliid, N.H.; Justesen, A.F. Real-time PCR for quantification of eleven individual Fusarium species in cereals. J. Microbiol. Methods 2009, 76, 234–240. [Google Scholar] [CrossRef] [PubMed]
- Boutigny, A.-L.; Gautier, A.; Basler, R.; Dauthieux, F.; Leite, S.; Valade, R.; Aguayo, J.; Ioos, R.; Laval, V. Metabarcoding targeting the EF1 alpha region to assess Fusarium diversity on cereals. PLOS ONE 2019, 14, e0207988. [Google Scholar] [CrossRef] [PubMed]
- Torp, M.; Nirenberg, H.I. Fusarium langsethiae sp. nov. on cereals in Europe. Int. J. Food Microb 2004, 95, 247–256. [Google Scholar] [CrossRef] [PubMed]
- Xu, X.; Nicholson, P. Community ecology of fungal pathogens causing wheat head blight. Annu Rev. Phytopathol. 2009, 47, 83–103. [Google Scholar] [CrossRef] [PubMed]
- Hofgaard, I.S.; Aamot, H.U.; Torp, T.; Jestoi, M.; Lattanzio, V.M.T.; Klemsdal, S.S.; Waalwijk, C.; van der Lee, T.; Brodal, G. Associations between Fusarium species and mycotoxins in oats and spring wheat from farmers’ fields in Norway over a six-year period. World Mycotoxin J. 2016, 9, 365–378. [Google Scholar] [CrossRef]
- McCormick, S.P.; Stanley, A.M.; Stover, N.A.; Alexander, N.J. Trichothecenes: From simple to complex mycotoxins. Toxins 2011, 3, 802–814. [Google Scholar] [CrossRef]
- Wolf, J.C.; Mirocha, C.J. Regulation of sexual reproduction in Gibberella zeae (Fusarium roseum ‘Graminearum’) by F-2 (zearalenone). Can. J. Microbiol. 1973, 19, 725–734. [Google Scholar] [CrossRef]
- Moretti, A.; Pascale, M.; Logrieco, A.F. Mycotoxin risks under a climate change scenario in Europe. Trends Food Sci. Technol. 2019, 84, 38–40. [Google Scholar] [CrossRef]
- Technical regulations of the Eurasian Economic (Customs) Union #021/2011 «About food safety». Available online: http://www.tsouz.ru/db/techreglam/Documents/TR%20TS%20PishevayaProd.pdf (accessed on 18 March 2019).
- Yli-Mattila, T.; Paavanen-Huhtala, S.; Parikka, P.; Hietaniemi, V.; Jestoi, M.; Gagkaeva, T.; Sarlin, T.; Haikara, A.; Laaksonen, S.; Rizzo, A. Real-time PCR detection and quantification of Fusarium poae, F. graminearum, F. sporotrichioides and F. langsethiae as compared to mycotoxin production in grains in Finland and Russia. Arch. Phytopath Plant. Protect. 2008, 41, 243–260. [Google Scholar] [CrossRef]
- Gagkaeva, T.Yu.; Orina, A.S.; Gavrilova, O.P.; Ablova, I.B.; Bespalova, L.A. Characterization of resistance of winter wheat varieties to Fusarium head blight. Vavilov J. Genet. Breed. 2018, 22, 685–692. [Google Scholar] [CrossRef]
- Nicholson, P.; Chandler, E.; Draeger, R.C.; Gosman, N.E.; Simpson, D.R.; Thomsett, M.; Wilson, A.H. Molecular tools to study epidemiology and toxicology of Fusarium head blight of cereals. Eur. J. Plant. Pathol. 2003, 109, 691–703. [Google Scholar] [CrossRef]
- Waalwijk, C.; van der Heide, R.; de Vries, I.; van der Lee, T.; Schoen, C.; Corainville, G.-C.; Hauser-Hahn, I.; Kastelein, P.; Kohl, J.; Lonnet, P.; et al. Quantitative detection of Fusarium species in wheat using TaqMan. Eur. J. Plant. Pathol. 2004, 110, 481–494. [Google Scholar] [CrossRef]
- Fredlund, E.; Gidlund, A.; Olsen, M.; Börjesson, T.; Spliid, N.H.; Simonsson, M. Method evaluation of Fusarium DNA extraction from mycelia and wheat for down-stream real-time PCR quantification and correlation to mycotoxin levels. J. Microbiol. Methods 2008, 73, 33–40. [Google Scholar] [CrossRef] [PubMed]
- Kwak, B.-Y.; Kwon, B.-J.; Kweon, C.-H.; Shon, D.-H. Detection of Fusarium species by enzyme-linked immunosorbent assay using monoclonal antibody. J. Microbiol. Biotechnol. 2003, 13, 794–799. [Google Scholar]
- Kwak, B.-Y.; Kwon, B.-J.; Kweon, C.-H.; Shon, D.-H. Detection of Aspergillus, Penicillium, and Fusarium species by sandwich enzyme-linked immunosorbent assay using mixed monoclonal antibodies. J. Microbiol. Biotechnol. 2004, 14, 385–389. [Google Scholar]
- Gannibal, Ph.B.; Grachev, A.V.; Kozhevnikov, E.A.; Lebedin, Yu.S. Immunoassay analysis of seeds contamination by fungi from the genus Alternaria. Mikologiya I Fitopatologiya 2010, 44, 463–471. (In Russian) [Google Scholar]
- Omori, A.M.; Ono, E.Y.S.; Hirozawa, M.T.; de Souza Suguiura, I.M.; Hirooka, E.Y.; Pelegrinelli Fungaro, M.H.; Ono, M.A. Development of indirect competitive enzyme-linked immunosorbent assay to detect Fusarium verticillioides in poultry feed samples. Toxins 2019, 11, 48. [Google Scholar] [CrossRef] [PubMed]
- Prieto-Simón, B.; Noguer, T.; Campàs, M. Emerging biotools for assessment of mycotoxins in the past decade. Trends Anal. Chem. 2007, 26, 689–702. [Google Scholar] [CrossRef]
- Goryacheva, I.Y.; De Saeger, S.; Eremin, S.A.; Van Peteghem, C. Immunochemical methods for rapid mycotoxin detection: Evolution from single to multiple analyte screening: A review. Food Addit. Contam. Part A Chem. Anal. Control. Expo. Risk Assess. 2007, 24, 1169–1183. [Google Scholar] [CrossRef]
- Krska, R.; Schubert-Ullrich, P.; Molinelli, A.; Sulyok, M.; MacDonald, S.; Crews, C. Mycotoxin analysis: An update. Food Addit. Contam. Part A Chem. Anal. Control. Expo. Risk Assess. 2008, 25, 152–163. [Google Scholar] [CrossRef] [PubMed]
- Maragos, C.M.; Busman, M. Rapid and advanced tools for mycotoxin analysis: A review. Food Addit. Contam. Part A Chem Anal. Control. Expo. Risk Assess. 2010, 27, 688–700. [Google Scholar] [CrossRef]
- Turner, N.W.; Bramhmbhatt, H.; Szabo-Vezse, M.; Poma, A.; Coker, R.; Piletsky, S.A. Analytical methods for determination of mycotoxins: An update (2009–2014). Anal. Chim Acta 2015, 901, 12–33. [Google Scholar] [CrossRef] [PubMed]
- Berthiller, F.; Cramer, B.; Iha, M.H.; Krska, R.; Lattanzio, V.M.T.; MacDonald, S.; Malone, R.J.; Maragos, C.; Solfrizzo, M.; Stranska-Zachariasova, M.; et al. Developments in mycotoxin analysis: An update for 2016–2017. World Mycotoxin J. 2018, 11, 5–32. [Google Scholar] [CrossRef]
- Yli-Mattila, T.; Gagkaeva, T.; Ward, T.J.; Aoki, T.; Kistler, H.C.; O’Donnell, K. A novel Asian clade within the Fusarium graminearum species complex includes a newly discovered cereal head blight pathogen from the Far East of Russia. Mycologia 2009, 101, 841–852. [Google Scholar] [CrossRef] [PubMed]
- Yli-Mattila, T.; Gagkaeva, T. Molecular chemotyping of Fusarium graminearum, F. culmorum, and F. cerealis isolates from Finland and Russia. In Molecular Identification of Fungi; Gherbawy, Y., Voigt, K., Eds.; Springer: Berlin, Germany, 2010; pp. 159–177. [Google Scholar]
- Ivashchenko, V.G.; Shipilova, N.P.; Levitin, M.M. Species composition of Fusarium fungi on cereals in the Asian part of Russia. Mikologiya I Fitopatologiya 2000, 34, 54–68. [Google Scholar]
- Gagkaeva, T.Y.; Yli-Mattila, T. Genetic diversity of Fusarium graminearum in Europe and Asia. Eur. J. Plant. Pathol. 2004, 110, 551–562. [Google Scholar] [CrossRef]
- Litovka, Yu.A. The species composition and representation of Fusarium fungi on cereals (wheat and barley) grown in the conditions of Central Siberia. Bull. Krasnoyarsk State Agrar. Univ. 2017, 6, 140–149. (In Russian) [Google Scholar]
- Paterson, R.R.; Lima, N. How will climate change affect mycotoxins in food? Food Res. Int 2010, 43, 1902–1914. [Google Scholar] [CrossRef]
- Parry, D.W.; Jenkinson, P.; McLeod, L. Fusarium ear blight (scab) in small grain cereals—A review. Plant. Pathol. 1995, 44, 207–238. [Google Scholar] [CrossRef]
- Kelly, A.C.; Clear, R.M.; O’Donnell, K.; McCormick, S.; Turkington, T.K.; Tekauz, A.; Gilbert, J.; Kistler, H.C.; Busman, M.; Ward, T.J. Diversity of Fusarium head blight populations and trichothecene toxin types reveals regional differences in pathogen composition and temporal dynamics. Fungal Genet. Biol. 2015, 82, 22–31. [Google Scholar] [CrossRef] [PubMed]
- Sarkisov, A.Ch. Overwintered Cereals Under the Snow; Ministry of Agriculture: Moscow, Russian, 1948; p. 108. [Google Scholar]
- Kononenko, G.P.; Burkin, A.A. Fusariotoxins in cereal feeds. Vet. Pathol. 2002, 2, 128–132. [Google Scholar]
- Kononenko, G.P.; Burkin, A.A.; Zotova, E.V.; Ustyuzhanina, M.I.; Smirnov, A.M. Specificity of wheat and barley contamination of grain with fusariotoxins. Russ. Agric. Sci. 2018, 1, 17–21. [Google Scholar]
- Fredlund, E.; Gidlund, A.; Pettersson, H.; Olsen, M.; Börjesson, T. Real-time PCR detection of Fusarium species in Swedish oats and correlation to T-2 and HT-2 toxin content. World Mycotoxin J. 2010, 3, 77–88. [Google Scholar] [CrossRef]
- Yli-Mattila, T.; Ward, T.J.; O’Donnell, K.; Proctor, R.H.; Burkin, A.A.; Kononenko, G.P.; Gavrilova, O.P.; Aoki, T.; McCormick, S.P.; Gagkaeva, T.Yu. Fusarium sibiricum sp. nov, a novel type A trichothecene-producing Fusarium from northern Asia closely related to F. sporotrichioides and F. langsethiae. Int. J. Food Microbiol. 2011, 147, 58–68. [Google Scholar] [CrossRef]
- Yli-Mattila, T.; Gavrilova, O.; Hussien, T.; Gagkaeva, T. Identification of the first Fusarium sibiricum isolate in Iran and Fusarium langsethiae isolate in Siberia by morphology and species-specific primers. J. Plant. Pathol. 2015, 97, 183–187. [Google Scholar]
- Pinson-Gadais, L.; Barreau, Ch.; Chaurand, M.; Gregoire, S.; Monmarson, M.; Richard-Forget, F. Distribution of toxigenic Fusarium spp. and mycotoxin production in milling fractions of durum wheat. Food Addit. Contam. Part A Chem. Anal. Control. Expo. Risk Assess. 2007, 24, 53–62. [Google Scholar] [CrossRef] [PubMed][Green Version]
- Horevaj, P.; Milus, E.A.; Bluhm, B.H. A real-time qPCR assay to quantify Fusarium graminearum biomass in wheat kernels. J. Appl. Microbiol. 2011, 111, 396–406. [Google Scholar] [CrossRef] [PubMed]
- Strub, C.; Pocaznoi, D.; Lebrihi, A.; Fournier, R.; Mathieu, F. Influence of barley malting operating parameters on T-2 and HT-2 toxinogenesis of Fusarium langsethiae, a worrying contaminant of malting barley in Europe. Food Addit. Contam. A 2010, 27, 1247–1252. [Google Scholar] [CrossRef]
- Medina, A.; Magan, N. Temperature and water activity effects on production of T-2 and HT-2 by Fusarium langsethiae strains from north European countries. Food Microbiol. 2011, 28, 392–398. [Google Scholar] [CrossRef]
- Kokkonen, M.; Medina, A.; Magan, N. Comparative study of water and temperature relations of growth and T-2/HT-2 toxin production by strains of Fusarium sporotrichioides and Fusarium langsethiae. World Mycotoxin J. 2012, 5, 365–372. [Google Scholar] [CrossRef]
- Gavrilova, O.P.; Skritnika, A.; Gagkaeva, T.Yu. Identification and characterization of spontaneous auxotrophic mutants in Fusarium langsethiae. Microorganisms 2017, 5, 14. [Google Scholar] [CrossRef] [PubMed]
- Shi, W.; Tan, Y.; Wang, S.; Gardiner, D.M.; De Saeger, S.; Liao, Y.; Wang, C.; Fan, Y.; Wang, Z.; Wu, A. Mycotoxigenic potentials of Fusarium species in various culture matrices revealed by mycotoxin profiling. Toxins 2017, 9, 6. [Google Scholar] [CrossRef]
- Gerlach, W.; Nirenberg, H.I. The genus Fusarium—A Pictorial Atlas. In Mitteilungen aus der Biologischen Bundesanstalt fur Land- und Forstwirtschaft, Berlin-Dahlem; Herausgegeben von der Biologischen Bundesanstalt für Land- und Forstwirtschaft: Germany, 1982. [Google Scholar]
- White, T.; Bruns, T.; Lee, S.; Taylor, J. Amplification and direct sequencing of fungal ribosomal RNA genes for phylogenetics. In PCR Protocols: A Guide to Methods and Applications; Innis, M., Gelfand, D., Sninsky, J., White, T., Eds.; Academic Press: Orlando, FL, USA, 1990; Volume 38, pp. 315–322. [Google Scholar]
- Malachová, A.; Sulyok, M.; Beltrán, E.; Berthiller, F.; Krska, R. Optimization and validation of a quantitative liquid chromatography–tandem mass spectrometric method covering 295 bacterial and fungal metabolites including all regulated mycotoxins in four model food matrices. J. Chromatogr. A 2014, 1362, 145–156. [Google Scholar] [CrossRef] [PubMed]
- Hammer, Ø.; Harper, D.A.T.; Ryan, P.D. PAST: Paleontological statistics software package for education and data analysis. Palaeontol. Electron. 2001, 4, 178kb. [Google Scholar]


| Parameters | Origin of Wheat Grain (the Region and Numbers of Samples) | |||
|---|---|---|---|---|
| Volga (n = 18) | Ural (n = 13) | West Siberia (n = 26) | ||
| Samples infected by Fusarium fungi, % | 72.2 | 69.2 | 96.1 | |
| FDG on average/median (range), % | 3.3/1.5 a (0–12) | 5.2/2.0 a (0–30) | 11.3/7.0 b (0–38) | |
| The incidence of F. graminearum on average/median (range), % | 0 a | 0.1/0 ab (0–1) | 0.8/0 b (0–10) | |
| The incidence of F. sporotrichioides on average/median (range), % | 0.8/0 a (0–6) | 2.2/ 1.0 ab (0–9) | 3.1/2.5 b (0–15) | |
| The amount of Fusarium DNA×10−4 on average/median (range), pg/ng | F. graminearum | 0 a | 55/0 b (0–593) | 1483/0 c (0–1318) |
| F. sporotrichioides | 1141/207 a (0–4458) | 1192/1292 ab (0–3793) | 2151/1445 b (167–6740) | |
| The amount of Fusarium antigens on average/median (range), U/mL | 23.9/13.7 a (2–117) | 25.6/18.0 a (1–95) | 197.7/39.0 b (8–1820) | |
| Method | Mycotoxins | Amount of Mycotoxins on Average/Median (Range), ppb | ||
|---|---|---|---|---|
| Volga (n = 18) | Ural (n = 13) | West Siberia (n = 26) | ||
| ELISA | DON | 5.5/0 a (0–100) | 11.5/0 a (0–150) | 224.3/0 a (0–2787) |
| ZEN | 0 a | 0 a | 2.6/0 a (0–21) | |
| T-2 toxin | 3.4/0 a (0–40) | 5.7/0 a (0–74) | 0.9/0 a (0–22) | |
| HPLC-MS/MS | DON | 5.3/0 a (0–74) | 36.1/0 ab (0–415) | 283.1/0 b (0–2239) |
| ZEN | 0 a | 0 a | 8.5/0 a (0–106) | |
| T-2 toxin | 3.4/0 a (0–29) | 7.2/0 a (0–66) | 2.5/0 a (0–17) | |
| HT-2 toxin | 25.9/0 a (0–170) | 36.2/15.4 a (0–152) | 31.0/11.5 a (0–92) | |
| Estimated Parameters | Infected Grain Measured by Mycological Method | Amount of DNA of Fusarium Fungi Measured by qPCR | Amount of Antigens of Fusarium Fungi Measured by EIA | Amount of Mycotoxins of Fusarium Fungi Measured by | ||||||||
|---|---|---|---|---|---|---|---|---|---|---|---|---|
| F. gram.1 | F. spor. | FDG | ELISA | HPLC-MS/MS | ||||||||
| F. gram. | F. spor. | DON | T-2 | DON | T-2 | |||||||
| Infected grain measured by mycological method | F. gram. | 1.0 | ||||||||||
| F. spor. | 0.24 | |||||||||||
| FDG | 0.43 * | 0.70 * | ||||||||||
| Amount of fungal DNA measured by qPCR | F. gram. | 0.42 * | −0.07 | 0.10 | ||||||||
| F. spor. | 0.30 | 0.43 * | 0.38 * | 0.54 * | ||||||||
| Amount of antigens of Fusarium fungi measured by EIA | 0.38 * | −0.08 | 0.13 | 0.98 * | 0.56 * | |||||||
| Amount of mycotoxins of Fusarium measured by | ELISA | DON | 0.30 | −0.15 | 0.07 | 0.94 * | 0.53 * | 0.97 * | ||||
| T-2 toxin | −0.06 | −0.05 | −0.04 | 0.10 | 0.22 | 0.12 | 0.15 | |||||
| HPLC-MS/MS | DON | 0.45 * | −0.04 | 0.13 | 0.99 * | 0.55 * | 0.96 * | 0.93 * | 0.09 | |||
| T-2 toxin | 0.12 | 0.14 | 0.10 | 0.06 | 0.33 | 0.06 | 0.03 | 0.03 | 0.07 | |||
| НТ-2 toxin | 0.11 | 0.24 | 0.13 | 0.06 | 0.57 * | 0.07 | 0.03 | 0.03 | 0.07 | 0.78 * | ||
| Region (Numbers of Samples) | Month | Average Month Temperature, °C | Average Humidity, % | Average Rainfall, mm | ||
|---|---|---|---|---|---|---|
| Mean | Min | Max | ||||
| Volga (n = 18) | June | 20.3 | 10.4 | 30.1 | 56 | 34.0 |
| July | 21.0 | 12.4 | 29.4 | 58 | 28.9 | |
| August | 21.5 | 11.9 | 31.6 | 56 | 7.3 | |
| Ural (n = 13) | June | 18.4 | 8.5 | 27.6 | 63 | 55.0 |
| July | 17.3 | 8.8 | 25.6 | 71 | 48.5 | |
| August | 18.0 | 8.7 | 28.1 | 71 | 26.8 | |
| West Siberia (n = 26) | June | 18.6 | 9.1 | 28.0 | 60 | 32.9 |
| July | 19.6 | 11.8 | 28.0 | 71 | 45.6 | |
| August | 17.5 | 8.8 | 26.5 | 70 | 34.5 | |
© 2019 by the authors. Licensee MDPI, Basel, Switzerland. This article is an open access article distributed under the terms and conditions of the Creative Commons Attribution (CC BY) license (http://creativecommons.org/licenses/by/4.0/).
Share and Cite
Gagkaeva, T.; Gavrilova, O.; Orina, A.; Lebedin, Y.; Shanin, I.; Petukhov, P.; Eremin, S. Analysis of Toxigenic Fusarium Species Associated with Wheat Grain from Three Regions of Russia: Volga, Ural, and West Siberia. Toxins 2019, 11, 252. https://doi.org/10.3390/toxins11050252
Gagkaeva T, Gavrilova O, Orina A, Lebedin Y, Shanin I, Petukhov P, Eremin S. Analysis of Toxigenic Fusarium Species Associated with Wheat Grain from Three Regions of Russia: Volga, Ural, and West Siberia. Toxins. 2019; 11(5):252. https://doi.org/10.3390/toxins11050252
Chicago/Turabian StyleGagkaeva, Tatiana, Olga Gavrilova, Aleksandra Orina, Yuri Lebedin, Ilya Shanin, Pavel Petukhov, and Sergei Eremin. 2019. "Analysis of Toxigenic Fusarium Species Associated with Wheat Grain from Three Regions of Russia: Volga, Ural, and West Siberia" Toxins 11, no. 5: 252. https://doi.org/10.3390/toxins11050252
APA StyleGagkaeva, T., Gavrilova, O., Orina, A., Lebedin, Y., Shanin, I., Petukhov, P., & Eremin, S. (2019). Analysis of Toxigenic Fusarium Species Associated with Wheat Grain from Three Regions of Russia: Volga, Ural, and West Siberia. Toxins, 11(5), 252. https://doi.org/10.3390/toxins11050252