Total Dietary Intake and Health Risks Associated with Exposure to Aflatoxin B1, Ochratoxin A and Fuminisins of Children in Lao Cai Province, Vietnam

 ,
,
Abstract
:1. Introduction
2. Results and Discussion
2.1. Food and Nutrient Intake
2.2. Mycotoxins in Food Samples
2.3. Growth Indicators and Their Correlates
2.4. Risk Assessment for Mycotoxin Exposure
2.4.1. Aflatoxin B1
2.4.2. Ochratoxin A
2.4.3. Fumonisins
2.4.4. Aged Adjusted MOEs of the Mycotoxins
2.4.5. Combined Exposure to All Three Mycotoxins
3. Conclusions
4. Materials and Methods
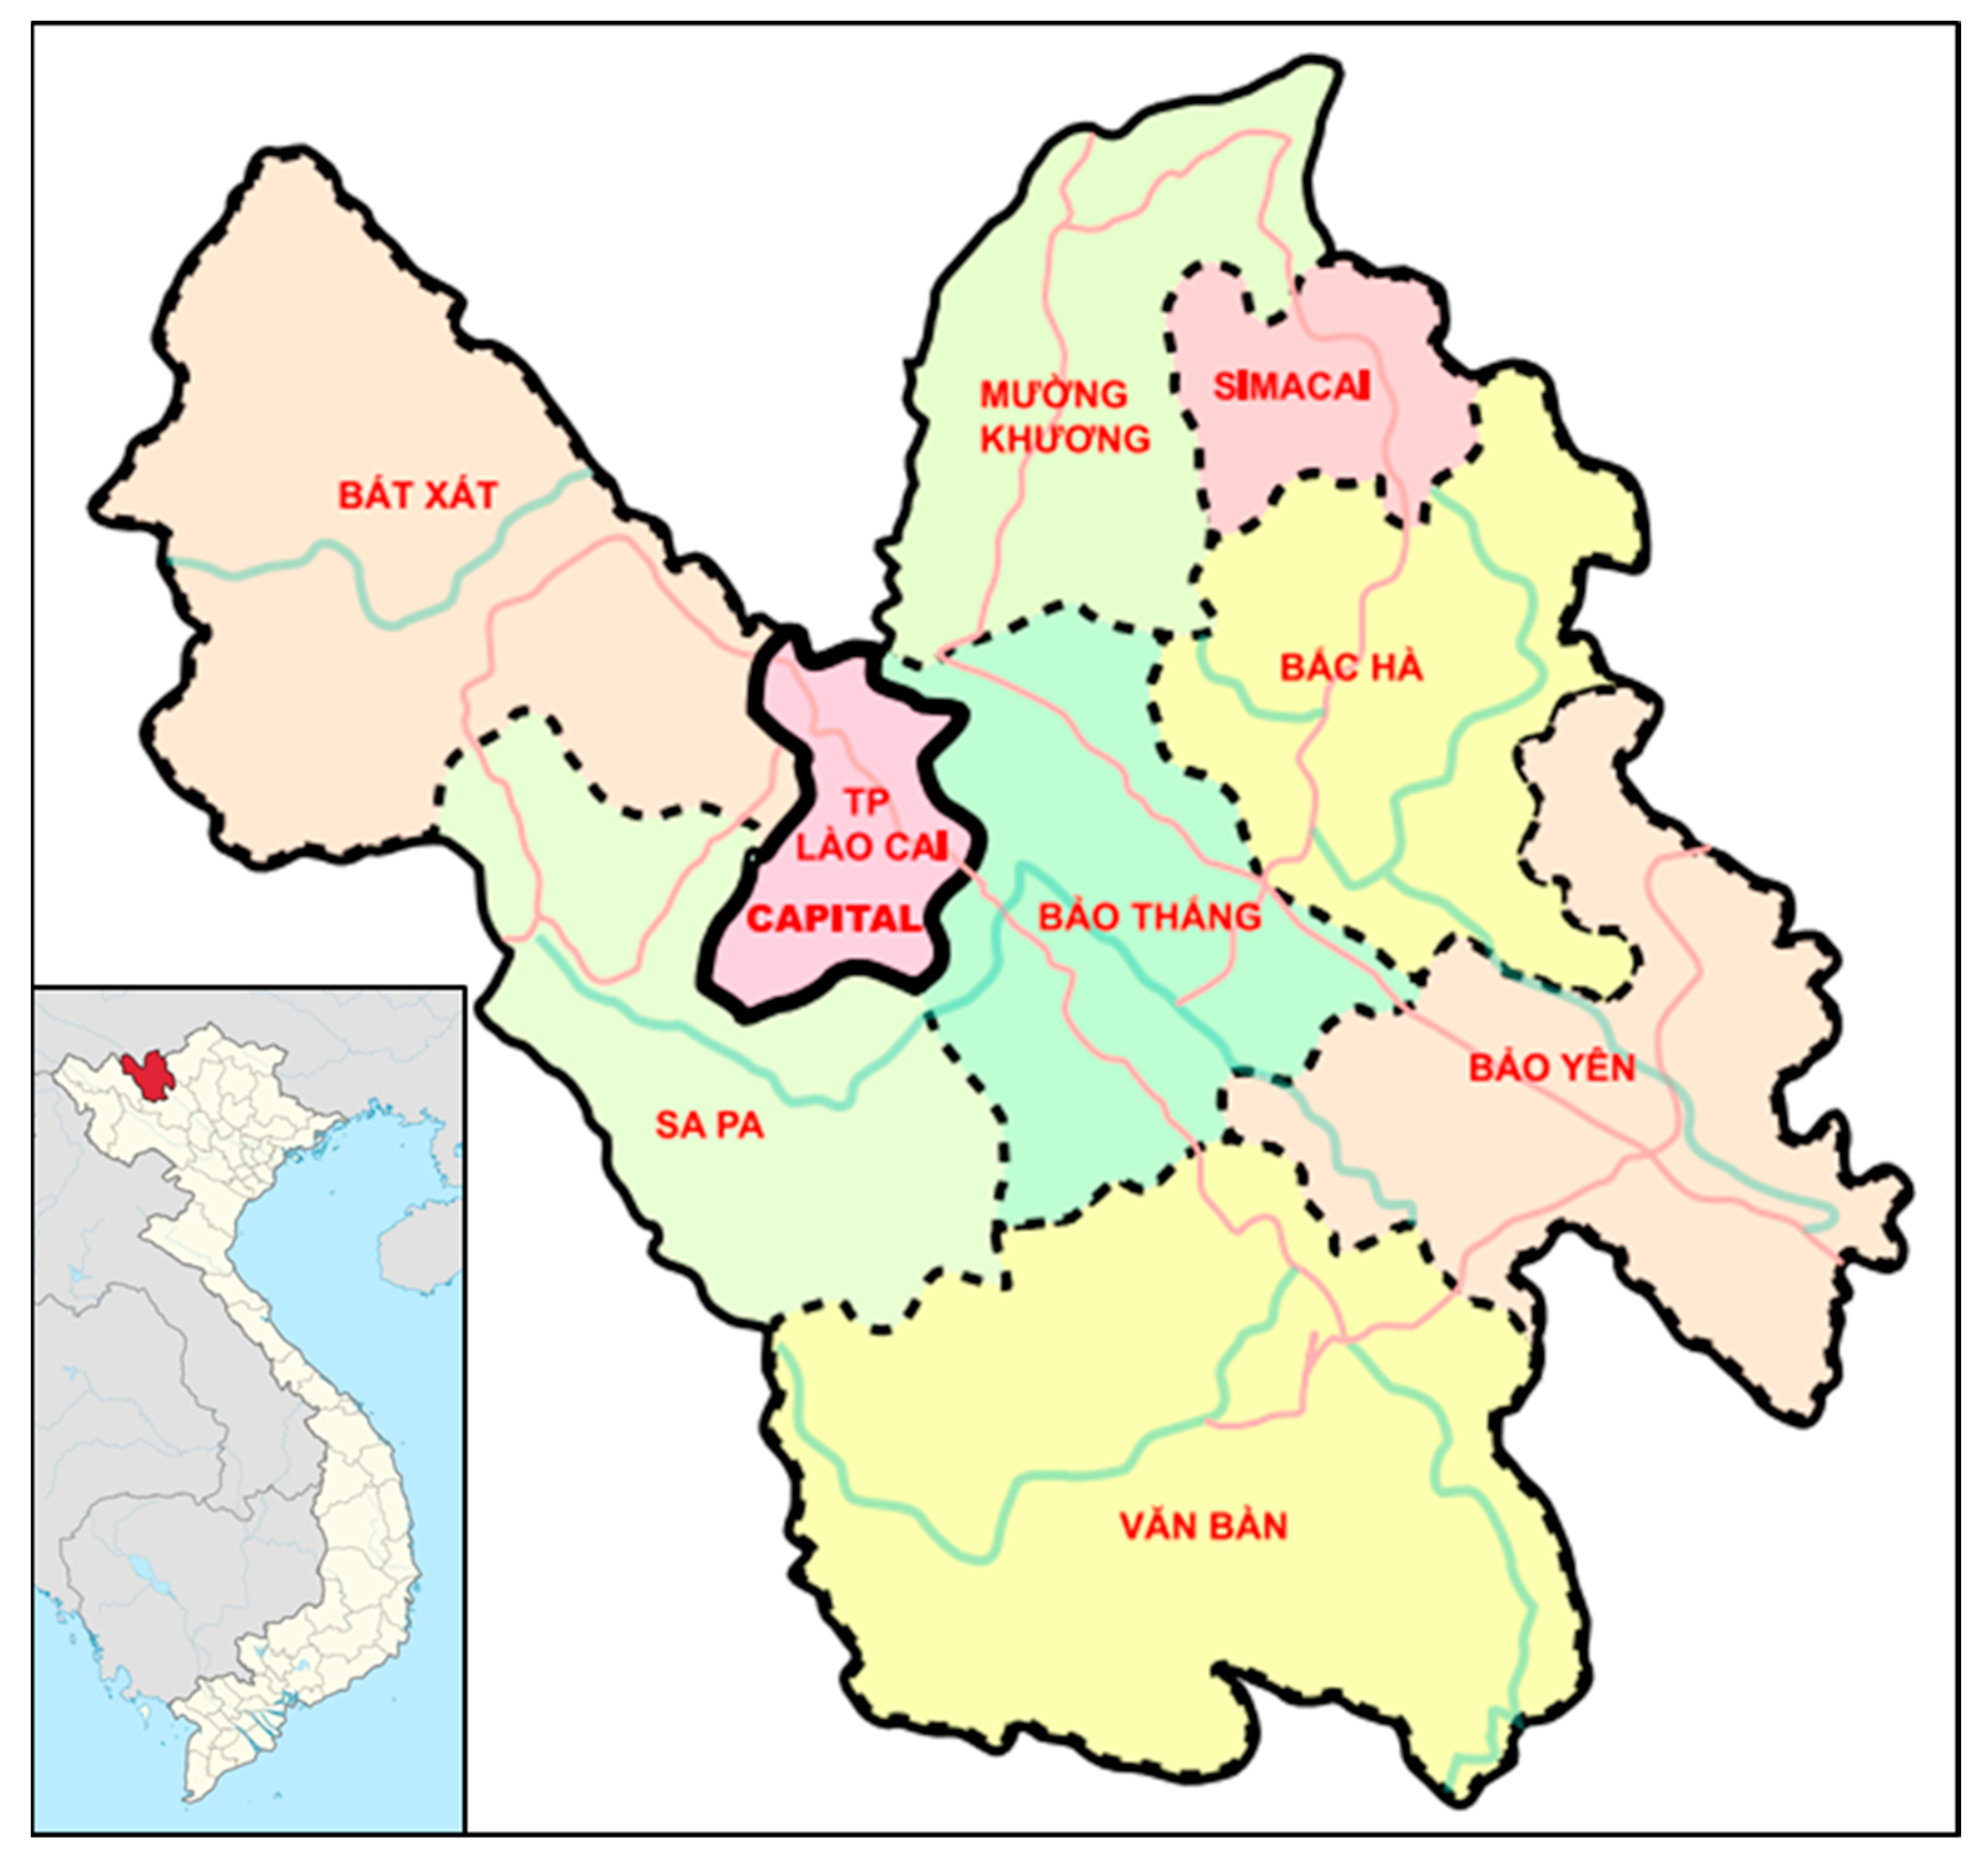
4.1. Study Area
4.2. Anthropometric Measurement
4.3. Daily Food Intake Surveillance
4.4. Mycotoxins Exposure Risk Assessment
4.4.1. Food Sample Collection and Analysis
4.4.2. Mycotoxin Contamination Analysis
4.4.3. Mycotoxins Exposure
4.4.4. Risk Characterization
4.5. Data Analysis
4.6. Ethical clearance
Author Contributions
Funding
Acknowledgments
Conflicts of Interest
References
- Boon, P.E.; Bakker, M.I.; Van Klaveren, J.D.; Van Rossum, C.T.M. RIVM Report 350070002/2009: Risk Assessment of the Dietary Exposure to Contaminants and Pesticide Residues in Young Children in the Netherlands; RIVM National Institute for Public Health and the Environment: Bilthoven, The Netherlands, 2009. [Google Scholar]
- World Health Organization (WHO). Food Safety. Fact Sheet N 399; World Health Organization: Geneva, Switzerland, 2015. [Google Scholar]
- Wu, F.; Groopman, J.D.; Pestka, J.J. Public health impacts of foodborne mycotoxins. Annu. Rev. Food Sci. Technol. 2014, 5, 351–372. [Google Scholar] [CrossRef] [PubMed]
- International Agency for Research on Cancer (IARC). Aflatoxins: B1, B2, G1, G2, M1. In Some Naturally Occurring Substances: Food Items and Constituents, Heterocyclic Aromatic Amines and Mycotoxins, Aflatoxins; IARC: Lyon, France, 1993; Volume 56, pp. 245–396. [Google Scholar]
- International Agency for Research on Cancer (IARC). Aflatoxins. In Some Traditional Herbal Medicines, Some Mycotoxins, Naphthalene and Styrene; IARC: Lyon, France, 2002; Volume 82, pp. 301–366. [Google Scholar]
- EFSA. Opinion of the Scientific Panel on Contaminants in the Food Chain on a request from the Commission related to the potential increase of consumer health risk by a possible increase of the existing maximum levels for aflatoxin in almonds, hazenuts, and pistachios and derived products. EFSA J. 2007, 446, 1–127. [Google Scholar]
- International Agency for Research on Cancer (IARC). Toxins derived from Fusarium moniliforme: Fumonisins B1 and B2 and fusarin. In Some Naturally Occurring Substances: Food Items and Constituents, Heterocyclic Aromatic Amines and Mycotoxins; IARC: Lyon, France, 1993; Volume 56, pp. 445–466. [Google Scholar]
- Mally, A. Ochratoxin A and mitotic disruption: Mode of action analysis of renal tumor formation by ochratoxin A. Toxicol. Sci. 2012, 127, 315–330. [Google Scholar] [CrossRef] [PubMed]
- Mantle, P.G.; Nagy, J.M. Binding of ochratoxin A to a urinary globulin: A new concept to account for gender difference in rat nephrocarcinogenic responses. Int. J. Mol. Sci. 2008, 9, 719–735. [Google Scholar] [CrossRef] [PubMed]
- Heussner, A.H.; Lewis, E.H.B. Comparative ochratoxin toxicity: A review of the available data. Toxins 2015, 7, 4253–4282. [Google Scholar] [CrossRef]
- International Agency for Research on Cancer (IARC). Ochratoxin A. In Some Naturally Occurring Substances: Food Items and Constituents, Heterocyclic Aromatic Amines and Mycotoxins, Ochratoxin; IARC: Lyon, France, 1993; Volume 56, pp. 489–521. [Google Scholar]
- World Health Organization (WHO). Safety Evaluation of Certain Food Additives and Contaminants: Aflatoxins; WHO Food Additives Series 40; WHO: Geneva, Switzerland, 1998; pp. 359–468. [Google Scholar]
- Lia, X.; Wiesen, E.; Diorditsab, S.; Todac, K.; Duong, H.; Nguyen, L.H.; Nguyen, V.C.; Nguyen, T.H. Impact of adverse events following immunization in Viet Nam in 2013 on chronic hepatitis B infection. Vaccine 2016, 34, 869–873. [Google Scholar] [CrossRef]
- World Health Organization Western Pacific Representative Office (WHOWPRO). Frequently Asked Questions: Hepatitis B and Hepatitis B Vaccine. Last updated: 09 August 2013. Available online: http://www.wpro.who.int/vietnam/topics/hepatitis/faqhepatitis/en/ (accessed on 28 July 2019).
- UNICEF. Unicef Annual Report; UNICEF: Hanoi, Vietnam, 2014. [Google Scholar]
- National Institute of Nutrition (NIN). National Surveillance on Nutrition, 2009; National Institute of Nutrition, Medical Publishing House: Hanoi, Vietnam, 2011; pp. 1–248. [Google Scholar]
- International Agency for Research on Cancer (IARC). IARC Working Group Reports: Mycotoxin Control in Low- and Middle-Income Countries; Wild, C.P., Miller, J.D., Groopman, J.D., Eds.; International Agency for Research on Cancer (IARC): Lyon, France, 2015. [Google Scholar]
- European Food Safety Authority (EFSA). Statement on the applicability of the Margin of Exposure approach for the safety assessment of impurities which are both genotoxic and carcinogenic in substances added to food/feed. EFSA J. 2012, 10, 2578. [Google Scholar]
- FAO; WHO. Evaluation of Certain Food Contaminants. Sixty-Fourth Report of the Joint FAO/WHO Expert Committee on Food Additives; WHO Technical Report Series, No. 930; World Health Organization: Geneva, Switzerland, 2006; Available online: http://hqlibdoc.who.int/trs/WHO_TRS_930_eng.pdf (accessed on 10 August 2019).
- National Institute of Nutrition (NIN). Daily Nutrient Intake Recommendation for Vietnamese; Medical Publishing House: Hanoi, Vietnam, 2016. [Google Scholar]
- Wang, D.S.; Liang, Y.X.; Nguyen, T.C.; Le, D.D.; Tanaka, T.; Ueno, Y. Natural co-occurrence of fusarium toxins and aflatoxin B1 in corn for feed in North Vietnam. Nat. Toxins 1995, 3, 445–449. [Google Scholar] [CrossRef]
- Trung, T. Mycotoxins in maize in Vietnam. World Mycotoxin J. 2008, 1, 87–94. [Google Scholar] [CrossRef]
- Huong, B.T.M.; Tuyen, L.D.; Do, T.T.; Madsen, H.; Brimer, L.; Dalsgaard, A. Aflatoxins and fumonisins in rice and maize staple cereals in Northern Vietnam and dietary exposure in different ethnic groups. Food Control. 2016, 70, 191–200. [Google Scholar] [CrossRef]
- Gong, Y.; Cardwell, K.; Hounsa, A.; Egal, S.; Turner, P.C.; Hall, A.J.; Wild, C.P. Dietary aflatoxin exposure and impaired growth in young children from Benin and Togo: Cross sectional study. BMJ 2008, 325, 20. [Google Scholar] [CrossRef] [PubMed]
- Turner, P.C.; Collinson, A.C.; Cheung, Y.B.; Gong, Y.; Hall, A.J.; Prentice, A.M.; Wild, C.P. Aflatoxin exposure in utero causes growth faltering in Gambian infants, 2007. Int. J. Epidemiol. 2007, 36, 1119–1125. [Google Scholar] [CrossRef] [PubMed]
- Shirima, C.P.; Kimanya, M.E.; Kinabo, J.L.; Michael, N.; Routledge, M.N.; Srey, G.; Wild, C.P.; Gong, Y.Y. Dietary exposure to aflatoxin and fumonisin among Tanzanian children as determined using biomarkers of exposure. Mol. Nutr. Food Res. 2013, 57, 1874–1881. [Google Scholar] [CrossRef] [Green Version]
- European Food Safety Authority (EFSA). Opinion of the scientific panel on contaminants in the food chain on a request from the commission related to Ochratoxin A. EFSA J. 2006, 365, 1–56. [Google Scholar]
- United States Environmental Pollution Assessment (US EPA). Guidelines for Carcinogen Risk Assessment (PDF); 630-P-03-001F; United States Environmental Pollution Assessment (US EPA): Washington, DC, USA, 2005; 166p.
- JECFA. Ochratoxin A (addendum). In Safety Evaluation of Certain Food Additives and Contaminants. Prepared by the Sixty-Eighth Meeting of the Joint FAO/WHO Expert Committee on Food Additives, 2007; WHO food additive series; Food and Agriculture Organization of the United Nations (FAO); World Health Organization (WHO): Geneva, Switzerland, 2008; Volume 357, pp. 429–454. [Google Scholar]
- Ostry, V.; Malir, F.; Dofkova, M.; Skarkova, J.; Pfohl-Leszkowicz., A.; Ruprich, J. Ochratoxin A dietary exposure of ten population groups in the Czech Republic: Comparison with data over the world. Toxins 2015, 7, 3608–3635. [Google Scholar] [CrossRef]
- Leblanc, J.C.; Tard, A.; Volatier, J.L.; Verger, P. Estimated dietary exposure to principal food mycotoxins from the first French total diet study. Food Addit. Contam. 2005, 22, 652–672. [Google Scholar] [CrossRef]
- Bintvihok, A.; Thiengnin, S.; Doi, K.; Kumagai, S. Residues of aflatoxins in the liver, muscle and eggs of domestic fowls. J. Vet. Med. Sci. 2002, 64, 1037–1039. [Google Scholar] [CrossRef]
- Herzallah, S.M. Determination of aflatoxins in eggs, milk, meat and meat products using HPLC fluorescent and UV detectors. Food Chem. 2009, 114, 1141–1146. [Google Scholar] [CrossRef]
- Pleadin, J.; Staver, M.M.; Vahčić, N.; Kovačević, D.; Milone, S.; Saftić, L.; Scortichini, G. Survey of aflatoxin B1 and ochratoxin A occurrence in traditional meat products coming from Croatian households and markets. Food Control 2015, 52, 71–77. [Google Scholar] [CrossRef]
- Bondy, G.; Mehta, R.; Caldwell, D.; Coady, L.; Armstrong, A.; Savard, M.; Miller, J.D.; Chomyshyn, E.; Bronson, R.; Zitomer, N.; et al. Effects of long term exposure to the mycotoxin fumonisin B1 in p53 heterozygous and p53 homozygous transgenic mice. Food Chem. Toxicol. 2012, 50, 3604–3613. [Google Scholar] [CrossRef]
- Murdoch, D.J.; Krewski, D.; Wargo, J. Cancer risk assessment with intermittent exposure. Risk Anal. 1992, 12, 569–577. [Google Scholar] [CrossRef] [PubMed]
- Smith, M.C.; Madec, S.; Coton, E.; Hymery, N. Natural co-occurrence of mycotoxins in foods and feeds and their in vitro combined toxicological effects. Toxins 2016, 8, 94. [Google Scholar] [CrossRef] [PubMed]
- World Health Organization (WHO). Training Course on Child Growth Assessment; WHO: Geneva, Switzerland, 2008. [Google Scholar]
- European Food Safety Authority (EFSA). Guidance of EFSA General principles for the collection of national food consumption data in the view of a Pan-European dietary survey. EFSA J. 2009, 7, 1435. [Google Scholar] [CrossRef]
- EFSA; FAO; WHO. Joint guidance of EFSA, FAO AND WHO. Towards a harmonised total diet study approach: A guidance document. EFSA J. 2011, 9, 2450. [Google Scholar] [CrossRef]
- Miren, C.; Sonia, M.; Vicente, S.R. Distribution of fumonisins and aflatoxins in corn fractions during industrial cornflake processing. Int. J. Food Microbiol. 2008, 123, 81–87. [Google Scholar]
- Liu, Y.; Wu, F. Global burden of aflatoxin-induced hepatocellular carcinoma: A risk assessment. Environ. Health Perspect. 2010, 118, 818–824. [Google Scholar] [CrossRef] [PubMed]
- Zar, J.H. Biostatistical Analysis, 4th ed.; Pearson Publishing House: Upper Saddle River, NJ, USA, 1999. [Google Scholar]
- Jolliffe, I. Principal Component Analysis; (Springer Series in Statistics); Springer: Berlin, Germany, 2013. [Google Scholar]


| Food Groups a | Food Items | Food Preparation b | |
|---|---|---|---|
| 1 | Rice and products | Rice | Boiled |
| Sticky rice | Boiled | ||
| Rice noodle | Boiled | ||
| 2 | Wheat and products | Noodle | Boiled |
| 3 | Tubes, root and products | Vicermine | Boiled |
| Shrimp chip | Deep fried | ||
| 4 | Beans and products | Black bean | Stewed |
| Mung bean | Stewed | ||
| Soybean milk | Ready to eat | ||
| Soy bean | Stewed | ||
| 5 | Tofu | Tofu | Boiled |
| 6 | Oily seeds | Peanut | Stir fried |
| 7 | Vegetables | Bamboo shot, fermented | Boiled |
| 8 | Sugar, confectionary | Biscuit | Ready to eat |
| Wafers | Ready to eat | ||
| Cookies | Ready to eat | ||
| Sesame candy | Ready to eat | ||
| Nugget/peanut candy | Ready to eat | ||
| 9 | Oil, fat | Pork, fat | Fried |
| Cooking oil | |||
| 10 | Meat and products | Dry pork meat | Ready to eat |
| Pork pie, fried | Ready to eat | ||
| Pork pie, boiled | Ready to eat | ||
| Pork rib, boneless | Stewed | ||
| Pigeon | Stewed | ||
| Beef | Stir fried | ||
| Dog meat | Boiled | ||
| Chicken | Boiled | ||
| Pork, lean | Boiled, stir fried | ||
| Pork | Boiled, stir fried | ||
| Pork liver | Stir fried | ||
| 11 | Egg and milk | Egg, chicken | Boiled, fried |
| Egg, duck | Boiled, fried | ||
| Condensed Milk | Ready to eat | ||
| Milk powder | Ready to eat | ||
| Milk | Ready to eat | ||
| 12 | Fish | Dried fish | Stir fried |
| Fish, fresh water | Boiled | ||
| 13 | Other aquaculture products | Dried shrimp | Boiled |
| Shrimp | Stir fried | ||
| Mean | Range | |
|---|---|---|
| Food Intake (g per child per day) | ||
| Rice and products | 196 | 49–313 |
| Wheat and products | 11 | 0–93 |
| Tubes, root and products | 3 | 0–100 |
| Bean and products | 11 | 0–293 |
| Tofu | 4 | 0–63 |
| Oily seed | 2 | 0–29 |
| Vegetable leaf | 50 | 0–149 |
| Vegetable tube | 12 | 0–157 |
| Fruit | 22 | 0–225 |
| Confectionary | 15 | 0–215 |
| Seasoning | 0 | 0–4 |
| Oil, fat | 2 | 0–12 |
| Meat and products | 30 | 0–110 |
| Egg and milk | 38 | 0–281 |
| Fish | 6 | 0–31 |
| Other aquaculture products | 2 | 0–55 |
| Other spices | 0 | 0–4 |
| Dietary Composition (per child per day) | ||
| Energy (kcal) | 871 | 218–171 |
| Protein (g) total | 28 | 8–67 |
| Protein from animal sources (g) | 10 | 0–50 |
| Non-animal protein (g) | 18 | 4–33 |
| Protein (eggs and milk) (g) | 3 | 0–17 |
| Protein from meat (g) | 6 | 0–45 |
| Carbohydrate (g) | 152 | 37–258 |
| Fat (g) | 17 | 2–57 |
| Vegetable fat/oil (g) | 7 | 1–48 |
| Fiber (g) | 2.5 | 0.4–6.9 |
| Ash (g) | 3.5 | 0.9–7.2 |
| Total vitamin A a (mcg) | 99.0 | 0–1044.0 |
| Animal source vitamin A a (mcg) | 90.0 | 0–1044.0 |
| Non-animal vitamin A a (mcg) | 9.0 | 0–145.0 |
| Carotenoid (mcg) | 2353.0 | 0–8576.0 |
| Vitamin C (mg) | 33.1 | 0.0–170.3 |
| Thiamin (mg) | 0.4 | 0.1–1.0 |
| Riboflavin (mg) | 0.3 | 0.0–1.1 |
| Niacin (mg) | 5.1 | 1.2–13.2 |
| Vitamin D (mcg) | 0.4 | 0.0–4.7 |
| Folic acid (mcg) | 0.0 | 0.0–0.0 |
| Folate (mcg) | 94.5 | 8.6–308.3 |
| Vitamin B12 (mcg) | 0.6 | 0.0–4.2 |
| Calcium (mg) | 181.8 | 27.8–707.9 |
| Sodium (mg) | 167 | 8–1087 |
| Potassium (mg) | 784.9 | 176.1–1716.6 |
| Magnesium (mg) | 69.5 | 11.7–177.4 |
| Zinc (mg) | 3.7 | 1.1–6.7 |
| Phosphorous (mg) | 361 | 73–905 |
| Iron (mg) | 4.8 | 1.0–9.5 |
| Iron from meat/fish/poultry (mg) | 0.5 | 0.0–3.4 |
| Food Group a | Number of Composite Samples | Aflatoxin B1 | Ochratoxin A | ||||
|---|---|---|---|---|---|---|---|
| Number of Test Results < LOD | Concentration (ng/kg) b | Number of Test Results < LOD | Concentration (ng/kg) b | ||||
| MB | LB-UB | MB | LB-UB | ||||
| Rice and products | 3 | 1 | 2989 | 2400–3020 | 3 | 950 | 0–1900 |
| Wheat and products | 1 | 0 | 1000 | 1000 | 1 | 950 | 0–1900 |
| Tubes, root and products | 2 | 1 | 2171 | 1670–2670 | 2 | 950 | 0–190 |
| Beans and products | 4 | 1 | 2864 | 2610–3110 | 2 | 9683 | 9210–10,160 |
| Tofu | 1 | 1 | 1000 | 0–2000 | 1 | 950 | 0–1900 |
| Oily seeds | 1 | 0 | 4086 | 4086 | 1 | 950 | 0–1900 |
| Vegetables | 1 | 0 | 3470 | 3470 | 1 | 950 | 0–1900 |
| Sugar/confectionary | 5 | 0 | 4033 | 4033 | 4 | 1173 | 410–1930 |
| Oil, fat | 2 | 0 | 3382 | 3382 | 1 | 1462 | 980–1940 |
| Meat and products | 11 | 1 | 4077 | 3990–4170 | 4 | 2685 | 2340–3032 |
| Egg and milk | 4 | 0 | 5326 | 5325 | 1 | 3164 | 2930–3400 |
| Fish | 2 | 1 | 2301 | 1800–2800 | 1 | 2245 | 1770–2720 |
| Other aquaculture products | 3 | 0 | 2518 | 1850–3180 | 0 | 4850 | 4850 |
| Total | 40 | 6 | 20 | ||||
| Boy | Girl | p-Value | ||||
|---|---|---|---|---|---|---|
| n | Mean and Range | n | Mean and Range | |||
| Anthropometric Measurement | ||||||
| Length/height for age Z- score | 13–23 months | 6 | −0.34 (−0.76–0.65) | 8 | 1.01 (−2.36–2.50) | n.s. |
| 24–59 months | 58 | −2.22 (−3.19–1.52) | 47 | −2.29 (−3.31–1.60) | n.s. | |
| p-value | <0.01 | <0.001 | ||||
| Weight for length/height Z- score | 13–23 months | 6 | −0.49 (−1.05–0.37) | 8 | 0.27 (−1.00–2.00) | n.s. |
| 24–59 months | 58 | −0.66 (−2.33–1.13) | 47 | −0.61 (−2.41–3.27) | n.s. | |
| p-value | n.s. | <0.05 | ||||
| % Length/height for age Z- score < −2 (%) | 13–23 months | 6 | 0 | 8 | 12.5 | n.s. |
| 24–59 months | 58 | 53.4 | 47 | 59.6 | n.s. | |
| p-value | <0.05 | <0.05 | ||||
| Dietary Intake | ||||||
| Energy intake(kcal/day) | 13–23 months | 6 | 790 (434–1097) | 9 | 742 (367–1164) | n.s. |
| 24–59 months | 58 | 901 (218–1436) | 47 | 868 (378–1713) | n.s. | |
| p-value | n.s. | n.s. | ||||
| Protein intake (g/day) | 13–23 months | 6 | 24 (11–49) | 9 | 22 (9–38) | n.s. |
| 24-59 months | 58 | 29 (8–67) | 47 | 28 (9–48) | n.s. | |
| p-value | n.s. | n.s. | ||||
| Vitamin A intake (mcg/day) | 13–23 months | 6 | 15.5 (0.0–60.9) | 9 | 47.1 (0.0–160.9) | n.s. |
| 24–59 months | 58 | 95.3 (0.0–629.8) | 47 | 124.1 (0.0–1043.7) | n.s. | |
| p-value | <0.05 | n.s. | ||||
| Iron intake (mg/day) | 13–23 months | 6 | 5.6 (3.7–8.3) | 9 | 4.6 (1.9–6.5) | n.s. |
| 24–59 months | 58 | 4.8 (1.1–9.5) | 47 | 4.7 (1.6–9.4) | n.s. | |
| p-value | n.s. | n.s. | ||||
| Zinc intake (mg/day) | 13–23 months | 6 | 3.7 (2.6–5.7) | 9 | 3.6 (1.1–4.8) | n.s. |
| 24-59 months | 58 | 3.8 (1.1–6.7) | 47 | 3.75 (1.5–6.5) | n.s. | |
| p-value | n.s. | n.s. | ||||
| Mycotoxin Exposure | ||||||
| Aflatoxin B1 (ng/kg bw/day) | 13–23 months | 6 | 135.9 (87.2–170.3) | 8 | 100.5 (49.1–156.6) | n.s. |
| 24–59 months | 58 | 123.5 (28.4–247.3) | 47 | 121.6 (40.2–246.3) | n.s. | |
| p-value | n.s. | n.s. | ||||
| Fumonisins (ng/kg bw/day) | 13–23 months | 6 | 3.6 (2.1–4.6) | 8 | 2.7 (1.6–4.0) | n.s. |
| 24–59 months | 58 | 3.5 (0.8–7.5) | 47 | 3.5 (1.3–7.1) | n.s. | |
| p-value | n.s. | n.s. | ||||
| Ochratoxin A (ng/kg bw/day) | 13–23 months | 6 | 43.2 (20.4–82.1) | 8 | 31.3 (17.6–47.2) | n.s. |
| 24–59 months | 58 | 54.8 (11.0–344.7) | 47 | 57.2 (13.7–239.5) | n.s. | |
| p-value | n.s. | n.s. | ||||
| Variable Label | Principal Component Score | ||||||
|---|---|---|---|---|---|---|---|
| Comp 1 | Comp 2 | Comp 3 | Comp 4 | Comp 5 | Comp 6 | Comp 7 | |
| Energy (Kcal) | 0.38 | ||||||
| Non-animal protein sources (g) | 0.39 | ||||||
| Carbohydrate by difference (g) | 0.51 | ||||||
| Zinc (mg) | 0.33 | ||||||
| Riboflavin (mg) | 0.31 | ||||||
| Vitamin D (mcg) | 0.44 | ||||||
| Calcium (mg) | 0.38 | ||||||
| Sodium (mg) | 0.40 | ||||||
| Poly-unsaturated fatty acid (g) | 0.50 | ||||||
| Mono- saturated fatty acid (g) | 0.62 | ||||||
| Animal source vitamin A (mcg) | 0.55 | ||||||
| Vitamin B12 (mcg) | 0.48 | ||||||
| Cholesterol (g) | 0.50 | ||||||
| Carotenoid (mcg) | 0.58 | ||||||
| Vitamin C (mg) | 0.44 | ||||||
| Folate (mcg) | 0.48 | ||||||
| Vegetable Fat/oil (g) | 0.57 | ||||||
| Fiber (dietary fiber) (g) | 0.32 | ||||||
| Fat (g) | 0.33 | ||||||
| Non-animal source vitamin A | 0.57 | ||||||
| Protein from meat (mg) | 0.58 | ||||||
| Niacin (mg) | 0.31 | ||||||
| Iron from fish, poultry and other meat product (mg) | 0.64 | ||||||
| Model | Factors Adjusted for (Forced into Model) | Other Potential Correlates | Logn (Aflatoxin B1 Exposure) | Logn (Fuminosin Exposure) | Logn (Ochratoxin A Exposure) | Combined (Based on PCA Score) |
|---|---|---|---|---|---|---|
| HAZ | ||||||
| 1 | Age (months) + gender | None | 0.21 (−0.40–0.81) | 0.11 (−0.54–0.75) | −0.07 (−0.48–0.35) | 0.02 (−0.13–0.17) |
| 2 | Age (months) + gender + total energy | None | −1.13 (−1.81–−0.45) ** | −1.52 (−2.24–−0.80) *** | −0.76 (−1.18–−0.35) *** | −0.32 (−0.49–−0.16) *** |
| 3 | Age (months) + gender + total energy | Vitamin A; total protein; iron; zinc | −2.19 (−2.80–−1.58) *** | −2.62 (−3.24–−1.99) *** | −1.24 (−1.62–−0.86) *** | −0.58 (−0.72–−0.43) *** |
| 4 | Age (months) + gender + PC1 | PC2 to PC7 a | −2.66 (−3.40–−1.92) *** | −2.99 (−3.71–−2.27) *** | −0.96 (−1.31–−0.61) *** | −0.66 (−0.83–−0.48) *** |
| WHZ | ||||||
| 1 | Age (months) + gender | None | −0.16 (−0.56–0.25) | −0.14 (−0.57–0.28) | 0.01 (−0.26–0.29) | −0.02 (−0.12–0.08) |
| 2 | Age (months) + gender + total energy | None | −0.26 (−0.78–0.26) | −0.26 (−0.82–0.30) | 0.0145 (−0.30–0.33) | −0.04 (−0.17–0.09) |
| 3 | Age (months) + gender + total energy | Vitamin A; total protein; iron; zinc | −0.534 (−1.07–0.00) * | −0.50 (−1.07–0.084) | −0.08 (−0.40–0.24) | −0.09 (−0.22–0.04) |
| 4 | Age (months) + gender + PC1 | PC2 to PC7 | −1.50 (−2.17–−0.83) *** | −1.26 (−1.95–−0.56) *** | −0.41 (−0.81–0.00) | −0.27 (−0.44–−0.11) ** |
| Food Groups a | Aflatoxin B1 | Ochratoxin A | ||||||||
|---|---|---|---|---|---|---|---|---|---|---|
| Exposure (ng/kg bw b/day) | HCC Risk d (cases/100,000 Population) | MOEeHCC | MOEfHCC Adjusted | Exposure (ng/kg bw/day) | MOEe RC | MOEfRC Adjusted | ||||
| MBc | LB-UBc | MB | LB-UB | MB | LB-UB | |||||
| Rice and products | 52.2 | 41.2–52.8 | 5.3 | 4.2–5.4 | 3 | 1 | 14.2 | 0–1900 | 1478 | 468 |
| Wheat and products | 1.0 | 0–1.9 | 0.1 | 0–0.2 | 183 | 58 | 0.9 | 0–1900 | >10,000 | 7384 |
| Tubes, roof and products | 0.7 | 0.5–0.8 | 0.1 | 0–0.1 | 261 | 83 | 0.3 | 0–1900 | >10,000 | >10,000 |
| Beans and products | 3.9 | 3.6–4.1 | 0.4 | 0.4 | 44 | 14 | 9.8 | 9208–10,158 | 2142 | 678 |
| Tofu | 0.3 | 0–0.6 | 0.0 | 0–0.1 | 532 | 168 | 0.3 | 0–1900 | >10,000 | >10,000 |
| Oily seeds | 0.6 | 0.6 | 0.1 | 0.1 | 287 | 91 | 0.1 | 0–1900 | >10,000 | >10,000 |
| Vegetables | 18.9 | 18.9 | 2.0 | 2 | 9 | 3 | 5.2 | 0–1900 | 4,038 | 1278 |
| Sugar/confectionary | 6.8 | 5.5 | 0.7 | 0.7 | 25 | 10 | 1.6 | 413–1933 | >10,000 | 4153 |
| Oil, fat | 0.5 | 0.5 | 0.1 | 0.1 | 347 | 110 | 0.2 | 987–1937 | >10,000 | >10,000 |
| Meat and products | 13.8 | 13.5–14.0 | 1.4 | 1.4 | 12 | 4 | 7.1 | 1339–3030 | 2957 | 936 |
| Egg and milk | 18.0 | 18 | 1.9 | 1.9 | 9 | 3 | 10.7 | 2927–3401 | 1962 | 621 |
| Fish | 1.3 | 1.0–1.6 | 0.1 | 0.2 | 133 | 42 | 1.2 | 1770–2720 | >10,000 | 5538 |
| Other aquaculture products | 0.4 | 0.3–0.6 | 0.0 | 0–0.1 | 384 | 122 | 0.9 | 4850 | >10,000 | 7384 |
| Total | 118.7 | 104.9–124.2 | 12.1 | 10.7–12.7 | 1.4 | 0.5 | 52.6 | 29.7–77.0 | 400 | 127 |
© 2019 by the authors. Licensee MDPI, Basel, Switzerland. This article is an open access article distributed under the terms and conditions of the Creative Commons Attribution (CC BY) license (http://creativecommons.org/licenses/by/4.0/).
Share and Cite
Huong, B.T.M.; Tuyen, L.D.; Madsen, H.; Brimer, L.; Friis, H.; Dalsgaard, A. Total Dietary Intake and Health Risks Associated with Exposure to Aflatoxin B1, Ochratoxin A and Fuminisins of Children in Lao Cai Province, Vietnam. Toxins 2019, 11, 638. https://doi.org/10.3390/toxins11110638
Huong BTM, Tuyen LD, Madsen H, Brimer L, Friis H, Dalsgaard A. Total Dietary Intake and Health Risks Associated with Exposure to Aflatoxin B1, Ochratoxin A and Fuminisins of Children in Lao Cai Province, Vietnam. Toxins. 2019; 11(11):638. https://doi.org/10.3390/toxins11110638
Chicago/Turabian StyleHuong, Bui Thi Mai, Le Danh Tuyen, Henry Madsen, Leon Brimer, Henrik Friis, and Anders Dalsgaard. 2019. "Total Dietary Intake and Health Risks Associated with Exposure to Aflatoxin B1, Ochratoxin A and Fuminisins of Children in Lao Cai Province, Vietnam" Toxins 11, no. 11: 638. https://doi.org/10.3390/toxins11110638
APA StyleHuong, B. T. M., Tuyen, L. D., Madsen, H., Brimer, L., Friis, H., & Dalsgaard, A. (2019). Total Dietary Intake and Health Risks Associated with Exposure to Aflatoxin B1, Ochratoxin A and Fuminisins of Children in Lao Cai Province, Vietnam. Toxins, 11(11), 638. https://doi.org/10.3390/toxins11110638