Dinophysis acuta in Scottish Coastal Waters and Its Influence on Diarrhetic Shellfish Toxin Profiles

 ,
,  , ,
, , 
Abstract
1. Introduction
2. Results
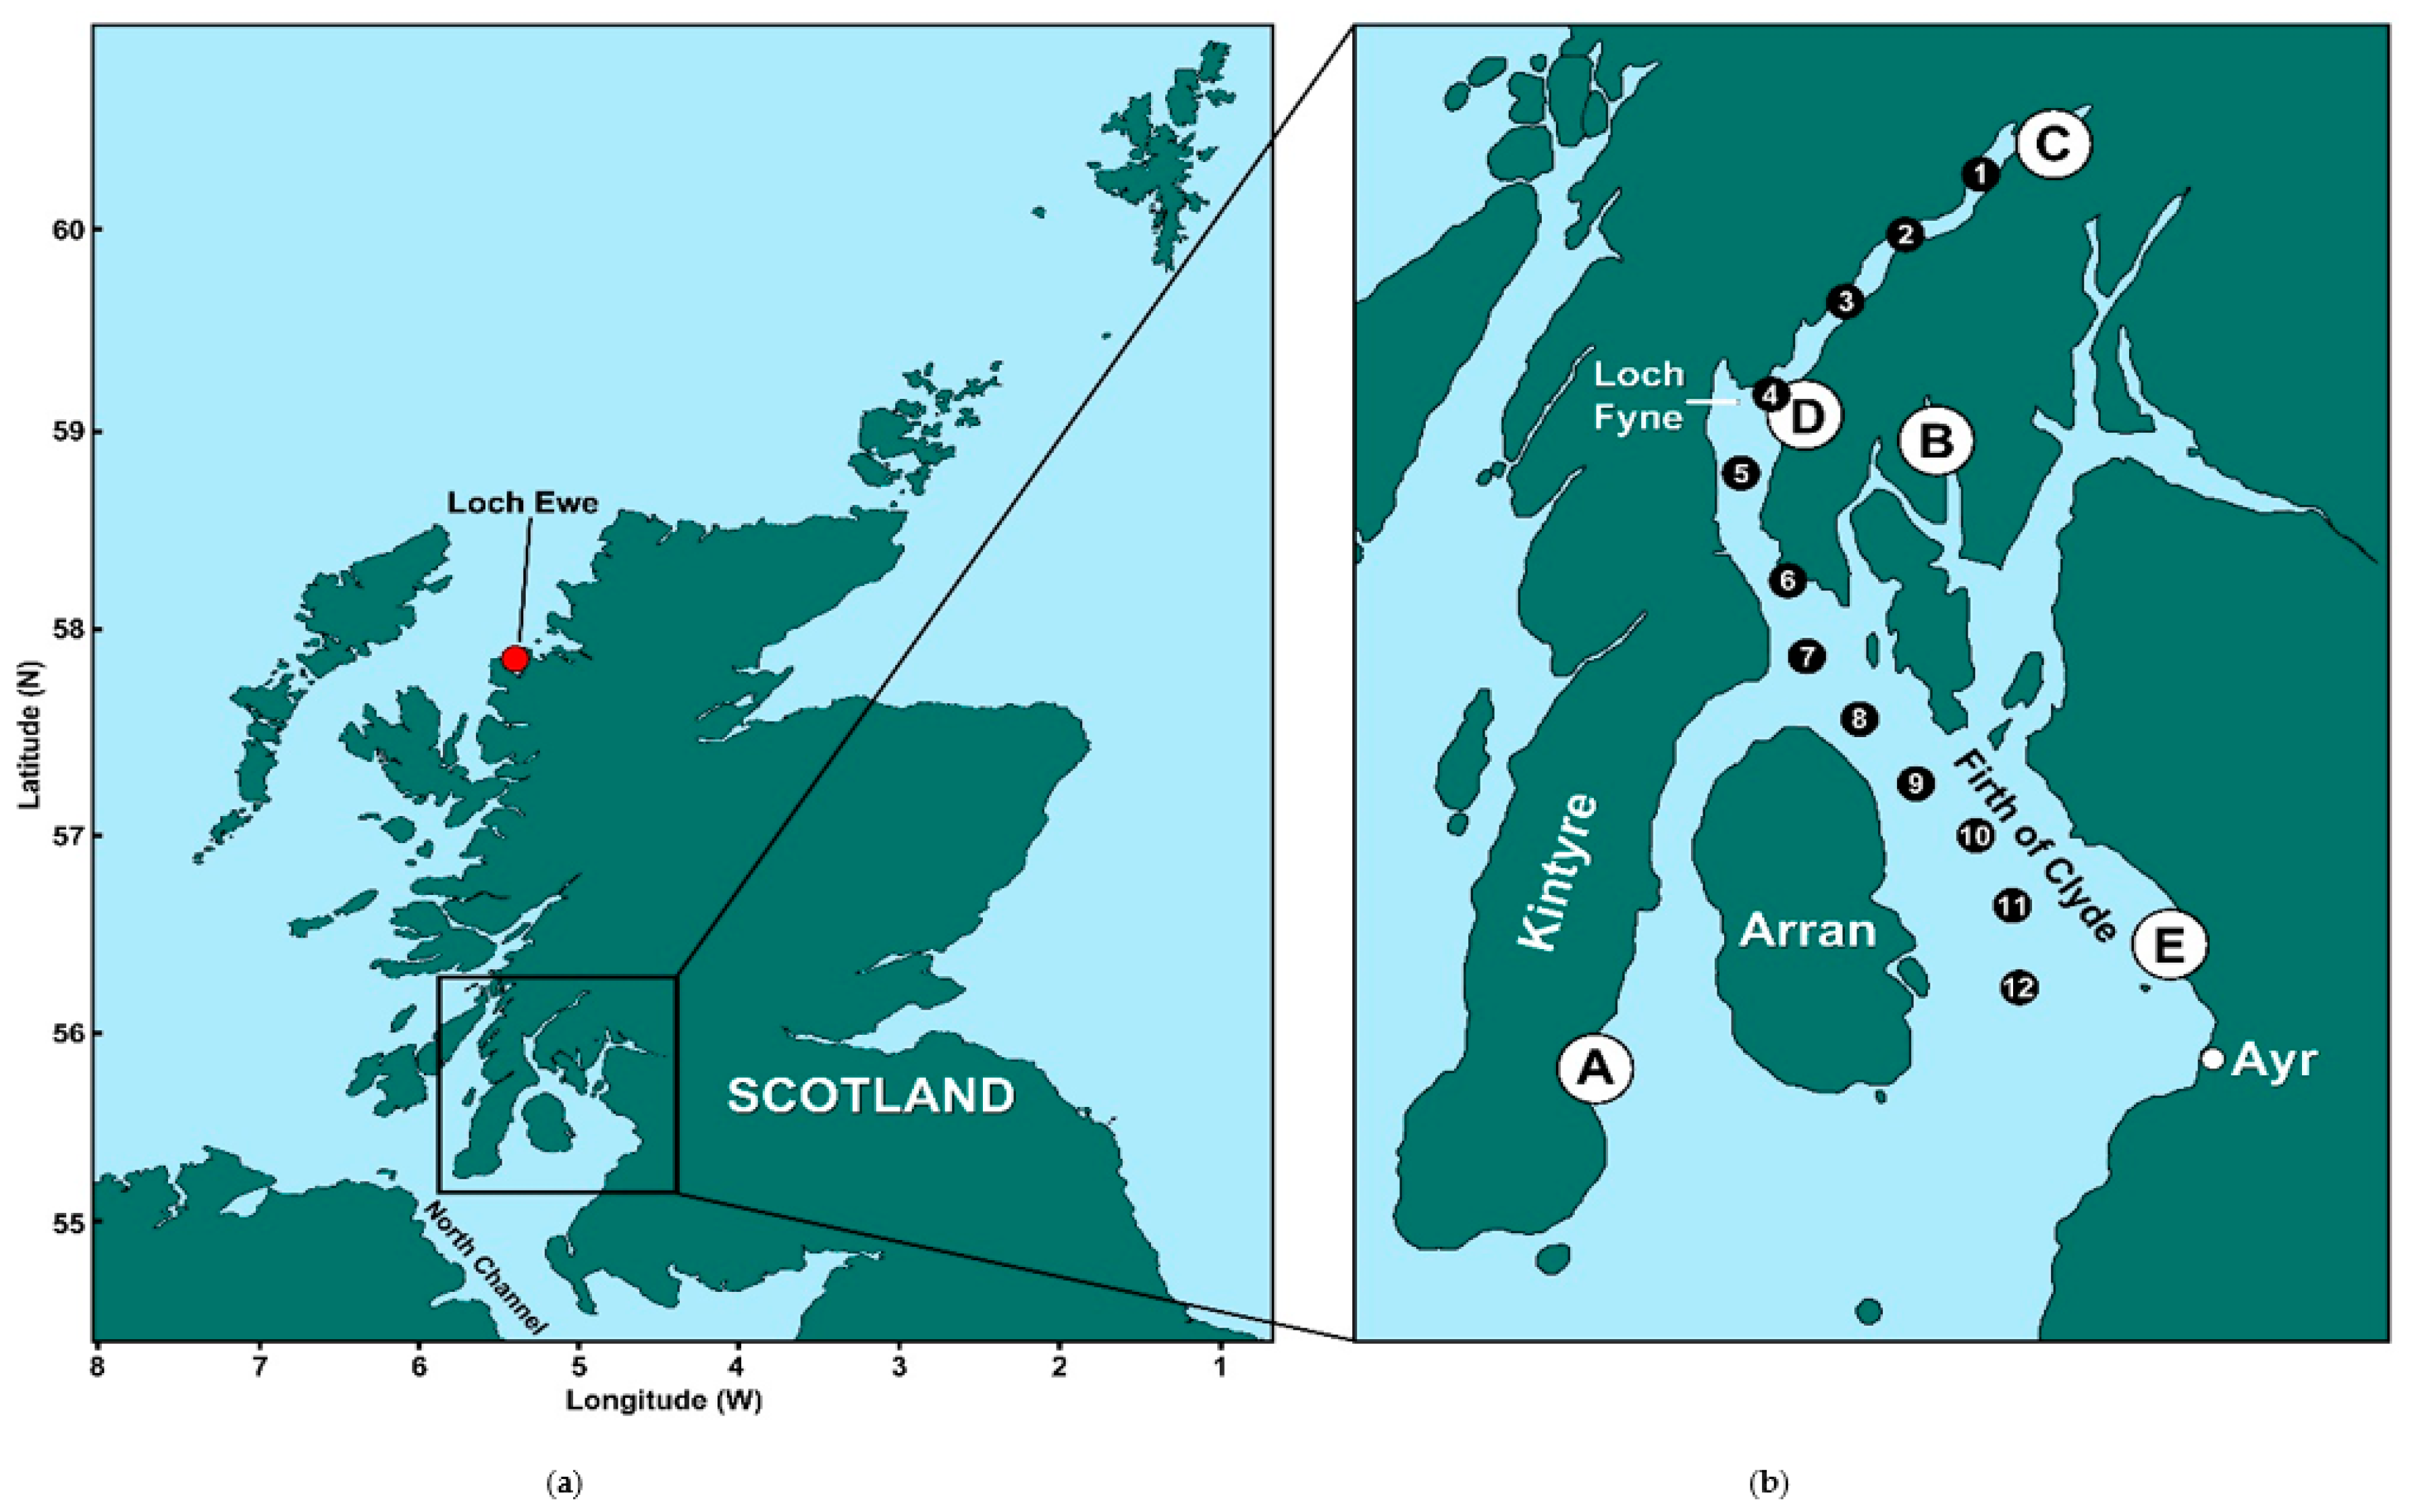
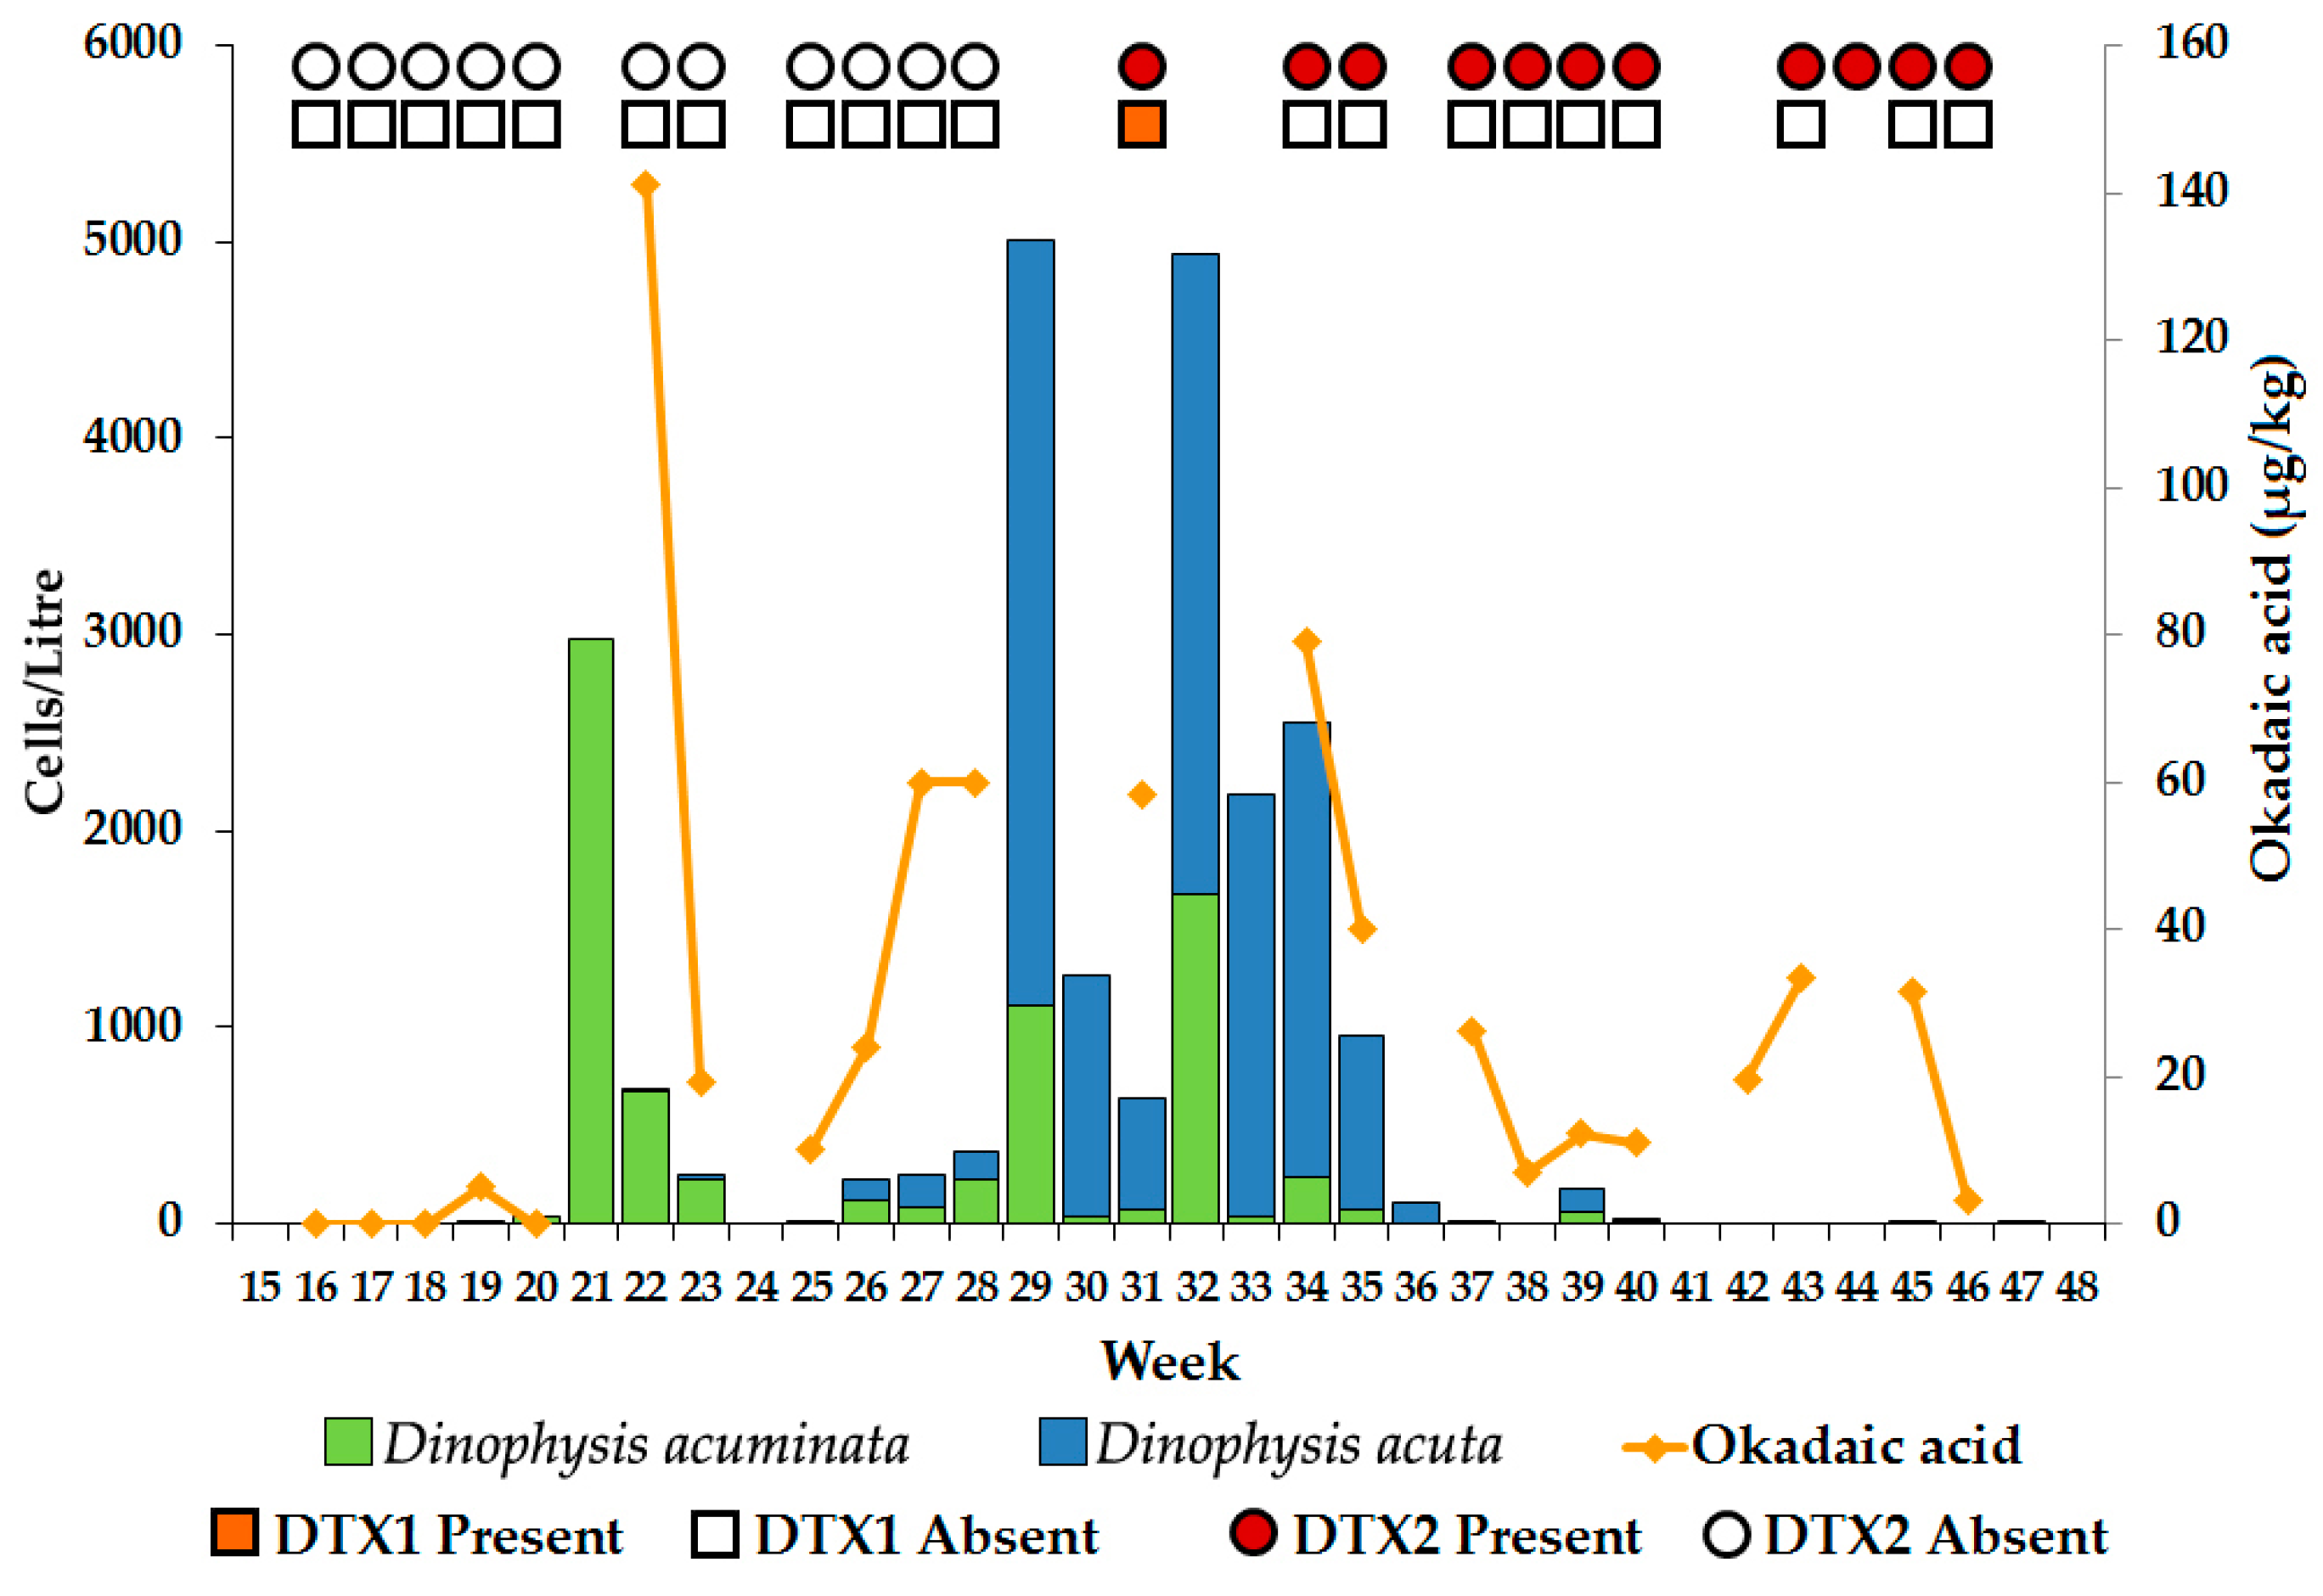
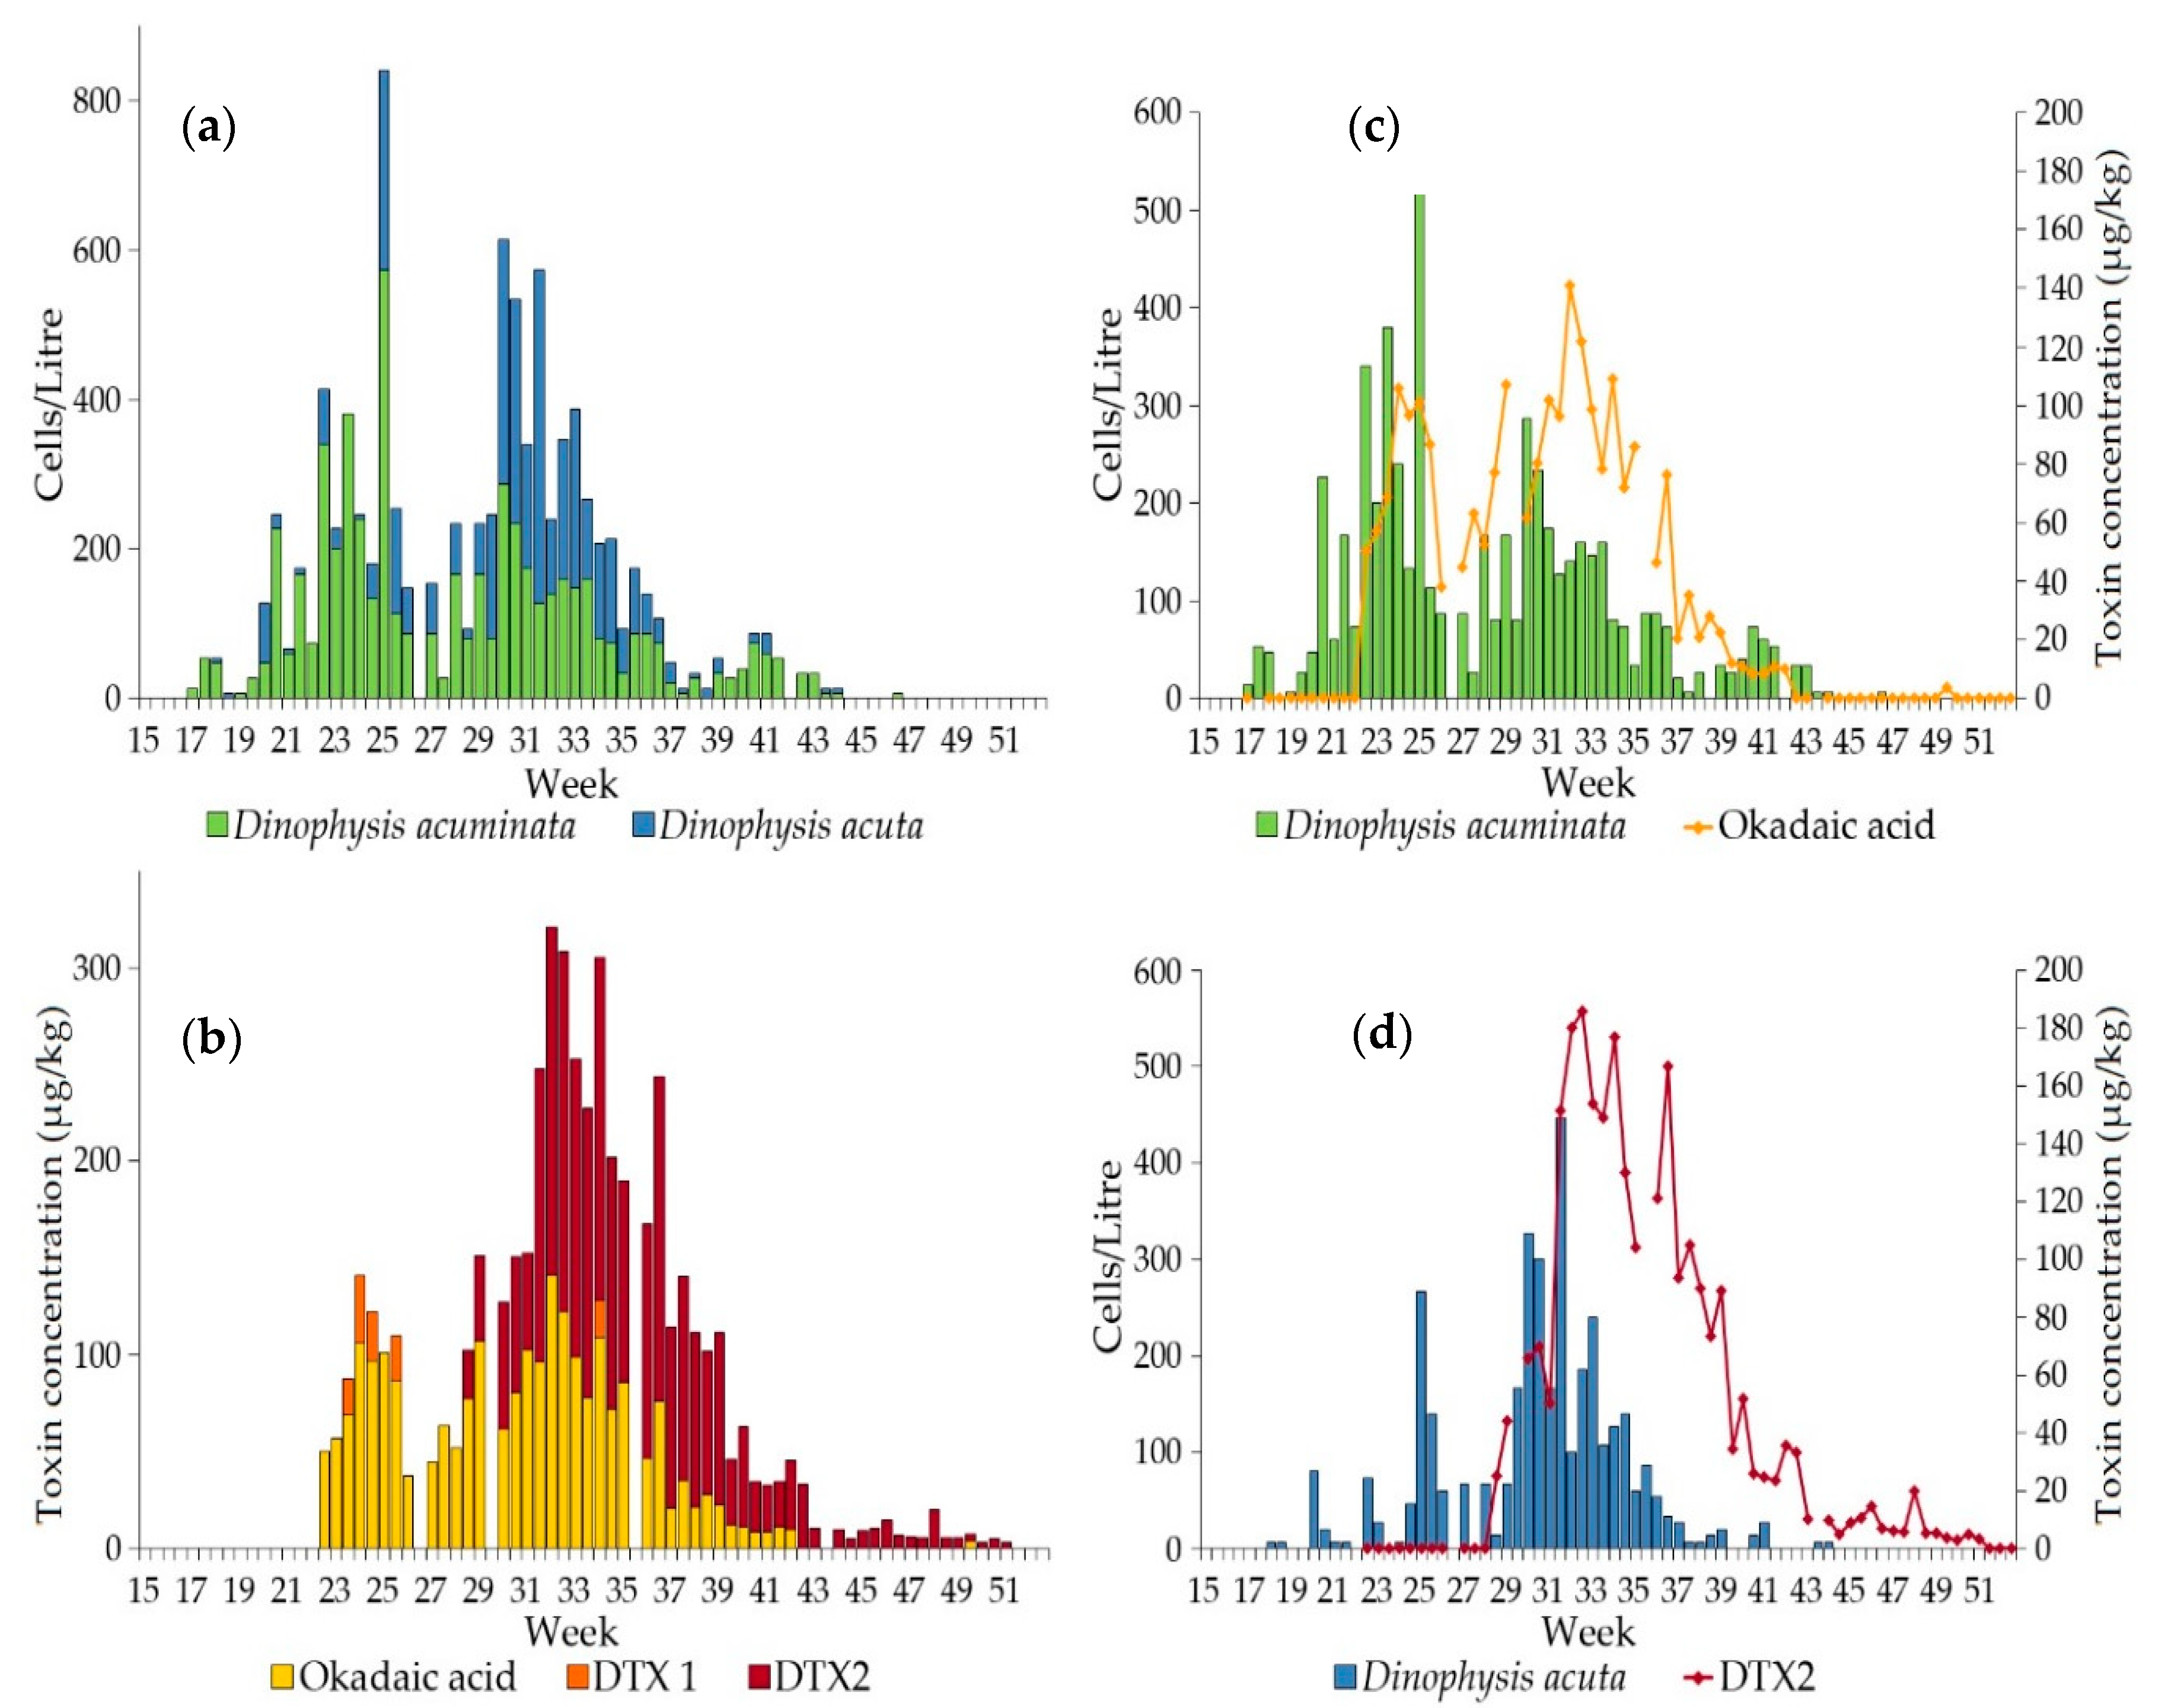
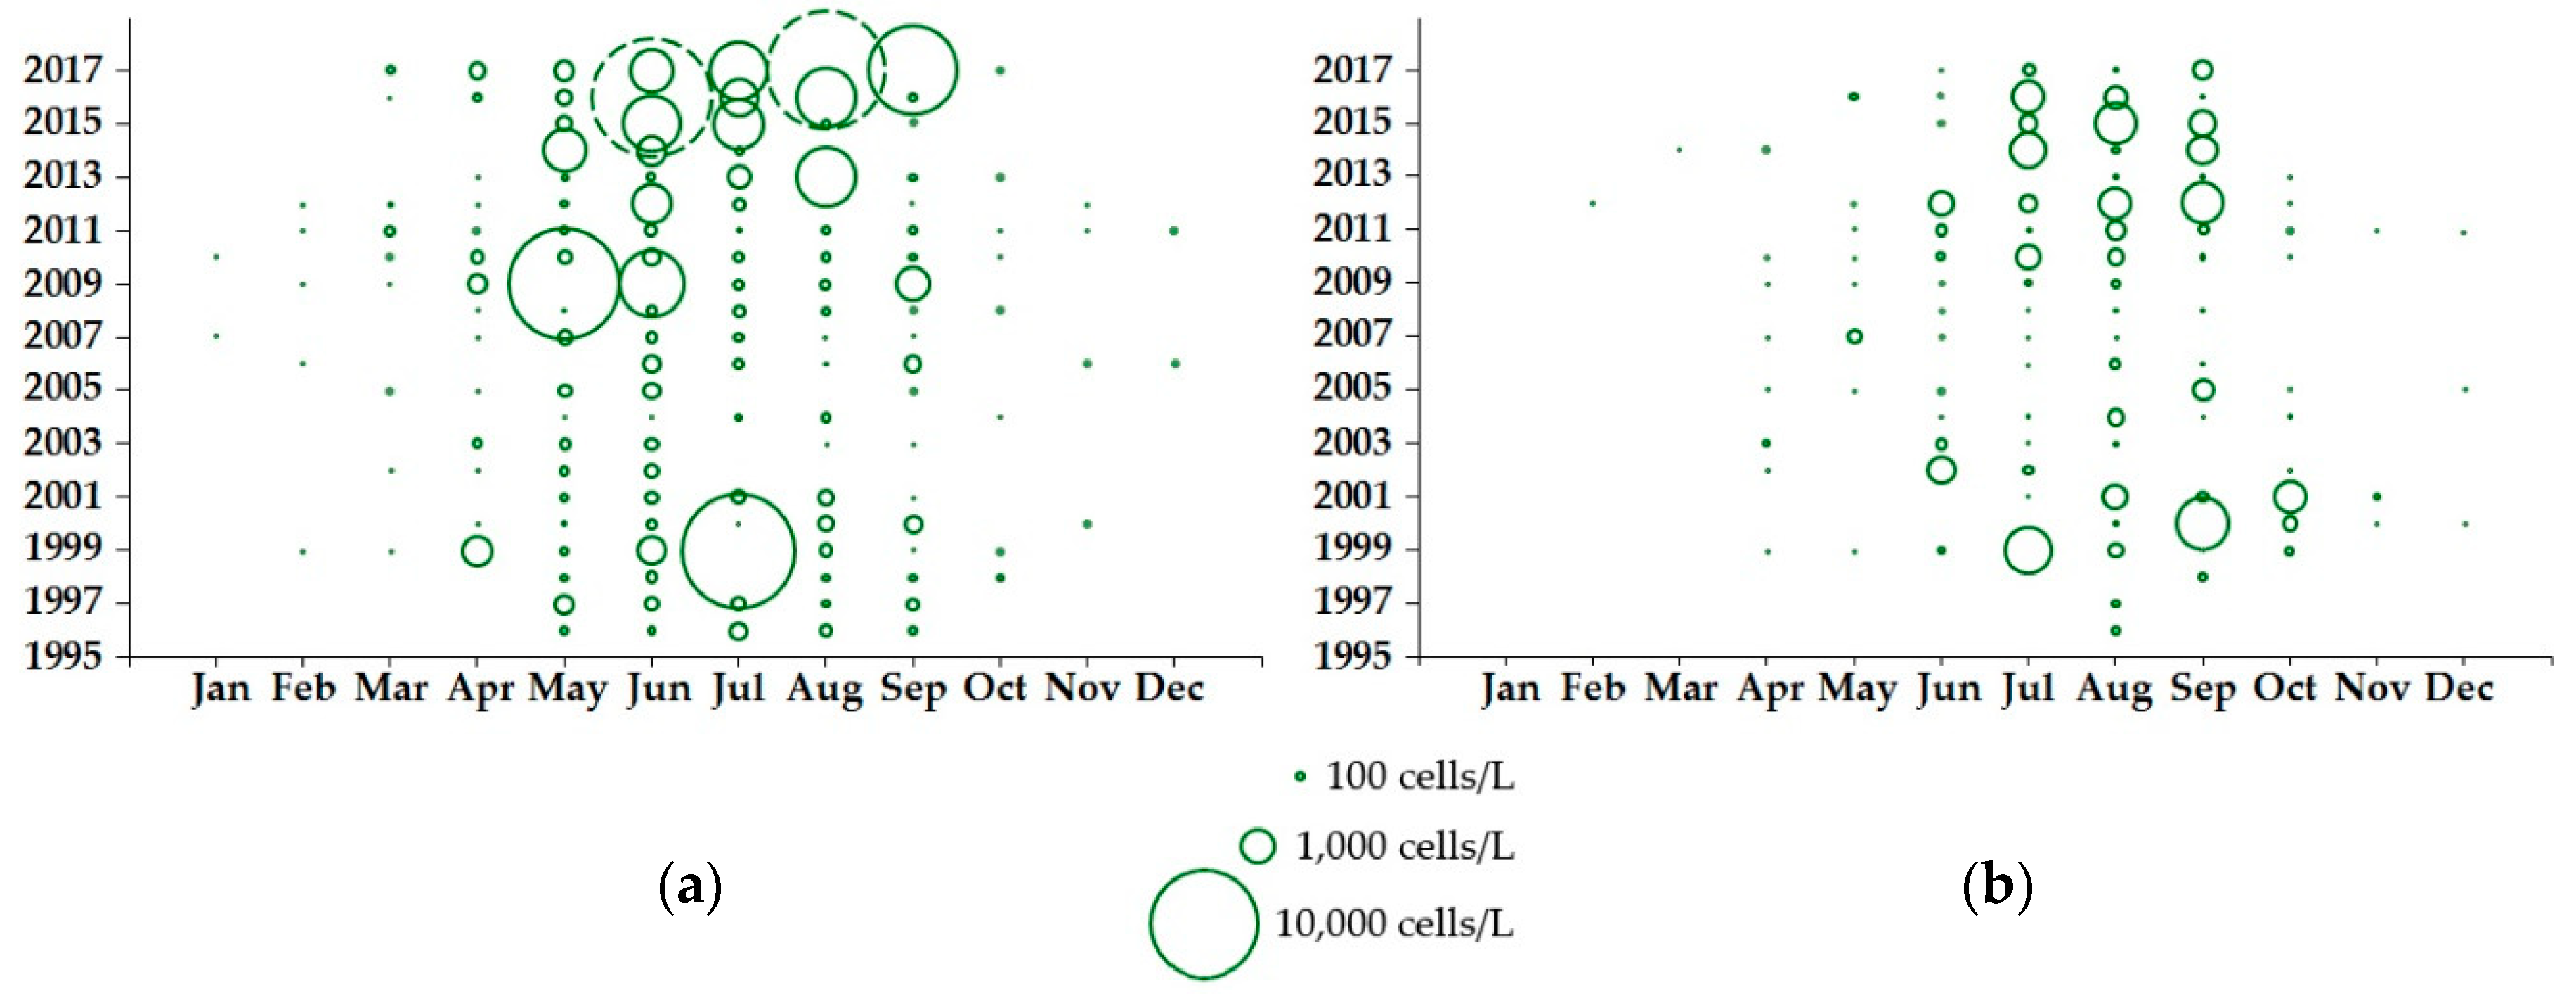
2.1. Loch Ewe
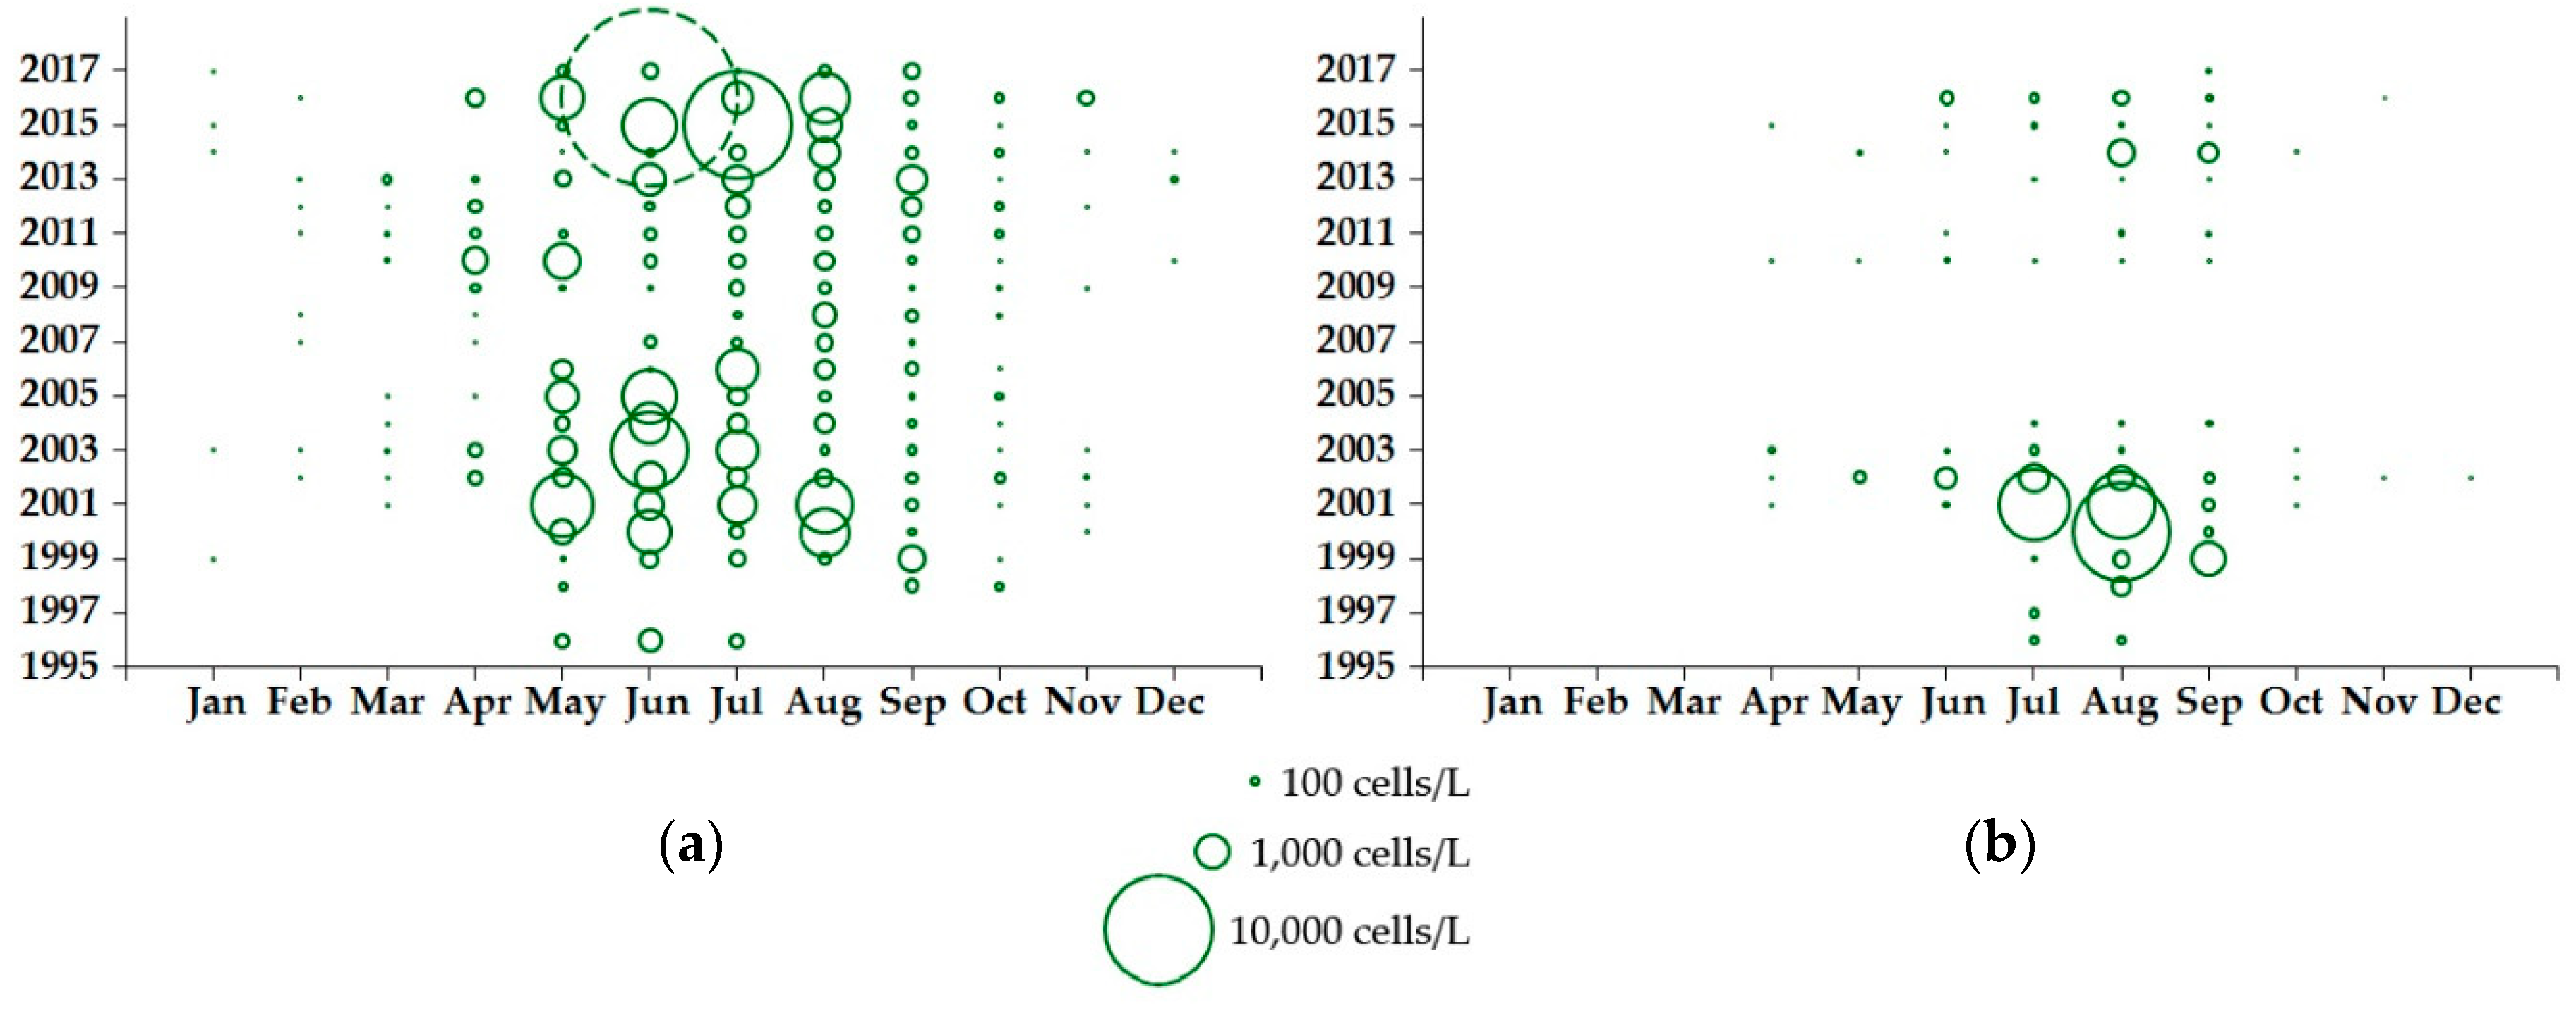
2.1.1. Dinophysis Abundance
2.1.2. Toxin Concentration in Shellfish
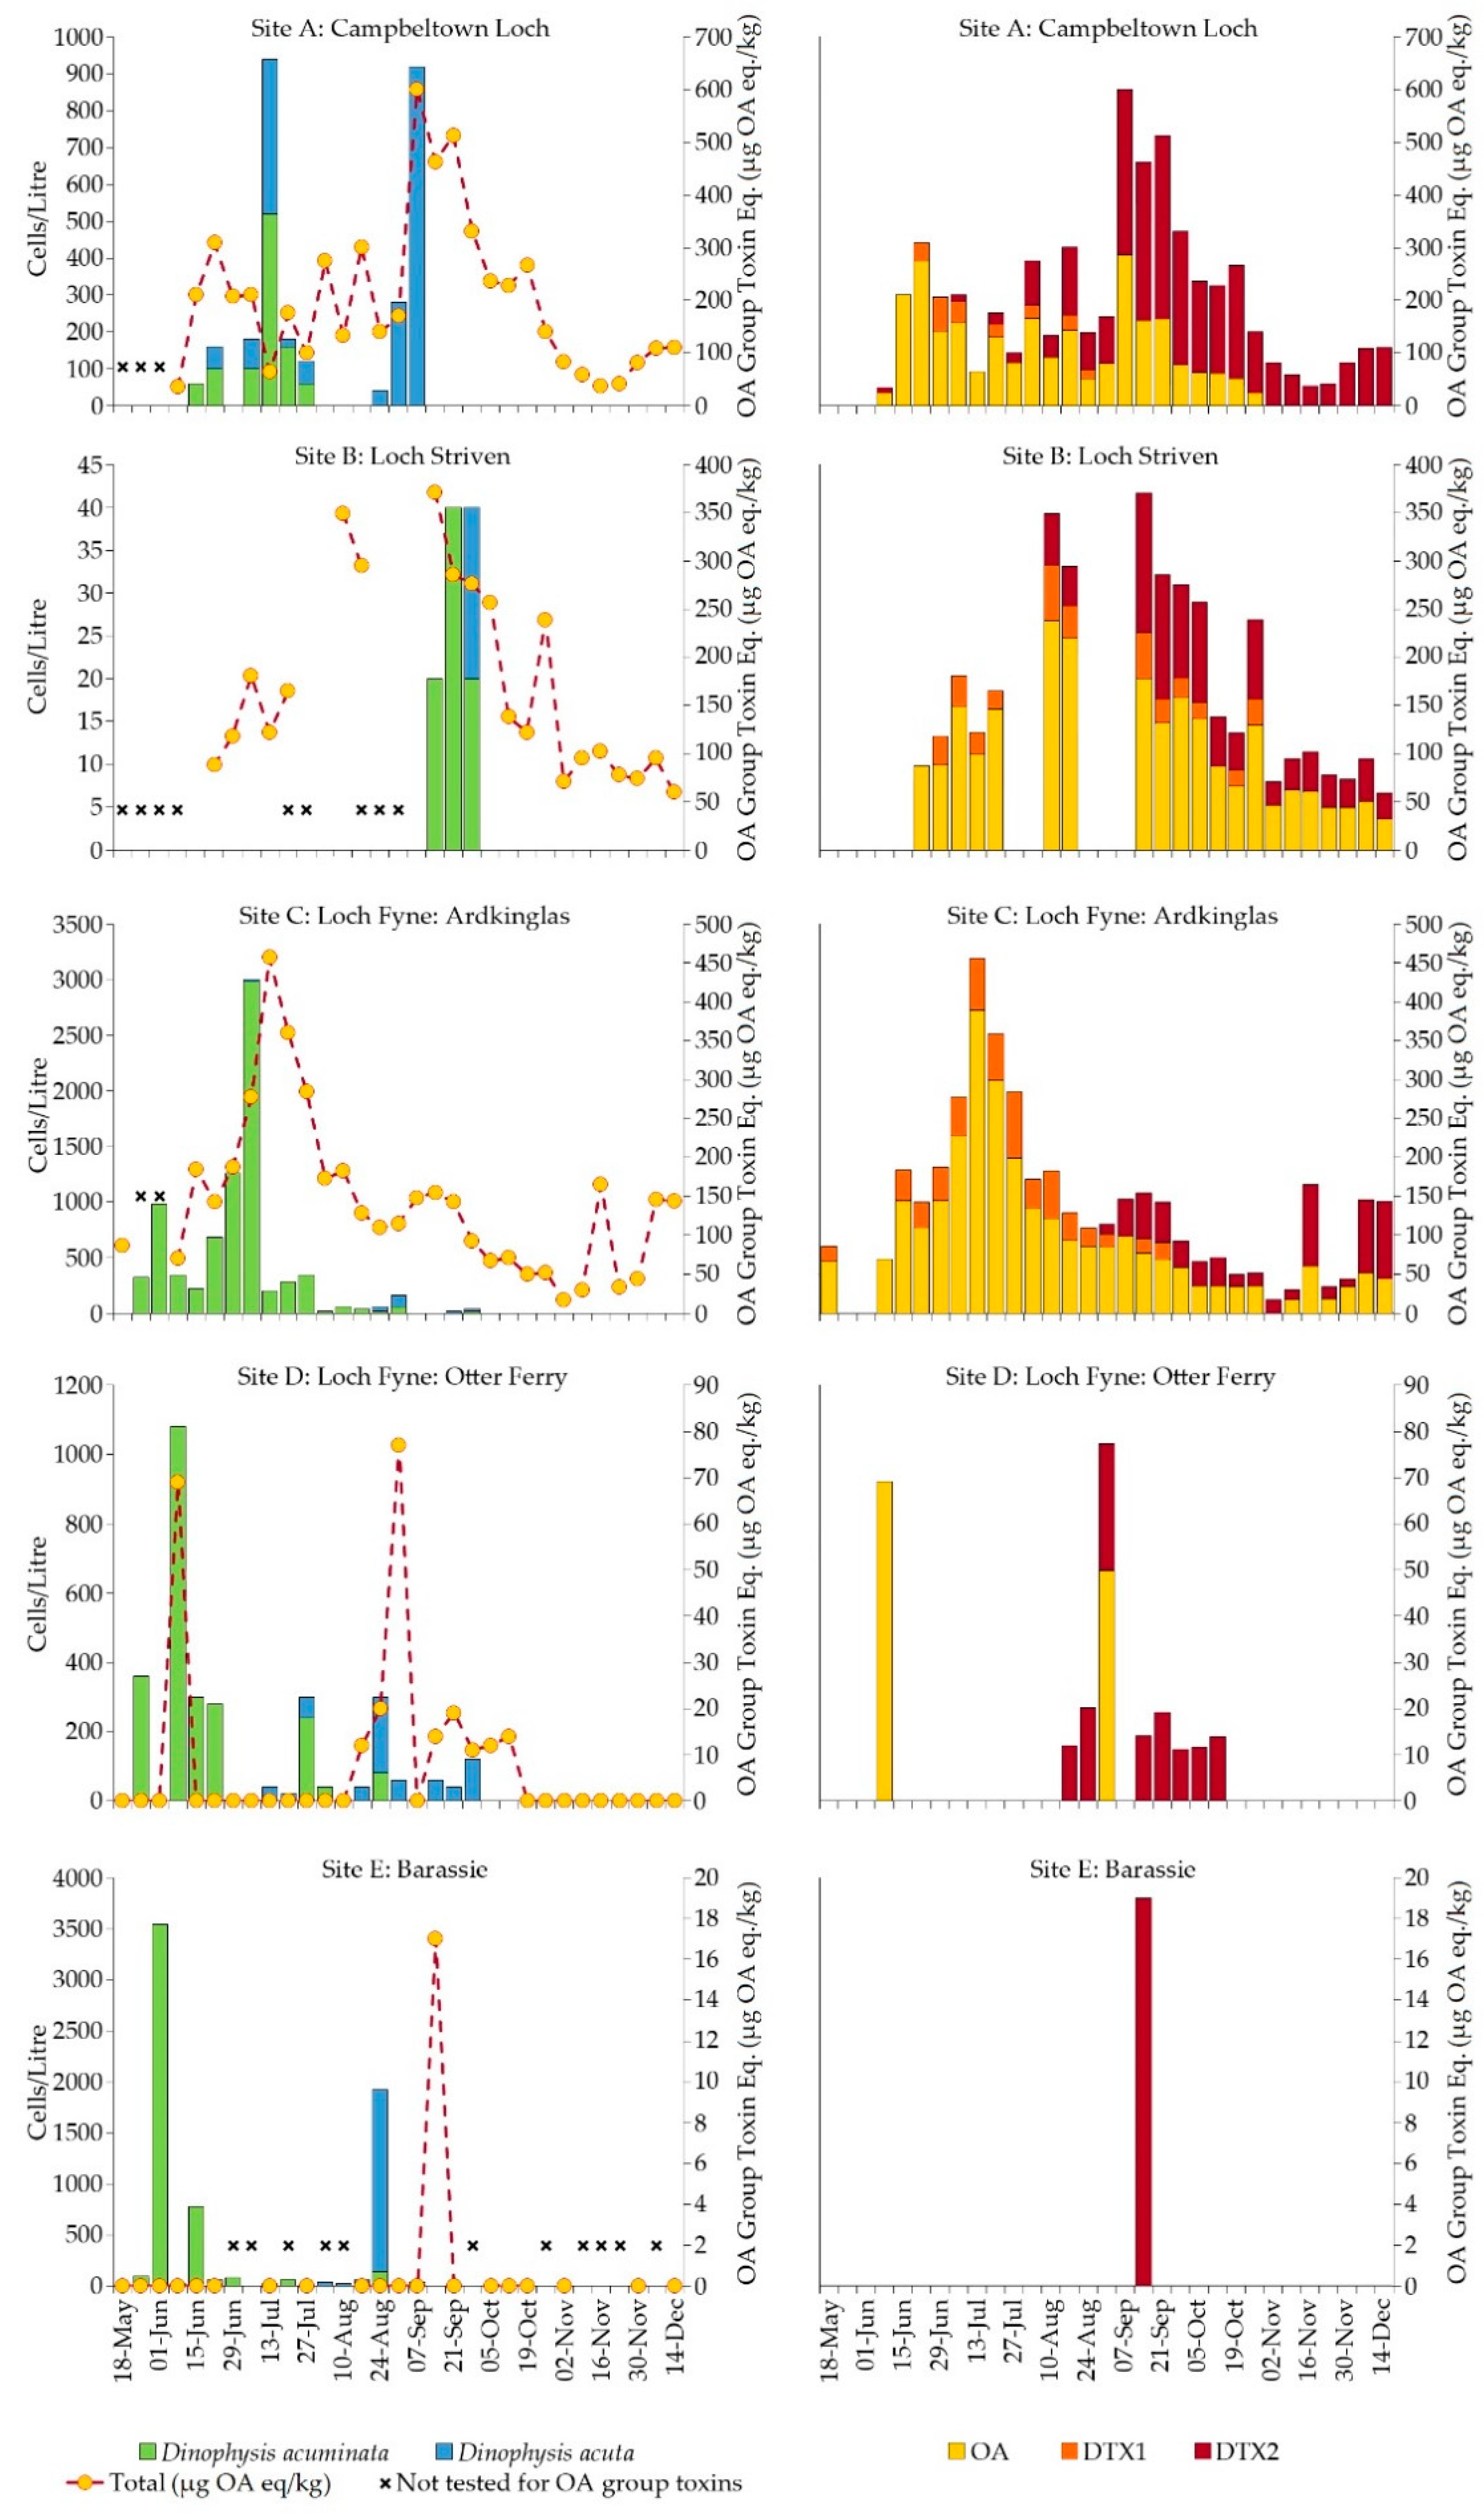
2.2. Firth of Clyde
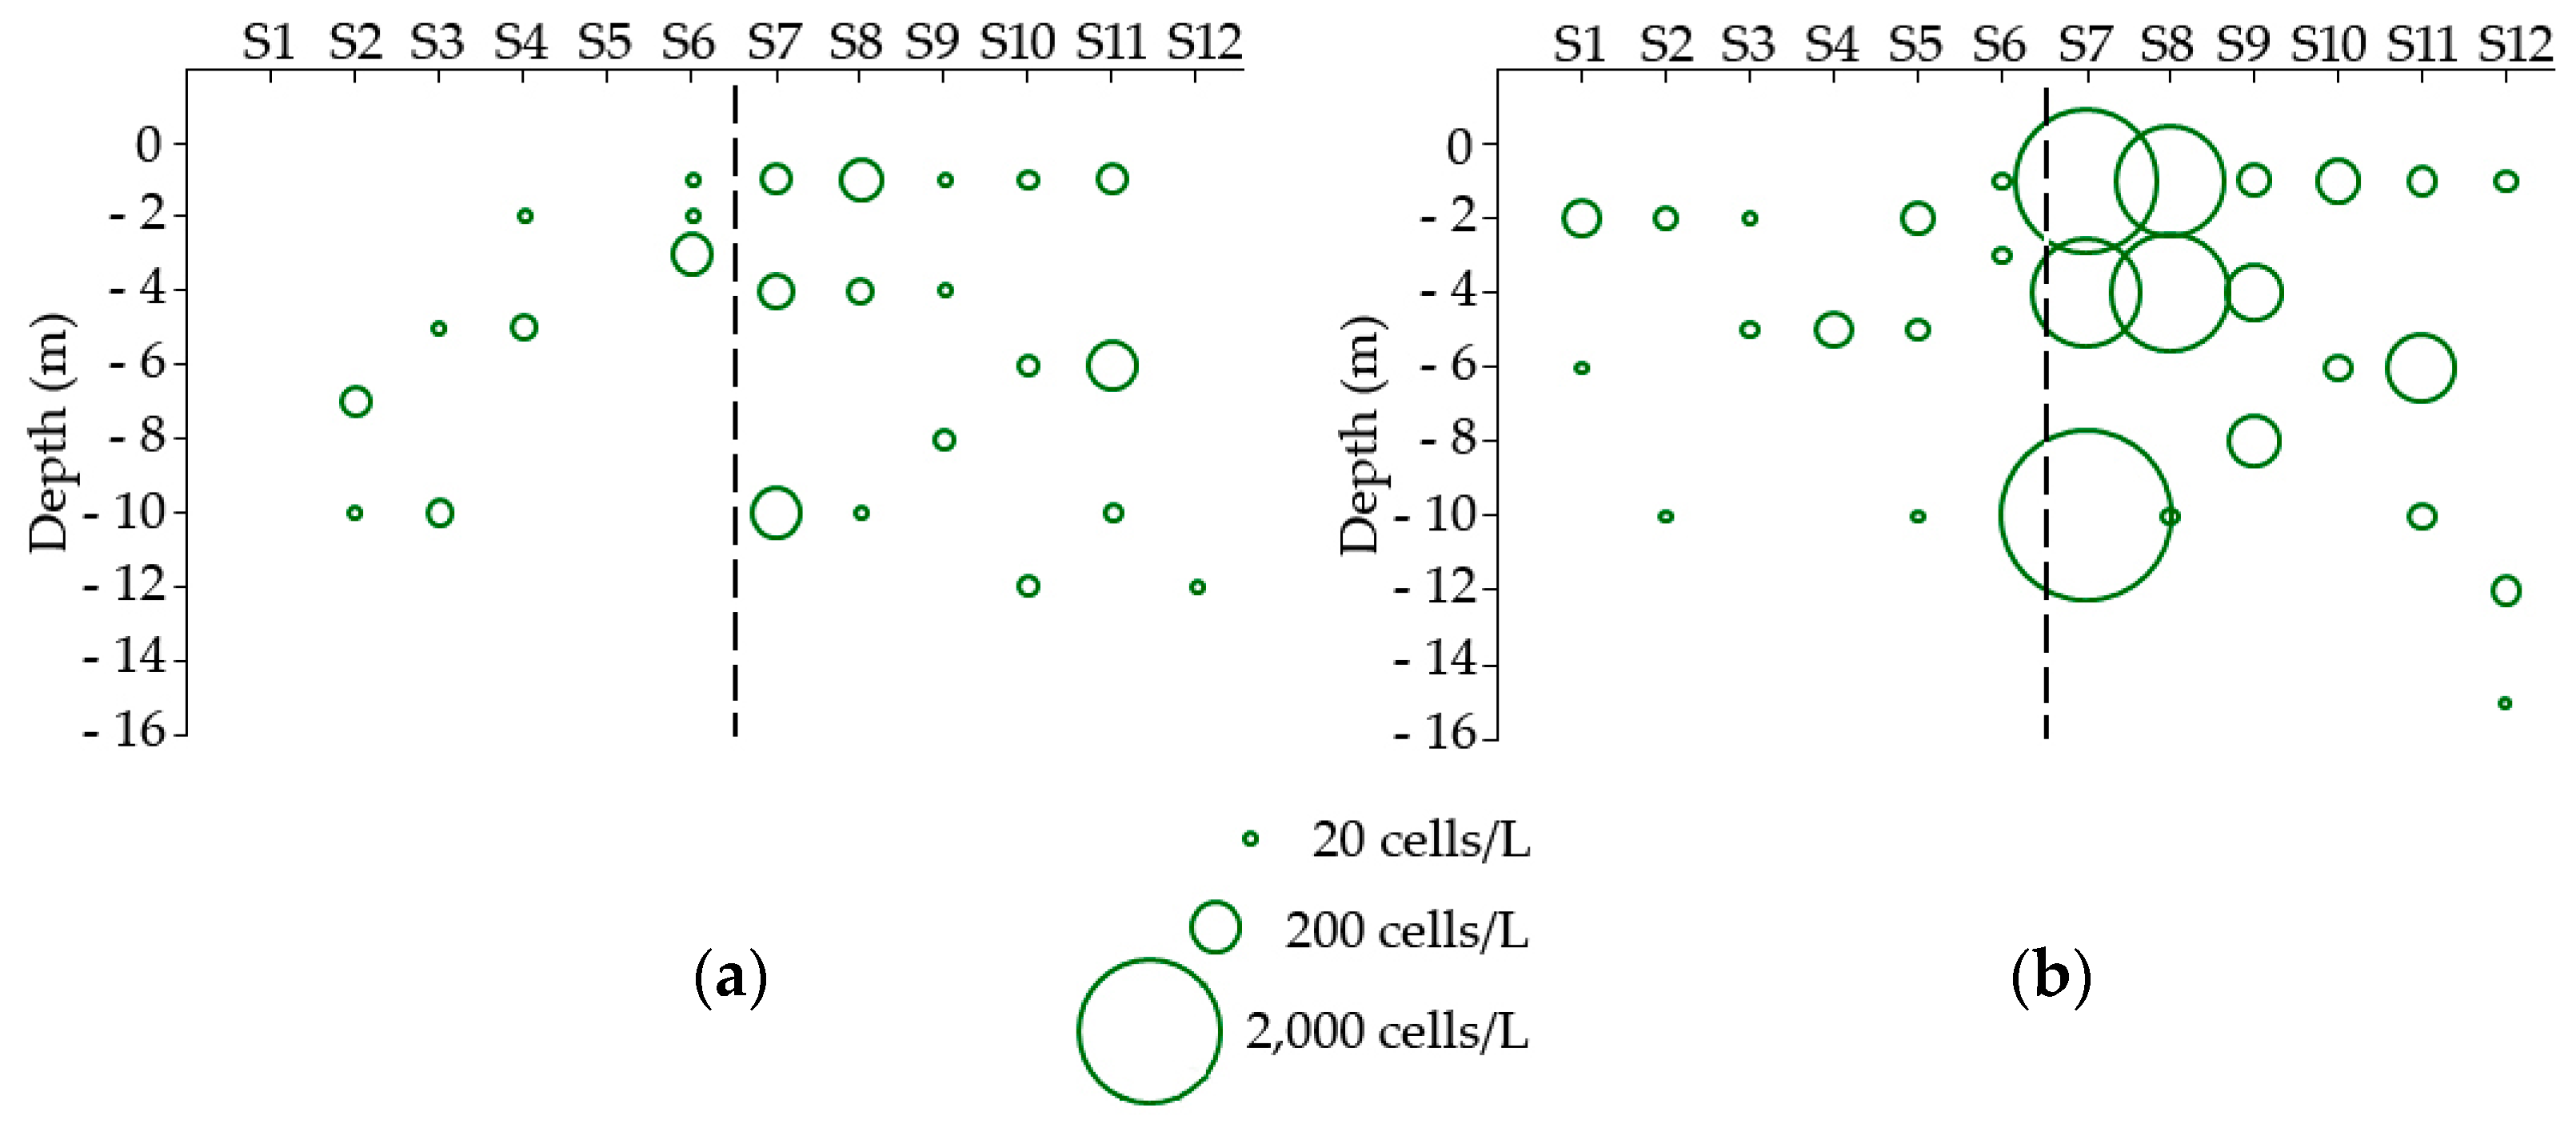
2.2.1. Dinophysis Abundance
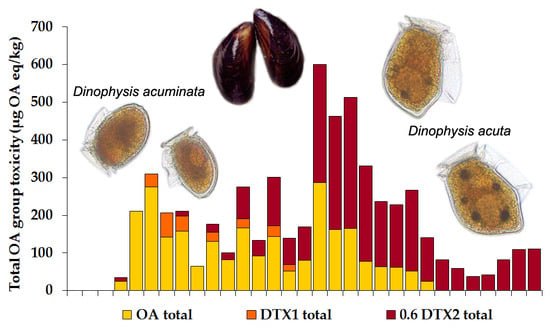
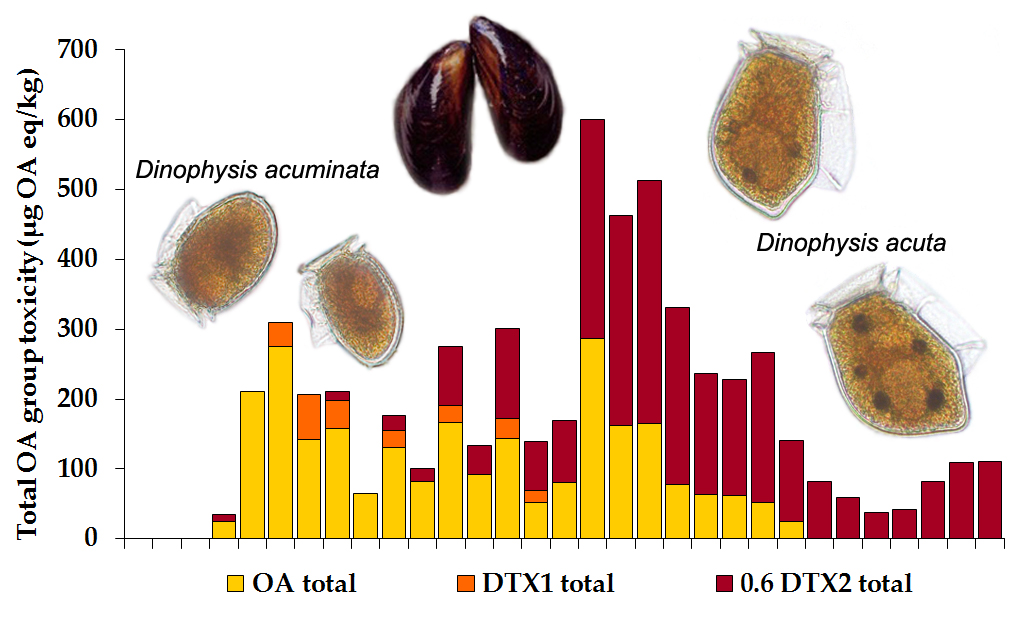
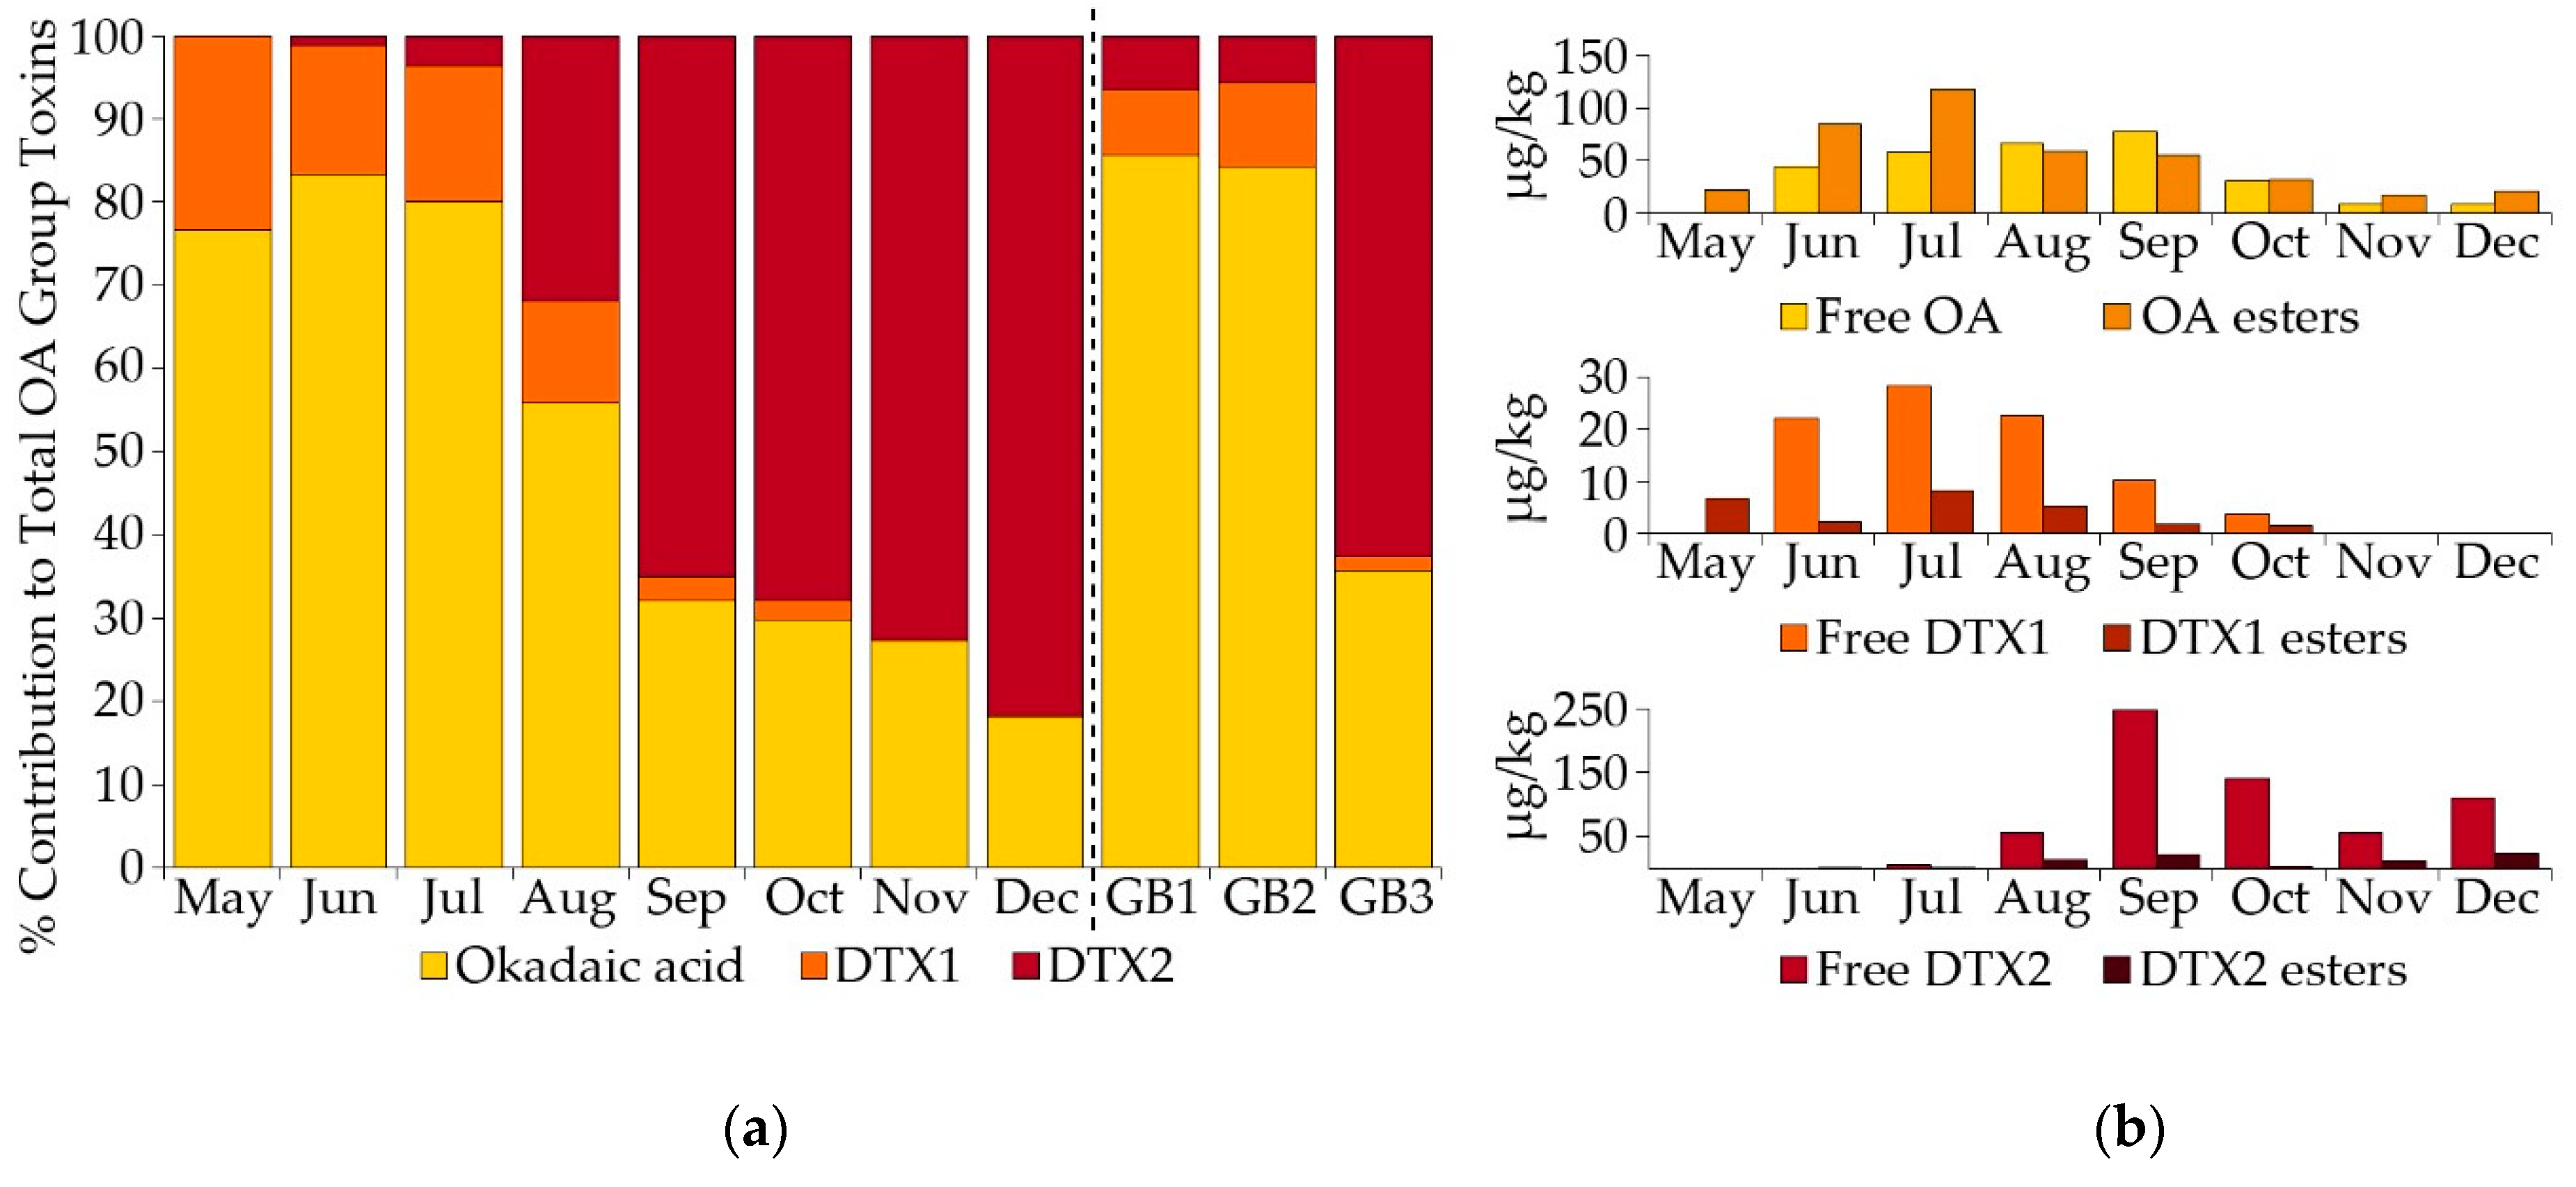
2.2.2. Okadaic Acid Group Equivalent Toxicity and Toxin Concentration in Shellfish
3. Discussion
3.1. Environmental Influences on Seasonality and Abundance of Dinophysis
3.2. Dinophysis and Toxin Profiles
4. Conclusions
5. Materials and Methods
5.1. Study Areas
5.2. Phytoplankton Samples
5.3. Shellfish Samples
Author Contributions
Funding
Acknowledgments
Conflicts of Interest
References and Notes
- Davidson, K.; Bresnan, E. Shellfish toxicity in UK waters: A threat to human health? Environ. Health 2009, 8, S12. [Google Scholar] [CrossRef] [PubMed]
- Reguera, B.; Riobó, P.; Rodríguez, F.; Díaz, P.A.; Pizarro, G.; Paz, B.; Franco, J.M.; Blanco, J. Dinophysis Toxins: Causative organisms, distribution and fate in shellfish. Mar. Drugs 2014, 12, 394–461. [Google Scholar] [CrossRef] [PubMed]
- Smayda, T.J. Harmful Algal Bloom Communities in Scottish Coastal Waters: Relationship to Fish Farming and Regional Comparisons—A Review. 2006. Available online: http://www.gov.scot/Publications/2006/02/03095327/0 (accessed on 3 February 2006).
- Trainer, V.L.; Moore, L.; Bill, B.D.; Adams, N.G.; Harrington, N.; Borchert, J.; da Silva, D.A.M.; Eberhart, B.-T.L. Diarrhetic shellfish toxins and other lipophilic toxins of human health concern in Washington State. Mar. Drugs 2013, 11, 1815–1835. [Google Scholar] [CrossRef] [PubMed]
- Scoging, A.; Bahl, M. Diarrhetic shellfish poisoning in the UK. Lancet 1998, 352, 117. [Google Scholar] [CrossRef]
- Whittle, K.; Gallacher, S. Marine toxins. Br. Med. Bull. 2000, 56, 236–253. [Google Scholar] [CrossRef] [PubMed]
- Hinder, S.L.; Hays, G.C.; Brooks, C.J.; Davies, A.P.; Edwards, M.; Walne, A.W.; Gravenor, M.B. Toxic marine microalgae and shellfish poisoning in the British Isles: History, review of epidemiology and future implications. Environ. Health 2011, 10. [Google Scholar] [CrossRef] [PubMed]
- McDougall, S.; Midgley, P. The Scottish live bivalve mollusc monitoring programme and Enforcement. Scottish food advisory committee report 2010. FSAS 11/08/01 19 pp.
- European food safety Authority. Opinion of the Scientific Panel on Contaminants in the Food chain on a request from the European Commission on marine biotoxins in shellfish—Okadaic acid and analogues. EFSA J. 2008, 589, 1–62. [Google Scholar]
- Whyte, C.; Swan, S.; Davidson, K. Changing wind patterns linked to unusually high Dinophysis blooms around the Shetland Islands, Scotland. Harmful Algae 2014, 39, 365–373. [Google Scholar] [CrossRef]
- European Commission. Regulation (EC) No. 854/2004 of the European Parliament and of the Council of 29 April 2004 laying down specific rules for the organisation of official controls on products of animal origin intended for human consumption. Off. J. Eur. Union 2004, Annex II, Chapter II, B, 1c and 4a.
- Managing Shellfish Toxin Risks: Guidance For Harvesters and Processors. Available online: http://www.foodstandards.gov.scot/publications-and-research/managing-shellfish-toxin-risks-for-harvesters-and-processors (accessed on 30 May 2018).
- Bresnan, E.; Fryer, R.; Hart, M.; Percy, L. Correlation between algal presence in water and toxin presence in shellfish. Fish. Res. Serv. Contract Rep. 2005, 4, 5–27. [Google Scholar]
- Gerssen, A.; Mulder, P.P.J.; McElhinney, M.A.; de Boer, J. Liquid chromatography-tandem mass spectrometry for the detection of marine lipophilic toxins under alkaline conditions. J. Chromatogr. A. 2009, 1216, 1421–1430. [Google Scholar] [CrossRef] [PubMed]
- Stobo, L.A.; Lacaze, J.-P.C.L.; Scott, A.C.; Petrie, J.; Turrell, E.A. Surveillance of algal toxins in shellfish from Scottish waters. Toxicon 2008, 51, 635–648. [Google Scholar] [CrossRef] [PubMed]
- Dhanji-Rapkova, M.; O’Neill, A.; Maskrey, B.H.; Coates, L.; Teixeira Alves, M.; Kelly, R.J.; Hatfield, R.G.; Rowland-Pilgrim, S.J.; Lewis, A.M.; Algoet, M.; et al. Variability and profiles of lipophilic toxins in bivalves from Great Britain during five and a half years of monitoring: Okadaic acid, dinophysis toxins and pectenotoxins. Harmful Algae 2018, 77, 66–80. [Google Scholar] [CrossRef] [PubMed]
- Edvardsen, B.; Shalchian-Tabrizi, K.; Jakobsen, K.S.; Medlin, L.K.; Dahl, E.; Brubak, S.; Paasche, E. Genetic variability and molecular phylogeny of Dinophysis species (Dinophyceae) from Norwegian waters inferred from single cell analysis of rDNA. J. Phycol. 2003, 39, 395–408. [Google Scholar] [CrossRef]
- Stern, R.F.; Amorim, A.L.; Bresnan, E. Diversity and plastid types in Dinophysis acuminata complex (Dinophyceae) in Scottish waters. Harmful Algae 2014, 39, 223–231. [Google Scholar] [CrossRef]
- Reguera, B.; Velo-Suárez, L.; Raine, R.; Park, M.G. Harmful Dinophysis species: A review. Harmful Algae 2012, 14, 87–106. [Google Scholar] [CrossRef]
- Reguera, B.; González-Gil, S. Small cell and intermediate cell formation in species of Dinophysis (Dinophyceae, Dinophysiales). J. Phycol. 2001, 37, 318–333. [Google Scholar] [CrossRef]
- Moita, M.T.; Sobrinho-Gonçalves, L.; Oliveira, P.B.; Palma, S.; Falcão, M. A bloom of Dinophysis acuta in a thin layer off North-West Portugal. Afr. J. Mar. Sci. 2006, 28, 265–269. [Google Scholar] [CrossRef]
- González-Gil, S.; Pizarro, G.; Paz, B.; Velo-Suárez, L.; Reguera, B. Considerations on the toxigenic nature and prey sources of Phalacroma rotundatum. Aquat. Microb. Ecol. 2011, 64, 197–203. [Google Scholar] [CrossRef]
- Foden, J.; Purdie, D.A.; Morris, S.; Nascimento, S. Epiphytic abundance and toxicity of Prorocentrum lima populations in the Fleet Lagoon, UK. Harmful Algae 2005, 4, 1063–1074. [Google Scholar] [CrossRef]
- Paterson, R.F.; McNeill, S.; Mitchell, E.; Adams, T.; Swan, S.C.; Clarke, D.; Miller, P.I.; Bresnan, E.; Davidson, K. Environmental control of harmful dinoflagellates and diatoms in a fjordic system. Harmful Algae 2017, 69, 1–17. [Google Scholar] [CrossRef] [PubMed]
- Morris, S.; Stubbs, B.; Brunet, C.; Davidson, K. Spatial distributions and temporal profiles of harmful phytoplankton and lipophilic toxins in Common mussels and Pacific oysters from four Scottish shellfish production areas (2009). Final project report to the Food Standards Agency in Scotland, 2010; p. 57.
- Johnson, S.; Harrison, K.; Turner, A.D. Application of rapid test kits for the determination of Diarrhetic Shellfish Poisoning (DSP) toxins in bivalve molluscs from Great Britain. Toxicon 2016, 111, 121–129. [Google Scholar] [CrossRef] [PubMed]
- Escalera, L.; Pazos, Y.; Doval, M.D.; Reguera, B. A comparison of integrated and discrete depth sampling for monitoring toxic species of Dinophysis. Mar. Pollut. Bull. 2012, 64, 106–113. [Google Scholar] [CrossRef] [PubMed]
- Moita, M.T.; Pazos, Y.; Rocha, C.; Nolasco, R.; Oliveira, P.B. Toward predicting Dinophysis blooms off NW Iberia: A decade of events. Harmful Algae 2016, 53, 17–32. [Google Scholar] [CrossRef] [PubMed]
- Díaz, P.A.; Reguera, B.; Ruiz-Villarreal, M.; Pazos, Y.; Velo-Suárez, L.; Berger, H.; Sourisseau, M. Climate variability and oceanographic settings associated with interannual variability in the initiation of Dinophysis acuminata blooms. Mar. Drugs 2013, 11, 2964–2981. [Google Scholar] [CrossRef] [PubMed]
- Escalera, L.; Reguera, B.; Pazos, Y.; Moroño, A.; Cabanas, J.M. Are different species of Dinophysis selected by climatological conditions? Afr. J. Mar. Sci. 2006, 28, 283–288. [Google Scholar] [CrossRef]
- Díaz, P.A.; Ruiz-Villarreal, M.; Pazos, Y.; Moita, T.; Reguera, B. Climate variability and Dinophysis acuta blooms in an upwelling system. Harmful Algae 2016, 53, 145–159. [Google Scholar] [CrossRef] [PubMed]
- Jones, K.J.; Gowen, R.J. Influence of stratification and irradiance regime on summer phytoplankton composition in coastal and shelf seas of the British Isles. Estuarine Coast. Shelf Sci. 1990, 30, 557–567. [Google Scholar] [CrossRef]
- Midgley, R.P.; Simpson, J.H.; Hyder, P.; Rippeth, T.P. Seasonal cycle of vertical structure and deep waters renewal in the Clyde Sea. Estuarine Coast. Shelf Sci. 2001, 53, 813–823. [Google Scholar] [CrossRef]
- Edwards, M.; Johns, D.G.; Leterme, S.C.; Svendsen, E.; Richardson, A.J. Regional climate change and harmful algal blooms in the northeast Atlantic. Limnol. Oceanogr. 2006, 51, 820–829. [Google Scholar] [CrossRef]
- Naustvoll, L.J.; Gustad, E.; Dahl, E. Monitoring of Dinophysis species and diarrhetic shellfish toxins in Flødevigen Bay, Norway: Inter-annual variability over a 25-year time-series. Food Addit. Contam. Part A 2012, 29, 1605–1615. [Google Scholar] [CrossRef] [PubMed]
- Gobler, C.J.; Doherty, O.M.; Hattenrath-Lehmann, T.K.; Griffith, A.W.; Kang, Y.; Litaker, R.W. Ocean warming since 1982 has expanded the niche of toxic algal blooms in the North Atlantic and North Pacific oceans. Proc. Natl. Acad. Sci. USA 2017, 114, 4975–4980. [Google Scholar] [CrossRef] [PubMed]
- Dees, P.; Bresnan, E.; Dale, A.C.; Edwards, M.; Johns, D.; Mouat, B.; Whyte, C.; Davidson, K. Harmful algal blooms in the Eastern North Atlantic ocean. Proc. Natl. Acad. Sci. USA 2017, 114, 124–126. [Google Scholar] [CrossRef] [PubMed]
- Franks, P.J.S. Sink or swim: Accumulation of biomass at fronts. Mar. Ecol. Prog. Ser. 1992, 82, 1–12. [Google Scholar] [CrossRef]
- Franks, P.J.S. Phytoplankton blooms at fronts: Patterns, scales and physical forcing. Rev. Aquat. Sci. 1992, 6, 121–137. [Google Scholar]
- Raine, R. A review of the biophysical interactions relevant to the promotion of HABs in stratified systems: The case study of Ireland. Deep Sea Res. Part II Top. Stud. Oceanogr. 2014, 101, 21–31. [Google Scholar] [CrossRef]
- Smayda, T.J.; Reynolds, C.S. Community Assembly in Marine Phytoplankton: Application of Recent Models to Harmful Dinoflagellate Blooms. J. Plankton Res. 2001, 23, 447–461. [Google Scholar] [CrossRef]
- Raine, R.; Cosgrove, S.; Fennell, S.; Gregory, C.; Barnett, M.; Purdie, D.; Cave, R. Origins of Dinophysis blooms which impact Irish aquaculture. In Marine and Freshwater Harmful Algae, Proceedings of the 17th International Conference on Harmful Algae, Florianópolis, Brazil, 9–14 October 2016; Proença, L.A.O., Hallegraeff, G.M., Eds.; International Society for the Study of Harmful Algae: Paris, France, 2017; pp. 46–49. [Google Scholar]
- Farrell, H.; Gentien, P.; Fernand, L.; Lunven, M.; Reguera, B.; González-Gil, S.; Raine, R. Scales characterising a high density thin layer of Dinophysis acuta Ehrenberg and its transport within a coastal jet. Harmful Algae 2012, 15, 36–46. [Google Scholar] [CrossRef]
- Davidson, K.; Anderson, D.M.; Mateus, M.; Reguera, B.; Silke, J.; Sourisseau, M.; Maguire, J. Forecasting the risk of harmful algal blooms: Preface to the Asimuth special issue. Harmful Algae 2016, 53, 1–7. [Google Scholar] [CrossRef] [PubMed]
- Svensson, S. Depuration of Okadaic acid (diarrhetic shellfish toxin) in mussels, Mytilus edulis (Linnaeus), feeding on different quantities of nontoxic algae. Aquaculture 2003, 218, 277–291. [Google Scholar] [CrossRef]
- Bricelj, V.M.; Shumway, S.E. Paralytic shellfish toxins in bivalve molluscs: Occurrence, transfer kinetics and biotransformation. Rev. Fish. Sci. 1998, 6, 315–383. [Google Scholar] [CrossRef]
- Sidari, L.; Nichetto, P.; Cok, S.; Sosa, S.; Tubaro, A.; Honsell, G.; Della Loggia, R. Phytoplankton selection by mussels and diarrhetic shellfish poisoning. Mar. Biol. 1998, 131, 103–111. [Google Scholar] [CrossRef]
- Nielsen, L.T.; Hansen, P.J.; Krock, B.; Vismann, B. Accumulation, transformation and breakdown of DSP toxins from the toxic dinoflagellate Dinophysis acuta in blue mussels, Mytilus edulis. Toxicon 2016, 117, 84–93. [Google Scholar] [CrossRef] [PubMed]
- Tong, M.; Smith, J.L.; Richlen, M.; Steidinger, K.A.; Kulis, D.M.; Fux, E.; Anderson, D.M. Characterization and comparison of toxin-producing isolates of Dinophysis acuminata from New England and Canada. J. Phycol. 2015, 51, 66–81. [Google Scholar] [CrossRef] [PubMed]
- Hattenrath-Lehmann, T.K.; Marcoval, M.A.; Mittlesdorf, H.; Goleski, J.A.; Wang, Z.; Haynes, B.; Morton, S.L.; Gobler, C.J. Nitrogenous nutrients promote the growth and toxicity of Dinophysis acuminata during estuarine bloom events. PLoS ONE 2015, 10. [Google Scholar] [CrossRef] [PubMed]
- Pizarro, G.; Escalera, L.; González-Gil, S.; Franco, J.M.; Reguera, B. Growth, behaviour and cell toxin quota of Dinophysis acuta during a daily cycle. Mar. Ecol. Prog. Ser. 2008, 353, 89–105. [Google Scholar] [CrossRef]
- Pizarro, G.; Paz, B.; González-Gil, S.; Franco, J.M.; Reguera, B. Seasonal variability of lipophilic toxins during a Dinophysis acuta bloom in Western Iberia: Differences between picked cells and plankton concentrates. Harmful Algae 2009, 8, 926–937. [Google Scholar] [CrossRef]
- Mafra, L.L.; Ribas, T.; Alves, T.P.; Proença, L.A.O.; Schramm, M.A.; Uchida, H.; Suzuki, T. Differential okadiac acid accumulation and detoxification by oysters and mussels during natural and simulated Dinophysis blooms. Fish. Sci. 2015, 81, 749–762. [Google Scholar] [CrossRef]
- Vale, P. Differential dynamics of dinophysistoxins and pectenotoxins between blue mussel and common cockle: A phenomenon originating from the complex toxin profile of Dinophysis acuta. Toxicon 2004, 44, 123–134. [Google Scholar] [CrossRef] [PubMed]
- Vale, P. Differential dynamics of dinophysistoxins and pectenotoxins, part II: Offshore bivalve species. Toxicon 2006, 47, 163–173. [Google Scholar] [CrossRef] [PubMed]
- Lindegarth, S.; Torgersen, T.; Lundve, B.; Sandvik, M. Differential retention of okadaic acid (OA) group toxins and pectenotoxins (PTX) in the blue mussel, Mytilus edulis (L.) and European flat oyster, Ostrea edulis (L.). J. Shellfish Res. 2009, 28, 313–323. [Google Scholar] [CrossRef]
- García-Altares, M.; Casanova, A.; Fernández-Tejedor, M.; Diogène, J.; de la Iglesia, P. Bloom of Dinophysis spp. dominated by D. sacculus and its related diarrhetic shellfish poisoning (DSP) outbreak in Alfacs Bay (Catalonia, NW Mediterranean Sea): Identification of DSP toxins in phytoplankton, shellfish and passive samplers. Reg. Stud. Mar. Sci. 2016, 6, 19–28. [Google Scholar] [CrossRef]
- Hattenrath-Lehmann, T.K.; Lusty, M.W.; Wallace, R.B.; Haynes, B.; Wang, Z.; Broadwater, M.; Deeds, J.R.; Morton, S.L.; Hastback, W.; Porter, L.; et al. Evaluation of rapid, early warning approaches to track shellfish toxins associated with Dinophysis and Alexandrium blooms. Mar. Drugs 2018, 16. [Google Scholar] [CrossRef] [PubMed]
- MacKenzie, L.; Beuzenberg, V.; Holland, P.; McNabb, P.; Suzuki, T.; Selwood, A. Pectenotoxin and okadaic acid-based toxin profiles in Dinophysis acuta and Dinophysis acuminata from New Zealand. Harmful Algae 2005, 4, 75–85. [Google Scholar] [CrossRef]
- Suzuki, T.; Miyazono, A.; Baba, K.; Sugawara, R.; Kamiyama, T. LC-MS/MS analysis of okadaic acid analogues and other lipophilic toxins in single-cell isolates of several Dinophysis species collected in Hokkaido, Japan. Harmful Algae 2009, 8, 233–238. [Google Scholar] [CrossRef]
- Kamiyama, T.; Suzuki, T. Production of dinophysistoxin-1 and pectenotoxin-2 by a culture of Dinophysis acuminata (Dinophyceae). Harmful Algae 2009, 8, 312–317. [Google Scholar] [CrossRef]
- Blanco, J.; Álvarez, G.; Uribe, E. Identification of pectenotoxins in plankton, filter feeders and isolated cells of a Dinophysis acuminata with an atypical toxin profile from Chile. Toxicon 2007, 49, 710–716. [Google Scholar] [CrossRef] [PubMed]
- Fux, E.; Smith, J.L.; Tong, M.; Guzmán, L.; Anderson, D.M. Toxin profiles of five geographical isolates of Dinophysis spp. from North and South America. Toxicon 2011, 57, 275–287. [Google Scholar] [CrossRef] [PubMed]
- Fabro, E.; Almandoz, G.O.; Ferrario, M.; Tillmann, U.; Cembella, A.; Krock, B. Distribution of Dinophysis species and their association with lipophilic phycotoxins in plankton from the Argentine Sea. Harmful Algae 2016, 59, 31–41. [Google Scholar] [CrossRef] [PubMed]
- Lindahl, O.; Lundve, B.; Johansen, M. Toxicity of Dinophysis spp. in relation to population density and environmental conditions on the Swedish west coast. Harmful Algae 2007, 6, 218–231. [Google Scholar] [CrossRef]
- Jørgensen, K.; Andersen, P. Relation between the concentration of Dinophysis acuminata and diarrheic shellfish poisoning toxins in blue mussels (Mytilus edulis) during a toxic episode in the Limfjord (Denmark), 2006. J. Shellfish Res. 2007, 26, 1081–1087. [Google Scholar] [CrossRef]
- Nielsen, L.T.; Krock, B.; Hansen, P.J. Effects of light and food availability on toxin production, growth and photosynthesis in Dinophysis acuminata. Mar. Ecol. Prog. Ser. 2012, 471, 37–50. [Google Scholar] [CrossRef]
- Fernández, M.L.; Reguera, B.; Ramilo, I.; Martinez, A. Toxin content of Dinophysis acuminata, D. acuta and D. caudata from the Galician Rías Baixas. In Proceedings of the Ninth Conference on Harmful Algal Blooms, Hobart, Australia, 7–11 February 2000; Hallegraeff, G.M., Blackburn, S.I., Bolch, C.J., Lewis, R.J., Eds.; Intergovernmental Oceanographic Commission of UNESCO: Paris, France, 2001; pp. 360–363. [Google Scholar]
- Vale, P.; de M Sampayo, M.A. Dinophysistoxin-2: A rare diarrhoeic toxin associated with Dinophysis acuta. Toxicon 2000, 38, 1599–1606. [Google Scholar] [CrossRef]
- Marcaillou, C.; Gentien, P.; Lunven, M.; Le Grand, J.; Mondeguer, F.; Danilou, M.M.; Crassous, M.P.; Youenou, A. Dinophysis acuminata distribution and specific toxin content in relation to mussel contamination. In Proceedings of the Ninth Conference on Harmful Algal Blooms, Hobart, Australia, 7–11 February 2000; Hallegraeff, G.M., Blackburn, S.I., Bolch, C.J., Lewis, R.J., Eds.; Intergovernmental Oceanographic Commission of UNESCO: Paris, France, 2001; pp. 356–358. [Google Scholar]
- James, K.J.; Bishop, A.G.; Healy, B.M.; Roden, C.; Sherlock, I.R.; Twohig, M.; Draisci, R.; Giannetti, L.; Lucentini, L. Efficient isolation of the rare diarrhoeic shellfish toxin, dinophysistoxin-2, from marine phytoplankton. Toxicon 1999, 37, 343–357. [Google Scholar] [CrossRef]
- Puente, P.F.; Sáez, M.J.F.; Hamilton, B.; Furey, A.; James, K.J. Studies of polyether toxins in the marine phytoplankton, Dinophysis acuta, in Ireland using multiple tandem mass spectrometry. Toxicon 2004, 44, 919–926. [Google Scholar] [CrossRef] [PubMed]
- Fux, E.; Gonzalez-Gil, S.; Lunven, M.; Gentien, P.; Hess, P. Production of diarrhetic shellfish poisoning toxins and pectenotoxins at depths within and below the euphotic zone. Toxicon 2010, 56, 1487–1496. [Google Scholar] [CrossRef] [PubMed]
- Morris, S.; Stubbs, B.; Cook, A.; Milligan, S.; Quilliam, M.A. The First Report of the Co-Occurrence of Pectenotoxins, Okadaic Acid and Dinophysistoxin-2 in Shellfish from England. Cefas Publication. 2004. Available online: https://www.cefas.co.uk/publications/posters/30830web.pdf (accessed on 2 June 2018).
- Edwards, A.; Sharples, F. Scottish sea lochs: A catalogue. Scottish Marine Biological Association. Nat. Conserv. Counc. 1986, 110, 250. [Google Scholar]
- Bresnan, E.; Cook, K.B.; Hughes, S.L.; Hay, S.J.; Smith, K.; Walsham, P.; Webster, L. Seasonality of the plankton community at an east and west coast monitoring site in Scottish waters. J. Sea Res. 2015, 105, 16–29. [Google Scholar] [CrossRef]
- O’Brien, T.D.; Wiebe, P.H.; Falkenhaug, T. ICES Cooperative Research Report. 2013. Available online: http://ices.dk/sites/pub/PublicationReports/CooperativeResearchReport(CRR)/crr318/CRR318Zooplankton.pdf (accessed on 12 June 2018).
- Bresnan, E.; Cook, K.; Hindson, J.; Hughes, S.; Lacaze, J.-P.; Walsham, P.; Webster, L.; Turrell, W.R. The Scottish Coastal Observatory 1997–2013: Part 1—Executive Summary. Available online: https://www.gov.scot/Resource/0051/00513827.pdf (accessed on 26 September 2018).
- Edwards, A.; Baxter, M.S.; Ellett, D.J.; Martin, J.H.A.; Meldrum, D.T.; Griffiths, C.R. Clyde Sea hydrography. Proc. R. Soc. Edinburgh Sect. B Biol. Sci. 1986, 90, 67–83. [Google Scholar]
- Utermöhl, H. Zur Vervollkommnung der quantitativen Phytoplankton-Methodik. Mitt. Int. Ver. Theor. Angew. Limnol. 1958, 9, 1–3. [Google Scholar]
- In-House Validation of an LC-MS/MS Method for the Determination of Lipophilic Toxins in Shellfish Species Typically Tested in the United Kingdom. Available online: https://www.food.gov.uk/sites/default/files/media/document/fs235004_0.pdf (accessed on 26 September 2018).
- EU-Harmonised Standard Operating Procedure for Determination of Lipophilic Marine Biotoxins in Molluscs by LC-MS/MS. Available online: http://www.aecosan.msssi.gob.es/AECOSAN/docs/documentos/laboratorios/LNRBM/ARCHIVO2EU-Harmonised-SOP-LIPO-LCMSMS_Version5.pdf (accessed on 8 June 2018).
- Turner, A.D.; Goya, A.B. Occurrence and profiles of lipophilic toxins in shellfish harvested from Argentina. Toxicon 2015, 102, 32–42. [Google Scholar] [CrossRef] [PubMed]


| Site | Shellfish Species | Phytoplankton Samples | Tissue Samples | OA group Equiv. Toxicity > MPL |
|---|---|---|---|---|
| (A) Campbeltown Loch | Common mussels | 16 | 28 | 15 |
| (B) Loch Striven | Common mussels | 6 | 22 | 9 |
| (C) Loch Fyne: Ardkinglas | Common mussels | 19 | 29 | 9 |
| (D) Loch Fyne: Otter Ferry | Pacific oysters | 19 | 31 | 0 |
| (E) Barassie | Razor clams | 19 | 20 | 0 |
© 2018 by the authors. Licensee MDPI, Basel, Switzerland. This article is an open access article distributed under the terms and conditions of the Creative Commons Attribution (CC BY) license (http://creativecommons.org/licenses/by/4.0/).
Share and Cite
Swan, S.C.; Turner, A.D.; Bresnan, E.; Whyte, C.; Paterson, R.F.; McNeill, S.; Mitchell, E.; Davidson, K. Dinophysis acuta in Scottish Coastal Waters and Its Influence on Diarrhetic Shellfish Toxin Profiles. Toxins 2018, 10, 399. https://doi.org/10.3390/toxins10100399
Swan SC, Turner AD, Bresnan E, Whyte C, Paterson RF, McNeill S, Mitchell E, Davidson K. Dinophysis acuta in Scottish Coastal Waters and Its Influence on Diarrhetic Shellfish Toxin Profiles. Toxins. 2018; 10(10):399. https://doi.org/10.3390/toxins10100399
Chicago/Turabian StyleSwan, Sarah C., Andrew D. Turner, Eileen Bresnan, Callum Whyte, Ruth F. Paterson, Sharon McNeill, Elaine Mitchell, and Keith Davidson. 2018. "Dinophysis acuta in Scottish Coastal Waters and Its Influence on Diarrhetic Shellfish Toxin Profiles" Toxins 10, no. 10: 399. https://doi.org/10.3390/toxins10100399
APA StyleSwan, S. C., Turner, A. D., Bresnan, E., Whyte, C., Paterson, R. F., McNeill, S., Mitchell, E., & Davidson, K. (2018). Dinophysis acuta in Scottish Coastal Waters and Its Influence on Diarrhetic Shellfish Toxin Profiles. Toxins, 10(10), 399. https://doi.org/10.3390/toxins10100399