Modulation of Gut Microbiota of Overweight Mice by Agavins and Their Association with Body Weight Loss

Abstract
:1. Introduction
2. Materials and Methods
2.1. Animals and Diets
2.2. Agavins and Oligofructose Fructans
2.3. gDNA Extraction
2.4. PCR Amplification of the V4 Region of the Bacterial 16S rRNA Gene
2.5. Amplicon Quantitation, Pooling, and Sequencing
2.6. Sequence Analysis
2.7. LEfSe Analysis
2.8. SCFA and pH Determinations
2.9. Statistical Analysis
3. Results
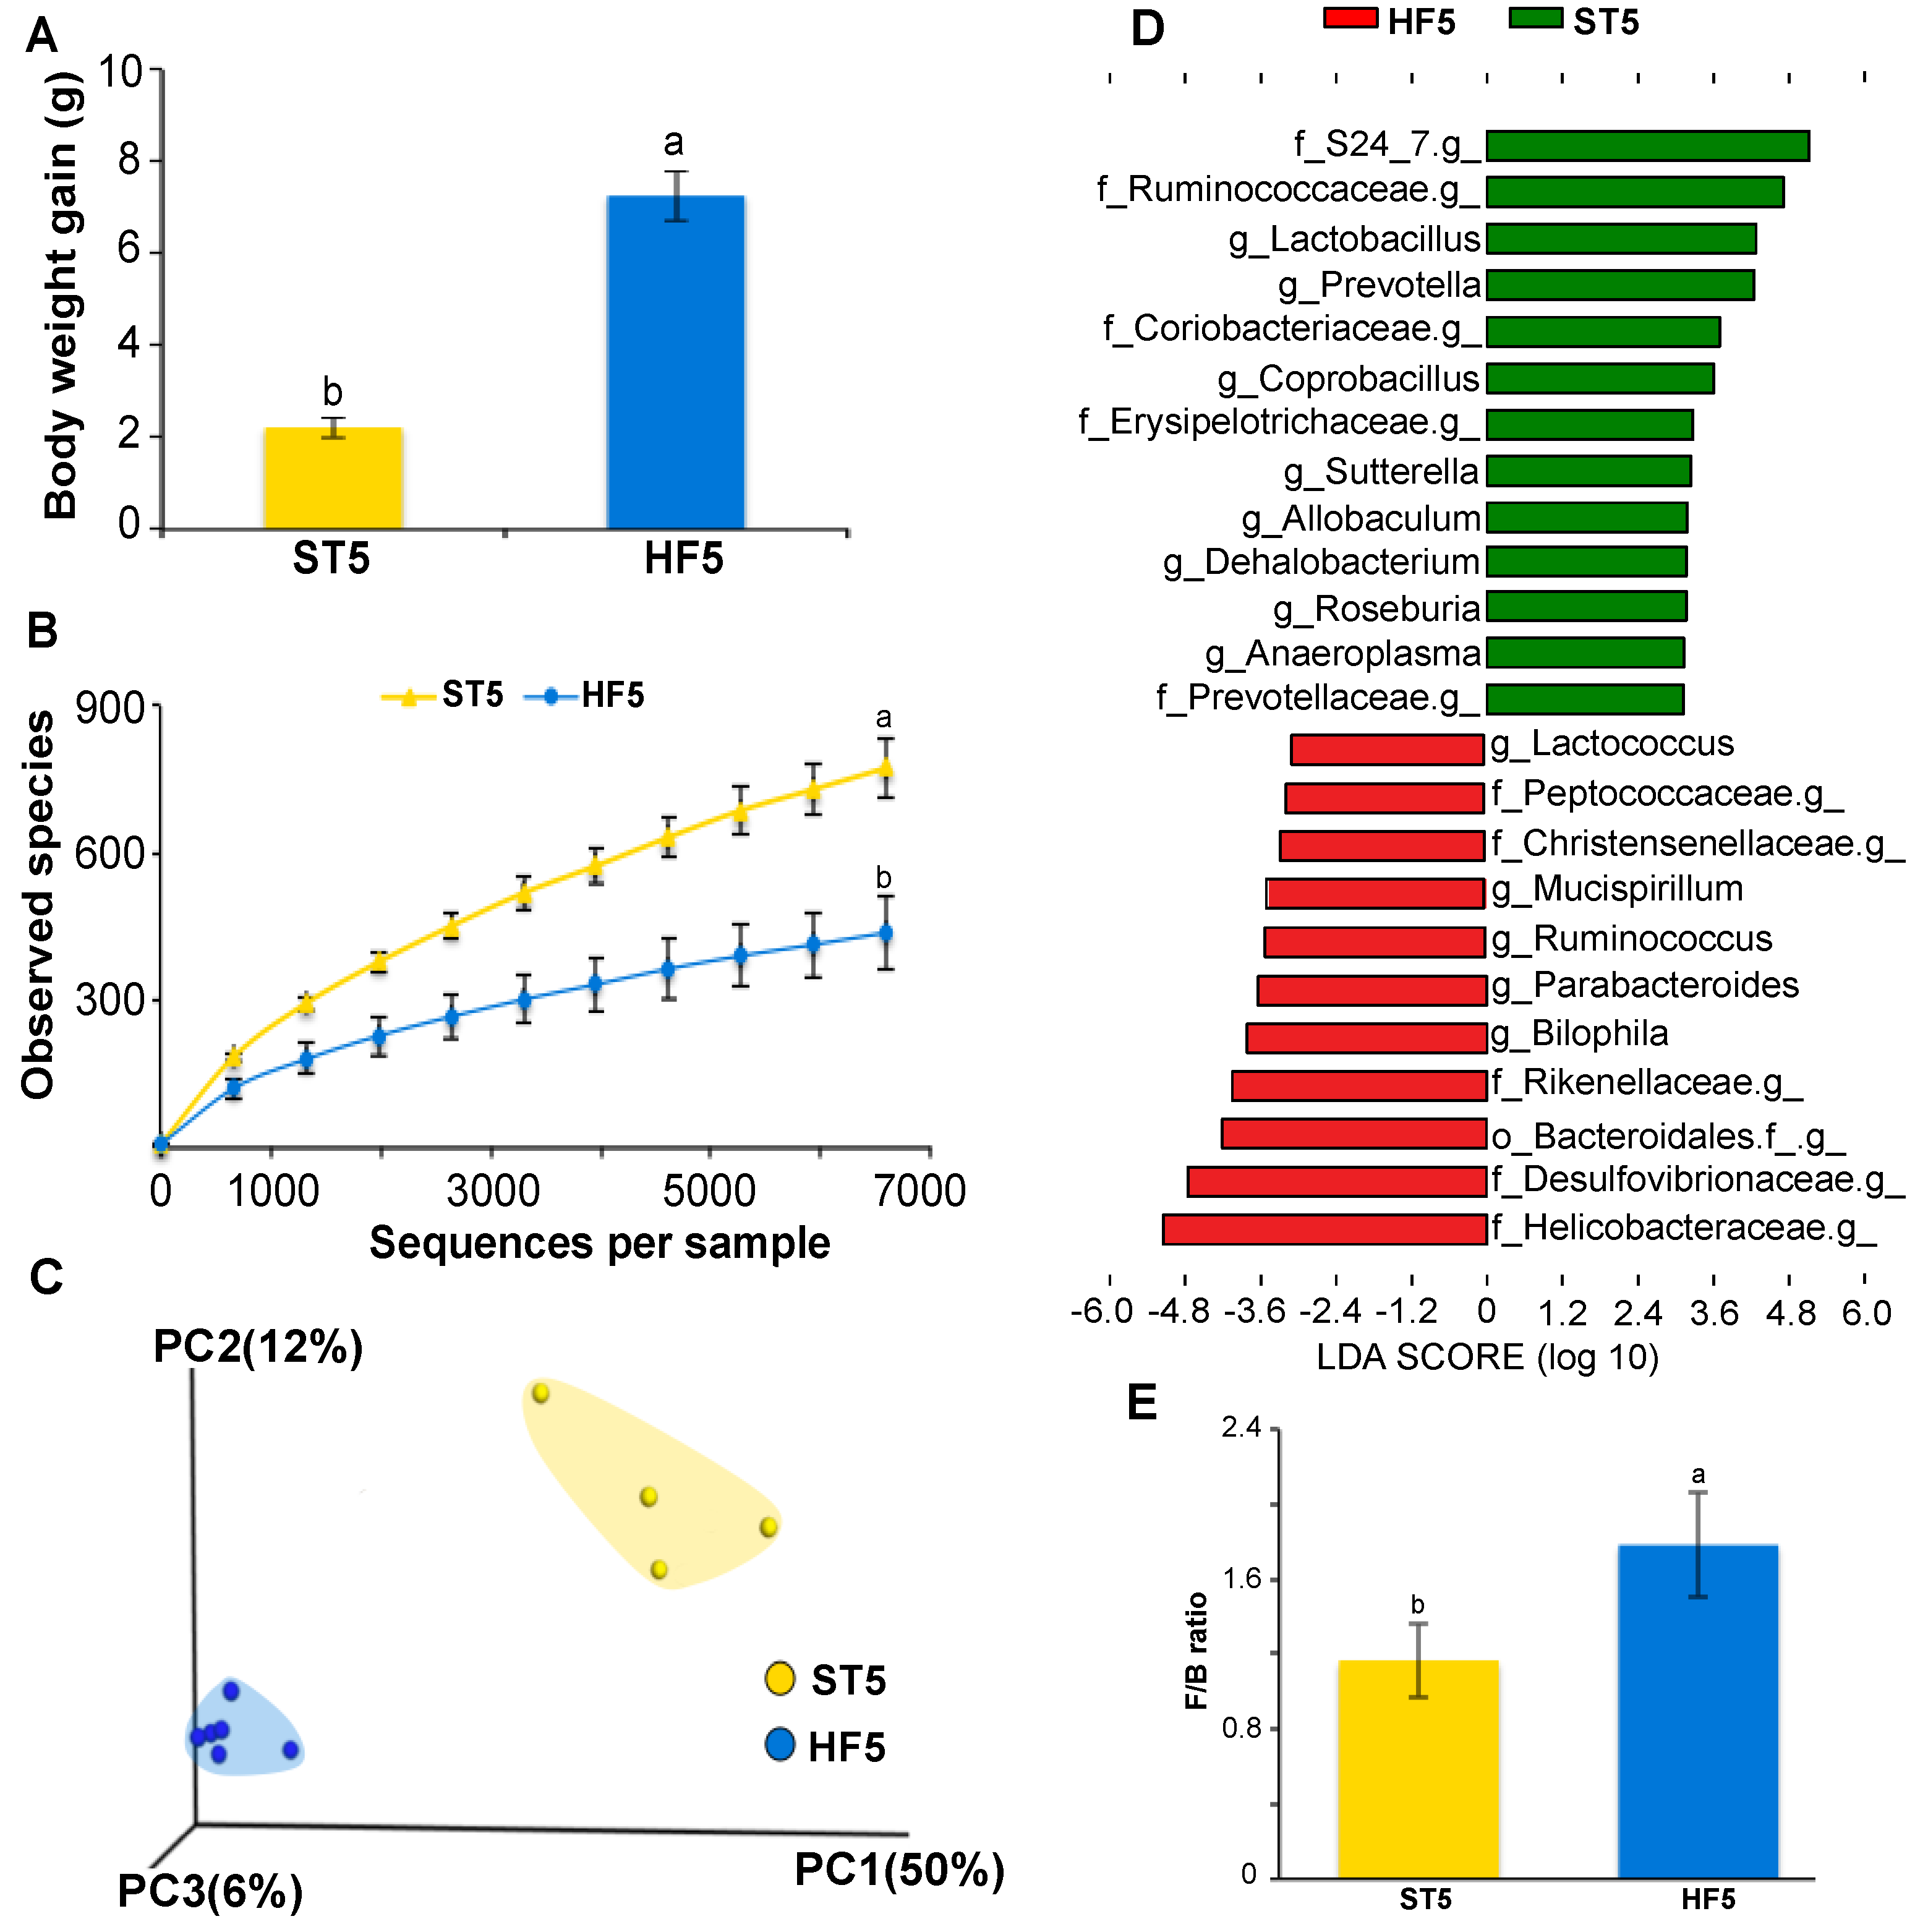
3.1. High-Fat Diet Induced Overweight and Altered Microbial Diversity and Composition
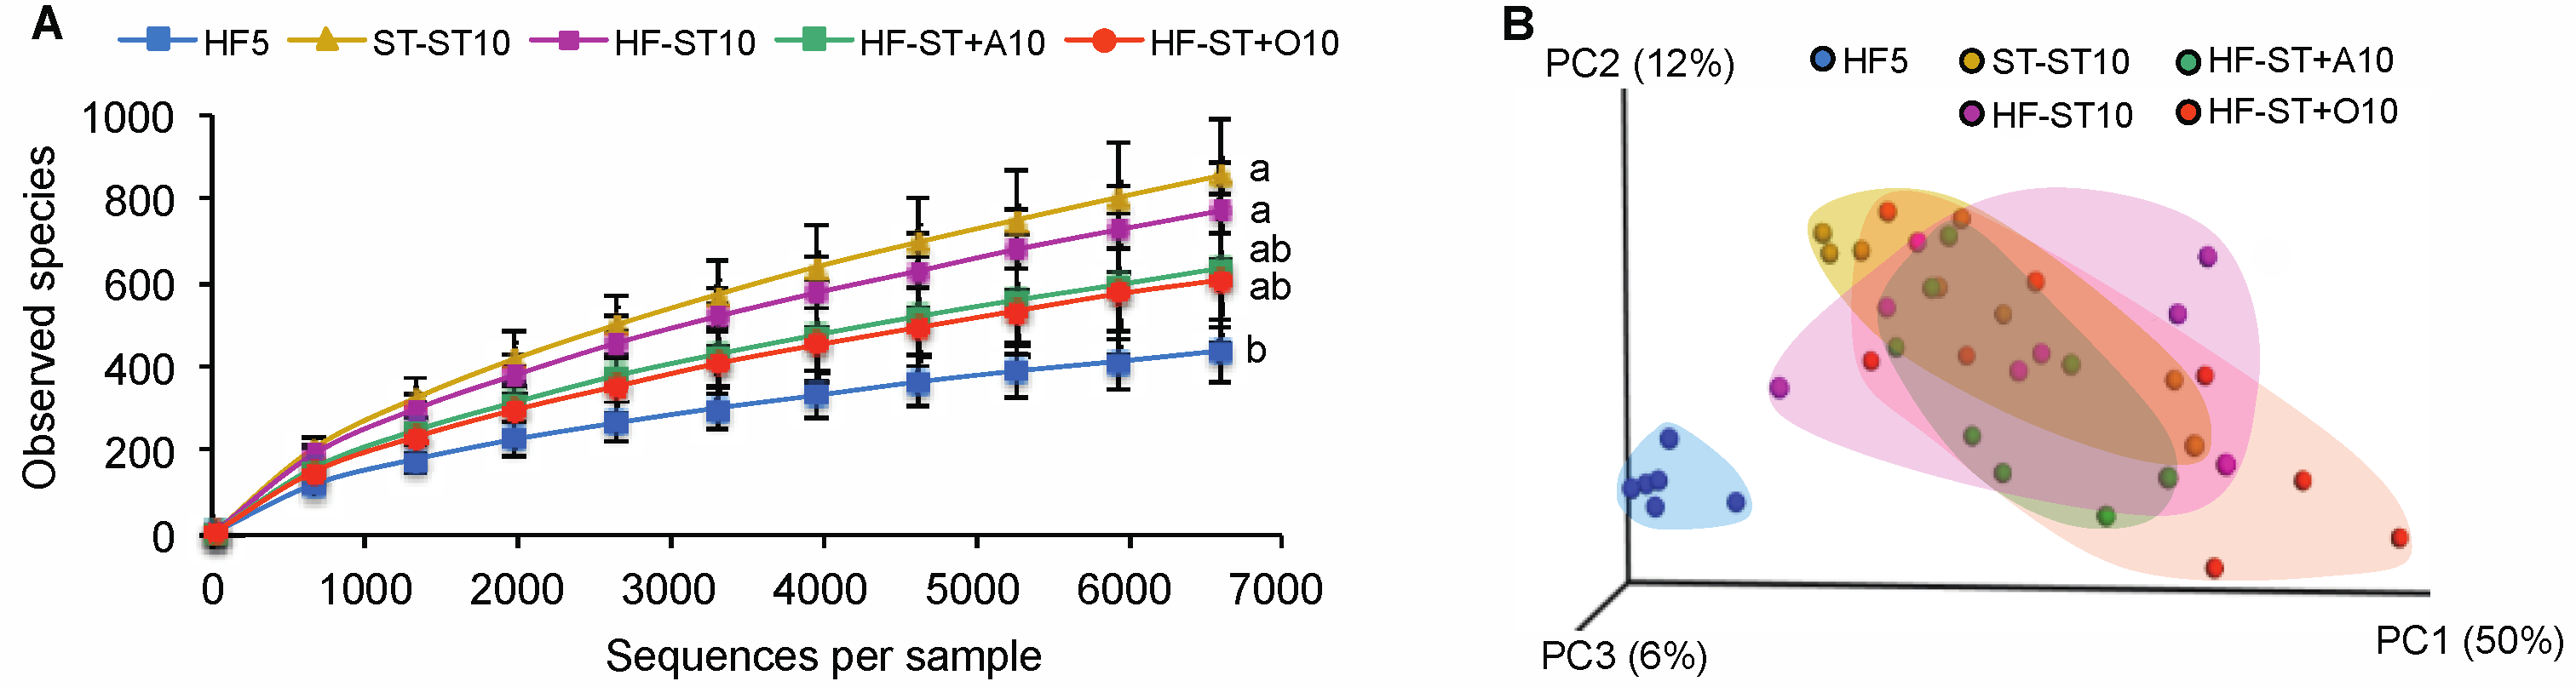
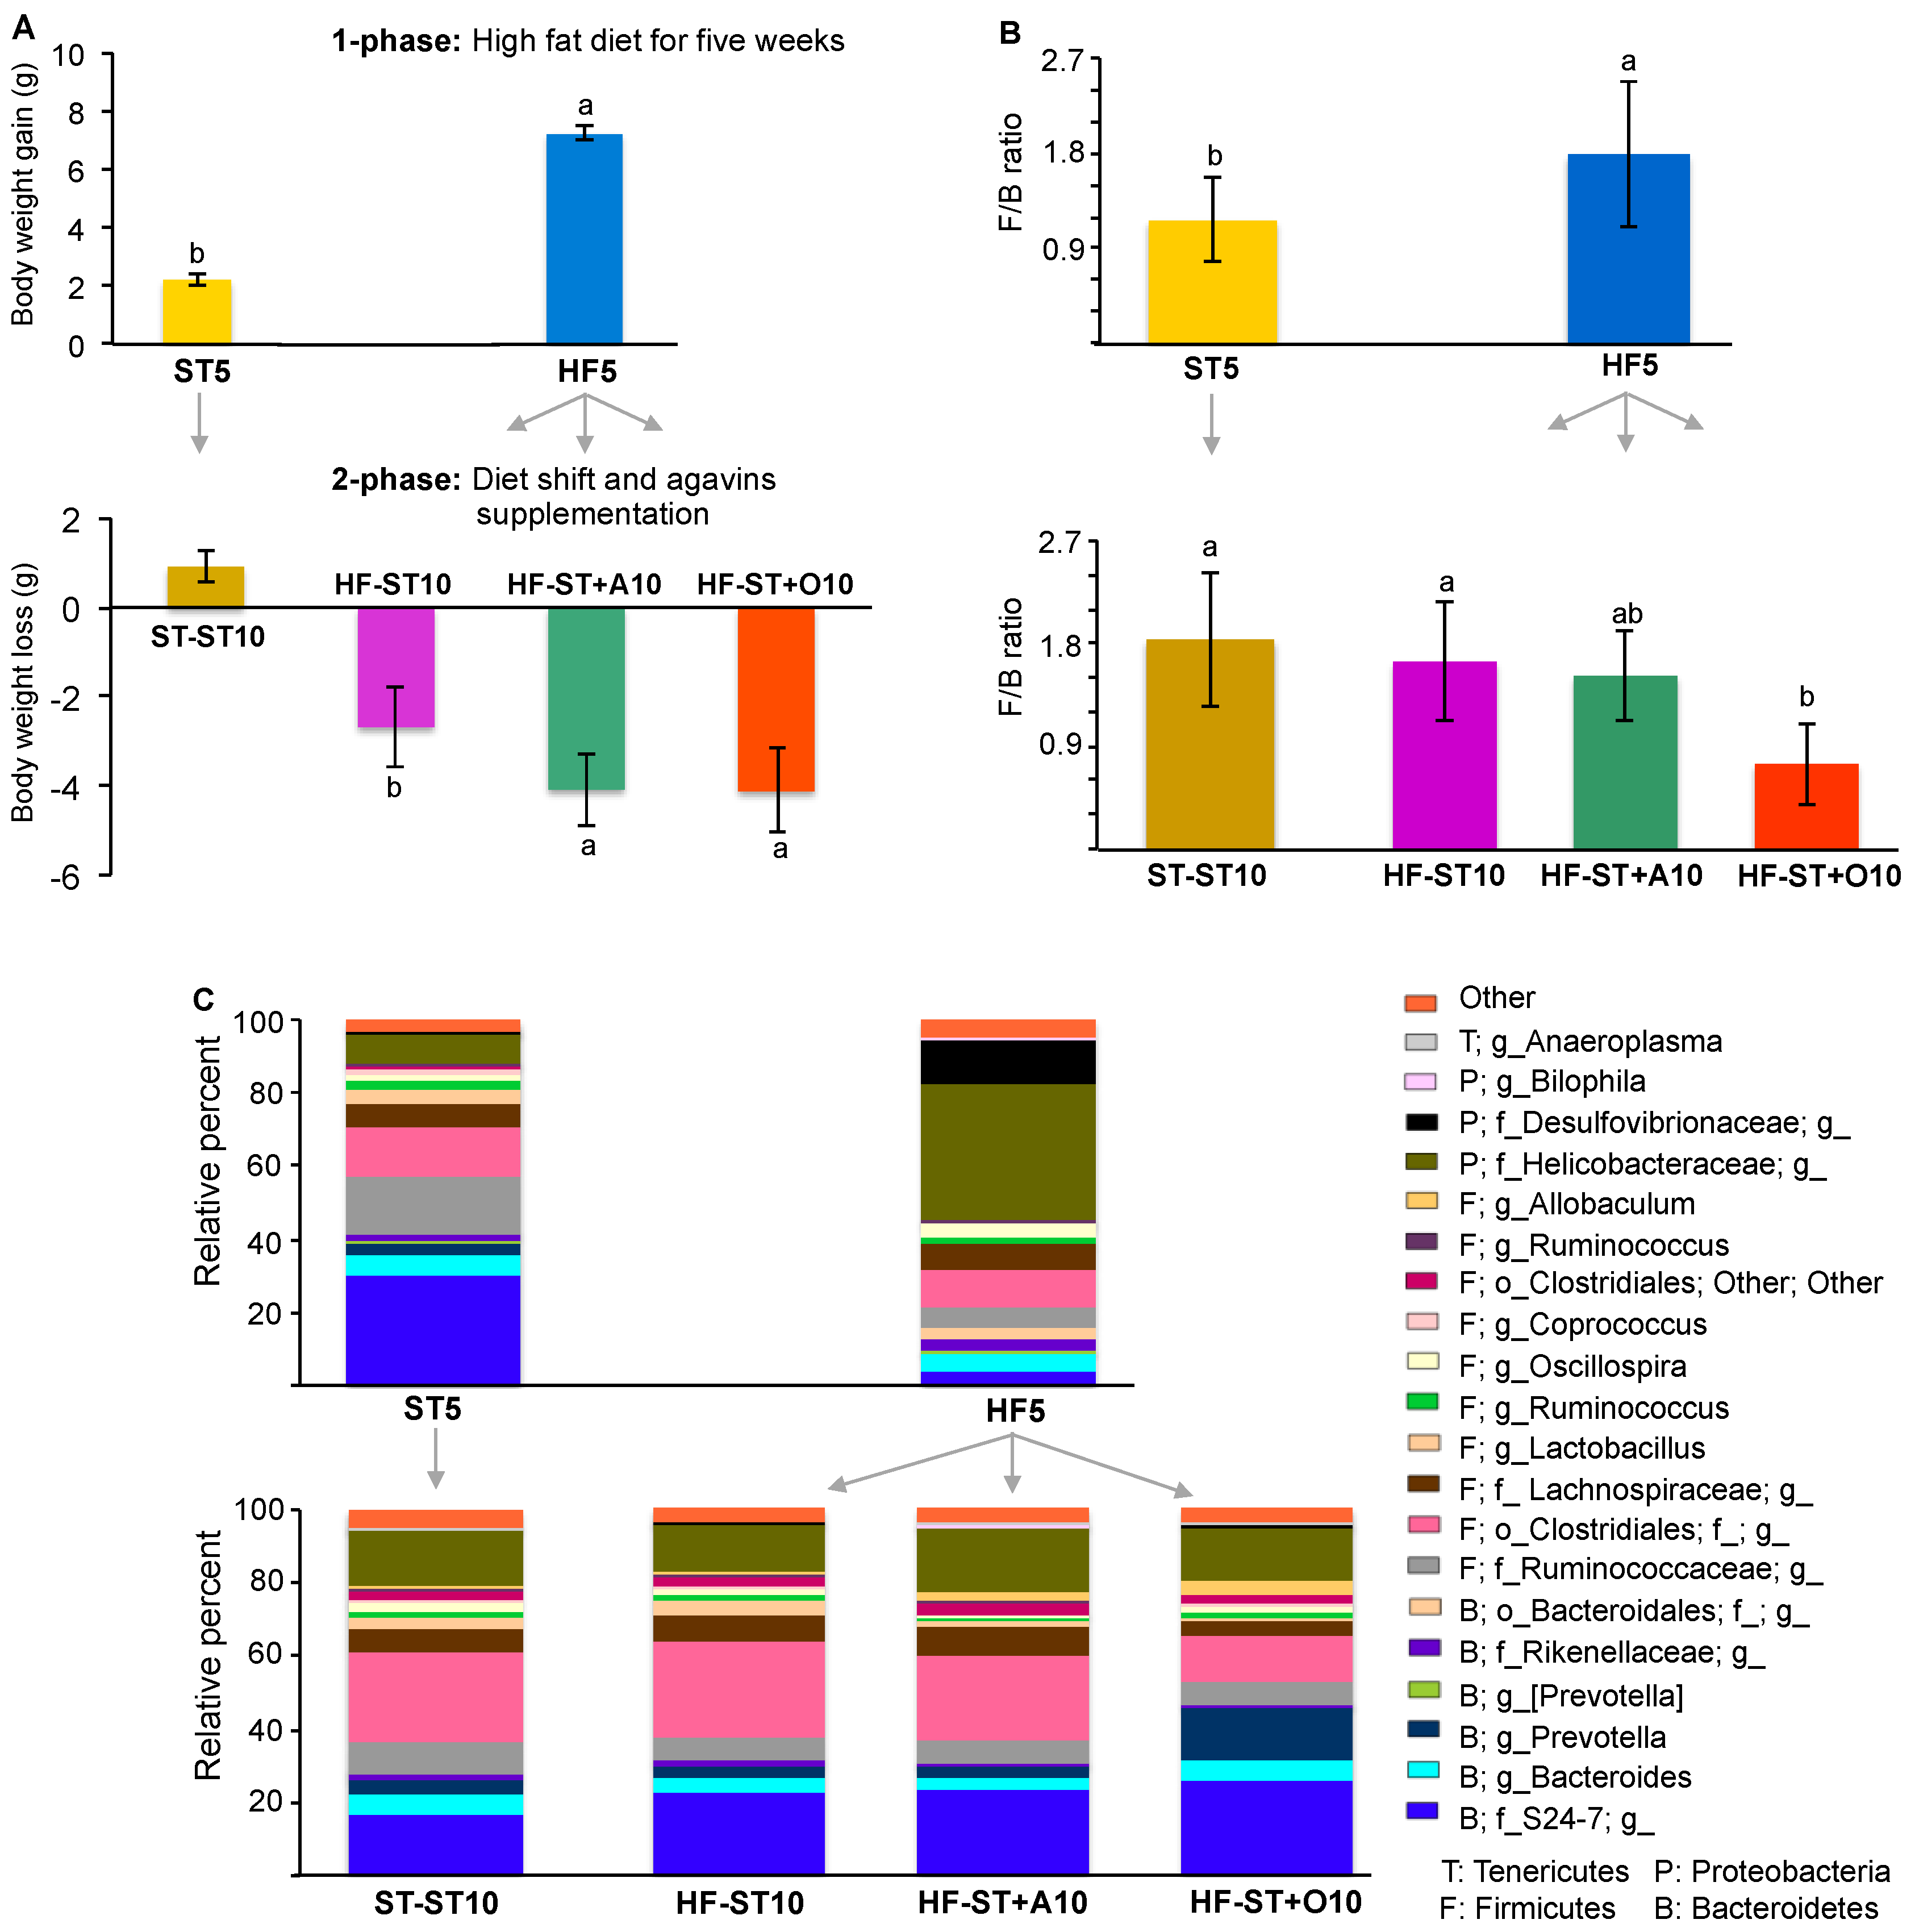
3.2. Diet Shift Induced Body Weight Loss and Restored Altered Microbial Diversity in Overweight Mice
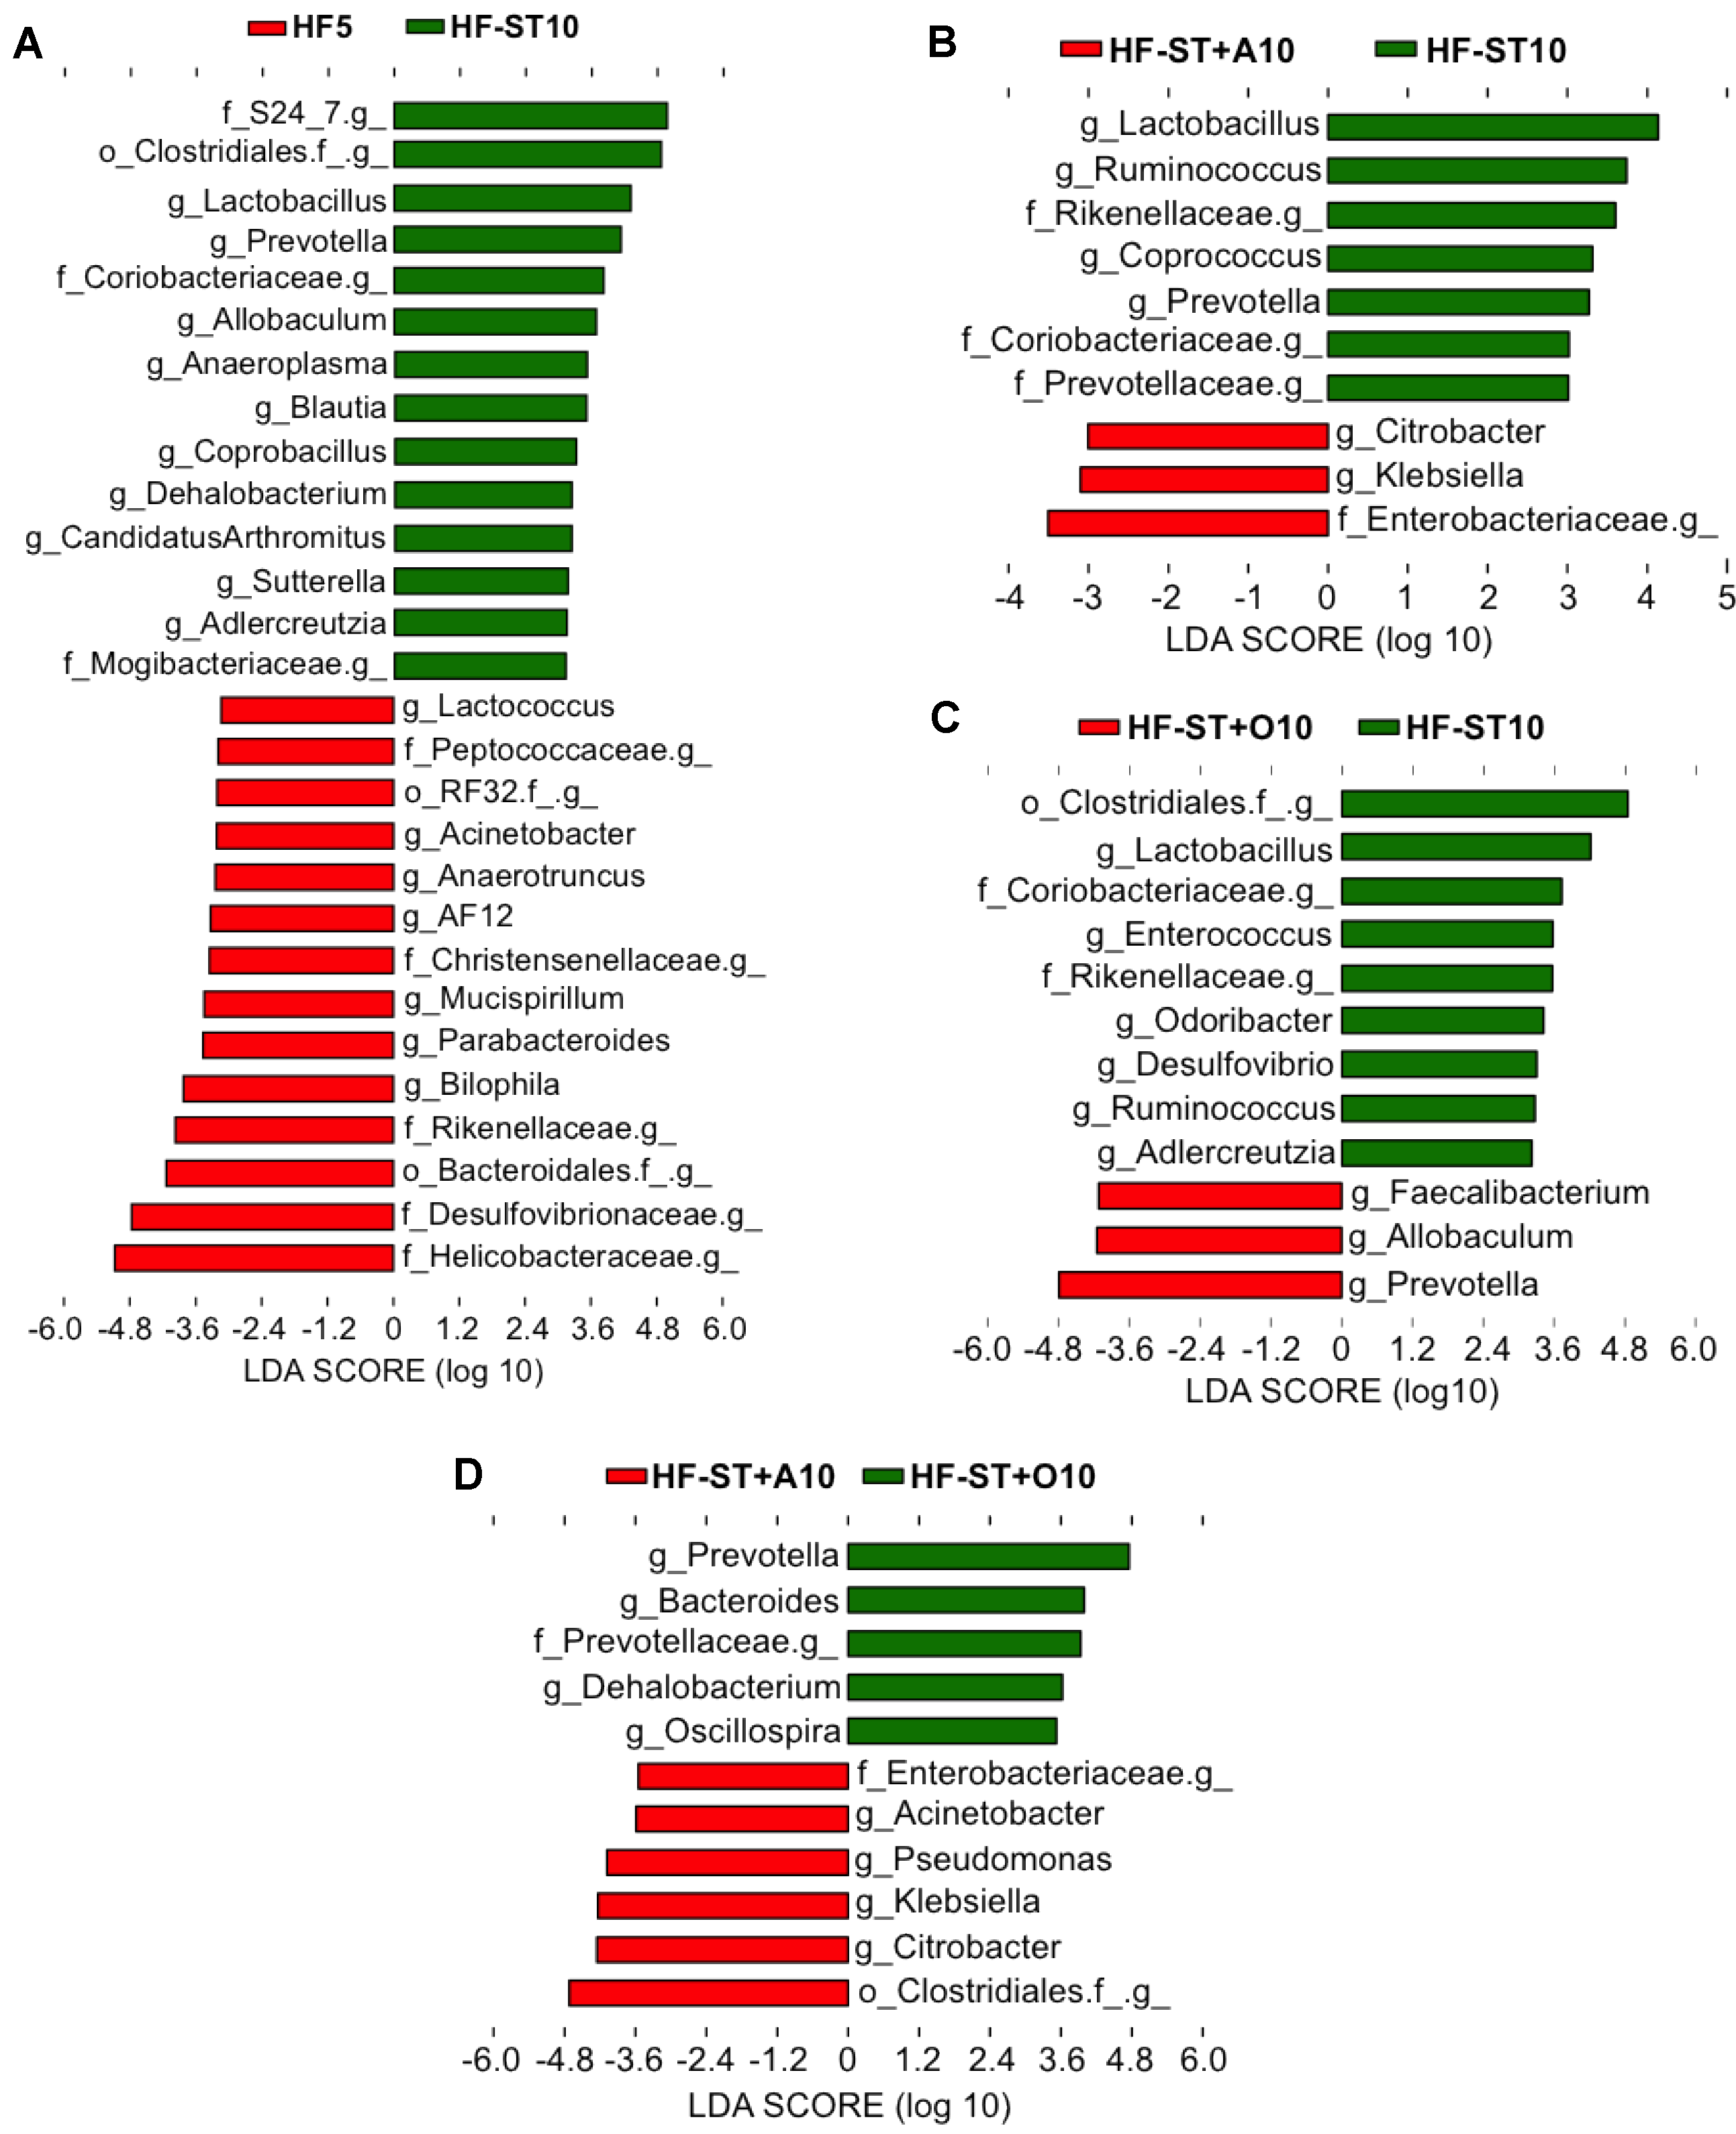
3.3. Effects of Prebiotic Supplementation on Cecal Microbiota in Overweight Mice
4. Discussion
5. Conclusions
Supplementary Materials
Acknowledgments
Author Contributions
Conflicts of Interest
References
- López, M.G.; Mancilla-Margalli, N.A.; Mendoza-Diaz, G. Molecular structures of fructans from Agave tequilana Weber var. azul. J. Agric. Food Chem. 2003, 51, 7835–7840. [Google Scholar] [CrossRef] [PubMed]
- Mancilla-Margalli, N.A.; López, M.G. Water-soluble carbohydrates and fructan structure patterns from Agave and Dasylirion species. J. Agric. Food Chem. 2006, 54, 7832–7839. [Google Scholar] [CrossRef] [PubMed]
- Mellado-Mojica, E.; López, M.G. Fructan metabolism in A. tequilana Weber blue variety along its developmental cycle in the field. J. Agric. Food Chem. 2012, 60, 11704–11713. [Google Scholar] [CrossRef] [PubMed]
- Gibson, G.R.; Scott, K.P.; Rastall, R.A.; Tuohy, K.M.; Hotchkiss, A.; Dubert-Ferrandon, A.; Gareau, M.; Murphy, E.F.; Saulnier, D.; Loh, G.; et al. Dietary prebiotics: Current status and new definition. Food Sci. Technol. Bull. Funct. Foods 2010, 7, 1–19. [Google Scholar] [CrossRef]
- Psichas, A.; Sleeth, M.L.; Murphy, K.G.; Brooks, L.; Bewick, G.A.; Hanyaloglu, A.C.; Ghatei, M.A.; Bloom, S.R.; Frost, G. The short chain fatty acid propionate stimulates GLP-1 and PYY secretion via free fatty acid receptor 2 in rodents. Int. J. Obes. 2015, 39, 424–429. [Google Scholar] [CrossRef] [PubMed]
- Tolhurst, G.; Heffron, H.; Lam, Y.S.; Parker, H.E.; Habib, A.M.; Diakogiannaki, E.; Cameron, J.; Grosse, J.; Reimann, F.; Gribble, F.M. Short-chain fatty acids stimulate glucagon-like peptide-1 secretion via the G-protein-couples receptor FFAR2. Diabetes 2012, 61, 364–371. [Google Scholar] [CrossRef] [PubMed]
- Lin, H.V.; Frassetto, A.; Kowalik, E.J., Jr.; Nawrocki, A.R.; Lu, M.M.; Kosinski, J.R.; Hubert, J.A.; Szeto, D.; Yao, X.; Forrest, G.; et al. Butyrate and propionate protect against diet-induced obesity and regulate gut hormones via free fatty acids receptor 3-independent mechanisms. PLoS ONE 2012, 7, e35240. [Google Scholar] [CrossRef] [PubMed]
- Duncan, S.H.; Louis, P.; Thomson, J.M.; Flint, H.J. The role of pH in determining the species composition on the human colonic microbiota. Environ. Microbiol. 2009, 11, 2112–2122. [Google Scholar] [CrossRef] [PubMed]
- Chung, W.S.; Walker, A.W.; Louis, P.; Parkhill, J.; Vermeiren, J.; Bosscher, D.; Duncan, S.H.; Flint, H.J. Modulation of the human gut microbiota by dietary fibres occurs at the species level. BMC Biol. 2016, 14, 3. [Google Scholar] [CrossRef] [PubMed]
- Santiago-García, P.A.; López, M.G. Agavins from Agave angustifolia and Agave potatorum affect food intake, body weight gain and satiety-related hormones (GLP-1 and ghrelin) in mice. Food Funct. 2014, 5, 3311–3319. [Google Scholar] [CrossRef] [PubMed]
- Márquez-Aguirre, A.L.; Camacho-Ruíz, R.M.; Gutiérrez-Mercado, Y.K.; Padilla-Camberos, E.; González-Ávila, M.; Gálvez-Gastélum, F.J.; Díaz-Martínez, N.E.; Ortuño-Sahagún, D. Fructans from Agave tequilana with a lower degree of polymerization prevent weight gain, hyperglycemia and liver steatosis in high-fat diet-induced obese mice. Plant Foods Hum. Nutr. 2016, 71, 416–421. [Google Scholar] [CrossRef] [PubMed]
- Márquez-Aguirre, A.L.; Camacho-Ruiz, R.M.; Arriaga-Alba, M.; Padilla-Camberos, E.; Kirchmayr, M.R.; Blasco, J.L.; González-Avila, M. Effects of Agave tequilana fructans with different degree of polymerization profiles on the body weight, blood lipids and count of fecal Lactobacilli/Bifidobacteria in obese mice. Food Funct. 2013, 4, 1237–1244. [Google Scholar] [CrossRef] [PubMed]
- Rendón-Huerta, J.A.; Juárez-Flores, B.; Pinos-Rodríguez, J.M.; Aguirre-Rivera, J.; Delgado-Portales, R.E. Effects of different sources of fructans on body weight, blood metabolites and fecal bacteria in normal and obese non-diabetic and diabetic rats. Plant Foods Hum. Nutr. 2012, 67, 64–70. [Google Scholar] [CrossRef] [PubMed]
- Mao, B.; Li, D.; Zhao, J.; Liu, X.; Gu, Z.; Chen, Y.Q.; Zhang, H.; Chen, W. Metagenomic insight into the effects of fructo-oligosaccharides (FOS) on the composition of fecal microbiota in mice. J. Agric. Food Chem. 2015, 63, 856–863. [Google Scholar] [CrossRef] [PubMed]
- Everard, A.; Lazarevic, V.; Gaïa, N.; Johansson, M.; Ståhlman, M.; Backhed, F.; Delzenne, N.M.; Schrenzel, J.; François, P.; Cani, P.D. Microbiome of prebiotic-treated mice reveals novel targets involved in host response during obesity. ISME J. 2014, 8, 2116–2130. [Google Scholar] [CrossRef] [PubMed]
- Schneeberger, M.; Everard, A.; Gómez-Valadés, A.G.; Matamoros, S.; Ramírez, S.; Delzenne, N.M.; Gomis, R.; Claret, M.; Cani, P.D. Akkermansia muciniphila inversely correlates with the onset of inflammation, altered adipose tissue metabolism and metabolic disorders during obesity in mice. Sci. Rep. 2015, 5, 16643. [Google Scholar] [CrossRef] [PubMed] [Green Version]
- Ravussin, Y.; Koren, O.; Spor, A.; LeDuc, C.; Gutman, R.; Stombaugh, J.; Knight, R.; Ley, R.E.; Libel, R.L. Responses of gut microbiota to diet composition and weight loss in lean and obese mice. Obesity 2012, 20, 738–747. [Google Scholar] [CrossRef] [PubMed]
- Zhang, C.; Zhang, M.; Pang, X.; Zhao, Y.; Wang, L.; Zhao, L. Structural resilience of the gut microbiota in adult mice under high-fat dietary perturbations. ISME J. 2012, 6, 1848–1857. [Google Scholar] [CrossRef] [PubMed]
- Murphy, E.F.; Cotter, P.D.; Healy, S.; Marques, T.M.; O’Sullivan, O.; Fouhy, F.; Clarke, S.F.; O’Toole, P.W.; Quigley, E.M.; Stanton, C.; et al. Composition and energy harvesting capacity of the gut microbiota: Relationship to diet, obesity and time in mouse models. Gut 2010, 59, 1635–1642. [Google Scholar] [CrossRef] [PubMed]
- Ley, R.E.; Bäckhed, F.; Turnbaugh, P.; Lozupone, C.A.; Knight, R.D.; Gordon, J.I. Obesity alters gut microbial ecology. Proc. Natl. Acad. Sci. USA 2005, 102, 11070–11075. [Google Scholar] [CrossRef] [PubMed]
- Huazano-García, A.; López, M.G. Agavins reverse the metabolic disorders in overweight mice through the increment of short chain fatty acids and hormones. Food Funct. 2015, 6, 3720–3727. [Google Scholar] [CrossRef] [PubMed]
- Everard, A.; Belzer, C.; Geurts, L.; Ouwerkerk, J.P.; Druart, C.; Bindels, L.B.; Guiot, Y.; Derrien, M.; Muccioli, G.G.; Delzenne, N.M.; et al. Cross-talk between Akkermansia muciniphila and intestinal epithelium controls diet-induced obesity. Proc. Natl. Acad. Sci. USA 2013, 110, 9066–9071. [Google Scholar] [CrossRef] [PubMed]
- Caporaso, J.G.; Lauber, C.L.; Walters, W.A.; Berg-Lyons, D.; Huntley, J.; Fierer, N.; Owens, S.M.; Betley, J.; Fraser, L.; Bauer, M.; et al. Ultra-high-throughput microbial community analysis on the Illumina HiSeq and MiSeq platforms. ISME J. 2012, 6, 1621–1624. [Google Scholar] [CrossRef] [PubMed]
- Caporaso, J.G.; Kuczynski, J.; Stombaugh, J.; Bittinger, K.; Bushman, F.D.; Costello, E.K.; Fierer, N.; Peña, A.G.; Goodrich, J.K.; Gordon, J.I.; et al. QIIME allows analysis of high-throughput community sequencing data. Nat. Methods 2010, 7, 335–336. [Google Scholar] [CrossRef] [PubMed]
- Segata, N.; Izard, J.; Waldron, L.; Gevers, D.; Miropolsky, L.; Garrett, W.S.; Huttenhower, C. Metagenomic biomarker discovery and explanation. Genome Biol. 2011, 12, R60. [Google Scholar] [CrossRef] [PubMed]
- Femia, A.P.; Luceri, C.; Dolara, P.; Giannini, A.; Biggeri, A.; Salvadori, M.; Clune, Y.; Collins, K.J.; Paglierani, M.; Caderni, G. Antitumorigenic activity of the prebiotic inulin enriched with oligofructose in combination with the probiotics Lactobacillus rhamnosus and Bifidobacterium lactis on azoxymethane-induced colon carcinogenesis in rats. Carcinogenesis 2002, 23, 1953–1960. [Google Scholar] [CrossRef] [PubMed]
- Long, R.T.; Zeng, W.S.; Chen, L.Y. Bifidobacterium as an oral delivery carrier of oxyntomodulin for obesity therapy: Inhibitory effects on food intake and body weight in overweight mice. Int. J. Obes. 2010, 34, 712–719. [Google Scholar] [CrossRef] [PubMed]
- Hannelore, D.; Moghaddas Gholami, A.; Berry, D.; Desmarchelier, C.; Hahne, H.; Loh, G.; Mondot, S.; Lepage, P.; Rothballer, M.; Walker, A.; et al. High-fat diet alters gut microbiota physiology in mice. ISME J. 2014, 8, 295–308. [Google Scholar]
- Hildebrandt, M.A.; Hoffmann, C.; Sherrill-Mix, S.A.; Keilbaugh, S.A.; Hamady, M.; Chen, Y.Y.; Knight, R.; Ahima, R.S.; Bushman, F.; Wu, G.D. High-fat diet determines the composition of the murine gut microbiome independently of obesity. Gastroenterology 2009, 137, 1716–1724. [Google Scholar] [CrossRef] [PubMed]
- Turnbaugh, P.J.; Bäckhed, F.; Fulton, L.; Gordon, J.I. Diet-induced obesity is linked to marked but reversible alterations in the mouse distal gut microbiome. Cell Host Microbe 2008, 3, 213–223. [Google Scholar] [CrossRef] [PubMed]
- Devkota, S.; Wang, Y.; Musch, M.W.; Leone, V.; Fehlner-Peach, H.; Nadimpalli, A.; Antonopoulos, D.A.; Jabri, B.; Chang, E.B. Dietary-fat-induced taurocholic acid promotes pathobiont expansion and colitis in Il10−/− mice. Nature 2012, 487, 104–108. [Google Scholar] [CrossRef] [PubMed]
- Lawrence, A.D.; Maurice, C.F.; Carmody, R.N.; Gootenberg, D.B.; Button, J.E.; Wolfe, B.E.; Ling, A.V.; Devlin, A.S.; Varma, Y.; Fischbach, M.A.; et al. Diet rapidly and reproducibly alters the human gut microbiome. Nature 2014, 505, 559–563. [Google Scholar]
- Flint, H.J.; Duncan, S.H.; Scott, K.P.; Louis, P. Links between diet, gut microbiota composition and gut metabolism. Proc. Nutr. Soc. 2015, 74, 13–22. [Google Scholar] [CrossRef] [PubMed]
- Bindels, L.B.; Neyrinck, A.M.; Salazar, N.; Taminiau, B.; Druart, C.; Muccioli, G.G.; François, E.; Blecker, C.; Richel, A.; Daube, G.; et al. Non digestible oligosaccharides modulate the gut microbiota to control the development of leukemia and associated cachexia in mice. PLoS ONE 2015, 10, e0131009. [Google Scholar] [CrossRef] [PubMed]
- Frost, G.; Sleeth, M.L.; Sahuri-Arisoylu, M.; Lizarbe, B.; Cerdan, S.; Brody, L.; Anastasovska, J.; Ghourab, S.; Hankir, M.; Zhang, S.; et al. The short-chain fatty acid acetate reduces appetite via a central homeostatic mechanism. Nat. Commun. 2014, 5, 3611. [Google Scholar] [CrossRef] [PubMed]
- Chang, C.J.; Lin, C.S.; Lu, C.C.; Martel, J.; Ko, Y.F.; Ojcius, D.M.; Tseng, S.F.; Wu, T.R.; Chen, Y.Y.; Young, J.D.; et al. Ganoderma lucidum reduces obesity in mice by modulating the composition of the gut microbiota. Nat. Commun. 2015, 6, 7489. [Google Scholar] [CrossRef] [PubMed]
- Liou, A.P.; Paziuk, M.; Luevano, J.M., Jr.; Machineni, S.; Turnbaugh, P.J.; Kaplan, L.M. Conserved shifts in the gut microbiota due to gastric bypass reduce host weight and adiposity. Sci. Transl. Med. 2013, 5, 178ra41. [Google Scholar] [CrossRef] [PubMed]
- Tremaroli, V.; Karlsson, F.; Werling, M.; Ståhlman, M.; Kovatcheva-Datchary, P.; Olbers, T.; Fändriks, L.; le Roux, C.W.; Nielsen, J.; Bäckhed, F. Roux-en-Y gastric bypass and vertical banded gastroplasty induce long-term changes on the human gut microbiome contribution to fat mass regulation. Cell Metal. 2015, 22, 228–238. [Google Scholar] [CrossRef] [PubMed]
- Zhang, H.; DiBaise, J.K.; Zuccolo, A.; Kudrna, D.; Braidotti, M.; Yu, Y.; Parameswaran, P.; Crowell, M.D.; Wing, R.; Rittmann, B.E.; et al. Human gut microbiota in obesity and after gastric bypass. Proc. Natl. Acad. Sci. USA 2009, 106, 2365–2370. [Google Scholar] [CrossRef] [PubMed]
- Mahowald, M.A.; Rey, F.E.; Seedorf, H.; Turnbaugh, P.J.; Fulton, R.S.; Wollan, A.; Shah, N.; Wang, C.; Magrini, V.; Wilson, R.K.; et al. Characterizing a model human gut microbiota composed of members of its two dominant bacterial phyla. Proc. Natl. Acad. Sci. USA 2009, 106, 5859–5864. [Google Scholar] [CrossRef] [PubMed]


| Group | Acetic Acid * | Propionic Acid * | Butyric Acid * | pH |
|---|---|---|---|---|
| ST5 | 15.13 ± 0.92 a | 3.85 ± 0.20 a | 4.54 ± 0.33 a | 7.60 ± 0.12 b |
| HF5 | 5.43 ± 0.65 b | 1.96 ± 0.11 b | 1.72 ± 0.09 b | 8.18 ± 0.06 a |
| Group | Acetic Acid * | Propionic Acid * | Butyric Acid * | pH |
|---|---|---|---|---|
| ST-ST10 | 20.73 ± 2.07 c | 6.07 ± 0.60 a,b | 6.53 ± 0.60 a,b | 7.65 ± 0.07 a |
| HF-ST10 | 26.68 ± 0.69 b | 6.48 ± 0.26 b | 6.16 ± 0.39 b | 7.26 ± 0.08 a |
| HF-ST + A10 | 34.27 ± 1.77 a | 7.16 ± 0.44 a | 7.51 ± 0.46 a | 6.92 ± 0.03 b |
| HF-ST + O10 | 34.89 ± 1.85 a | 7.73 ± 0.29 a | 6.95 ± 0.40 a | 6.79 ± 0.06 a |
© 2017 by the authors. Licensee MDPI, Basel, Switzerland. This article is an open access article distributed under the terms and conditions of the Creative Commons Attribution (CC BY) license (http://creativecommons.org/licenses/by/4.0/).
Share and Cite
Huazano-García, A.; Shin, H.; López, M.G. Modulation of Gut Microbiota of Overweight Mice by Agavins and Their Association with Body Weight Loss. Nutrients 2017, 9, 821. https://doi.org/10.3390/nu9090821
Huazano-García A, Shin H, López MG. Modulation of Gut Microbiota of Overweight Mice by Agavins and Their Association with Body Weight Loss. Nutrients. 2017; 9(9):821. https://doi.org/10.3390/nu9090821
Chicago/Turabian StyleHuazano-García, Alicia, Hakdong Shin, and Mercedes G. López. 2017. "Modulation of Gut Microbiota of Overweight Mice by Agavins and Their Association with Body Weight Loss" Nutrients 9, no. 9: 821. https://doi.org/10.3390/nu9090821
APA StyleHuazano-García, A., Shin, H., & López, M. G. (2017). Modulation of Gut Microbiota of Overweight Mice by Agavins and Their Association with Body Weight Loss. Nutrients, 9(9), 821. https://doi.org/10.3390/nu9090821