Diet Quality Scores of Australian Adults Who Have Completed the Healthy Eating Quiz


Abstract
:1. Introduction
2. Materials and Methods
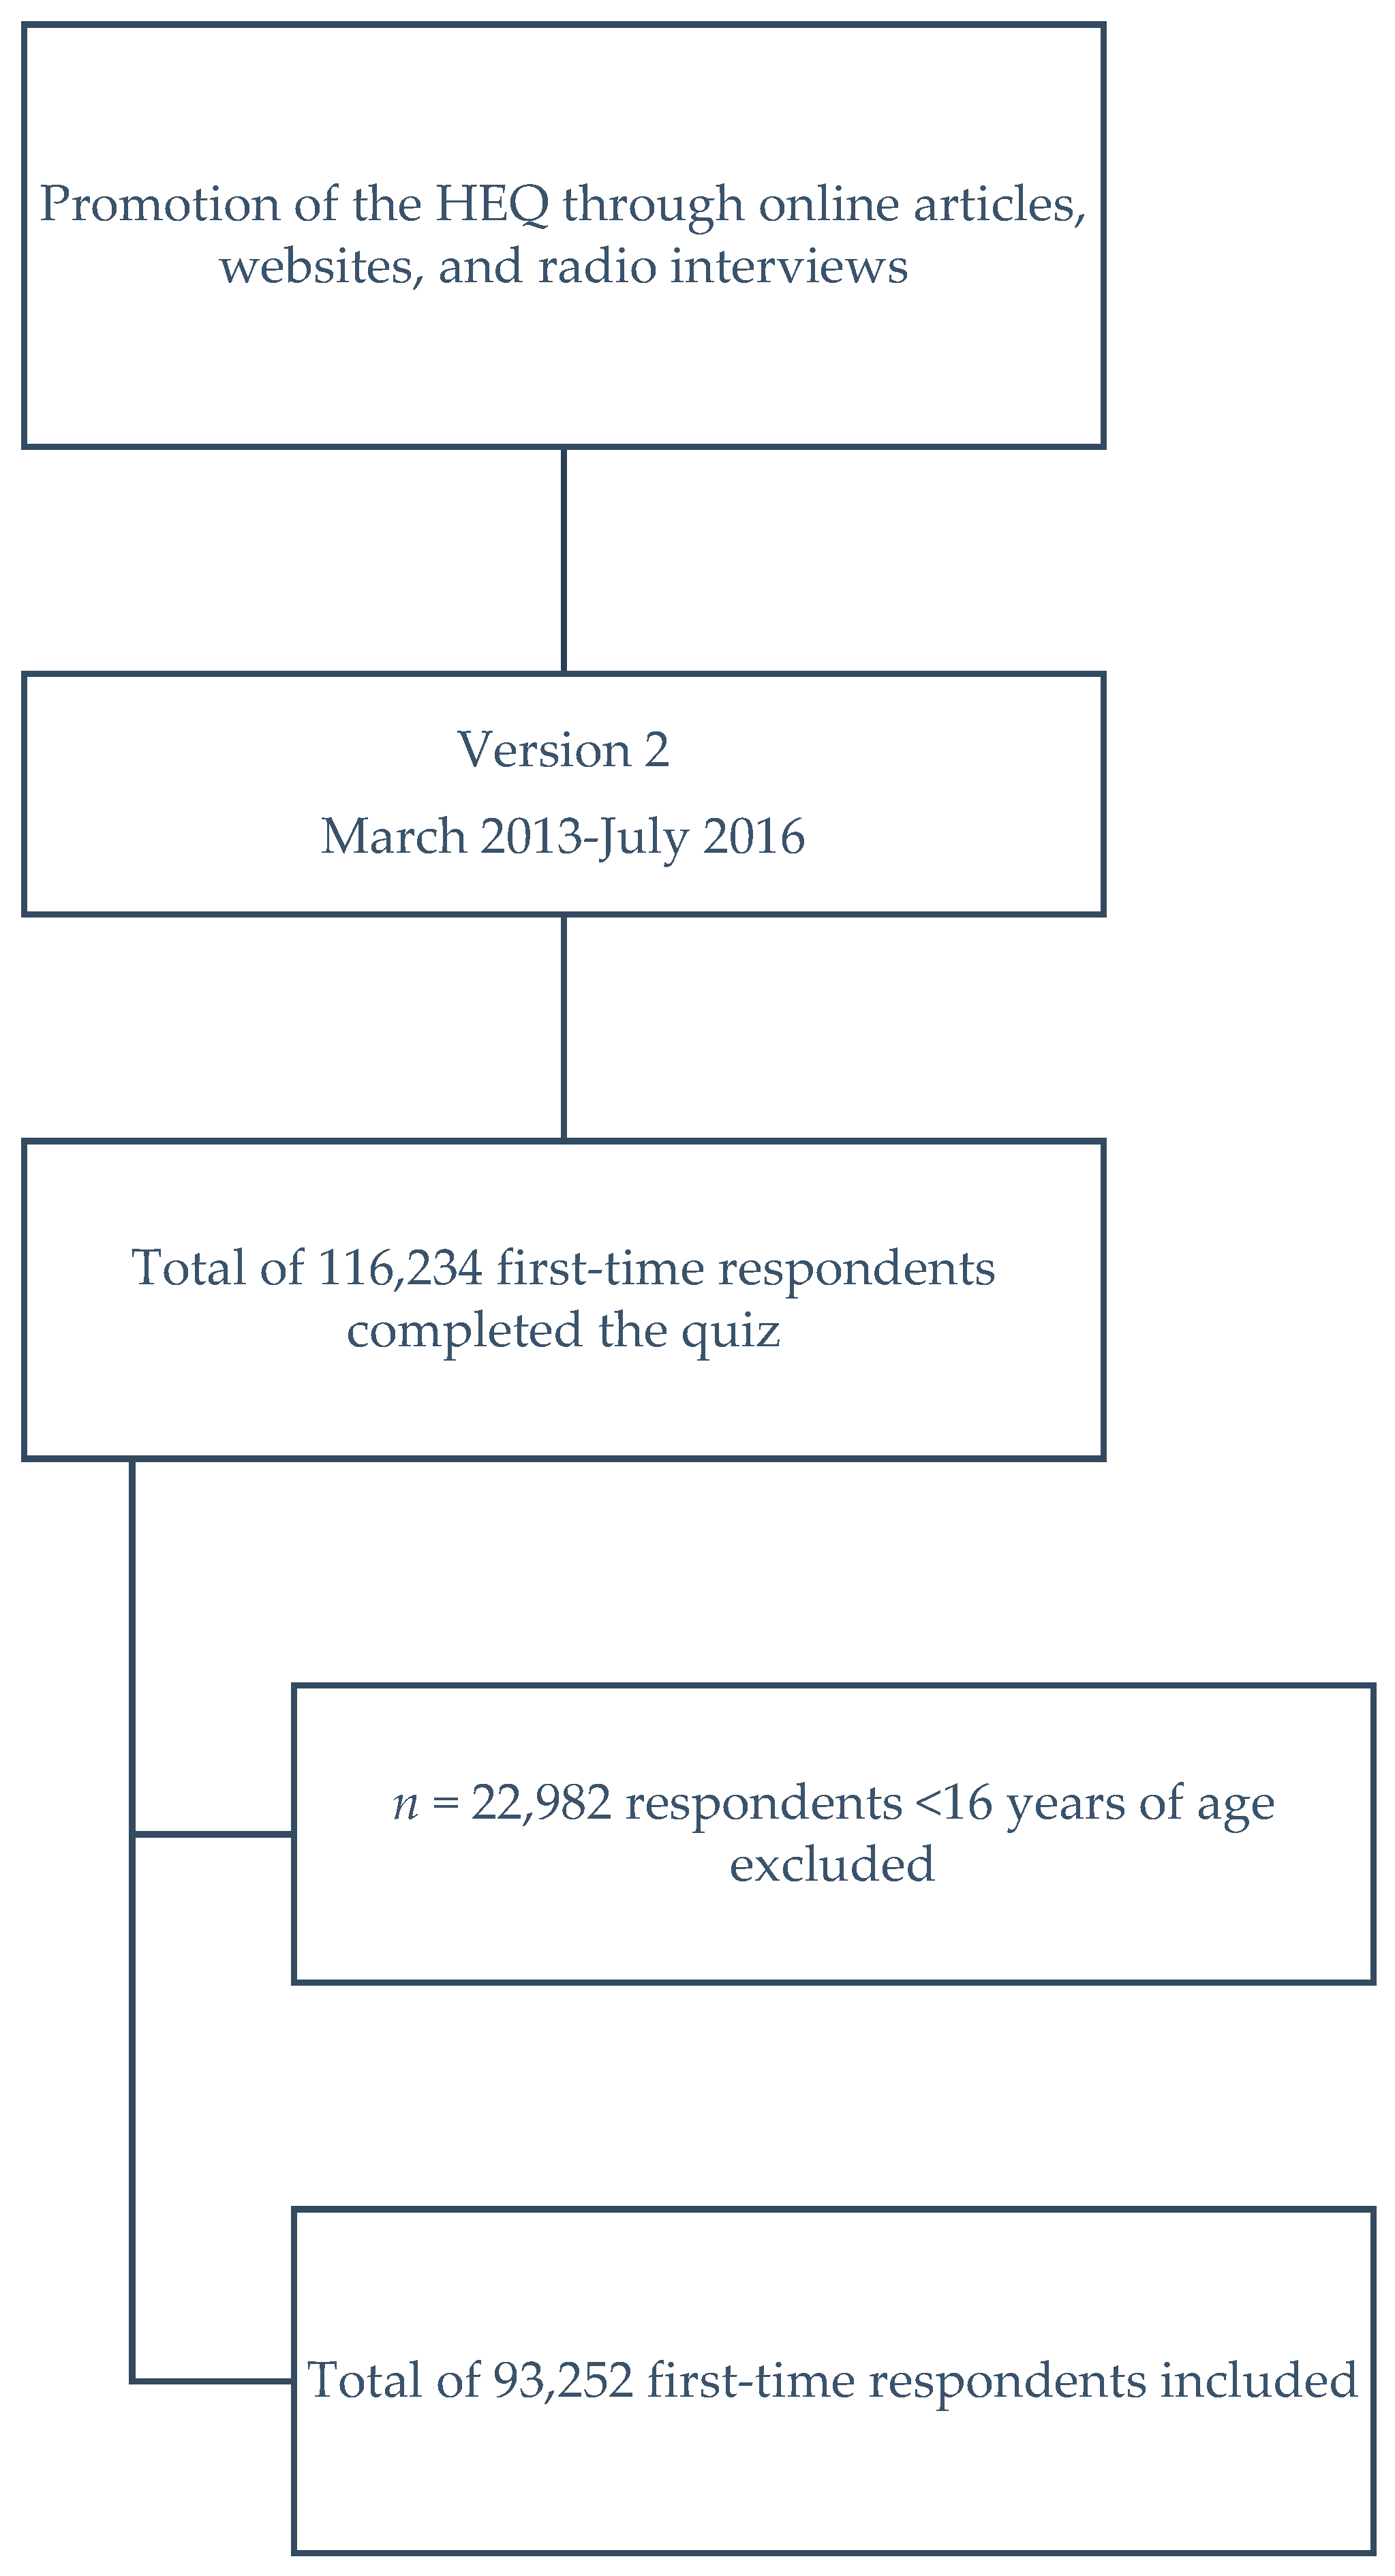
2.1. Healthy Eating Quiz
2.2. Participants
2.3. Statistical Analysis
2.4. Ethics
3. Results
3.1. Males Versus Females
3.2. Age Categories
3.3. Vegetarians
3.4. Healthy Eating Quiz Score by Meal Sharing Characteristics
3.5. SEIFA Deciles
3.6. Comparison by Completion Time
3.7. Multiple Linear Regression
4. Discussion
5. Conclusions
Author Contributions
Conflicts of Interest
References
- Burrows, T.L.; Collins, K.; Watson, J.; Guest, M.; Boggess, M.M.; Neve, M.; Rollo, M.; Duncanson, K.; Collins, C.E. Validity of the Australian Recommended Food Score as a diet quality index for Pre-schoolers. Nutr. J. 2014, 13, 87. [Google Scholar] [CrossRef] [PubMed]
- Collins, C.E.; Burrows, T.L.; Rollo, M.E.; Boggess, M.M.; Watson, J.F.; Guest, M.; Duncanson, K.; Pezdirc, K.; Hutchesson, M.J. The comparative validity and reproducibility of a diet quality index for adults: The Australian Recommended Food Score. Nutrients 2015, 7, 785–798. [Google Scholar] [CrossRef] [PubMed]
- McCullough, M.L.; Feskanich, D.; Stampfer, M.J.; Giovannucci, E.L.; Rimm, E.B.; Hu, F.B.; Spiegelman, D.; Hunter, D.J.; Colditz, G.A.; Willett, W.C. Diet quality and major chronic disease risk in men and women: Moving toward improved dietary guidance. Am. J. Clin. Nutr. 2002, 76, 1261–1271. [Google Scholar] [PubMed]
- Van Oostrom, S.H.; Gijsen, R.; Stirbu, I.; Korevaar, J.C.; Schellevis, F.G.; Picavet, H.S.J.; Hoeymans, N. Time trends in prevalence of chronic diseases and multimorbidity not only due to aging: Data from general practices and health surveys. PLoS ONE 2016, 11, e0160264. [Google Scholar] [CrossRef] [PubMed]
- Naska, A.; Lagiou, A.; Lagiou, P. Dietary assessment methods in epidemiological research: current state of the art and future prospects. F1000Research 2017, 6. [Google Scholar] [CrossRef] [PubMed]
- Wirt, A.; Collins, C.E. Diet quality–what is it and does it matter? Public Health Nutr. 2009, 12, 2473–2492. [Google Scholar] [CrossRef] [PubMed]
- Marshall, S.; Watson, J.; Burrows, T.; Guest, M.; Collins, C.E. The development and evaluation of the Australian child and adolescent recommended food score: A cross-sectional study. Nutr. J. 2012, 11, 96. [Google Scholar] [CrossRef] [PubMed]
- Rollo, M.E.; Williams, R.L.; Burrows, T.; Kirkpatrick, S.I.; Bucher, T.; Collins, C.E. What Are They Really Eating? A Review on New Approaches to Dietary Intake Assessment and Validation. Curr. Nutr. Rep. 2016, 5, 307–314. [Google Scholar] [CrossRef]
- Development of a Brief Online Healthy Eating Quiz with Real-Time Feedback for Assessing Diet Quality and Variety Hawaii, USA. Available online: http://www.medicine20congress.com/ocs/index.php/med/med2014/paper/view/2517 (accessed on 14 August 2017).
- National Health and Medical Research Council. Australian Dietary Guidelines. Available online: https://www.nhmrc.gov.au/guidelines-publications/n55 (accessed on 14 August 2017).
- Collins, C.E.; Burrows, T.L.; Truby, H.; Morgan, P.J.; Wright, I.M.; Davies, P.S.; Callister, R. Comparison of energy intake in toddlers assessed by food frequency questionnaire and total energy expenditure measured by the doubly labeled water method. J. Acad. Nutr. Diet. 2013, 113, 459–463. [Google Scholar] [CrossRef] [PubMed]
- Watson, J.F.; Collins, C.E.; Sibbritt, D.W.; Dibley, M.J.; Garg, M.L. Reproducibility and comparative validity of a food frequency questionnaire for Australian children and adolescents. Int. J. Behav. Nutr. Phys. Act. 2009, 6, 62. [Google Scholar] [CrossRef] [PubMed]
- Collins, C.E.; Boggess, M.M.; Watson, J.F.; Guest, M.; Duncanson, K.; Pezdirc, K.; Rollo, M.; Hutchesson, M.J.; Burrows, T.L. Reproducibility and comparative validity of a food frequency questionnaire for Australian adults. Clin. Nutr. 2014, 33, 906–914. [Google Scholar] [CrossRef] [PubMed]
- Collins, C. What Is a Balanced Diet Anyway? The Conversation 2017. Available online: https://theconversation.com/what-is-a-balanced-diet-anyway-72432 (accessed on 14 August 2017).
- Dietitians Association of Australia. Australia’s Healthy Weight Week: Healthy Eating Quiz 2016. Available online: http://healthyweightweek.com.au/the-healthy-eating-quiz/ (accessed on 14 August 2017).
- Dietitians Association of Australia. Healthy Eating 201. Available online: https://daa.asn.au/smart-eating-for-you/smart-eating-fast-facts/healthy-eating/ (accessed on 14 August 2017).
- Back to Basics Cooking Club and Healthy Lifestyle Program. Healthy Eating Quiz 2014. Available online: http://cookingmattersaustralia.com.au/ (accessed on 14 August 2017).
- Healthy Dads Healthy Kids. Take Our Healthy Eating Quiz 2017. Available online: https://www.healthydadsandkids.com/take-our-healthy-eating-quiz-online-now/ (accessed on 14 August 2017).
- Collins, C.E.; Young, A.F.; Hodge, A. Diet quality is associated with higher nutrient intake and self-rated health in mid-aged women. J. Am. Coll. Nutr. 2008, 27, 146–157. [Google Scholar] [CrossRef] [PubMed]
- Larson, N.I.; Neumark-Sztainer, D.; Hannan, P.J.; Story, M. Family meals during adolescence are associated with higher diet quality and healthful meal patterns during young adulthood. J. Am. Diet. Assoc. 2007, 107, 1502–1510. [Google Scholar] [CrossRef] [PubMed]
- Shahar, D.R.; Schultz, R.; Shahar, A.; Wing, R.R. The effect of widowhood on weight change, dietary intake, and eating behavior in the elderly population. J. Aging Health 2001, 13, 186–199. [Google Scholar] [CrossRef]
- Australian Bureau of Statistics. Household Income and Income Distribution, Australia, 2011–2012. Available online: http://www.abs.gov.au/AUSSTATS/abs@.nsf/DetailsPage/6523.02011-12?OpenDocument (accessed on 14 August 2017).
- Payette, H.; Shatenstein, B. Determinants of Healthy Eating in Community-dwelling Elderly People. Can. J Public Health 2005, 96, S27–S31. [Google Scholar] [PubMed]
- Baines, S.; Powers, J.; Brown, W.J. How does the health and well-being of young Australian vegetarian and semi-vegetarian women compare with non-vegetarians? Public Health Nutr. 2007, 10, 436. [Google Scholar] [CrossRef] [PubMed]

| Food Group | Items Giving 1 Point | Items Giving More Than 1 Point | ARFS * |
|---|---|---|---|
| Vegetables | 3–4 nightly meals with vegetables; ≥1per week of each of the following vegetables: potato, pumpkin, sweet potato, cauliflower, green beans, spinach, cabbage or Brussels sprouts, peas, broccoli, carrots, zucchini or eggplant or squash, capsicum, corn, mushrooms, tomatoes, lettuce, celery or cucumber, avocado, onion or leek or shallots/spring onion. | 2 points for ≥5 nightly meals with vegetables | 21 |
| Fruit | ≥1 piece of fruit per day, ≥1 per week of each of the following fruit: canned fruit, fruit salad, dried fruit, apple or pear, orange or mandarin or grapefruit, banana, peach or nectarine or plum or apricot, mango or paw-paw, pineapple, grapes or strawberries or blueberries, melon (any variety). | 12 | |
| Protein foods- Meat/flesh | ≤1 serve of minced meat per month but greater than never; 1–4 serve per week of: beef or lamb with or without sauce and/or vegetables per week chicken without batter or crumbing but with or without sauce and/or vegetables, pork with or without sauce and/or vegetables; ≥1 per week of fresh fish, canned tuna or salmon or sardines, other seafood (e.g., prawns, lobster). | 7 | |
| Vegetarian sources of protein | ≥1 per week of the following: nuts (e.g., peanuts, almonds), nut butters, eggs, soybeans or tofu, baked beans, other beans or lentils (e.g., chickpeas, split peas). | 6 | |
| Breads and cereals | Usual bread choice is ‘other’ (e.g., rye, high-fiber white); ≥1 per week of the following: muesli, cooked porridge, breakfast cereal (e.g., Weet-bix, Nutri-grain, Cornflakes), bread or pita bread or toast, English muffin or bagel or crumpet, rice, other grains (e.g., couscous, burghul), noodles (e.g., egg noodles, rice noodles), pasta, tacos or burritos or enchiladas, clear soup with rice or noodles. | 2 points if usual bread choice is ‘brown’ (multigrain or wholemeal). | 13 |
| Dairy | ≥2 serves of: milk, yoghurt or cheese per day; ≥1 serve per week but ≤1 serves per day of flavoured milk, ice cream, frozen yoghurt; ≥1 serve per week but ≤4 serves per day of cheese, cheese spread or cream cheese; ≥1 serve per week of plain milk, yoghurt (not frozen), cottage cheese or ricotta. | 2 points if usual type of milk is reduced fat milk or skim milk, or soy milk | 11 |
| Water | ≥4 glasses of water (including tap, unflavoured bottled water, and unflavoured mineral water). | 1 | |
| Spreads/ sauces | ≥1 serve per week of: yeast extract spread; tomato or barbecue sauce | 2 | |
| Total | 73 |
| Total Score | Vegetables | Fruit | Meat * | Meat Alt. * | Grains | Dairy | |
|---|---|---|---|---|---|---|---|
| Age Groups | |||||||
| Total (n = 93,252) | 34.1 ± 9.7 | 11.5 ± 4.3 | 5.5 ± 2.9 | 3.0 ± 1.6 | 2.6 ± 1.3 | 5.7 ± 2.3 | 4.0 ± 2.1 |
| 16–24 years (n = 37,229) | 32.6 ± 9.7 | 10.6 ± 4.3 | 5.4 ± 2.8 | 2.7 ± 1.6 | 2.5 ± 1.4 | 5.6 ± 2.3 | 3.9 ± 2.1 |
| 25–34 years (n = 26,068) | 33.1 ± 8.9 | 11.5 ± 4.0 | 4.8 ± 2.6 | 2.9 ± 1.6 | 2.6 ± 1.3 | 5.5 ± 2.3 | 3.8 ± 2.0 |
| 35–44 years (n = 12,322) | 34.5 ± 9.1 | 12.3 ± 4.0 | 5.1 ± 2.8 | 3.2 ± 1.6 | 2.7 ± 1.3 | 5.6 ± 2.4 | 3.8 ± 2.0 |
| 45–54 years (n = 9214) | 35.3 ± 8.9 | 12.9 ± 3.8 | 5.4 ± 2.8 | 3.4 ± 1.6 | 2.6 ± 1.3 | 5.4 ± 2.3 | 3.8 ± 2.0 |
| 55–64 years (n = 5840) | 36.5 ± 8.7 | 13.5 ± 3.6 | 5.8 ± 2.7 | 3.5 ± 1.6 | 2.7 ± 1.2 | 5.4 ± 2.2 | 4.0 ± 1.9 |
| 65–74 years (n = 2111) | 37.2 ± 8.5 | 13.7 ± 3.6 | 6.1 ± 2.6 | 3.6 ± 1.6 | 2.7 ± 1.2 | 5.3 ± 2.1 | 4.2 ± 1.9 |
| 75+ years (n = 468) | 35.8 ± 15.3 | 12.1 ± 6.0 | 6.2 ± 3.7 | 3.2 ± 1.8 | 2.9 ± 1.8 | 5.7 ± 3.2 | 4.0 ± 2.3 |
| 16–44 years (n = 75,619) | 33.1 ± 9.4 | 11.2 ± 4.2 | 5.1 ± 2.8 | 2.9 ± 1.6 | 2.6 ± 1.3 | 5.6 ± 2.3 | 3.8 ± 2.1 |
| 45–75 years+ (n = 17,633) | 35.9 ± 9.0 | 13.2 ± 3.8 | 5.6 ± 2.8 | 3.5 ± 1.6 | 2.7 ± 1.3 | 5.4 ± 2.3 | 3.9 ± 2.0 |
| p-value | <0.001 | <0.001 | <0.001 | <0.001 | <0.001 | <0.001 | <0.001 |
| 16–44 years vs. 45–75+ years | |||||||
| Sex | |||||||
| Females (n = 71,290) | 34.5 ± 9.3 | 11.8 ± 4.2 | 5.7 ± 2.8 | 3.0 ± 1.6 | 2.6 ± 1.3 | 5.7 ± 2.3 | 3.9 ± 2.1 |
| 16–24 years (n = 27,977) | 33.0 ± 9.4 | 10.9 ± 4.2 | 5.5 ± 2.8 | 2.6 ± 1.6 | 2.5 ± 1.4 | 5.6 ± 2.2 | 3.8 ± 2.1 |
| 25–34 years (n = 20,033) | 33.8 ± 8.6 | 11.8 ± 3.9 | 5.0 ± 2.6 | 2.9 ± 1.6 | 2.7 ± 1.3 | 5.6 ± 2.2 | 3.8 ± 2.0 |
| 35–44 years (n = 9516) | 35.1 ± 8.9 | 12.6 ± 3.9 | 5.3 ± 2.7 | 3.2 ± 1.6 | 2.7 ± 1.3 | 5.6 ± 2.3 | 3.9 ± 2.0 |
| 45–54 years (n = 7393) | 35.8 ± 8.9 | 13.2 ± 3.7 | 5.5 ± 2.8 | 3.4 ± 1.6 | 2.7 ± 1.3 | 5.4 ± 2.3 | 3.9 ± 2.0 |
| 55–64 years (n = 4544) | 37.0 ± 8.6 | 13.8 ± 3.5 | 5.8 ± 2.7 | 3.5 ± 1.6 | 2.7 ± 1.2 | 5.4 ± 2.2 | 4.1 ± 2.0 |
| 65–74 years (n = 1556) | 37.9 ± 8.4 | 14.1 ± 3.5 | 6.3 ± 2.5 | 3.7 ± 1.6 | 2.7 ± 1.2 | 5.3 ± 2.1 | 4.3 ± 1.9 |
| 75+ years (n = 271) | 35.1 ± 14.2 | 11.8 ± 5.8 | 6.1 ± 3.5 | 3.1 ± 1.8 | 2.8 ± 1.6 | 5.4 ± 3.2 | 4.1 ± 2.3 |
| Males (n = 21,962) | 33.1 ± 10.6 | 10.7 ± 4.5 | 5.2 ± 3.1 | 3.2 ± 1.6 | 2.5 ± 1.4 | 5.7 ± 2.5 | 4.0 ± 2.1 |
| 16–24 years (n = 9252) | 31.5 ± 10.5 | 9.7 ± 4.5 | 5.0 ± 3.0 | 3.0 ± 1.6 | 2.4 ± 1.4 | 5.6 ± 2.3 | 4.0 ± 2.1 |
| 25–34 years (n = 6035) | 30.7 ± 9.3 | 10.4 ± 4.3 | 4.2 ± 2.7 | 3.0 ± 1.6 | 2.5 ± 1.3 | 5.3 ± 2.3 | 3.5 ± 2.0 |
| 35–44 years (n = 2806) | 32.6 ± 9.4 | 11.4 ± 4.2 | 4.5 ± 2.8 | 3.3 ± 1.6 | 2.6 ± 1.3 | 5.4 ± 2.4 | 3.6 ± 1.9 |
| 45–54 years (n = 1821) | 33.4 ± 9.0 | 11.9 ± 4.1 | 4.9 ± 2.8 | 3.4 ± 1.6 | 2.6 ± 1.3 | 5.4 ± 2.3 | 3.6 ± 2.0 |
| 55–64 years (n = 1296) | 34.7 ± 8.7 | 12.6 ± 4.0 | 5.2 ± 2.7 | 3.5 ± 1.6 | 2.7 ± 1.2 | 5.4 ± 2.2 | 3.7 ± 1.9 |
| 65–74 years (n = 555) | 35.1 ± 8.2 | 12.6 ± 3.6 | 5.7 ± 2.6 | 3.6 ± 1.6 | 2.6 ± 1.2 | 5.3 ± 2.1 | 4.0 ± 2.0 |
| 75+ years (n = 197) | 36.8 ± 16.6 | 12.5 ± 6.2 | 6.3 ± 3.9 | 3.3 ± 1.8 | 3.0 ± 1.9 | 6.0 ± 3.5 | 4.0 ± 2.2 |
| p-value | <0.001 | <0.001 | <0.001 | <0.001 | <0.001 | <0.001 | <0.001 |
| females vs. males |
| Total Score | Vegetables | Fruit | Meat | Meat Alt. | Meat Adj. * | Meat Alt. Adj. * | Grains | Dairy | |
|---|---|---|---|---|---|---|---|---|---|
| Vegetarian | |||||||||
| Total (n = 9093) | 37.3 ± 9.9 | 12.6 ± 4.1 | 6.1 ± 2.8 | 0.7 ± 1.2 | 3.6 ± 1.4 | 0 ± 0 | 7.6 ± 3.1 | 6.2 ± 2.4 | 3.3 ± 2.3 |
| 16–24 years (n = 4470) | 36.5 ± 9.5 | 12.2 ± 4.0 | 6.0 ± 2.7 | 0.6 ± 1.1 | 3.5 ± 1.4 | 0 ± 0 | 7.5 ± 3.1 | 6.1 ± 2.3 | 3.1 ± 2.3 |
| 25–34 years (n = 2556) | 37.0 ± 8.7 | 12.8 ± 3.7 | 5.3 ± 2.6 | 0.6 ± 1.0 | 3.7 ± 1.3 | 0 ± 0 | 8.0 ± 2.9 | 6.0 ± 2.3 | 3.2 ± 2.2 |
| 35–44 years (n = 922) | 38.1 ± 9.3 | 13.3 ± 3.9 | 5.7 ± 2.7 | 0.7 ± 1.1 | 3.7 ± 1.3 | 0 ± 0 | 8.0 ± 2.9 | 6.2 ± 2.4 | 3.4 ± 2.2 |
| 45–54 years (n = 599) | 39.0 ± 8.9 | 14.0 ± 3.7 | 6.2 ± 2.7 | 0.8 ± 1.2 | 3.7 ± 1.3 | 0 ± 0 | 8.1 ± 2.9 | 5.9 ± 2.4 | 3.2 ± 2.3 |
| 55–64 years (n = 365) | 39.5 ± 9.5 | 14.1 ± 3.9 | 6.5 ± 2.6 | 0.8 ± 1.2 | 3.8 ± 1.4 | 0 ± 0 | 8.1 ± 3.1 | 5.9 ± 2.1 | 3.5 ± 2.2 |
| 65–74 years (n = 108) | 38.9 ± 9.2 | 14.49 ± 3.8 | 6.4 ± 2.4 | 1.1 ± 1.3 | 3.7 ± 1.3 | 0 ± 0 | 8.0 ± 3.0 | 5.2 ± 2.2 | 3.6 ± 2.0 |
| 75+ years (n = 73) | 35.5 ± 24.0 | 11.0 ± 8.6 | 6.5 ± 5.0 | 1.8 ± 1.7 | 3.5 ± 2.4 | 0 ± 0 | 7.4 ± 5.3 | 5.9 ± 4.9 | 3.2 ± 2.3 |
| Non-vegetarian | |||||||||
| Total (n = 84,159) | 33.8 ± 9.6 | 11.4 ± 4.3 | 5.5 ± 2.9 | 3.3 ± 1.5 | 2.5 ± 1.3 | 3.3 ± 1.5 | 2.5 ± 1.3 | 5.7 ± 2.3 | 4.0 ± 2.0 |
| 16–24 years (n = 32,759) | 32.1 ± 9.6 | 10.4 ± 4.3 | 5.3 ± 2.8 | 3.0 ± 1.5 | 2.3 ± 1.3 | 3.0 ± 1.5 | 2.3 ± 1.3 | 5.5 ± 2.2 | 4.0 ± 2.1 |
| 25–34 years (n = 23,512) | 32.7 ± 8.8 | 11.4 ± 4.0 | 4.8 ± 2.6 | 3.2 ± 1.5 | 2.5 ± 1.3 | 3.2 ± 1.5 | 2.5 ± 1.3 | 5.5 ± 2.2 | 3.8 ± 2.0 |
| 35–44 years (n = 11,400) | 34.2 ± 9.0 | 12.2 ± 4.0 | 5.1 ± 2.8 | 3.4 ± 1.4 | 2.6 ± 1.3 | 3.4 ± 1.4 | 2.6 ± 1.3 | 5.5 ± 2.3 | 3.8 ± 2.0 |
| 45–54 years (n = 8615) | 35.0 ± 9.0 | 12.9 ± 3.8 | 5.3 ± 2.8 | 3.6 ± 1.4 | 2.6 ± 1.2 | 3.6 ± 1.4 | 2.6 ± 1.2 | 5.4 ± 2.3 | 3.8 ± 1.9 |
| 55–64 years (n = 5475) | 36.3 ± 8.6 | 13.5 ± 3.6 | 5.8 ± 2.7 | 3.7 ± 1.4 | 2.7 ± 1.2 | 3.7 ± 1.4 | 2.7 ± 1.2 | 5.3 ± 2.2 | 4.0 ± 1.9 |
| 65–74 years (n = 2003) | 37.1 ± 8.4 | 13.7 ± 3.6 | 6.1 ± 2.6 | 3.8 ± 1.4 | 2.6 ± 1.2 | 3.8 ± 1.4 | 2.6 ± 1.2 | 5.3 ± 2.1 | 4.3 ± 1.9 |
| 75+ years (n = 395) | 35.8 ± 13.1 | 12.3 ± 5.3 | 6.1 ± 3.4 | 3.5 ± 1.7 | 2.8 ± 1.6 | 3.5 ± 1.7 | 2.8 ± 1.6 | 5.6 ± 2.9 | 4.2 ± 2.2 |
| p-value | <0.001 | <0.001 | <0.001 | <0.001 | <0.001 | <0.001 | <0.001 | <0.001 | <0.001 |
| vegetarian vs non-vegetarian # |
| Total Score | Vegetables | Fruit | Meat * | Meat Alt. * | Grains | Dairy | |
|---|---|---|---|---|---|---|---|
| Number of people meals are shared with | |||||||
| Yourself (n = 33,101) | 31.0 ± 9.9 | 10.1 ± 4.4 | 5.1 ± 2.9 | 2.6 ± 1.6 | 2.5 ± 1.4 | 5.2 ± 2.3 | 3.7 ± 2.1 |
| 1 other person (n = 35,313) | 34.5 ± 8.8 | 12.1 ± 4.0 | 5.2 ± 2.7 | 3.1 ± 1.6 | 2.6 ± 1.3 | 5.7 ± 2.2 | 3.9 ± 2.0 |
| ≥2 other people (n = 44,004) | 36.2 ± 9.5 | 12.1 ± 4.1 | 6.1 ± 2.9 | 3.3 ± 1.6 | 2.5 ± 1.4 | 6.1 ± 2.3 | 4.2 ± 2.1 |
| p-value | <0.001 | <0.001 | <0.001 | <0.001 | >0.050 | <0.001 | <0.001 |
| yourself vs. ≥ 2 other people # | |||||||
| p-value | <0.001 | <0.001 | <0.001 | <0.001 | <0.001 | <0.001 | <0.001 |
| 1 other person vs. ≥ 2 other people # | |||||||
| SEIFA decile † | |||||||
| 1 (n = 967) | 33.3 ± 10.2 | 12.0 ± 4.3 | 4.9 ± 3.0 | 3.2 ± 1.6 | 2.3 ± 1.4 | 5.3 ± 2.3 | 3.8 ± 2.0 |
| 2 (n = 1356) | 34.6 ± 10.0 | 12.5 ± 4.3 | 5.4 ± 2.9 | 3.4 ± 1.5 | 2.3 ± 1.3 | 5.4 ± 2.3 | 3.9 ± 2.0 |
| 3 (n = 1743) | 35.4 ± 9.6 | 12.9 ± 4.1 | 5.5 ± 2.9 | 3.3 ± 1.6 | 2.4 ± 1.4 | 5.5 ± 2.3 | 4.0 ± 2.0 |
| 4 (n = 2270) | 35.2 ± 9.5 | 12.9 ± 4.1 | 5.3 ± 2.9 | 3.4 ± 1.6 | 2.4 ± 1.3 | 5.5 ± 2.3 | 3.9 ± 2.0 |
| 5 (n = 2362) | 35.5 ± 9.4 | 13.0 ± 4.0 | 5.3 ± 2.8 | 3.4 ± 1.6 | 2.4 ± 1.3 | 5.7 ± 2.3 | 3.9 ± 2.0 |
| 6 (n = 3397) | 35.8 ± 9.1 | 13.0 ± 4.0 | 5.4 ± 2.8 | 3.3 ± 1.5 | 2.5 ± 1.3 | 5.7 ± 2.4 | 4.0 ± 2.0 |
| 7 (n = 2640) | 35.4 ± 8.8 | 13.1 ± 3.8 | 5.3 ± 2.7 | 3.3 ± 1.5 | 2.5 ± 1.3 | 5.5 ± 2.2 | 3.8 ± 1.9 |
| 8 (n = 3551) | 36.3 ± 8.9 | 13.3 ± 3.7 | 5.5 ± 2.7 | 3.3 ± 1.6 | 2.6 ± 1.3 | 5.8 ± 2.2 | 4.0 ± 1.9 |
| 9 (n = 5212) | 36.9 ± 8.5 | 13.4 ± 3.6 | 5.6 ± 2.7 | 3.4 ± 1.6 | 2.7 ± 1.3 | 5.9 ± 2.2 | 4.0 ± 1.9 |
| 10 (n = 5548) | 37.2 ± 8.6 | 13.5 ± 3.6 | 5.7 ± 2.7 | 3.4 ± 1.6 | 2.7 ± 1.3 | 5.9 ± 2.2 | 4.0 ± 2.0 |
| p-value SEIFA 1 vs. SEIFA 10 # | <0.001 | <0.001 | <0.001 | >0.050 | <0.001 | <0.001 | <0.01 |
| Total Score | Vegetables | Fruit | Meat * | Meat Alt. * | Grains | Dairy | |
|---|---|---|---|---|---|---|---|
| Number of times completed quiz # | |||||||
| First time (n = 116,234) | 34.1 ± 9.7 | 11.5 ± 4.3 | 5.5 ± 2.9 | 3.0 ± 1.6 | 2.6 ± 1.3 | 5.7 ± 2.3 | 4.0 ± 2.1 |
| Repeat (n = 3739) | 37.9 ± 11.6 | 12.4 ± 4.8 | 6.5 ± 3.0 | 3.1 ± 1.8 | 2.9 ± 1.5 | 6.4 ± 2.6 | 4.4 ± 2.1 |
| p-value first time vs. repeat † | <0.001 | <0.001 | <0.001 | <0.001 | <0.001 | <0.001 | <0.001 |
| Change in Total Score by Baseline Category * | Total Score # | 95% CI ‡ | p-Value † | Mean Time between HEQ Completions (Months) |
|---|---|---|---|---|
| Needs work (n = 303) | 3.1 ± 7.3 b,c,d | −3.9, −2.4 | p < 0.001 | 7.0 |
| Getting there (n = 204) | 0.5 ± 6.7 a,d | −1.3, 0.4 | p = 0.27 | 9.9 |
| Excellent (n = 280) | −0.4 ± 6.0 a,d | −0.3, 1.0 | p = 0.28 | 10.0 |
| Outstanding (n = 97) | −3.5 ± 7.1 a,b,c | 2.2, 4.8 | p < 0.001 | 10.6 |
© 2017 by the authors. Licensee MDPI, Basel, Switzerland. This article is an open access article distributed under the terms and conditions of the Creative Commons Attribution (CC BY) license (http://creativecommons.org/licenses/by/4.0/).
Share and Cite
Williams, R.L.; Rollo, M.E.; Schumacher, T.; Collins, C.E. Diet Quality Scores of Australian Adults Who Have Completed the Healthy Eating Quiz. Nutrients 2017, 9, 880. https://doi.org/10.3390/nu9080880
Williams RL, Rollo ME, Schumacher T, Collins CE. Diet Quality Scores of Australian Adults Who Have Completed the Healthy Eating Quiz. Nutrients. 2017; 9(8):880. https://doi.org/10.3390/nu9080880
Chicago/Turabian StyleWilliams, Rebecca L., Megan E. Rollo, Tracy Schumacher, and Clare E. Collins. 2017. "Diet Quality Scores of Australian Adults Who Have Completed the Healthy Eating Quiz" Nutrients 9, no. 8: 880. https://doi.org/10.3390/nu9080880
APA StyleWilliams, R. L., Rollo, M. E., Schumacher, T., & Collins, C. E. (2017). Diet Quality Scores of Australian Adults Who Have Completed the Healthy Eating Quiz. Nutrients, 9(8), 880. https://doi.org/10.3390/nu9080880