Impact of Second Trimester Maternal Dietary Intake on Gestational Weight Gain and Neonatal Birth Weight

 ,
, 
Abstract
:
1. Introduction
2. Materials and Methods
2.1. Design, Setting and Participants
2.2. Procedure
2.2.1. Nutrient Analysis Software Modification for Sri Lankan Food
- For curry/mixed dishes, ingredients were weighed to the nearest 1 g of edible portion using a standard kitchen weighing scale (Tanita, no. 1155).
- Dishes were cooked according to the validated recipes.
- The final products were measured using standard household measurement utensils.
2.2.2. Calculation of Estimated Energy Requirement (EER)
2.2.3. Recommended Dietary Allowance (RDA) of Protein
2.3. Data Analysis
2.4. Ethics
3. Results
3.1. Participants’Characteristics
3.2. Correlation among Maternal Parameters, GWG and Neonatal Birth Weight
3.3. Effects of Maternal and Neonatal Characteristics on GWG
3.4. Effects of Maternal and Neonatal Characteristics on Neonatal Birth Weight
3.5. Effects of Supplemental Foods on GWG and Neonatal Birth Weight
4. Discussion
4.1. Limitations
4.2. Implications
5. Conclusions
Supplementary Materials
Acknowledgments
Author Contributions
Conflicts of Interest
References
- Ministry of Health. Annual Health Bulletin; Ministry of Health, Nutrition and Indigenous Medicine: Colombo, Sri Lanka, 2012. [Google Scholar]
- Patterson, R.M.; Prihoda, T.J.; Gibbs, C.E.; Wood, R.C. Analysis of birth weight percentile as a predictor of perinatal outcome. Obstet. Gynecol. 1986, 68, 459–463. [Google Scholar] [PubMed]
- Joseph, K.S.; Kramer, M.S. Recent trends in infant mortality rates and proportions of low-birth-weight live births in Canada. CMAJ 1997, 15, 535–541. [Google Scholar]
- Barker, D.J.P. Mothers, Babies and Health in Later Life, 2nd ed.; Churchill Livingstone: Edinburgh, UK, 1998. [Google Scholar]
- Ramakrishnan, U. Nutrition and low birth weight: From research to practice. Am. J. Clin. Nutr. 2004, 79, 17–21. [Google Scholar] [PubMed]
- World Health Organization. Global Database on Body Mass Index. Available online: http://apps.who.int/bmi/index.jsp?introPage=intro-3.html (accessed on 10 April 2016).
- Institute of Medicine. Weight Gain during Pregnancy: Reexamining the Guidelines (2009). Available online: http://www.nationalacademies.org/hmd/~/media/Files/Report%20Files/2009/Weight-Gain-During-Pregnancy-Reexamining-the-Guidelines/Report%20Brief%20-%20Weight%20Gain%20During%20Pregnancy.pdf (accessed on 10 March 2017).
- Jayawardena, R.; Swaminathan, S.; Byrne, N.M.; Soares, M.J.; Katulanda, P.; Hills, A.P. Development of a food frequency questionnaire for Sri Lankan adults. Nutr. J. 2012, 11, 63. [Google Scholar] [CrossRef] [PubMed]
- Jayawardena, R.; Byrne, N.M.; Soares, M.J.; Katulanda, P.; Hills, A.P. Validity of a food frequency questionnaire to assess nutritional intake among Sri Lankan adults. SpringerPlus 2016, 5, 162. [Google Scholar] [CrossRef] [PubMed]
- Wimalasiri, W.R. Composition of Sri Lankan foods; Faculty of Dental Sciences, University of Peradeniya: Peradeniya, Sri Lanka, 1999. [Google Scholar]
- United States Department of Agriculture. USDA Food Composition Databases. Available online: https://ndb.nal.usda.gov/ndb/ (accessed on 5 May 2016).
- Dissanayake, C. Ceylon Cookery, 6th ed.; Stamford Lake (Pvt) Ltd.: Pannipitiya, Sri Lanka, 2005. [Google Scholar]
- Jayawardena, R.; Thennakoon, S.; Byrne, N.; Soares, M.; Katulanda, P.; Hills, A. Energy and nutrient intakes among Sri Lankan adults. Int. Arch. Med. 2014, 7, 34. [Google Scholar] [CrossRef] [PubMed]
- Institute of Medicine. Weight Gain during Pregnancy: Reexamining the Guidelines (2009). Available online: https://www.ncbi.nlm.nih.gov/books/NBK32812/ (accessed on 13 June 2016).
- Institute of Medicine. Dietary Reference Intakes for Energy, Carbohydrate, Fiber, Fat, Fatty Acids, Cholesterol, Protein and Amino Acids. Available online: http://www.nationalacademies.org/hmd/Home/Global/News%20Announcements/%20DRI (accessed on 3 June 2016).
- Ministry of Health, Nutrition and Indigenous Medicine. Annual Health Bulletin; Ministry of Health, Nutrition and Indigenous Medicine: Colombo, Sri Lanka, 2014. [Google Scholar]
- Abeysena, C.; Jayawardana, P. Body mass index and gestational weight gain in two selected Medical Officer of Health areas in the Gampaha District. J. Coll. Community Physicians Sri Lanka 2011, 16, 30–34. [Google Scholar] [CrossRef]
- Mathews, F.; Yudkin, P.; Neil, A. Influence of maternal nutrition on outcome of pregnancy: Prospective cohort study. BMJ 1999, 319, 339–343. [Google Scholar] [CrossRef] [PubMed]
- Kubota, K.; Itoh, H.; Tasaka, M.; Naito, H.; Fukuoka, Y.; Muramatsu, K.; Kobayashi, K.; Sugihara, K.; Kanayama, N.; Hamamatsu Birth Cohort Study Team. Changes of maternal dietary intake, body weight and fetal growth throughout pregnancy in pregnant Japanese women. J. Obstet. Gynaecol. Res. 2013, 39, 1383–1390. [Google Scholar] [CrossRef] [PubMed]
- Godfrey, K.; Robinson, S.; Barker, D.J.P.; Osmond, C.; Cox, V. Maternal nutrition in early and late pregnancy in relation to placental and fetal growth. BMJ 1996, 312, 410–414. [Google Scholar] [CrossRef] [PubMed]

| Variable | Mean (SD) | n (%) |
|---|---|---|
| Age (years) | 28.8 (6.2) | - |
| Gestational age (weeks) a | 38.8 (1.5) | - |
| Pre-pregnancy weight (kg) b | 51.9 (10.2) | - |
| Pre-pregnancy BMI (kg/m2) | 22.1 (4.3) | - |
| Parity | ||
| Primiparous | - | 47 (33.3) |
| Multiparous | - | 94 (66.7) |
| Presence of hyperemesis gravidarum c | - | 23 (16.3) |
| History of miscarriage or abortion | - | 38 (26.9) |
| History of LBW delivery | - | 28 (19.9) |
| Total energy intake (kcal/day) | 2921.5 (687.7) | - |
| Carbohydrate intake (g/day) | 532.7 (133.8) | - |
| Total protein intake (g/day) | 71.2 (16.8) | - |
| Fat intake (g/day) | 45.8 (16.9) | - |
| Variable | Sub-category | n | GWG up to 28 Weeks (n = 105) Mean (SD) | 95% CI | p-Value | Total GWG (n = 119) Mean (SD) | 95% CI | p-Value |
|---|---|---|---|---|---|---|---|---|
| All | - | 6.33 (2.85) | 5.78–6.89 | - | 9.30 (3.72) | 8.63–9.98 | - | |
| Education level | None/primary | 16 | 5.72 (2.80) | 4.20–7.24 | 0.519 | 7.34 (3.72) | 5.51–9.17 | 0.072 |
| Secondary | 99 | 6.46 (2.92) | 5.85–7.07 | 9.64 (3.71) | 8.90–10.37 | |||
| Higher | 2 | 5.13 (0.11) | 1.84–8.42 | 8.60 (0.57) | 3.42–13.78 | |||
| Income level (LKR (Sri Lankan rupee)) | <9000 | 5 | 6.67 (2.57) | 3.33–10.00 | 0.978 | 9.08 (4.91) | 5.75–12.41 | 0.474 |
| 9000–13,999 | 20 | 6.09 (2.62) | 4.73–7.46 | 8.30 (3.44) | 6.64–9.96 | |||
| 14,000–19,999 | 32 | 6.27 (3.35) | 5.26–7.27 | 9.42 (3.23) | 8.11–10.74 | |||
| 20,000–31,999 | 45 | 6.52 (2.77) | 5.60–7.45 | 9.23 (4.21) | 8.12–10.34 | |||
| ≥32,000 | 16 | 6.04 (2.44) | 4.30–7.79 | 10.70 (3.31) | 8.77–12.61 | |||
| Area of residence | Urban | 9 | 4.53 (3.49) | 2.40–6.66 | 0.167 | 7.44 (3.93) | 4.97–9.92 | 0.306 |
| Sub-urban | 52 | 6.68 (3.33) | 5.86–7.50 | 9.28 (3.99) | 8.25–10.31 | |||
| Rural | 55 | 6.18 (2.15) | 5.37–7.00 | 9.52 (3.46) | 8.52–10.52 | |||
| History of LBW deliveries | Yes | 22 | 5.33 (3.03) | 4.14–6.52 | 0.062 | 8.04 (3.36) | 6.48–9.59 | 0.077 |
| No | 97 | 6.60 (2.76) | 5.99–7.21 | 9.60 (3.76) | 8.85–10.33 | |||
| History of miscarriage or abortion | Yes | 32 | 6.47 (2.75) | 5.43–7.51 | 0.759 | 8.87 (3.75) | 7.56–10.17 | 0.442 |
| No | 87 | 6.28 (2.91) | 5.62–6.94 | 9.46 (3.77) | 8.67–10.25 | |||
| Hyperemesis gravidarum a | Yes | 20 | 6.34 (3.21) | 5.03–7.65 | 0.978 | 9.04 (4.20) | 7.37–10.70 | 0.730 |
| No | 97 | 6.32 (2.80) | 5.70–6.93 | 9.36 (3.67) | 8.60–10.12 | |||
| Parity | Primiparous | 40 | 6.89 (2.39) | 5.86–7.92 | 0.208 | 10.00(4.00) | 8.84–11.16 | 0.146 |
| Multiparous | 79 | 6.11 (3.00) | 5.46–6.76 | 8.95 (3.54) | 8.12–9.77 | |||
| Pre-pregnancy BMI category b | Underweight | 23 | 8.43 (2.94) 1 | 7.24–9.62 | <0.001 * | 12.00(4.07) 1 | 10.58–13.43 | <0.001 * |
| Normal | 69 | 6.18 (2.26) 2 | 5.51–6.85 | 9.10 (3.12) 2 | 8.27–9.92 | |||
| Overweight | 20 | 5.73 (3.38) 2,3 | 4.60–6.86 | 7.89 (3.81) 2 | 6.37–9.42 | |||
| Obese | 7 | 2.76 (0.97) 3 | 0.44–5.08 | 6.50 (3.30) 2 | 3.92–9.08 | |||
| Energy intake c | <EER | 21 | 5.57 (3.04) | 4.32–6.82 | 0.188 | 8.05 (3.44) | 6.44–9.67 | 0.083 |
| ≥EER | 93 | 6.51 (2.85) | 5.87–7.16 | 9.62 (3.80) | 8.86–10.39 | |||
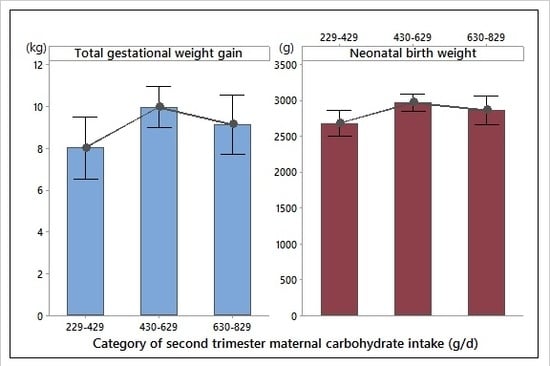
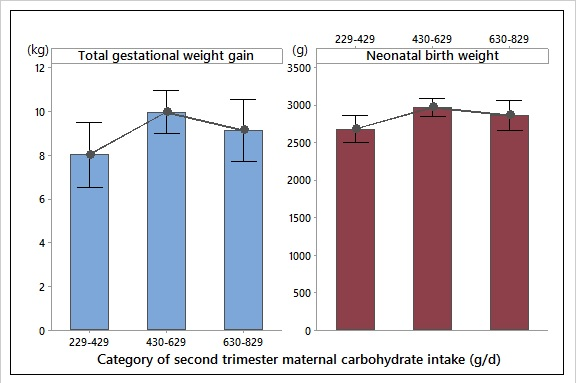
| Carbohydrate intake (g/day) | 229–429 | 25 | 5.97 (3.08) | 4.78–7.15 | 0.798 | 8.03 (3.60) | 6.56–9.50 | 0.089 |
| 430–629 | 58 | 6.41 (2.99) | 5.60–7.23 | 10.00 (3.68) | 9.03–10.96 | |||
| 630–829 | 31 | 6.45 (2.63) | 5.29–7.61 | 9.16 (3.88) | 7.84–10.49 | |||
| Protein intake d | <RDA | 21 | 5.49 (3.21) | 4.24–6.74 | 0.141 | 7.81 (3.56) | 6.20–9.41 | 0.039 * |
| ≥RDA | 93 | 6.53 (2.80) | 5.89–7.18 | 9.68 (3.74) | 8.92–10.44 | |||
| Sex of the newborn | Male | 53 | 6.44 (2.78) | 5.63–7.25 | 0.552 | 9.23 (3.31) | 8.25–10.21 | 0.976 |
| Female | 53 | 6.10 (2.75) | 5.28–6.91 | 9.21 (3.86) | 8.23–10.19 |
| Variable in Model | Coefficient | 95% CI | t | p-Value |
|---|---|---|---|---|
| Constant | 11.35 | 8.30–14.39 | 7.4 | <0.001 * |
| Continuous variables | ||||
| Fat intake | −0.04 | −0.08–0.00 | −1.77 | 0.08 |
| Categorical variables | ||||
| Education (none/primary)—reference level | ||||
| Education (secondary) | 2.19 | 0.40–3.97 | 2.43 | 0.017 * |
| Education (higher) | −1.29 | −6.24–3.65 | −0.52 | 0.605 |
| Pre-pregnancy BMI category (underweight)—reference level | ||||
| Pre-pregnancy BMI category (normal) | −3.84 | −5.49–−2.19 | −4.62 | <0.001 * |
| Pre-pregnancy BMI category (overweight) | −4.80 | −6.96–−2.64 | −4.41 | <0.001 * |
| Pre-pregnancy BMI category (obese) | −5.44 | −8.49–−2.40 | −3.55 | 0.001 * |
| Parity (primiparous)—reference level | ||||
| Parity (multiparous) | −0.93 | −2.27–0.41 | −1.38 | 0.171 |
| Category of carbohydrate intake (229–429 g/day)—reference level | ||||
| Category of carbohydrate intake (430–629 g/day) | 2.26 | 0.43–4.08 | 2.45 | 0.016 * |
| Category of carbohydrate intake (630–829 g/day) | 1.60 | −0.49–3.7 | 1.52 | 0.132 |
| Category of protein intake (<RDA)—reference level | ||||
| Category of protein intake (≥RDA) | 0.42 | −1.68–2.52 | 0.4 | 0.691 |
| Variable | Sub-category | n | Birth Weight (g) Mean (SD) | 95% CI | p-Value |
|---|---|---|---|---|---|
| All | - | 126 | 2874.6 (497) | 2787.0–2962.2 | - |
| Education level | None/primary | 20 | 2831 (428) | 2612.5–3049.5 | 0.629 |
| Secondary | 100 | 2867.6 (508) | 2769.9–2965.3 | ||
| Higher | 4 | 3091 (391) | 2603–3580 | ||
| Income level (LKR) | <9000 | 5 | 3130 (432) | 2702–3558 | 0.093 |
| 9000–13,999 | 22 | 2702 (499) | 2498–2906 | ||
| 14,000–19,999 | 31 | 2965 (573) | 2793–3136 | ||
| 20,000–31,999 | 50 | 2803.3 (454) | 2667.9–2938.7 | ||
| ≥32,000 | 16 | 3036.9 (352.8) | 2797.6–3276.2 | ||
| Area of residence | Urban | 13 | 2754 (519) 1,2 | 2492–3016 | 0.011 * |
| Sub-urban | 54 | 2747.1 (461.9) 1 | 2618.0–2875.7 | ||
| Rural | 57 | 3011.4 (481.9) 2 | 2886.3–3136.5 | ||
| History of LBW deliveries | Yes | 24 | 2684.2 (418.2) | 2486.1–2882.2 | 0.036 * |
| No | 102 | 2919.4 (505.2) | 2823.3–3015.4 | ||
| History of miscarriage or abortion | Yes | 33 | 2898.9 (507.6) | 2727.1–3070.8 | 0.744 |
| No | 93 | 2865.9 (495.7) | 2763.5–2968.3 | ||
| Hyperemesis gravidarum a | Yes | 20 | 2800.5 (366.5) | 2582.4–3018.6 | 0.499 |
| No | 104 | 2882.1 (512.5) | 2786.4–2977.7 | ||
| Parity | Primiparous | 45 | 2770.1 (430.5) | 2624.7–2915.5 | 0.079 |
| Multiparous | 81 | 2932.6 (523.9) | 2824.2–3041.0 | ||
| Pre-pregnancy BMI category b | Underweight | 27 | 2771.5 (459.8) | 2523.2–2899.8 | 0.231 |
| Normal | 70 | 2912.5 (442.5) | 2795.5–3029.5 | ||
| Overweight | 22 | 2895 (673) | 2687–3104 | ||
| Obese | 7 | 3059 (464) | 2689–3428 | ||
| Total GWG category | Within recommended | 32 | 2912.8 (539.7) 1,2 | 2740.8–3084.8 | 0.042 * |
| Below recommended | 71 | 2863.9 (458.5) 1 | 2748.4–2979.3 | ||
| Over recommended | 3 | 3600 (721) 2 | 3038–4162 | ||
| Energy intake c | <EER | 24 | 2692 (533) | 2491–2892 | 0.039 * |
| ≥EER | 97 | 2927.8 (487) | 2828.0–2037.6 | ||
| Carbohydrate intake (g/day) | 229–429 | 30 | 2686.7 (498.1) 1 | 2508.5–2864.9 | 0.033 |
| 430–629 | 64 | 2957.7 (486) 2 | 2853.7–3097.7 | ||
| 630–829 | 27 | 2872.2 (503.6) 1,2 | 2684.4–3060.1 | ||
| Protein intake d | <RDA | 24 | 2913 (601) | 2708–3117 | 0.733 |
| ≥RDA | 97 | 2873.1 (479.1) | 2771.6–2974.7 | ||
| Sex of the newborn | Male | 61 | 2852.9 (477.3) | 2726.5–2979.2 | 0.637 |
| Female | 65 | 2894.9 (517.7) | 2772.5–3017.3 |
| Variable in Model | Coefficient | 95% CI | t | p-Value |
|---|---|---|---|---|
| Constant | −2011 | −4349–327 | −1.71 | 0.091 |
| Continuous variables | ||||
| Pre-pregnancy BMI | 23.7 | 3.0–44.4 | 2.27 | 0.025 * |
| Gestational age | 102.1 | 46.7–157.5 | 3.65 | <0.001 * |
| Fat intake | −2.83 | −8.21–2.54 | −1.05 | 0.298 |
| Categorical variables | ||||
| Income (<9000 LKR)—reference level | ||||
| Income (9000–13,999 LKR) | −209 | −679–262 | −0.88 | 0.381 |
| Income (14,000–19,999 LKR) | −43 | −495–410 | −0.19 | 0.852 |
| Income (20,000–31,999 LKR) | −74 | −523–374 | −0.33 | 0.743 |
| Income (≥32,000 LKR) | 156 | −322–634 | 0.65 | 0.518 |
| Area of residence (urban)—reference level | ||||
| Area of residence (sub-urban) | 36 | −235–308 | 0.27 | 0.791 |
| Area of residence (rural) | 258 | −14–529 | 1.88 | 0.062 |
| History of LBW deliveries (yes)—reference level | ||||
| History of LBW deliveries (no) | 209 | −6.0–424.0 | 1.93 | 0.057 |
| Parity (primiparous)—reference level | ||||
| Parity (multiparous) | 187.4 | 3.2–371.6 | 2.02 | 0.046 * |
| Category of carbohydrate intake (229–429 g/day)—reference level | ||||
| Category of carbohydrate intake (430–629 g/day) | 312 | 91–534 | 2.8 | 0.006 * |
| Category of carbohydrate intake (630–829 g/day) | 237 | −44–517 | 1.67 | 0.097 |
| Category of protein intake (<RDA)—reference level | ||||
| Category of protein intake (≥RDA) | −66 | −326–194 | −0.51 | 0.615 |
© 2017 by the authors. Licensee MDPI, Basel, Switzerland. This article is an open access article distributed under the terms and conditions of the Creative Commons Attribution (CC BY) license (http://creativecommons.org/licenses/by/4.0/).
Share and Cite
Pathirathna, M.L.; Sekijima, K.; Sadakata, M.; Fujiwara, N.; Muramatsu, Y.; Wimalasiri, K.M.S. Impact of Second Trimester Maternal Dietary Intake on Gestational Weight Gain and Neonatal Birth Weight. Nutrients 2017, 9, 627. https://doi.org/10.3390/nu9060627
Pathirathna ML, Sekijima K, Sadakata M, Fujiwara N, Muramatsu Y, Wimalasiri KMS. Impact of Second Trimester Maternal Dietary Intake on Gestational Weight Gain and Neonatal Birth Weight. Nutrients. 2017; 9(6):627. https://doi.org/10.3390/nu9060627
Chicago/Turabian StylePathirathna, Malshani L., Kayoko Sekijima, Mieko Sadakata, Naoshi Fujiwara, Yoshiyuki Muramatsu, and Kuruppu M.S. Wimalasiri. 2017. "Impact of Second Trimester Maternal Dietary Intake on Gestational Weight Gain and Neonatal Birth Weight" Nutrients 9, no. 6: 627. https://doi.org/10.3390/nu9060627
APA StylePathirathna, M. L., Sekijima, K., Sadakata, M., Fujiwara, N., Muramatsu, Y., & Wimalasiri, K. M. S. (2017). Impact of Second Trimester Maternal Dietary Intake on Gestational Weight Gain and Neonatal Birth Weight. Nutrients, 9(6), 627. https://doi.org/10.3390/nu9060627