Polyphenol Levels Are Inversely Correlated with Body Weight and Obesity in an Elderly Population after 5 Years of Follow Up (The Randomised PREDIMED Study)

 , ,
, ,  ,
,  ,
, 

Abstract
:1. Introduction
2. Materials and Methods
2.1. Ethics Statement
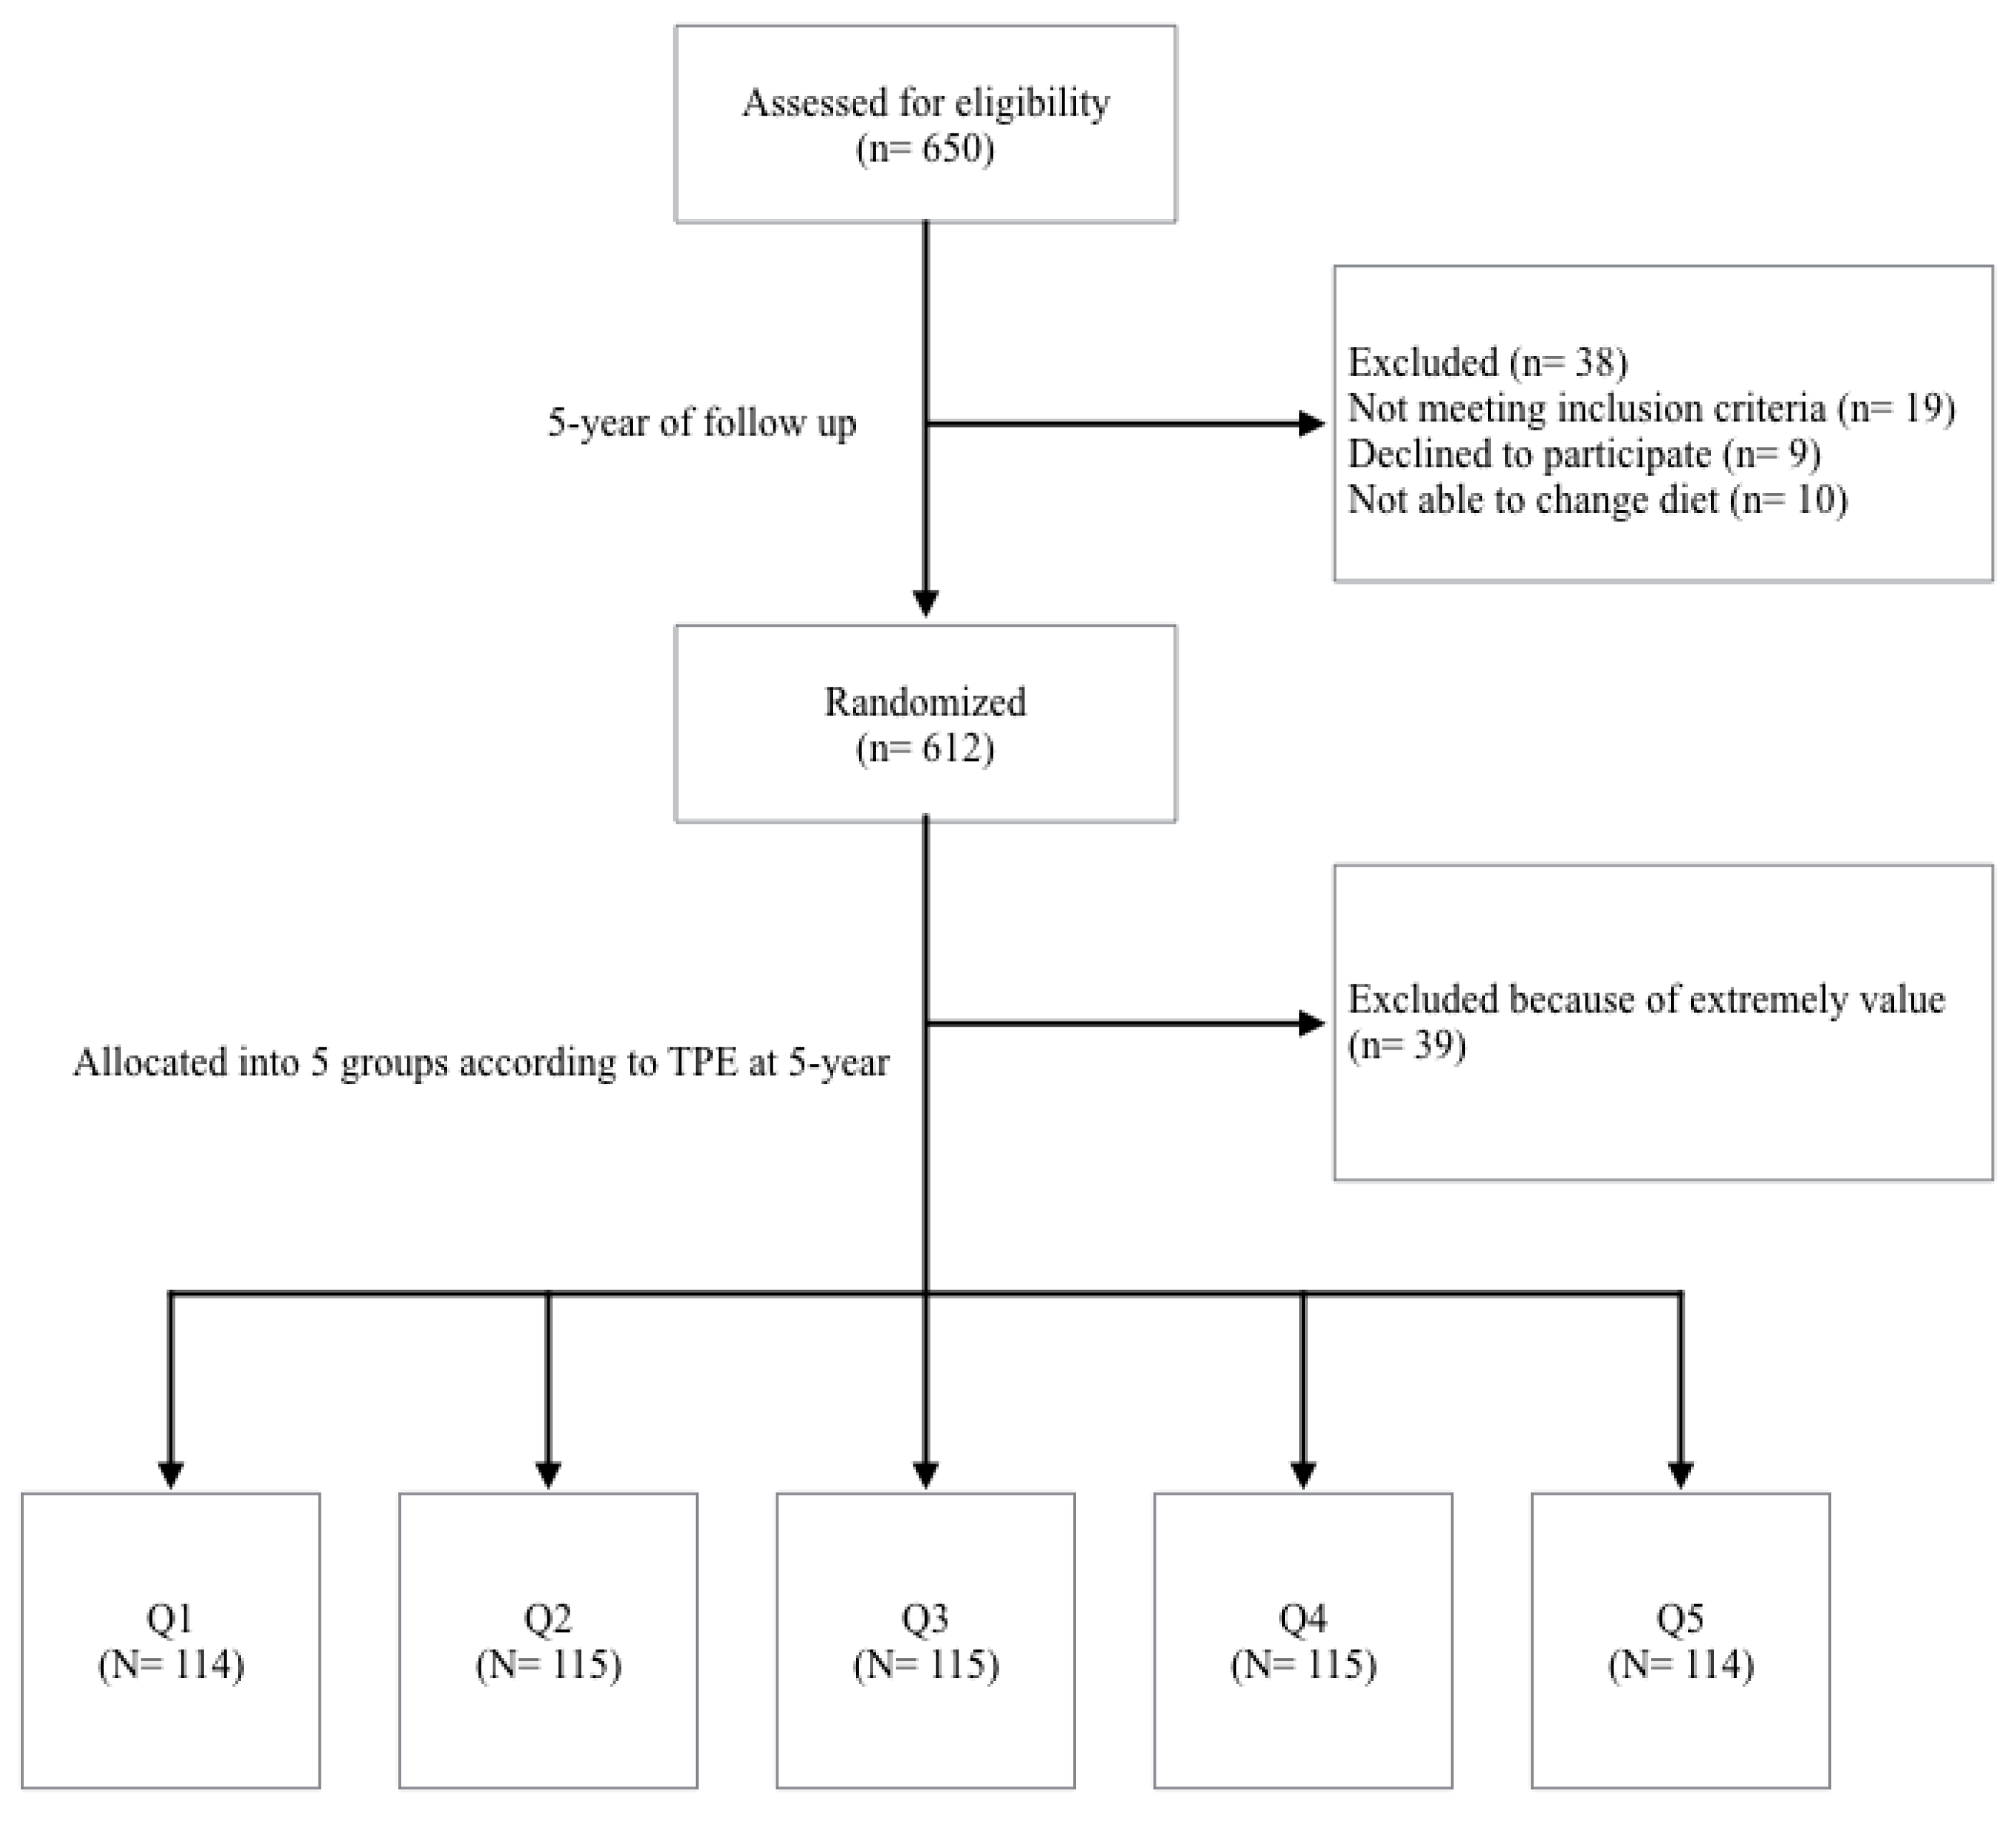
2.2. Subjects
2.3. Nutritional Measurements
2.4. Urine Samples
2.5. TPE Measurements
2.6. Measurements
2.7. Statistical Analysis
3. Results
4. Discussion
5. Conclusions
Supplementary Materials
Acknowledgments
Author Contributions
Conflicts of Interest
References
- Ng, M.; Fleming, T.; Robinson, M.; Thomson, B.; Graetz, N.; Margono, C.; Mullany, E.C.; Biryukov, S.; Alfonso, R.; Ali, M.K.; et al. Global, regional, and national prevalence of overweight and obesity in children and adults during 1980–2013: A systematic analysis for the Global Burden of Disease Study 2013. Lancet 2014, 384, 766–781. [Google Scholar] [CrossRef]
- World Health Organization. Obesity and Overweight. Available online: http://www.who.int/mediacentre/factsheets/fs311/en (accessed on 2 August 2016).
- Directorate-General for Health and Consumers. Strategy for Europe on Nutrition, Overweight and Obesity Related Health Issues; Implementation Progress Report; European Commission: Brussels, Belgium, December 2010. [Google Scholar]
- Fitch, A.; Everling, L.; Fox, C.; Goldberg, J.; Heim, C.; Johnson, K.; Kaufman, T.; Kennedy, E.; Kestenbaun, C.; Leslie, D.; et al. Prevention and Management of Obesity for Adults. ICSI Health Care Guideline, 2013. Available online: https://www.healthpartners.com/ucm/groups/public/@hp/@public/documents/documents/cntrb_037112.pdf (accessed on 2 August 2016).
- Malik, V.S.; Willett, W.C.; Hu, F.B. Global obesity: Trends, risk factors and policy implications. Nat. Rev. Endocrinol. 2013, 9, 13–27. [Google Scholar] [CrossRef] [PubMed]
- Ross, R.; Blair, S.; de Lannoy, L.; Després, J.-P.; Lavie, C.J. Changing the endpoints for determining effective obesity management. Prog. Cardiovasc. Dis. 2015, 57, 330–336. [Google Scholar] [CrossRef] [PubMed]
- Scalbert, A.; Williamson, G. Dietary intake and bioavailability of polyphenols. J. Nutr. 2000, 130, 2073–2085. [Google Scholar]
- Meydani, M.; Hasan, S.T. Dietary polyphenols and obesity. Nutrients 2010, 2, 737–751. [Google Scholar] [CrossRef] [PubMed]
- Wang, S.; Moustaid-Moussa, N.; Chen, L.; Mo, H.; Shastri, A.; Su, R.; Bapat, P.; Kwun, I.; Shen, C.L. Novel insights of dietary polyphenols and obesity. J. Nutr. Biochem. 2014, 25, 1–18. [Google Scholar] [CrossRef] [PubMed]
- Rangel-Huerta, O.D.; Aguilera, C.M.; Martin, M.V.; Soto, M.J.; Rico, M.C.; Vallejo, F.; Tomas-Barberan, F.; Perez-de-la-Cruz, A.J.; Gil, A.; Mesa, M.D. Normal or high polyphenol concentration in orange juice affects antioxidant activity, blood pressure, and body weight in obese or overweight adults. J. Nutr. 2015, 145, 1808–1816. [Google Scholar] [CrossRef] [PubMed]
- Janssens, P.L.H.R.; Hursel, R.; Westerterp-Plantenga, M.S. Long-term green tea extract supplementation does not affect fat absorption, resting energy expenditure, and body composition in adults. J. Nutr. 2015, 145, 864–870. [Google Scholar] [CrossRef] [PubMed]
- Bell, Z.W.; Canale, R.E.; Bloomer, R.J. A dual investigation of the effect of dietary supplementation with licorice flavonoid oil on anthropometric and biochemical markers of health and adiposity. Lipids Health Dis. 2011, 10, 29. [Google Scholar] [CrossRef] [PubMed]
- Dallas, C.; Gerbi, A.; Elbez, Y.; Caillard, P.; Zamaria, N.; Cloarec, M. Clinical study to assess the efficacy and safety of a citrus polyphenolic extract of red orange, grapefruit, and orange (Sinetrol-XPur) on weight management and metabolic parameters in healthy overweight individuals. Phytother. Res. 2014, 28, 212–218. [Google Scholar] [CrossRef] [PubMed]
- Most, J.; Goossens, G.H.; Jocken, J.W.E.; Blaak, E.E. Short-term supplementation with a specific combination of dietary polyphenols increases energy expenditure and alters substrate metabolism in overweight subjects. Int. J. Obes. 2014, 38, 698–706. [Google Scholar] [CrossRef] [PubMed]
- Barth, S.W.; Koch, T.C.L.; Watzl, B.; Dietrich, H.; Will, F.; Bub, A. Moderate effects of apple juice consumption on obesity-related markers in obese men: Impact of diet-gene interaction on body fat content. Eur. J. Nutr. 2012, 51, 841–850. [Google Scholar] [CrossRef] [PubMed]
- Cases, J.; Romain, C.; Dallas, C.; Gerbi, A.; Cloarec, M. Regular consumption of Fiit-ns, a polyphenol extract from fruit and vegetables frequently consumed within the Mediterranean diet, improves metabolic ageing of obese volunteers: A randomized, double-blind, parallel trial. Int. J. Food Sci. Nutr. 2015, 66, 120–125. [Google Scholar] [CrossRef] [PubMed]
- Almoosawi, S.; Fyfe, L.; Ho, C.; Al-Dujaili, E. The effect of polyphenol-rich dark chocolate on fasting capillary whole blood glucose, total cholesterol, blood pressure and glucocorticoids in healthy overweight and obese subjects. Br. J. Nutr. 2010, 103, 842–850. [Google Scholar] [CrossRef] [PubMed]
- Medina-Remón, A.; Tresserra-Rimbau, A.; Pons, A.; Tur, J.A.; Martorell, M.; Ros, E.; Buil-Cosiales, P.; Sacanella, E.; Covas, M.I.; Corella, D.; et al. Effects of total dietary polyphenols on plasma nitric oxide and blood pressure in a high cardiovascular risk cohort. The PREDIMED randomized trial. Nutr. Metab. Cardiovasc. Dis. 2015, 25, 60–67. [Google Scholar] [CrossRef] [PubMed]
- Medina-Remón, A.; Barrionuevo-González, A.; Zamora-Ros, R.; Andres-Lacueva, C.; Estruch, R.; Martínez-González, M.A.; Diez-Espino, J.; Lamuela-Raventos, R.M. Rapid Folin-Ciocalteu method using microtiter 96-well plate cartridges for solid phase extraction to assess urinary total phenolic compounds, as a biomarker of total polyphenols intake. Anal. Chim. Acta 2009, 634, 54–60. [Google Scholar] [CrossRef] [PubMed]
- Zamora-Ros, R.; Rabassa, M.; Cherubini, A.; Urpi-Sarda, M.; Llorach, R.; Bandinelli, S.; Ferrucci, L.; Andres-Lacueva, C. Comparison of 24-h volume and creatinine-corrected total urinary polyphenol as a biomarker of total dietary polyphenols in the Invecchiare InCHIANTI study. Anal. Chim. Acta 2011, 704, 110–115. [Google Scholar] [CrossRef] [PubMed]
- Urpi-Sarda, M.; Andres-Lacueva, C.; Rabassa, M.; Ruggiero, C.; Zamora-Ros, R.; Bandinelli, S.; Ferrucci, L.; Cherubini, A. The relationship between urinary total polyphenols and the frailty phenotype in a community-dwelling older population: The InCHIANTI study. J. Gerontol. A Biol. Sci. Med. Sci. 2015, 70, 1141–1147. [Google Scholar] [CrossRef] [PubMed]
- Martínez-González, M.Á.; Corella, D.; Salas-Salvadó, J.; Ros, E.; Covas, M.I.; Fiol, M.; Wärnberg, J.; Arós, F.; Ruíz-Gutiérrez, V.; Lamuela-Raventós, R.M.; et al. Cohort profile: Design and methods of the PREDIMED study. Int. J. Epidemiol. 2012, 41, 377–385. [Google Scholar] [CrossRef] [PubMed]
- Fernández-Ballart, J.D.; Piñol, J.L.; Zazpe, I.; Corella, D.; Carrasco, P.; Toledo, E.; Perez-Bauer, M.; Martínez-González, M.A.; Salas-Salvadó, J.; Martín-Moreno, J.M. Relative validity of a semi-quantitative food-frequency questionnaire in an elderly Mediterranean population of Spain. Br. J. Nutr. 2010, 103, 1808–1816. [Google Scholar] [CrossRef] [PubMed]
- Martínez-González, M.A.; Fernández-Jarne, E.; Serrano-Martínez, M.; Wright, M.; Gomez-Gracia, E. Development of a short dietary intake questionnaire for the quantitative estimation of adherence to a cardioprotective Mediterranean diet. Eur. J. Clin. Nutr. 2004, 58, 1550–1552. [Google Scholar] [CrossRef] [PubMed]
- Elosua, R.; Marrugat, J.; Molina, L.; Pons, S.; Pujol, E. Validation of the Minnesota Leisure Time Physical Activity Questionnaire in Spanish men. Am. J. Epidemiol. 1994, 139, 1197–1209. [Google Scholar] [CrossRef] [PubMed]
- Willett, W.C.; Howe, R. Adjustmentfor total energyintake in epidemiologic studies. Am. J. Clin. Nutr. 1997, 65, 1220–1228. [Google Scholar]
- Toledo, E.; Hu, F.B.; Estruch, R.; Buil-Cosiales, P.; Corella, D.; Salas-Salvadó, J.; Covas, M.I.; Arós, F.; Gómez-Gracia, E.; Fiol, M.; et al. Effect of the Mediterranean diet on blood pressure in the PREDIMED trial: Results from a randomized controlled trial. BMC Med. 2013, 11, 207. [Google Scholar] [CrossRef] [PubMed]
- Martínez-González, M.A.; García-Arellano, A.; Toledo, E.; Salas-Salvadó, J.; Buil-Cosiales, P.; Corella, D.; Covas, M.I.; Schröder, H.; Arós, F.; Gómez-Gracia, E.; et al. A 14-item mediterranean diet assessment tool and obesity indexes among high-risk subjects: The PREDIMED trial. PLoS ONE 2012, 7, e43134. [Google Scholar] [CrossRef] [PubMed]
- Razquin, C.; Martinez, J.; Martinez-Gonzalez, M.; Mitjavila, M.T.; Estruch, R.; Marti, A. A 3 years follow-up of a Mediterranean diet rich in virgin olive oil is associated with high plasma antioxidant capacity and reduced body weight gain. Eur. J. Clin. Nutr. 2009, 63, 1387–1393. [Google Scholar] [CrossRef] [PubMed]
- Estruch, R.; Martínez-González, M.; Corella, D.; Basora-Gallisá, J.; Ruiz-Gutiérrez, V.; Covas, M.I.; Fiol, M.; Gómez-Gracia, E.; López-Sabater, M.C.; Escoda, R.; et al. Effects of dietary fibre intake on risk factors for cardiovascular disease in subjects at high risk. J. Epidemiol. Community Health 2009, 63, 582–588. [Google Scholar] [CrossRef] [PubMed]
- Ibarrola-Jurado, N.; Bulló, M.; Guasch-Ferré, M.; Ros, E.; Martínez-González, M.A.; Corella, D.; Fiol, M.; Wärnberg, J.; Estruch, R.; Román, P.; et al. Cross-Sectional Assessment of Nut Consumption and Obesity, Metabolic Syndrome and Other Cardiometabolic Risk Factors: The PREDIMED Study. PLoS ONE 2013, 8, e57367. [Google Scholar] [CrossRef] [PubMed]
- Bautista-Castaño, I.; Sánchez-Villegas, A.; Estruch, R.; Martínez-González, M.A.; Corella, D.; Salas-Salvadó, J.; Covas, M.I.; Schroder, H.; Alvarez-Pérez, J.; Quilez, J.; et al. Changes in bread consumption and 4-year changes in adiposity in Spanish subjects at high cardiovascular risk. Br. J. Nutr. 2013, 110, 337–346. [Google Scholar] [CrossRef] [PubMed]
- Schröder, H. Protective mechanisms of the Mediterranean diet in obesity and type 2 diabetes. J. Nutr. Biochem. 2007, 18, 149–160. [Google Scholar] [CrossRef] [PubMed]
- Estruch, R.; Martínez-González, M.A.; Corella, D.; Salas-Salvadó, J.; Fitó, M.; Chiva-Blanch, G.; Fiol, M.; Gómez-Gracia, E.; Arós, F.; Lapetra, J.; et al. Effect of a high-fat Mediterranean diet on bodyweight and waist circumference: A prespecified secondary outcomes analysis of the PREDIMED randomised controlled trial. Lancet Diabetes Endocrinol. 2016, 4, 666–676. [Google Scholar] [CrossRef]
- Álvarez-Pérez, J.; Sánchez-Villegas, A.; Díaz-Benítez, E.M.; Ruano-Rodríguez, C.; Corella, D.; Martínez-González, M.Á.; Estruch, R.; Salas-Salvadó, J.; Serra-Majem, L. PREDIMED study investigators. Influence of a Mediterranean dietary pattern on body fat distribution: Results of the PREDIMED-canarias intervention randomized trial. J. Am. Coll. Nutr. 2016, 35, 568–580. [Google Scholar] [CrossRef] [PubMed]
- Hughes, L.A.E.; Arts, I.C.W.; Ambergen, T.; Brants, H.A.M.; Dagnelie, P.C.; Goldbohm, R.A.; Van Den Brandt, P.A.; Weijenberg, M.P. Higher dietary flavone, flavonol, and catechin intakes are associated with less of an increase in BMI over time in women: A longitudinal analysis from The Netherlands Cohort Study. Am. J. Clin. Nutr. 2008, 88, 1341–1352. [Google Scholar] [PubMed]
- Wang, H.; Wen, Y.; Du, Y.; Yan, X.; Guo, H.; Rycroft, J.A.; Boon, N.; Kovacs, E.M.R.; Mela, D.J. Effects of catechin enriched green tea on body composition. Obesity 2010, 18, 773–779. [Google Scholar] [CrossRef] [PubMed]
- Nagao, T.; Komine, Y.; Soga, S.; Meguro, S.; Hase, T.; Tanaka, Y.; Tokimitsu, I. Ingestion of a tea rich in catechins leads to a reduction in body fat and malondialdehyde-modified LDL in men. Am. J. Clin. Nutr. 2005, 81, 122–129. [Google Scholar] [PubMed]
- Maki, K.C.; Reeves, M.S.; Farmer, M.; Yasunaga, K.; Matsuo, N.; Katsuragi, Y.; Komikado, M.; Tokimitsu, I.; Wilder, D.; Jones, F.; et al. Green tea catechin consumption enhances exercise-induced abdominal fat loss in overweight and obese adults. J. Nutr. 2009, 139, 264–270. [Google Scholar] [CrossRef] [PubMed]
- Stendell-Hollis, N.R.; Thomson, C.A.; Thompson, P.A.; Bea, J.W.; Cussler, E.C.; Hakim, I.A. Green tea improves metabolic biomarkers, not weight or body composition: A pilot study in overweight breast cancer survivors. J. Hum. Nutr. Diet. 2010, 23, 590–600. [Google Scholar] [CrossRef] [PubMed]
- Mahler, A.; Steiniger, J.; Bock, M.; Klug, L.; Parreidt, N.; Lorenz, M.; Zimmermann, B.F.; Krannich, A.; Paul, F.; Boschmann, M. Metabolic response to epigallocatechin-3-gallate in relapsing-remitting multiple sclerosis: A randomized clinical trial. Am. J. Clin. Nutr. 2015, 101, 487–495. [Google Scholar] [CrossRef] [PubMed]
- Poulsen Morten, M.; Vestergaard Poul, F.; Clasen Berthil, F.; Radko, Y.; Christensen Lars, P.; Stodkilde-Jorgensen, H.; Moller, N.; Jessen, N.; Pedersen, S.B.; Jorgensen, J.O.L. High-dose resveratrol supplementation in obese men: An investigator-initiated, randomized, placebo-controlled clinical trial of substrate metabolism, insulin sensitivity, and body composition. Diabetes 2013, 62, 1186–1195. [Google Scholar] [CrossRef] [PubMed]
- Timmers, S.; Konings, E.; Bilet, L.; Houtkooper, R.H.; Van De Weijer, T.; Goossens, G.H.; Hoeks, J.; Van Der Krieken, S.; Ryu, D.; Kersten, S.; et al. Calorie restriction-like effects of 30 days of resveratrol supplementation on energy metabolism and metabolic profile in obese humans. Cell Metab. 2011, 14, 612–622. [Google Scholar] [CrossRef] [PubMed]
- Yoshino, J.; Conte, C.; Fontana, L.; Mittendorfer, B.; Imai, S.; Schechtman, K.B.; Gu, C.; Kunz, I.; Rossi Fanelli, F.; Patterson, B.W.; et al. Resveratrol supplementation does not improve metabolic function in nonobese women with normal glucose tolerance. Cell Metab. 2012, 16, 658–664. [Google Scholar] [CrossRef] [PubMed]
- Romaguera, D.; Norat, T.; Mouw, T.; May, A.M.; Bamia, C.; Slimani, N.; Travier, N.; Besson, H.; Luan, J.; Wareham, N.; et al. Adherence to the Mediterranean diet is associated with lower abdominal adiposity in European men and women. J. Nutr. 2009, 139, 1728–1737. [Google Scholar] [CrossRef] [PubMed]
- Esposito, K.; Kastorini, C.-M.; Panagiotakos, D.B.; Giugliano, D. Mediterranean diet and weight loss: Meta-analysis of randomized controlled trials. Metab. Syndr. Relat. Disord. 2011, 9, 1–12. [Google Scholar] [CrossRef] [PubMed]
- Mendez, M.; Popkin, B.M.; Jakszyn, P.; Berenguer, A.; Tormo, M.J.; Sanchéz, M.J.; Quirós, J.R.; Pera, G.; Navarro, C.; Martinez, C.; et al. Adherence to a Mediterranean diet is associated with reduced 3-year incidence of obesity. J. Nutr. 2006, 136, 2934–2938. [Google Scholar] [PubMed]
- Beunza, J.-J.; Toledo, E.; Hu, F.B.; Bes-Rastrollo, M.; Serrano-Martínez, M.; Sánchez-Villegas, A.; Martínez, J.A.; Martínez-González, M.A. Adherence to the Mediterranean diet, long-term weight change, and incident overweight or obesity: The Seguimiento Universidad de Navarra (SUN) cohort. Am. J. Clin. Nutr. 2010, 92, 1484–1493. [Google Scholar] [CrossRef] [PubMed]
- Lee, C.M.Y.; Huxley, R.R.; Wildman, R.P.; Woodward, M. Indices of abdominal obesity are better discriminators of cardiovascular risk factors than BMI: A meta-analysis. J. Clin. Epidemiol. 2008, 61, 646–653. [Google Scholar] [CrossRef] [PubMed]
- Eguaras, S.; Toledo, E.; Buil-Cosiales, P.; Salas-Salvadó, J.; Corella, D.; Gutierrez-Bedmar, M.; Santos-Lozano, J.M.; Arós, F.; Fiol, M.; Fitó, M.; et al. Does the Mediterranean diet counteract the adverse effects of abdominal adiposity? Nutr. Metab. Cardiovasc. Dis. 2015, 256, 569–574. [Google Scholar] [CrossRef] [PubMed]
- Panagiotakos, D.B.; Chrysohoou, C.; Pitsavos, C.; Stefanadis, C. Association between the prevalence of obesity and adherence to the Mediterranean diet: The ATTICA study. Nutrition 2006, 22, 449–456. [Google Scholar] [CrossRef] [PubMed]
- Schröder, H.; Mendez, M.A.; Ribas-Barba, L.; Covas, M.I.; Serra-Majem, L. Mediterranean diet and waist circumference in a representative national sample of young Spaniards. Int. J. Pediatr. Obes. 2010, 5, 516–519. [Google Scholar] [CrossRef] [PubMed]
- Nagao, T.; Hase, T.; Tokimitsu, I. A green tea extract high in catechins reduces body fat and cardiovascular risks. Obesity 2007, 15, 1473–1483. [Google Scholar] [CrossRef] [PubMed]
- Cai, L.; Han, X.; Qi, Z.; Li, Z.; Zhang, Y.; Wang, P.; Liu, A. Prevalence of overweight and obesity and weight loss practice among Beijing adults, 2011. PLoS ONE 2014, 9, e98744. [Google Scholar] [CrossRef] [PubMed]
- Wang, Y.; Beydoun, M.A. The obesity epidemic in the United States-Gender, age, socioeconomic, racial/ethnic, and geographic characteristics: A systematic review and meta-regression analysis. Epidemiol. Rev. 2007, 29, 6–28. [Google Scholar] [CrossRef] [PubMed]
- Williams, R.L.; Wood, L.G.; Collins, C.E.; Callister, R. Effectiveness of weight loss interventions - is there a difference between men and women: A systematic review. Obes. Rev. 2015, 16, 171–186. [Google Scholar] [CrossRef] [PubMed]
- Gross, G.; Jacobs, D.M.; Peters, S.; Possemiers, S.; Van Duynhoven, J.; Vaughan, E.E.; Van De Wiele, T. In vitro bioconversion of polyphenols from black tea and red wine/grape juice by human intestinal microbiota displays strong interindividual variability. J. Agric. Food Chem. 2010, 58, 10236–10246. [Google Scholar] [CrossRef] [PubMed]
- Stevens, J.; Katz, E.G.; Huxley, R.R. Associations between gender, age and waist circumference. Eur. J. Clin. Nutr. 2010, 64, 6–15. [Google Scholar] [CrossRef] [PubMed]
- Jo, J.; Gavrilova, O.; Pack, S.; Jou, W.; Mullen, S.; Sumner, A.E.; Cushman, S.W.; Periwal, V. Hypertrophy and/or hyperplasia: Dynamics of adipose tissue growth. PLoS Comput. Biol. 2009, 5, e1000324. [Google Scholar] [CrossRef] [PubMed]
- Carpéné, C.; Gomez-Zorita, S.; Deleruyelle, S.; Carpéné, M.A. Novel strategies for preventing diabetes and obesity complications with natural polyphenols. Curr. Med. Chem. 2015, 22, 150–164. [Google Scholar] [CrossRef] [PubMed]
- Szkudelska, K.; Szkudelski, T. Resveratrol, obesity and diabetes. Eur. J. Pharmacol. 2010, 635, 1–8. [Google Scholar] [CrossRef] [PubMed]
- Tsuda, T. Dietary anthocyanin-rich plants: Biochemical basis and recent progress in health benefits studies. Mol. Nutr. Food Res. 2012, 56, 159–170. [Google Scholar] [CrossRef] [PubMed]
- Wright, O.R.L.; Netzel, G.A.; Sakzewski, A.R. A randomized, double-blind, placebo-controlled trial of the effect of dried purple carrot on body mass, lipids, blood pressure, body composition, and inflammatory markers in overweight and obese adults: The QUENCH Trial. Can. J. Physiol. Pharmacol. 2013, 91, 480–488. [Google Scholar] [CrossRef] [PubMed]
- Zhu, Y.; Xia, M.; Yang, Y.; Liu, F.; Li, Z.; Hao, Y.; Mi, M.; Jin, T.; Ling, W. Purified anthocyanin supplementation improves endothelial function via NO-cGMP activation in hypercholesterolemic individuals. Clin. Chem. 2011, 57, 1524–1533. [Google Scholar] [CrossRef] [PubMed]
- Yao, L.H.; Jiang, Y.M.; Shi, J.; Tomás-Barberán, F.A.; Datta, N.; Singanusong, R.; Chen, S.S. Flavonoids in food and their health benefits. Plant Foods Hum. Nutr. 2004, 59, 113–122. [Google Scholar] [CrossRef] [PubMed]
- Tresserra-Rimbau, A.; Medina-Remón, A.; Pérez-Jiménez, J.; Martínez-González, M.A.; Covas, M.I.; Corella, D.; Salas-Salvadó, J.; Gómez-Gracia, E.; Lapetra, J.; Arós, F.; et al. Dietary intake and major food sources of polyphenols in a Spanish population at high cardiovascular risk: The PREDIMED study. Nutr. Metab. Cardiovasc. Dis. 2013, 23, 953–959. [Google Scholar] [CrossRef] [PubMed]
- Andersen, C.; Rayalam, S.; Della-Fera, M.A.; Baile, C.A. Phytochemicals and adipogenesis. BioFactors 2010, 36, 415–422. [Google Scholar] [CrossRef] [PubMed]
- Galleano, M.; Calabro, V.; Prince, P.D.; Litterio, M.C.; Piotrkowski, B.; Vazquez-Prieto, M.A.; Miatello, R.M.; Oteiza, P.I.; Fraga, C.G. Flavonoids and metabolic syndrome. Ann. N. Y. Acad. Sci. 2012, 1259, 87–94. [Google Scholar] [CrossRef] [PubMed]
- Kobayashi, M.; Kawano, T.; Ukawa, Y.; Sagesaka, Y.M.; Fukuhara, I. Green tea beverages enriched with catechins with a galloyl moiety reduce body fat in moderately obese adults: A randomized double-blind placebo-controlled trial. Food Funct. R. Soc. Chem. 2016, 7, 498–507. [Google Scholar] [CrossRef] [PubMed]
- Brüll, V.; Burak, C.; Stoffel-Wagner, B.; Wolffram, S.; Nickenig, G.; Müller, C.; Langguth, P.; Alteheld, B.; Fimmers, R.; Naaf, S.; et al. Effects of a quercetin-rich onion skin extract on 24 h ambulatory blood pressure and endothelial function in overweight-to-obese patients with (pre-)hypertension: A randomised double-blinded placebo-controlled cross-over trial. Br. J. Nutr. 2015, 114, 1263–1277. [Google Scholar] [CrossRef] [PubMed]
- Tresserra-Rimbau, A.; Guasch-Ferre, M.; Salas-Salvado, J.; Toledo, E.; Corella, D.; Castaner, O.; Guo, X.; Gomez-Gracia, E.; Lapetra, J.; Aros, F.; et al. Intake of total polyphenols and some classes of polyphenols is inversely associated with diabetes in elderly people at high cardiovascular disease risk. J. Nutr. 2016, 146, 767–777. [Google Scholar] [CrossRef] [PubMed]
- Wing, R.; Lang, W.; Wadden, T.; Safford, M.; Knowler, W.; Bertoni, A.; Hill, J.; Brancati, F.; Peters, A.; Wagenknecht, L. Benefits of modest weight loss in improving cardiovascular risk factors in overweight and obese individuals with type 2 diabetes. Diabetes Care 2011, 34, 1481–1486. [Google Scholar] [CrossRef] [PubMed]
- Guo, X.; Tresserra-Rimbau, A.; Estruch, R.; Martínez-González, M.A.; Medina-Remón, A.; Castañer, O.; Corella, D.; Salas-Salvadó, J.; Lamuela-Raventós, R.M. Effects of polyphenol, measured by a biomarker of total polyphenols in urine, on cardiovascular risk factors after a long-term follow-up in the PREDIMED study. Oxid. Med. Cell. Longev. 2016, 2016, 2572606. [Google Scholar] [CrossRef] [PubMed]
- Nagasako-Akazome, Y.; Kanda, T.; Ohtake, Y.; Shimasaki, H.; Kobayashi, T. Apple polyphenols influence cholesterol metabolism in healthy subjects with relatively high body mass index. J. Oleo Sci. 2007, 56, 417–428. [Google Scholar] [CrossRef] [PubMed]
- Klein, S.; Allison, D.; Heymsfield, S.; Kelley, D.; Leibel, R.; Nonas, C.; Kahn, R.E.A.; Leibe, R. Waist circumference and cardiometabolic risk: A consensus statement from Shaping America’s Health: Association for weight management and obesity prevention. Am. J. Clin. Nutr. 2007, 85, 1197–1202. [Google Scholar] [PubMed]
- Hervert-Hernández, D.; Goñi, I. Contribution of beverages to the intake of polyphenols and antioxidant capacity in obese women from rural Mexico. Public Health Nutr. 2012, 15, 6–12. [Google Scholar] [CrossRef] [PubMed]


| TPE (mg GAE/g Creatinine) | |||||||||||
|---|---|---|---|---|---|---|---|---|---|---|---|
| Q1 | Q2 | Q3 | Q4 | Q5 | p | ||||||
| (<76.55) | (76.56–95.20) | (95.21–119.18) | (119.19–145.86) | (>145.86) | |||||||
| No. of subjects | 114 | - | 115 | - | 115 | - | 115 | - | 114 | - | - |
| Women, n (%) | 33 | 28 | 49 | 42.6 | 66 | 57.4 | 65 | 56.5 | 83 | 72.8 | <0.001 |
| Age (y), mean (SD) | 66.4 | 5.9 | 66.6 | 6.0 | 66.9 | 5.9 | 67.7 | 5.7 | 68.9 | 5.8 | 0.007 |
| Weight (kg), mean (SD) | 80.2 | 11.8 | 77.7 | 10.4 | 73.7 | 9.1 | 73.3 | 10.9 | 70.8 | 10.4 | <0.001 |
| BMI (kg/m2), mean (SD) | 29.8 | 2.9 | 29.5 | 3.2 | 29.1 | 3.1 | 28.9 | 3.6 | 28.8 | 3.4 | 0.080 |
| Systolic BP (mm Hg), mean (SD) | 150.9 | 16.9 | 153.9 | 19.5 | 149.9 | 17.0 | 151.8 | 19.5 | 150.4 | 15.9 | 0.454 |
| Diastolic BP (mm Hg), mean (SD) | 86.4 | 10.5 | 86.1 | 10.4 | 85.0 | 9.9 | 84.2 | 10.3 | 84.4 | 9.1 | 0.363 |
| Hypertension, n (%) | 93 | 81.6 | 102 | 88.7 | 94 | 81.7 | 79 | 68.7 | 93 | 81.6 | 0.004 |
| Diabetes, n (%) | 47 | 41.2 | 41 | 35.7 | 48 | 41.7 | 53 | 46.1 | 49 | 43.0 | 0.605 |
| Dyslipidemia, n (%) | 72 | 63.2 | 74 | 64.3 | 78 | 67.8 | 80 | 69.6 | 79 | 69.3 | 0.779 |
| Smoking status, n (%) | 0.002 | ||||||||||
| Current | 32 | 28.1 | 22 | 19.1 | 16 | 13.9 | 18 | 15.7 | 9 | 7.9 | - |
| Former | 26 | 22.8 | 25 | 21.7 | 24 | 20.9 | 31 | 27.0 | 20 | 17.5 | - |
| Never | 56 | 49.1 | 68 | 59.1 | 75 | 65.2 | 66 | 57.4 | 85 | 74.6 | - |
| Family history of CHD, n (%) | 39 | 34.2 | 42 | 36.5 | 45 | 39.1 | 41 | 35.7 | 48 | 42.1 | 0.95 |
| Medication, n (%) | - | ||||||||||
| Aspirin | 21 | 18.4 | 17 | 14.8 | 27 | 23.5 | 19 | 16.5 | 19 | 16.7 | 0.482 |
| Antihypertensive drugs | 87 | 76.3 | 90 | 78.3 | 82 | 71.3 | 71 | 61.7 | 84 | 73.7 | 0.049 |
| Hypolipidemic drugs | 40 | 35.1 | 45 | 39.1 | 50 | 43.5 | 53 | 46.1 | 51 | 44.7 | 0.426 |
| Insulin | 3 | 2.6 | 7 | 6.1 | 4 | 3.5 | 7 | 6.1 | 6 | 5.3 | 0.639 |
| Oral hypoglycemic drugs | 23 | 20.2 | 22 | 19.1 | 29 | 25.2 | 30 | 26.1 | 27 | 23.7 | 0.652 |
| Vitamin or minerals | 5 | 4.4 | 5 | 4.3 | 10 | 8.7 | 9 | 7.8 | 18 | 15.8 | 0.005 |
| Education level, n (%) | 0.348 | ||||||||||
| University | 13 | 11.4 | 16 | 13.9 | 10 | 8.7 | 7 | 6.1 | 9 | 7.9 | - |
| High school | 21 | 18.4 | 14 | 12.2 | 18 | 15.7 | 22 | 19.1 | 13 | 11.4 | - |
| Primary school | 79 | 69.3 | 83 | 72.2 | 85 | 73.9 | 86 | 74.8 | 92 | 80.7 | - |
| Marital status, n (%) | 0.168 | ||||||||||
| Single | 7 | 6.1 | 5 | 4.3 | 4 | 3.5 | 3 | 2.6 | 6 | 5.3 | - |
| Married | 96 | 84.2 | 93 | 80.9 | 93 | 80.9 | 88 | 76.5 | 80 | 70.2 | - |
| Widowed | 10 | 8.8 | 14 | 12.2 | 16 | 13.9 | 24 | 20.9 | 25 | 21.9 | - |
| Physical activity at leisure time (MET-min/d), mean (SD) | 267.5 | 222.5 | 302.7 | 256.3 | 233 | 172.9 | 283.7 | 271.3 | 261.7 | 247.3 | 0.237 |
| TPE (mg GAE/g Creatinine) | |||||||||||||||
|---|---|---|---|---|---|---|---|---|---|---|---|---|---|---|---|
| Q1 | Q2 | Q3 | Q4 | Q5 | p b | p c | |||||||||
| (<79.02) | (79.03–99.50) | (99.51–124.53) | (124.54–160.06) | (>160.07) | |||||||||||
| Mean | SD | Mean | SD | Mean | SD | Mean | SD | Mean | SD | ANOVA | TIME | GROUP | INTERACTION | ||
| Vegetables (g/day) | baseline | 302.6 | 126.5 | 295.2 | 122.6 | 283.3 | 114.1 | 312.9 | 142.4 | 297.0 | 107.0 | 0.484 | <0.001 | 0.916 | 0.440 |
| changes | 47.7 ** | 131.5 | 53.1 ** | 130.2 | 76.3 ** | 150.4 | 46.0 ** | 162.3 | 59.0 ** | 131.6 | 0.514 | ||||
| Fruits (g/day) | baseline | 328.9 | 184.8 | 361.6 | 179.7 | 358.6 | 182.3 | 389.5 | 162.5 | 394.5 | 189.3 | 0.064 | <0.001 | 0.051 | 0.530 |
| changes | 89.1 ** | 220.1 | 82.9 ** | 222.7 | 111.0 ** | 220.6 | 80.6 ** | 208.4 | 67.9 ** | 194.8 | 0.658 | ||||
| Legumes (g/day) | baseline | 18.5 | 8.4 | 19.3 | 7.4 | 20.0 | 9.2 | 19.2 | 7.2 | 19.0 | 6.6 | 0.634 | 0.446 | 0.251 | 0.045 |
| changes | 0.3 | 10.7 | 1.7 | 11.3 | −3.2 | 29.1 | −1.0 | 8.5 | 1.0 | 8.3 | 0.160 | ||||
| Cereals (g/day) | baseline | 246.8 | 83.8 | 246.3 | 81.2 | 232.8 | 74.2 | 242.9 | 71.9 | 237.7 | 61.9 | 0.636 | <0.001 | 0.530 | 0.386 |
| changes | −22.2 * | 91.1 | −21.7 ** | 85.1 | −14.5 | 91.5 | −31.4 ** | 80.1 | −25.6 ** | 77.5 | 0.673 | ||||
| Milk (g/day) | baseline | 322.8 | 191.3 | 370.1 | 202.2 | 365.8 | 210.0 | 354.5 | 203.7 | 422.5 | 231.6 | 0.010 | 0.005 | 0.009 | 0.728 |
| changes | 38.3 | 207.4 | 21.4 | 200.9 | 10.3 | 198.6 | 40.2 * | 188.3 | 20.6 | 208.9 | 0.776 | ||||
| Meat (g/day) | baseline | 138.1 | 50.4 | 136.2 | 43.9 | 145.6 | 56.5 | 139.3 | 41.7 | 141.6 | 47.1 | 0.613 | <0.001 | 0.198 | 0.983 |
| changes | −9.9 | 52.1 | −13.9 ** | 44.6 | −12.1 * | 52.5 | −13.8 ** | 51.5 | −11.7 * | 47.7 | 0.975 | ||||
| Fish (g/day) | baseline | 92.0 | 39.6 | 92.5 | 36.9 | 90.4 | 38.0 | 97.0 | 41.3 | 93.0 | 39.0 | 0.787 | 0.005 | 0.970 | 0.481 |
| changes | 8.2 * | 40.4 | 6.2 | 42.2 | 11.5 ** | 44.2 | 4.2 | 39.4 | 7.3 | 43.3 | 0.764 | ||||
| Pastries (g/day) | baseline | 29.6 | 32.1 | 23.6 | 22.4 | 24.1 | 24.7 | 23.9 | 22.4 | 26.6 | 26.5 | 0.379 | 0.006 | 0.291 | 0.920 |
| changes | −4.8 | 32.4 | −3.0 | 29.4 | −4.3 | 27.2 | −3.2 | 24.3 | −3.9 | 29.2 | 0.991 | ||||
| EVOO (g/day) | baseline | 22.7 | 25.6 | 20.5 | 22.4 | 22.6 | 23.6 | 22.9 | 23.7 | 22.8 | 23.3 | 0.960 | <0.001 | 0.961 | 0.626 |
| changes | 24.9 ** | 29.6 | 27.6 ** | 27.6 | 25.4 ** | 28.2 | 26.4 ** | 30.1 | 26.9 ** | 25.6 | 0.955 | ||||
| Olive oil (g/day) | baseline | 45.4 | 17.6 | 46.3 | 14.2 | 45.3 | 13.5 | 46.3 | 14.5 | 44.2 | 15.3 | 0.791 | <0.001 | 0.575 | 0.161 |
| changes | 7.8 ** | 18.2 | 10.5 ** | 17.5 | 9.8 ** | 16.8 | 9.3 ** | 18.7 | 11.2 ** | 16.8 | 0.654 | ||||
| Nuts (g/day) | baseline | 10.7 | 14.2 | 11.2 | 12.6 | 10.0 | 12.7 | 10.0 | 13.6 | 10.9 | 11.5 | 0.904 | <0.001 | 0.634 | 0.192 |
| changes | 3.1 | 16.4 | 5.3 ** | 17.1 | 5.5 ** | 15.8 | 9.5 ** | 17.3 | 4.2 ** | 14.0 | 0.039 | ||||
| Wine (g/day) | baseline | 104.9 | 144.8 | 97.0 | 138.3 | 103.9 | 171.5 | 98.2 | 136.2 | 81.2 | 125.6 | 0.739 | 0.013 | 0.647 | 0.984 |
| changes | −8.4 | 124.2 | −13.3 | 129.4 | −17.1 | 111.3 | −18.1 * | 95.3 | −14.5 | 91.9 | 0.971 | ||||
| Tea (mL) | baseline | 4.8 | 14.5 | 4.6 | 15.1 | 6.4 | 17.0 | 5.2 | 12.5 | 7.6 | 21.1 | 0.605 | 0.401 | 0.479 | 0.172 |
| changes | 0.1 | 16.6 | −1.9 | 14.5 | −1.8 | 16.7 | 3.2 | 24.9 | −2.0 | 22.4 | 0.204 | ||||
| Coffee (mL) | baseline | 39.1 | 58.4 | 36.7 | 52.4 | 30.7 | 43.0 | 35.0 | 47.1 | 30.9 | 43.0 | 0.717 | 0.002 | 0.546 | 0.098 |
| changes | −11.5 * | 50.1 | −1.8 | 50.2 | −7.3 * | 36.8 | −13.1 ** | 47.0 | 3.7 | 51.3 | 0.048 | ||||
| Total carbohydrates (g/day) | baseline | 237.5 | 43.2 | 242.1 | 38.0 | 237.0 | 41.7 | 235.8 | 36.3 | 239.7 | 34.8 | 0.682 | 0.769 | 0.114 | 0.025 |
| changes | 4.5 | 78.6 | −10.3 | 71.6 | 5.7 | 72.4 | −13.2 * | 68.1 | −0.4 | 64.6 | 0.166 | ||||
| Protein (g/day) | baseline | 90.3 | 43.2 | 94.9 | 38.0 | 89.7 | 41.7 | 88.5 | 36.3 | 92.5 | 34.8 | 0.682 | 0.274 | 0.307 | 0.474 |
| changes | 2.3 | 47.6 | −3.0 | 41.4 | 6.1 | 46.9 | 2.5 | 40.9 | 4.6 | 39.6 | 0.592 | ||||
| Total Fat (g/day) | baseline | 100.4 | 13.6 | 100.9 | 12.7 | 102.8 | 13.7 | 102.7 | 12.9 | 104.5 | 13.6 | 0.132 | <0.001 | 0.235 | 0.981 |
| changes | 10.0 ** | 30.8 | 9.2 ** | 28.5 | 10.9 ** | 28.0 | 8.5 ** | 26.9 | 9.4 ** | 31.5 | 0.980 | ||||
| Fiber (g/day) | baseline | 24.2 | 6.0 | 24.5 | 6.5 | 24.2 | 6.5 | 25.8 | 5.8 | 25.5 | 5.6 | 0.256 | 0.006 | 0.632 | 0.013 |
| changes | 1.1 | 8.2 | 1.4 | 9.7 | 3.2 ** | 8.4 | 0.2 | 8.2 | 1.0 | 7.8 | 0.107 | ||||
| Alcohol (g/day) | baseline | 13.5 | 5.6 | 13.6 | 5.2 | 13.7 | 5.3 | 13.3 | 4.7 | 14.2 | 4.9 | 0.780 | 0.032 | 0.961 | 0.765 |
| changes | −0.2 | 17.8 | −1.6 | 15.0 | −1.2 | 16.7 | −1.9 | 14.4 | −3.2 * | 14.2 | 0.707 | ||||
| SFA (g/day) | baseline | 24.9 | 11.2 | 24.2 | 9.7 | 24.5 | 8.3 | 25.7 | 9.1 | 23.9 | 9.9 | 0.663 | 0.541 | 0.772 | 0.266 |
| changes | −0.5 | 12.9 | −0.1 | 10.6 | 0.7 | 9.8 | −1.5 | 11.1 | 1.6 | 11.3 | 0.301 | ||||
| MUFA (g/day) | baseline | 52.1 | 16.8 | 51.3 | 15.4 | 52.4 | 16.0 | 53.6 | 14.5 | 52.4 | 15.0 | 0.828 | <0.001 | 0.941 | 0.694 |
| changes | 6.0 ** | 20.3 | 7.5 ** | 19.2 | 7.4 ** | 17.5 | 4.8 ** | 18.1 | 7.1 ** | 19.0 | 0.798 | ||||
| PUFA (g/day) | baseline | 15.6 | 5.2 | 15.4 | 5.7 | 15.5 | 5.8 | 16.0 | 5.2 | 15.5 | 5.5 | 0.887 | <0.001 | 0.575 | 0.670 |
| changes | 3.0 ** | 7.7 | 3.1 ** | 7.8 | 3.4 ** | 7.1 | 3.4 ** | 8.1 | 4.2 ** | 8.9 | 0.800 | ||||
| Folic acid (μg/day) | baseline | 379.3 | 89.5 | 373.3 | 90.5 | 369.8 | 76.5 | 394.4 | 98.8 | 394.2 | 85.7 | 0.152 | <0.001 | 0.447 | 0.086 |
| changes | 42.7 ** | 91.3 | 46.5 ** | 99.7 | 65.7 ** | 92.6 | 39.2 ** | 91.6 | 38.7 ** | 100.4 | 0.196 | ||||
| Cholesterol (mg/day) | baseline | 354.9 | 92.4 | 340.0 | 92.2 | 351.4 | 93.3 | 353.5 | 81.6 | 359.1 | 95.5 | 0.505 | 0.234 | 0.406 | 0.329 |
| changes | 0.2 | 115.0 | 11.9 | 101.3 | 11.4 | 109.2 | −3.5 | 105.5 | 15.2 | 112.6 | 0.644 | ||||
| Na (mg/day) | baseline | 2331.2 | 570.5 | 2254.1 | 499.7 | 2272.1 | 480.3 | 2286.1 | 491.3 | 2298.5 | 447.1 | 0.815 | 0.257 | 0.258 | 0.319 |
| changes | −64.0 | 941.6 | −83.1 | 728.6 | 10.6 | 730.0 | −184.2 ** | 713.4 | 10.8 | 752.6 | 0.306 | ||||
| K (mg/day) | baseline | 4130.5 | 769.6 | 4218.7 | 756.2 | 4208.9 | 696.0 | 4312.6 | 808.1 | 4410.2 | 748.0 | 0.069 | <0.001 | 0.246 | 0.067 |
| changes | 379.8 ** | 1070.7 | 286.0 ** | 1042.2 | 497.3 ** | 1007.2 | 249.1 * | 1116.2 | 268.1 * | 1100.4 | 0.389 | ||||
| Mg (mg/day) | baseline | 355.0 | 64.0 | 361.1 | 68.6 | 356. | 56.6 | 368.6 | 58.2 | 374.8 | 61.9 | 0.147 | <0.001 | 0.474 | 0.056 |
| changes | 30.7 ** | 97.9 | 26.8 ** | 99.2 | 42.9 ** | 87.9 | 22.0 ** | 87.3 | 23.9 * | 95.9 | 0.481 | ||||
| P-14 score | baseline | 8.9 | 1.8 | 9.0 | 1.8 | 9.2 | 1.9 | 8.8 | 1.9 | 9.1 | 1.8 | 0.441 | <0.001 | 0.370 | 0.571 |
| changes | 1.6 ** | 2.5 | 1.8 ** | 1.9 | 1.7 ** | 2.1 | 1.9 ** | 2.0 | 1.6 ** | 2.1 | 0.626 | ||||
| Energy intake (Kcal/day) | baseline | 2508.8 | 582.3 | 2285.5 | 578.5 | 2338.5 | 463.0 | 2262.2 | 510.7 | 2191.7 | 470.7 | <0.001 | 0.034 | <0.001 | 0.234 |
| changes | −25.9 | 627.6 | 32.0 | 497.4 | 100.2 * | 503.9 | 8.9 | 564.0 | 157.8 ** | 520.1 | 0.089 | ||||
| β | SE | Beta | Significance | 95% CI | ||||
|---|---|---|---|---|---|---|---|---|
| BW (kg) | Male | Model 1 | −1.446 | 0.440 | −0.195 | 0.001 | −2.313 | −0.580 |
| Model 2 | −1.259 | 0.440 | −0.170 | 0.005 | −2.126 | −0.392 | ||
| Model 3 | −0.959 | 0.461 | −0.131 | 0.039 | −1.868 | −0.050 | ||
| Female | Model 1 | −1.103 | 0.415 | −0.153 | 0.008 | −1.920 | −0.287 | |
| Model 2 | −0.756 | 0.414 | −0.105 | 0.069 | −1.571 | 0.058 | ||
| Model 3 | −0.757 | 0.431 | −0.107 | 0.080 | −1.606 | 0.091 | ||
| Total | Model 1 | −2.350 | 0.331 | −0.285 | <0.001 | −3.000 | −1.700 | |
| Model 2 | −1.070 | 0.315 | −0.130 | 0.001 | −1.689 | −0.451 | ||
| Model 3 | −1.004 | 0.320 | −0.124 | 0.002 | −1.634 | −0.375 | ||
| BMI (kg/m2) | Male | Model 1 | −0.405 | 0.135 | −0.179 | 0.003 | −0.670 | −0.139 |
| Model 2 | −0.370 | 0.136 | −0.164 | 0.007 | −0.639 | −0.102 | ||
| Model 3 | −0.301 | 0.141 | −0.135 | 0.034 | −0.579 | −0.023 | ||
| Female | Model 1 | −0.344 | 0.156 | −0.127 | 0.028 | −0.652 | −0.037 | |
| Model 2 | −0.296 | 0.160 | −0.110 | 0.064 | −0.611 | 0.018 | ||
| Model 3 | −0.332 | 0.165 | −0.123 | 0.046 | −0.657 | −0.007 | ||
| Total | Model 1 | −0.295 | 0.104 | −0.118 | 0.005 | −0.499 | −0.090 | |
| Model 2 | −0.328 | 0.110 | −0.131 | 0.003 | −0.544 | −0.111 | ||
| Model 3 | −0.320 | 0.113 | −0.129 | 0.005 | −0.541 | −0.098 | ||
| WC (cm) | Male | Model 1 | −0.769 | 0.364 | −0.127 | 0.036 | −1.487 | −0.052 |
| Model 2 | −0.786 | 0.369 | −0.130 | 0.034 | −1.513 | −0.059 | ||
| Model 3 | −0.516 | 0.378 | −0.087 | 0.173 | −1.260 | 0.228 | ||
| Female | Model 1 | −0.546 | 0.409 | −0.078 | 0.183 | −1.351 | 0.259 | |
| Model 2 | −0.527 | 0.419 | −0.075 | 0.209 | −1.351 | 0.297 | ||
| Model 3 | −0.701 | 0.434 | −0.101 | 0.108 | −1.556 | 0.154 | ||
| Total | Model 1 | −1.500 | 0.296 | −0.208 | <0.001 | −2.082 | −0.918 | |
| Model 2 | −0.721 | 0.293 | −0.100 | 0.014 | −1.296 | −0.147 | ||
| Model 3 | −0.742 | 0.297 | −0.104 | 0.013 | −1.326 | −0.158 | ||
| WHtR (cm/m) | Male | Model 1 | −0.340 | 0.220 | −0.093 | 0.124 | −0.773 | 0.094 |
| Model 2 | −0.385 | 0.223 | −0.105 | 0.085 | −0.823 | 0.054 | ||
| Model 3 | −0.258 | 0.229 | −0.072 | 0.261 | −0.710 | 0.193 | ||
| Female | Model 1 | −0.246 | 0.276 | −0.052 | 0.374 | −0.789 | 0.298 | |
| Model 2 | −0.332 | 0.282 | −0.070 | 0.240 | −0.887 | 0.223 | ||
| Model3 | −0.501 | 0.294 | −0.106 | 0.089 | −1.079 | 0.078 | ||
| Total | Model 1 | −0.298 | 0.178 | −0.070 | 0.094 | −0.648 | 0.051 | |
| Model 2 | −0.367 | 0.189 | −0.087 | 0.052 | −0.739 | 0.004 | ||
| Model 3 | −0.408 | 0.194 | −0.097 | 0.036 | −0.788 | −0.028 | ||
| Q1 | Q2 | 95% CI | Q3 | 95% CI | Q4 | 95% CI | Q5 | 95% CI | p | ||||||
|---|---|---|---|---|---|---|---|---|---|---|---|---|---|---|---|
| Male | Model 1 | 1 (ref.) | 0.531 | 0.244 | 1.155 | 0.545 | 0.250 | 1.188 | 0.488 | 0.223 | 1.070 | 0.313 | 0.135 | 0.722 | 0.095 |
| (90 case) | Model 2 | 1 (ref.) | 0.559 | 0.254 | 1.229 | 0.571 | 0.260 | 1.254 | 0.520 | 0.235 | 1.148 | 0.340 | 0.146 | 0.792 | 0.159 |
| Model 3 | 1 (ref.) | 0.586 | 0.243 | 1.416 | 0.588 | 0.238 | 1.452 | 0.511 | 0.204 | 1.283 | 0.387 | 0.146 | 1.029 | 0.418 | |
| Female | Model 1 | 1 (ref.) | 0.934 | 0.454 | 1.924 | 0.791 | 0.384 | 1.628 | 0.643 | 0.310 | 1.333 | 0.429 | 0.200 | 0.919 | 0.195 |
| (123 case) | Model 2 | 1 (ref.) | 1.041 | 0.497 | 2.182 | 0.844 | 0.403 | 1.768 | 0.769 | 0.361 | 1.638 | 0.493 | 0.226 | 1.078 | 0.352 |
| Model 3 | 1 (ref.) | 1.257 | 0.538 | 2.934 | 0.748 | 0.317 | 1.764 | 0.595 | 0.244 | 1.450 | 0.461 | 0.181 | 1.170 | 0.223 | |
| Total | Model 1 | 1 (ref.) | 0.639 | 0.375 | 1.089 | 0.769 | 0.454 | 1.302 | 0.664 | 0.390 | 1.129 | 0.450 | 0.259 | 0.782 | 0.073 |
| (213 case) | Model 2 | 1 (ref.) | 0.597 | 0.344 | 1.035 | 0.691 | 0.400 | 1.192 | 0.618 | 0.350 | 1.091 | 0.383 | 0.211 | 0.694 | 0.036 |
| Model 3 | 1 (ref.) | 0.604 | 0.332 | 1.100 | 0.720 | 0.399 | 1.300 | 0.560 | 0.298 | 1.054 | 0.346 | 0.176 | 0.678 | 0.039 | |
| Q1 | Q2 | 95% CI | Q3 | 95% CI | Q4 | 95% CI | Q5 | 95% CI | p | |||||
|---|---|---|---|---|---|---|---|---|---|---|---|---|---|---|
| Model 1 | 1 (ref.) | 0.912 | (0.337 | 2.468) | 0.676 | (0.253 | 1.810) | 0.351 | (0.142 | 0.866) | 0.406 | (0.164 | 1.005) | 0.054 |
| Model 2 | 1 (ref.) | 0.454 | (0.185 | 1.115) | 0.235 | (0.072 | 0.767) | 0.285 | (0.093 | 0.868) | 0.145 | (0.037 | 0.558) | 0.014 |
| Model 3 | 1 (ref.) | 0.382 | (0.146 | 1.001) | 0.193 | (0.055 | 0.676) | 0.272 | (0.084 | 0.885) | 0.119 | (0.028 | 0.505) | 0.014 |
| Model 4 | 1 (ref.) | 0.366 | (0.126 | 1.062) | 0.156 | (0.040 | 0.612) | 0.218 | (0.054 | 0.881) | 0.095 | (0.018 | 0.498) | 0.018 |
| β | SE | Beta | p | 95% CI | ||||
|---|---|---|---|---|---|---|---|---|
| Changes in BW | Male | Model 1 | −0.098 | 0.211 | −0.028 | 0.642 | −0.514 | 0.318 |
| (kg) | Model 2 | −0.229 | 0.217 | −0.066 | 0.294 | −0.657 | 0.199 | |
| Model 3 | −0.186 | 0.217 | −0.053 | 0.393 | −0.614 | 0.242 | ||
| Model 4 | −0.037 | 0.233 | −0.011 | 0.872 | −0.495 | 0.421 | ||
| Female | Model 1 | −0.648 | 0.193 | −0.193 | 0.001 | −1.027 | −0.269 | |
| Model 2 | −0.664 | 0.196 | −0.197 | 0.001 | −1.049 | −0.279 | ||
| Model 3 | −0.573 | 0.197 | −0.17 | 0.004 | −0.961 | −0.185 | ||
| Model 4 | −0.568 | 0.213 | −0.169 | 0.008 | −0.987 | −0.149 | ||
| Total | Model 1 | −0.429 | 0.142 | −0.125 | 0.003 | −0.709 | −0.149 | |
| Model 2 | −0.539 | 0.15 | −0.157 | <0.001 | −0.835 | −0.244 | ||
| Model 3 | −0.436 | 0.153 | −0.127 | 0.005 | −0.737 | −0.135 | ||
| Model 4 | −0.363 | 0.161 | −0.108 | 0.024 | −0.68 | −0.047 | ||
| Changes in BMI | Male | Model 1 | −0.04 | 0.075 | −0.033 | 0.589 | −0.187 | 0.107 |
| (kg/m2) | Model 2 | −0.087 | 0.077 | −0.07 | 0.259 | −0.238 | 0.064 | |
| Model 3 | −0.072 | 0.077 | −0.059 | 0.348 | −0.224 | 0.079 | ||
| Model 4 | −0.019 | 0.082 | −0.016 | 0.817 | −0.18 | 0.142 | ||
| Female | Model 1 | −0.256 | 0.083 | −0.177 | 0.002 | −0.419 | −0.092 | |
| Model 2 | −0.262 | 0.084 | −0.181 | 0.002 | −0.428 | −0.096 | ||
| Model 3 | −0.223 | 0.085 | −0.154 | 0.009 | −0.391 | −0.056 | ||
| Model 4 | −0.221 | 0.092 | −0.153 | 0.017 | −0.402 | −0.04 | ||
| Total | Model 1 | −0.176 | 0.056 | −0.13 | 0.002 | −0.286 | −0.065 | |
| Model 2 | −0.215 | 0.059 | −0.159 | <0.001 | −0.331 | −0.098 | ||
| Model 3 | −0.172 | 0.06 | −0.128 | 0.005 | −0.291 | −0.054 | ||
| Model 4 | −0.145 | 0.064 | −0.109 | 0.023 | −0.27 | −0.02 | ||
| Changes in WC | Male | Model 1 | −0.066 | 0.233 | −0.017 | 0.776 | −0.525 | 0.392 |
| (cm) | Model 2 | −0.209 | 0.241 | −0.054 | 0.386 | −0.684 | 0.265 | |
| Model 3 | −0.17 | 0.242 | −0.044 | 0.484 | −0.647 | 0.307 | ||
| Model 4 | −0.108 | 0.249 | −0.029 | 0.666 | −0.599 | 0.383 | ||
| Female | Model 1 | −0.34 | 0.275 | −0.072 | 0.217 | −0.88 | 0.2 | |
| Model 2 | −0.325 | 0.28 | −0.069 | 0.247 | −0.877 | 0.227 | ||
| Model 3 | −0.31 | 0.286 | −0.066 | 0.279 | −0.872 | 0.253 | ||
| Model 4 | −0.42 | 0.311 | −0.089 | 0.178 | −1.033 | 0.192 | ||
| Total | Model 1 | −0.237 | 0.181 | −0.055 | 0.190 | −0.592 | 0.118 | |
| Model 2 | −0.302 | 0.192 | −0.070 | 0.118 | −0.680 | 0.076 | ||
| Model 3 | −0.252 | 0.198 | −0.059 | 0.203 | −0.640 | 0.136 | ||
| Model 4 | −0.269 | 0.207 | −0.063 | 0.195 | −0.676 | 0.138 | ||
| Changes in WHtR | Male | Model 1 | −0.066 | 0.233 | −0.017 | 0.776 | −0.525 | 0.392 |
| (cm/m) | Model 2 | −0.209 | 0.241 | −0.054 | 0.386 | −0.684 | 0.265 | |
| Model 3 | −0.17 | 0.242 | −0.044 | 0.484 | −0.647 | 0.307 | ||
| Model 4 | −0.108 | 0.249 | −0.029 | 0.666 | −0.599 | 0.383 | ||
| Female | Model 1 | −0.202 | 0.179 | −0.066 | 0.262 | −0.555 | 0.152 | |
| Model 2 | −0.194 | 0.183 | −0.063 | 0.29 | −0.555 | 0.166 | ||
| Model 3 | −0.184 | 0.187 | −0.06 | 0.325 | −0.552 | 0.183 | ||
| Model 4 | −0.262 | 0.204 | −0.085 | 0.199 | −0.663 | 0.139 | ||
| Total | Model 1 | −0.142 | 0.114 | −0.052 | 0.216 | −0.367 | 0.083 | |
| Model 2 | −0.184 | 0.122 | −0.068 | 0.131 | −0.424 | 0.055 | ||
| Model 3 | −0.155 | 0.125 | −0.057 | 0.215 | −0.401 | 0.091 | ||
| Model 4 | −0.167 | 0.131 | −0.062 | 0.203 | −0.426 | 0.091 | ||
© 2017 by the authors. Licensee MDPI, Basel, Switzerland. This article is an open access article distributed under the terms and conditions of the Creative Commons Attribution (CC BY) license (http://creativecommons.org/licenses/by/4.0/).
Share and Cite
Guo, X.; Tresserra-Rimbau, A.; Estruch, R.; Martínez-González, M.A.; Medina-Remón, A.; Fitó, M.; Corella, D.; Salas-Salvadó, J.; Portillo, M.P.; Moreno, J.J.; et al. Polyphenol Levels Are Inversely Correlated with Body Weight and Obesity in an Elderly Population after 5 Years of Follow Up (The Randomised PREDIMED Study). Nutrients 2017, 9, 452. https://doi.org/10.3390/nu9050452
Guo X, Tresserra-Rimbau A, Estruch R, Martínez-González MA, Medina-Remón A, Fitó M, Corella D, Salas-Salvadó J, Portillo MP, Moreno JJ, et al. Polyphenol Levels Are Inversely Correlated with Body Weight and Obesity in an Elderly Population after 5 Years of Follow Up (The Randomised PREDIMED Study). Nutrients. 2017; 9(5):452. https://doi.org/10.3390/nu9050452
Chicago/Turabian StyleGuo, Xiaohui, Anna Tresserra-Rimbau, Ramón Estruch, Miguel A. Martínez-González, Alexander Medina-Remón, Montserrat Fitó, Dolores Corella, Jordi Salas-Salvadó, Maria Puy Portillo, Juan J. Moreno, and et al. 2017. "Polyphenol Levels Are Inversely Correlated with Body Weight and Obesity in an Elderly Population after 5 Years of Follow Up (The Randomised PREDIMED Study)" Nutrients 9, no. 5: 452. https://doi.org/10.3390/nu9050452
APA StyleGuo, X., Tresserra-Rimbau, A., Estruch, R., Martínez-González, M. A., Medina-Remón, A., Fitó, M., Corella, D., Salas-Salvadó, J., Portillo, M. P., Moreno, J. J., Pi-Sunyer, X., & Lamuela-Raventós, R. M. (2017). Polyphenol Levels Are Inversely Correlated with Body Weight and Obesity in an Elderly Population after 5 Years of Follow Up (The Randomised PREDIMED Study). Nutrients, 9(5), 452. https://doi.org/10.3390/nu9050452