Trends in Determinants of Hypercholesterolemia among Chinese Adults between 2002 and 2012: Results from the National Nutrition Survey


Abstract
:
1. Introduction
2. Materials and Methods
2.1. Data Sources
2.2. Inclusion and Exclusion Criteria
2.3. Statistical Analyses
3. Results
4. Discussion
5. Conclusions
Acknowledgments
Author Contributions
Conflicts of Interest
References
- Ralph, B.D.; Ramachandran, S.V.; Michael, J.P.; Philip, A.W.; Mark, C.; Joseph, M.M.; William, B.K. Generalcardiovascular risk profile for use in primary care: The framingham heart study. Circulation 2008, 117, 743–753. [Google Scholar]
- Saeed, E.; Ali, R.; Jalal-ud-din, M.; Saeed, A.; Jadoon, R.J.; Moiz, M. Hypercholesterolemia in patients of ischemic stroke. J. Ayub. Med. Coll. Abbottabad 2015, 27, 637–639. [Google Scholar] [PubMed]
- Wu, Y.F.; Liu, X.Q.; Li, X.; Li, Y.; Zhao, L.C.; Chen, Z.; Li, Y.H.; Rao, X.X.; Zhou, B.F.; Robert, D.; et al. Estimation of 10-year risk of fatal and nonfatal ischemic cardiovascular diseases in Chinese adults. Circulation 2006, 114, 2217–2225. [Google Scholar] [CrossRef] [PubMed]
- Capewell, S.; Ford, E.S. Why have total cholesterol levels declined in most developed countries? BMC Public Health 2011, 11, 641. [Google Scholar] [CrossRef] [PubMed]
- Zhao, W.H.; Zhang, J.; Zhai, Y.; You, Y.; Man, Q.Q.; Wang, C.R.; Li, H.; Li, Y.; Yang, X.G. Blood lipid profile and prevalence of dyslipidemia in Chinese adults. Biomed. Environ. Sci. 2007, 20, 329–335. [Google Scholar] [PubMed]
- Chang, J.L.; Wang, Y. Report of Chinese Residents of Nutrition and Health Surveillance 2010–2013; Peking University Medical Press: Beijing, China, 2016. [Google Scholar]
- Cai, L.; Zhang, L.; Liu, A.; Li, S.; Wang, P. Prevalence, awareness, treatment, and control of dyslipidemia among adults in Beijing, China. J. Atheroscler. Thromb. 2012, 19, 159–168. [Google Scholar] [CrossRef] [PubMed]
- Palomo, L.; Felix-Redondo, F.J.; Lozano-Mera, L.; Perez-Castan, J.F.; Fernandez-Berges, D.; Buitrago, F. Cardiovascular risk factors, lifestyle, and social determinants: A cross-sectional population study. Br. J. Gen. Pract. 2014, 64, e627–e633. [Google Scholar] [CrossRef] [PubMed]
- Joint Committee for Developing Chinese guidelines on Prevention and Treatment of Dyslipidemia in Adults. Chinese guidelines on prevention and treatment of dyslipidemia in adults. Zhong Hua Xin Xue Guan Bing Za Zhi 2007, 35, 390–419. (In Chinese) [Google Scholar]
- Yang, Y.X. China Food Composition 2004, 2nd ed.; Peking. University Medical Press: Beijing, China, 2005. [Google Scholar]
- Yang, Y.X. China Food Composition, 2nd ed.; Peking. University Medical Press: Beijing, China, 2009. [Google Scholar]
- Polychronopoulos, E.; Panagiotakos, D.B.; Polystipioti, A. Diet, lifestyle factors and hypercholesterolemia in elderly men and women from Cyprus. Lipids Health Dis. 2005, 4, 17. [Google Scholar] [CrossRef] [PubMed]
- Shen, Z.; Munker, S.; Wang, C.Y.; Xu, L.; Ye, H.; Chen, H.T.; Xu, G.Y.; Zhang, H.; Chen, L.H.; Yu, C.H.; et al. Association between alcohol intake, overweight, and serum lipid levels and the risk analysis associated with the development of dyslipidemia. J. Clin. Lipidol. 2014, 8, 273–278. [Google Scholar] [CrossRef] [PubMed]
- Felix-Redondo, F.J.; Fernandez-Berges, D.; PalomoCobos, L.; Buitrago Ramirez, F.; Perez Castan, J.F.; Lozano Mera, L. Prevalence alcohol consumption and cardiovascular risk factors in an Extremadura health area. Hermex Study. Aten. Primaria 2012, 44, 201–208. [Google Scholar] [CrossRef] [PubMed]
- Chitra, U.; Reddy, N.K.; Balakrishna, N. Role of lifestyle variables on the lipid profile of selected South Indian subjects. Indian Heart J. 2012, 64, 28–34. [Google Scholar] [CrossRef]
- Lee, J.W.; Choe, S.S.; Jang, H.; Kim, J.; Jeong, H.W.; Jo, H.; Jeong, K.H.; Tadi, S.; Park, M.G.; Kwak, T.H.; et al. AMPK activation with glabridin ameliorates adiposity and lipid dysregulation in obesity. J. Lipid Res. 2012, 53, 1277–1286. [Google Scholar] [CrossRef] [PubMed]
- Booth, H.P.; Prevost, A.T.; Gulliford, M.C. Severity of obesity and management of hypertension, hypercholesterolaemia and smoking in primary care: Population-based cohort study. J. Hum. Hypertens. 2016, 30, 40–45. [Google Scholar] [CrossRef] [PubMed]
- Doupa, D.; Seck, S.M.; Dia, C.A.; Diallo, F.A.; Kane, M.O.; Kane, A.; Gueye, P.M.; Mbaye, M.N.; Gueye, L.; Jobe, M. Dyslipidemia, obesity and other cardiovascular risk factors in the adult population in Senegal. Pan Afr. Med. J. 2014, 19, 181. [Google Scholar] [CrossRef] [PubMed]
- Feli-Redondo, F.J.; Grau, M.; Baena-Diez, J.M.; Degano, I.R.; de Leon, A.C.; Guembe, M.J.; Alzamora, M.T.; Vega-Alonso, T.; Robles, N.R.; Ortiz, H.; et al. Prevalence of obesity and associated cardiovascular risk: The DARIOS study. BMC Public Health 2013, 13, 542. [Google Scholar] [CrossRef] [PubMed]
- Panagiotakos, D.B.; Pitsavos, C.; Skoumas, Y.; Lentzas, Y.; Papadimitriou, L.; Chrysohoou, C.; Stefanadis, C. Abdominal obesity, blood glucose and apolipoprotein B levels are the best predictors of the incidence of hypercholesterolemia (2001–2006) among healthy adults: The ATTICA Study. Lipids Health Dis. 2008, 7, 11. [Google Scholar] [CrossRef] [PubMed]
- Qin, X.H.; Zhang, Y.; Cai, Y.F.; He, M.L.; Sun, L.M.; Fu, J.; Li, J.P.; Wang, B.Y.; Xing, H.X.; Tang, G.F.; et al. Prevalence of obesity, abdominal obesity and associated factors in hypertensive adults aged 45–75 years. Clin. Nutr. 2013, 32, 361–367. [Google Scholar] [CrossRef] [PubMed]
- Bruggisser, M.; Burki, D.; Haeusler, M.; Rühli, F.J.; Staub, K. Multivariable analysis of total cholesterol levels in male Swiss armed forces conscripts 2006–2012 (N = 174,872). BMC Cardiovasc. Disord. 2016, 16, 43. [Google Scholar] [CrossRef] [PubMed]
- Qi, L.; Ding, X.; Tang, W.; Li, Q.; Mao, D.; Wang, Y. Prevalence and risk factors associated with dyslipidemia in Chongqing, China. Int. J. Environ. Res. Public Health 2015, 12, 13455–13465. [Google Scholar] [CrossRef] [PubMed]
- Hu, Z.; Zaman, M.J.; Wang, J.; Peacock, J.L.; Chen, R. Correlates of untreated hypercholesterolemia in older adults: A community based household survey in China. PLoS ONE 2015, 10, e013131. [Google Scholar] [CrossRef] [PubMed]
- Carroll, M.D.; Kit, B.K.; Lacher, D.A.; Yoon, S.S. Total and high-density lipoprotein cholesterol in adults: National Health and Nutrition Examination Survey, 2011–2012. NCHS. Data Brief 2013, 132, 1–8. [Google Scholar]
- Ahmed, F.; Waslien, C.; Al-Sumaie, M.; Prakash, P. Trends and risk factors of hypercholesterolemia among Kuwaiti adults: National Nutrition Surveillance Data from 1998 to 2009. Nutrition 2012, 28, 917–923. [Google Scholar] [CrossRef] [PubMed]
- Erem, C.; Hacihasanoglu, A.; Deger, O.; Kocak, M.; Topbas, M. Prevalence of dyslipidemia and associated risk factors among Turkish adults: Trabzon lipid study. Endocrine 2008, 34, 36–51. [Google Scholar] [CrossRef] [PubMed]
- Amiri, M.; Majid, H.A.; Hairi, F.; Thangiah, N.; Bulgiba, A.; Su, T.T. Prevalence and determinants of cardiovascular disease risk factors among the residents of urban community housing projects in Malaysia. BMC Public Health 2014, 14 (Suppl. 3), S3. [Google Scholar] [CrossRef] [PubMed]
- Oguoma, V.M.; Nwose, E.U.; Skinner, T.C.; Digban, K.A.; Onyia, I.C.; Richards, R.S. Prevalence of cardiovascular disease risk factors among a Nigerian adult population: Relationship with income level and accessibility to CVD risks screening. BMC Public Health 2015, 15, 397. [Google Scholar] [CrossRef] [PubMed]
- Chun, H.; Kim, I.H.; Mind, K.D. Accuracy of self-reported hypertension, diabetes, and hypercholesterolemia: Analysis of a representative sample of Korean older adults. Osong Public Health Res. Perspect. 2016, 7, 108–115. [Google Scholar] [CrossRef] [PubMed]
- Su, C.; Zhang, B.; Wang, Y.F.; Jia, X.F.; Xue, H.; Wang, H.J. Epidemics of overweight and obesity among growing childhood in China between 1997 and 2009: Impact of family income, dietary intake, and physical activity dynamics. Chin. Med. J. 2015, 128, 1879–1886. [Google Scholar] [PubMed]
- Zhai, F.Y.; Wang, H.J.; Du, S.F.; He, Y.N.; Wang, Z.H.; Ge, K.Y.; Popkin, B.M. Lifespan nutrition and changing socio-economic conditions in China. Asia Pac. J. Clin. Nutr. 2007, 16, 374–382. [Google Scholar] [PubMed]
- Silvia, S.; Bharathi, V.; Jude, G.; Fred, P.; Pascal, B. The social transition of risk factors for cardiovascular disease in the African region: Evidence from three cross-sectional surveys in the Seychelles. Int. J. Cardiol. 2013, 168, 1201–1206. [Google Scholar]
- Bernstein, A.M.; Sun, Q.; Hu, F.B.; Stampfer, M.J.; Manson, J.E.; Willett, W.C. Major dietary protein sources and risk of coronary heart disease in women. Circulation 2010, 122, 876–883. [Google Scholar] [CrossRef] [PubMed]
- Hunninghake, D.B.; Maki, K.C.; Kwiterovich, P.O., Jr.; Davidson, M.H.; Dicklin, M.R.; Kafonek, S.D. Incorporation of lean red meat into a National Cholesterol Education Program Step I diet: A long-term, randomized clinical trial in free-living persons with hypercholesterolemia. J. Am. Coll. Nutr. 2000, 19, 351–360. [Google Scholar] [CrossRef] [PubMed]
- Rocio, M.G.; Sofia, P.C.; Ana, C.; Ana, M.B.; Eva, A.; Jaime, H.; Emilio, R.; Fernando, C. Effect of lean red meat from lamb v. lean white meat from chicken on the serum lipid profile: A randomised, cross-over study in women. Br. J. Nutr. 2012, 107, 1403–1407. [Google Scholar]
- Pounis, G.D.; Tyrovolas, S.; Antonopoulou, M.; Zeimbekis, A.; Anastasiou, F.; Bountztiouka, V.; Metallinos, G.; Gotsis, E.; Lioliou, E.; Polychronopoulos, E.; et al. Long-term animal-protein consumption is associated with an increased prevalence of diabetes among the elderly: The Mediterranean Islands (MEDIS) study. Diabetes Metab. 2010, 36, 484–490. [Google Scholar] [CrossRef] [PubMed]
- Preis, S.R.; Stampfer, M.J.; Spiegelman, D.; Willett, W.C.; Rimm, E.B. Dietary protein and risk of ischemic heart disease in middle-aged men. Am. J. Clin. Nutr. 2010, 92, 1265–1272. [Google Scholar] [CrossRef] [PubMed]
- Shu, L.; Zheng, P.F.; Zhang, X.Y.; Si, C.J.; Yu, X.L.; Gao, W.; Zhang, L.; Liao, D. Association between dietary patterns and the indicators of obesity among Chinese: A Cross-Sectional Study. Nutrients 2015, 7, 7995–8009. [Google Scholar] [CrossRef] [PubMed]
- Shi, Z.M.; Taylor, A.W.; Hu, G.; Gill, T.; Wittert, G.A. Rice intake, weight change and risk of the metabolic syndrome development among Chinese adults: The Jiangsu Nutrition Study (JIN). Asia Pac. J. Clin. Nutr. 2012, 21, 35–43. [Google Scholar] [PubMed]
- Nouri, F.; Sarrafzadegan, N.; Mohammadifard, N.; Sadeghi, M.; Mansourian, M. Intake of legumes and the risk of cardiovascular disease: Frailty modeling of a prospective cohort study in the Iranian middle-aged and older population. Eur. J. Clin. Nutr. 2016, 70, 217–221. [Google Scholar] [CrossRef] [PubMed]
- Mohammadifard, N.; Sarrafzadegan, N.; Paknahad, Z.; Nouri, F. Inverse association of legume consumption and dyslipidemia: Isfahan Healthy Heart Program. J. Clin. Lipidol. 2014, 8, 584–593. [Google Scholar] [CrossRef] [PubMed]
- Han, S.N.; Lichtenstein, A.H.; Ausman, L.M.; Meydani, S.N. Novel soybean oils differing in fatty acid composition alter immune functions of moderately hypercholesterolemic older adults. J. Nutr. 2012, 142, 2182–2187. [Google Scholar] [CrossRef] [PubMed]

| 2002 | 2010–2012 | p Value ** | |||||
|---|---|---|---|---|---|---|---|
| Urban | Rural | Total | Urban | Rural | Total | ||
| N | 15,554 | 30,147 | 45,701 | 19,841 | 20,029 | 39,870 | |
| Gender (n, %) | <0.001 | ||||||
| Male | 7150 (46.0) | 14,205 (47.1) | 21,355 (46.7) | 8352 (42.1) | 8970 (44.8) | 17,322 (43.4) | |
| Female | 8404 (54.0) | 15,942 (52.9) | 24,346 (53.3) | 11,489 (57.9) | 11,059 (55.2) | 22,548 (56.6) | |
| Age (year, mean, se) | 42.7 (0.4) | 43.4 (0.3) | 43.0 (0.3) | 50.5 (0.7) | 52.3 (0.6) | 51.0 (0.5) | <0.001 |
| Age group (n, %) | <0.001 | ||||||
| 18–44 | 6631 (42.6) | 15,583 (51.7) | 22,214 (48.6) | 5547 (28.0) | 6843 (34.2) | 12,390 (31.1) | |
| 45–54 | 3796 (24.4) | 7403 (24.6) | 11,199 (24.5) | 4490 (22.6) | 4785 (23.9) | 9275 (23.3) | |
| 55–64 | 2617 (16.8) | 4341 (14.4) | 6958 (15.2) | 5293 (26.7) | 4899 (24.5) | 10,192 (25.6) | |
| 65–74 | 2007 (12.9) | 2268 (7.5) | 4275 (9.4) | 3310 (16.7) | 2574 (12.9) | 5884 (14.7) | |
| 75–upper | 503 (3.2) | 552 (1.8) | 1055 (2.3) | 1201 (6.1) | 928 (4.6) | 2129 (5.3) | |
| Han population * (n, %) | 14,726 (94.5) | 26,421 (87.3) | 41,147 (91.4) | 18,875 (95.3) | 17,057 (85.2) | 35,932 (89.7) | 0.669 |
| Education level * (n, %) | 0.248 | ||||||
| Primary school or below | 3848 (20.0) | 15,272 (47.3) | 19,120 (32.1) | 5853 (27.4) | 11,140 (56.3) | 16,993 (36.6) | |
| Junior high school | 5214 (32.5) | 10,741 (37.4) | 15,955 (34.5) | 6878 (33.5) | 6974 (33.6) | 13,852 (33.5) | |
| Senior high school | 4166 (29.8) | 3395 (12.6) | 7561 (22.2) | 4449 (22.1) | 1635 (8.2) | 6084 (17.6) | |
| College or above | 2326 (17.7) | 739 (2.6) | 3065 (11.1) | 2661 (17.0) | 280 (1.8) | 2941 (12.2) | |
| Marital status * (n, %) | <0.001 | ||||||
| Single | 1281 (17.3) | 1803 (11.3) | 3084 (14.6) | 932 (9.6) | 726 (6.1) | 1658 (8.5) | |
| Having a partner | 13,232 (76.7) | 26,677 (82.0) | 39,909 (79.1) | 17,200 (80.7) | 17,935 (84.1) | 35,135 (81.8) | |
| Divorced | 230 (1.3) | 208 (0.7) | 438 (1.0) | 349 (1.7) | 164 (0.8) | 513 (1.4) | |
| Widowed | 811 (4.7) | 1459 (6.0) | 2270 (5.3) | 1360 (8.0) | 1204 (9.0) | 2564 (8.3) | |
| Annual average income *, & (n, %) | <0.001 | ||||||
| <5000 Yuan RMB | 6868 (45.1) | 25,749 (85.6) | 32,717 (63.0) | 3034 (14.9) | 7416 (38.5) | 10,450 (22.4) | |
| 5000–9999 Yuan RMB | 4670 (29.6) | 3069 (10.2) | 7739 (21.0) | 3665 (18.8) | 5664 (27.6) | 9329 (21.6) | |
| ≥10,000 Yuan RMB | 3462 (22.3) | 922 (3.0) | 4384 (13.8) | 11,889 (59.5) | 6388 (31.0) | 18,277 (50.5) | |
| No response | 454 (3.0) | 407 (1.3) | 861 (2.2) | 1253 (6.8) | 561 (2.9) | 1814 (5.5) | |
| 2002 | 2010–2012 | p Value ** | |||||
|---|---|---|---|---|---|---|---|
| Urban | Rural | Total | Urban | Rural | Total | ||
| TC * (mmol/L, mean, SE) | 4.05 (0.05) | 3.79 (0.03) | 3.93 (0.03) | 4.66 (0.03) | 4.54 (0.04) | 4.62 (0.02) | <0.001 |
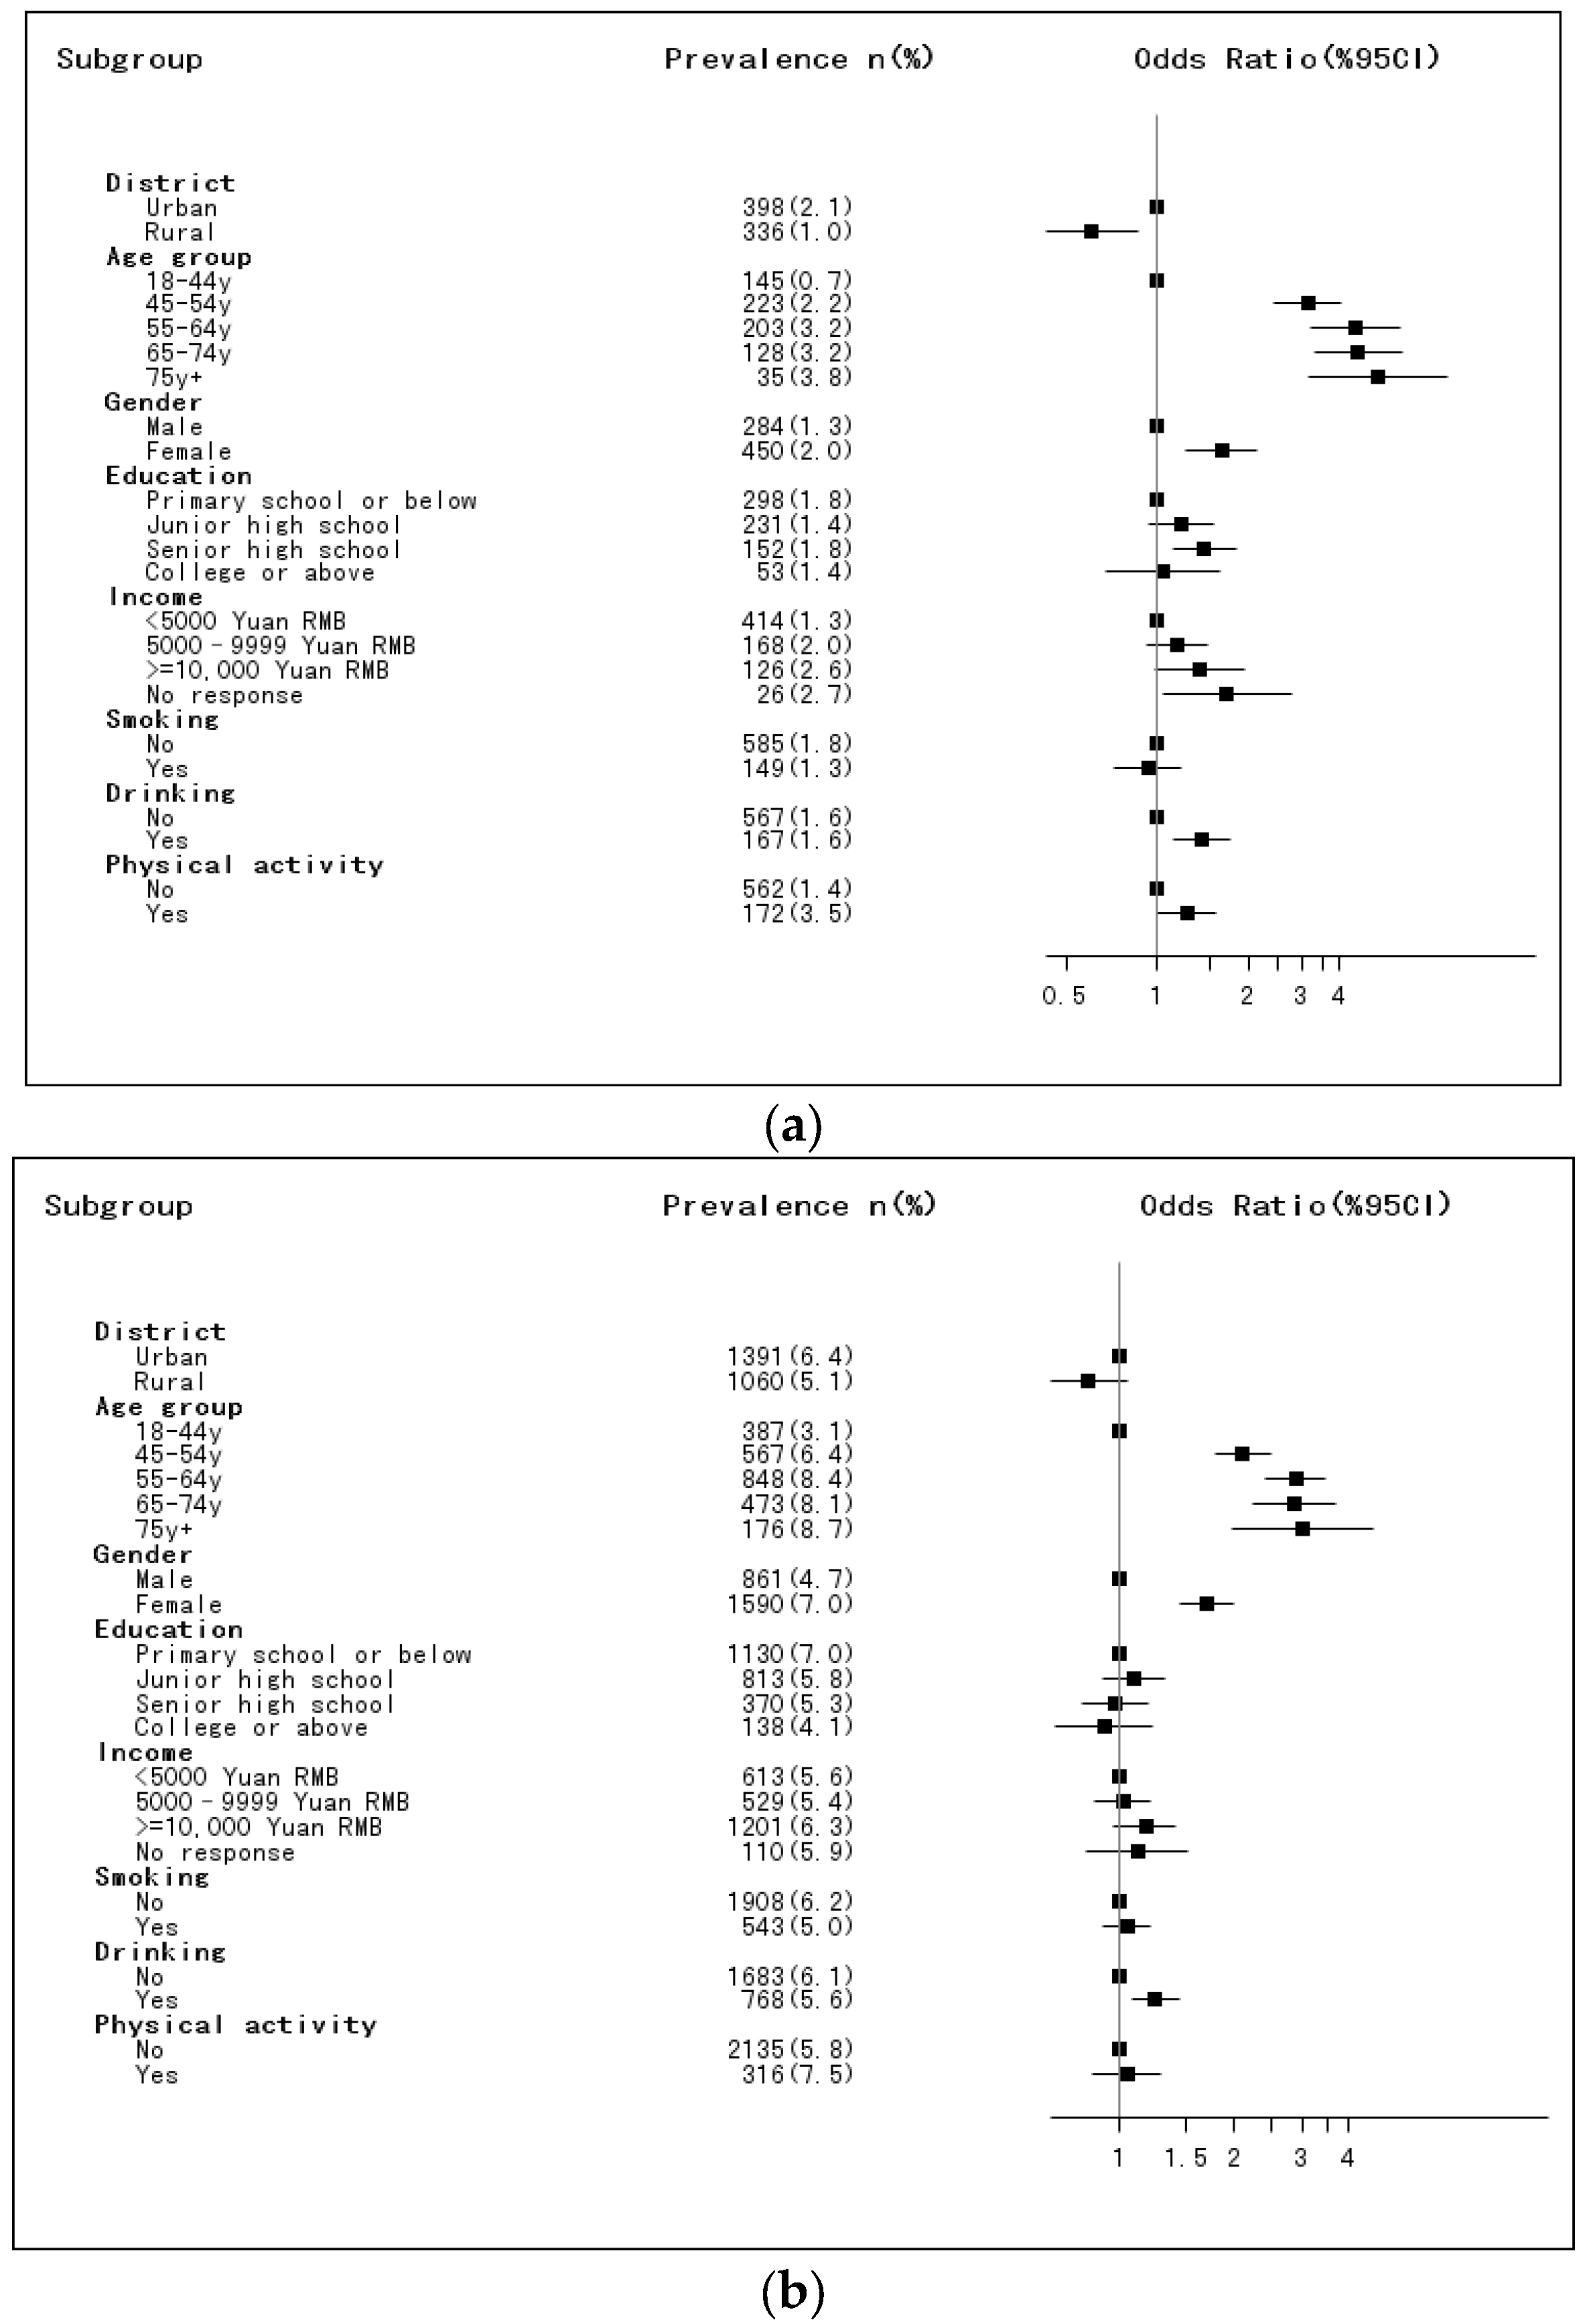
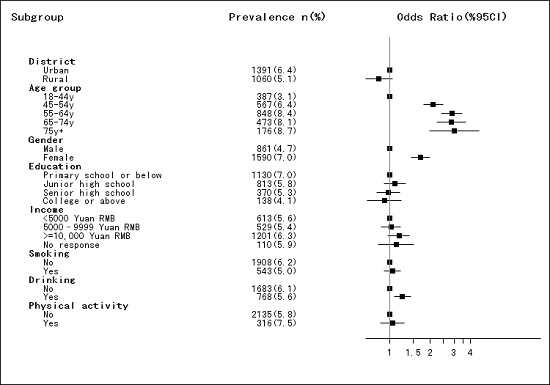
| Hypercholesterolemia (n, %) | 398 (2.1) | 336 (1.0) | 734 (1.6) | 1391 (6.4) | 1060 (5.1) | 2451 (6.0) | <0.001 |
| Smoking ## (n, %) | <0.001 | ||||||
| Yes | 3886 (26.3) | 8519 (30.0) | 12,405 (27.9) | 4479 (23.1) | 5734 (30.7) | 10,213 (25.5) | |
| No | 11,668 (73.7) | 21,628 (70.0) | 33,296 (72.1) | 15,362 (76.9) | 14,295 (69.3) | 29,667 (74.5) | |
| Drinking && (n, %) | <0.001 | ||||||
| Yes | 3636 (24.6) | 6690 (23.0) | 10326 (23.9) | 6453 (33.7) | 6506 (33.5) | 12,959 (33.6) | |
| No | 11,918 (75.4) | 23,457 (77.0) | 35,375 (76.1) | 13,388 (66.3) | 13,523 (66.5) | 26,913 (66.4) | |
| Physical activity § (n, %) | 0.195 | ||||||
| Yes | 3738 (20.0) | 805 (2.9) | 4543 (12.5) | 3187 (14.1) | 671 (3.3) | 3858 (10.7) | |
| No | 11,816 (80.0) | 29,342 (97.1) | 41,158 (87.5) | 16,654 (85.9) | 19,358 (96.7) | 36,012 (89.3) | |
| BMI & (mean (SE), kg/m2) | 23.6 (0.1) | 22.4 (0.1) | 23.1 (0.1) | 24.0 (0.1) | 23.2 (0.1) | 23.8 (0.1) | <0.001 |
| <18.5 (n, %) | 770 (6.6) | 2353 (9.0) | 3123 (7.6) | 704 (4.7) | 1127 (7.2) | 1831 (5.5) | <0.001 |
| 18.5–23.9 (n, %) | 7480 (50.8) | 18,689 (63.0) | 26,169 (56.2) | 9038 (47.0) | 10,803 (54.7) | 19,841 (49.5) | |
| 24.0–27.9 (n, %) | 5208 (30.7) | 6925 (21.5) | 12,133 (26.6) | 7327 (34.6) | 5973 (28.4) | 13,300 (32.6) | |
| ≥28.0 (n, %) | 2096 (11.9) | 2180 (6.6) | 4276 (9.6) | 2772 (13.6) | 2126 (9.7) | 4898 (12.4) | |
| Food Items (g/Day) | 2002 | 2010–2012 | p Value ** | ||||
|---|---|---|---|---|---|---|---|
| Urban | Rural | Total | Urban | Rural | Total | ||
| Male | |||||||
| N | 7150 | 14,205 | 21,355 | 8352 | 8970 | 17,322 | |
| Rice | 223.5 (16.5) | 260.8 (18.6) | 240.5 (12.3) | 125.8 (10.3) | 236.3 (24.4) | 163.9 (10.8) | <0.001 |
| Wheat | 136.1 (13.8) | 193.7 (18.7) | 162.3 (11.5) | 140.4 (12.3) | 161.9 (17.5) | 146.8 (10.0) | <0.001 |
| Other cereals | 13.3 (2.0) | 36.3 (5.8) | 23.8 (2.9) | 13.2 (1.8) | 13.5 (2.1) | 13.3 (1.4) | <0.001 |
| Vegetables | 262.0 (11.3) | 321.6 (9.6) | 289.2 (7.6) | 285.0 (7.6) | 257.1 (10.6) | 275.2 (6.2) | <0.001 |
| Fruits | 59.6 (6.5) | 29.2 (3.5) | 45.7 (4.0) | 44.3 (3.4) | 27.5 (5.8) | 38.0 (3.0) | <0.001 |
| Eggs | 34.4 (2.0) | 20.6 (1.4) | 28.1 (1.3) | 28.8 (1.3) | 17.8 (1.1) | 24.8 (1.0) | <0.001 |
| Fish | 53.8 (6.5) | 24.9 (3.1) | 40.6 (3.9) | 32.3 (3.2) | 15.5 (2.4) | 26.3 (2.2) | <0.001 |
| Milk | 54.4 (5.8) | 8.8 (3.2) | 33.6 (3.5) | 35.3 (2.7) | 7.6 (1.4) | 25.3 (1.8) | <0.001 |
| Poultry | 24.5 (2.7) | 10.7 (1.1) | 18.2 (1.6) | 16.1 (1.7) | 12.6 (1.4) | 14.8 (1.2) | <0.001 |
| Pork | 65.2 (3.7) | 50.4 (3.2) | 58.4 (2.5) | 66.3 (3.2) | 53.9 (4.3) | 61.3 (2.6) | <0.001 |
| Red meat offal | 6.7 (0.7) | 4.6 (0.5) | 5.7 (0.5) | 4.4 (0.4) | 2.8 (0.5) | 3.8 (0.3) | <0.001 |
| Other red meat | 16.7 (1.9) | 8.3 (1.8) | 12.9 (1.3) | 14.1 (1.2) | 6.7 (1.2) | 11.4 (0.9) | 0.001 |
| Legume | 16.7 (1.3) | 18.4 (1.4) | 17.5 (0.9) | 16.5 (0.9) | 12.7 (1.1) | 15.0 (0.7) | <0.001 |
| Tuber | 28.7 (3.1) | 64.3 (6.1) | 44.9 (3.3) | 34.5 (2.5) | 49.3 (5.1) | 39.4 (2.4) | <0.001 |
| Nuts | 5.6 (0.5) | 3.6 (0.4) | 4.7 (0.3) | 5.1 (0.5) | 2.7 (0.3) | 4.2 (0.4) | 0.002 |
| Cakes | 18.8 (1.7) | 5.7 (1.2) | 12.8 (1.1) | 17.3 (1.3) | 8.7 (1.6) | 14.2 (1.0) | <0.001 |
| Sugar | 5.1 (0.6) | 4.9 (0.7) | 5.0 (0.4) | 3.1 (0.2) | 1.4 (0.2) | 2.5 (0.2) | <0.001 |
| Salt | 10.3 (0.3) | 14.1 (0.4) | 12.0 (0.2) | 9.2 (0.2) | 11.7 (0.3) | 10.1 (0.2) | <0.001 |
| Vegetable oil | 41.4 (1.2) | 32.7 (1.8) | 37.4 (1.0) | 40.9 (1.4) | 38.2 (1.8) | 40.0 (1.1) | <0.001 |
| Animal oil | 2.7 (0.7) | 11.5 (1.4) | 6.7 (0.7) | 1.6 (0.4) | 7.1 (1.2) | 3.5 (0.5) | <0.001 |
| Female | |||||||
| N | 8404 | 15,942 | 24,346 | 11,489 | 11,059 | 22,548 | |
| Rice | 176 (12.1) | 223.3 (14.7) | 196.2 (9.4) | 100.8 (7.4) | 194.9 (18.7) | 127.9 (7.5) | <0.001 |
| Wheat | 109.2 (10.5) | 157.6 (14.1) | 129.9 (8.6) | 108.1 (8.7) | 132.4 (13.6) | 114.5 (7.3) | <0.001 |
| Other cereals | 13.7 (1.9) | 32.3 (4.6) | 21.6 (2.3) | 13.3 (1.7) | 14.0 (2.1) | 13.4 (1.3) | <0.001 |
| Vegetables | 238.5 (10.7) | 294.0 (9.0) | 262.2 (7.3) | 256.6 (7.2) | 238.6 (9.7) | 250.8 (5.8) | <0.001 |
| Fruits | 73.6 (7.5) | 33.3 (3.9) | 56.3 (4.7) | 55.5 (3.4) | 32.3 (4.8) | 48.8 (2.8) | 0.114 |
| Eggs | 31.2 (1.6) | 18.4 (1.1) | 25.7 (1.0) | 25.5 (1.1) | 16.5 (1.0) | 22.8 (0.8) | <0.001 |
| Fish | 45.1 (5.9) | 22.4 (2.9) | 35.4 (3.6) | 26.6 (2.9) | 13.1 (2.2) | 22.5 (2.1) | <0.001 |
| Milk | 57.7 (5.9) | 8.1 (2.4) | 36.5 (3.6) | 39.0 (2.6) | 7.0 (1.1) | 29.6 (1.7) | 0.009 |
| Poultry | 20.1 (2.3) | 9.0 (0.9) | 15.4 (1.4) | 13.3 (1.5) | 10.9 (1.3) | 12.4 (1.1) | 0.062 |
| Pork | 52.1 (3.2) | 41.1 (2.7) | 47.4 (2.2) | 52.3 (3.0) | 45.5 (3.6) | 50.0 (2.4) | <0.001 |
| Red meat offal | 4.8 (0.6) | 3.4 (0.4) | 4.2 (0.4) | 3.2 (0.3) | 2.6 (0.4) | 3.0 (0.2) | <0.001 |
| Other red meat | 11.8 (1.5) | 6.4 (1.6) | 9.5 (1.1) | 9.6 (1.0) | 5.3 (1.0) | 8.3 (0.7) | 0.001 |
| Legume | 14.1 (1.0) | 15.8 (1.2) | 14.8 (0.8) | 14.5 (0.7) | 11.2 (1.1) | 13.5 (0.6) | <0.001 |
| Tuber | 27.0 (2.7) | 59.8 (5.0) | 41.0 (2.7) | 36.3 (3.1) | 47.5 (4.9) | 39.5 (2.6) | <0.001 |
| Nuts | 4.8 (0.4) | 3.1 (0.3) | 4.0 (0.3) | 4.6 (0.4) | 2.5 (0.3) | 4.0 (0.3) | 0.442 |
| Cakes | 17.3 (1.4) | 4.7 (0.8) | 11.9 (0.9) | 17.3 (1.0) | 7.7 (1.4) | 14.5 (0.8) | <0.001 |
| Sugar | 4.9 (0.5) | 4.0 (0.5) | 4.5 (0.4) | 3.0 (0.2) | 1.2 (0.1) | 2.5 (0.2) | <0.001 |
| Salt | 8.6 (0.3) | 12.2 (0.3) | 10.2 (0.2) | 7.7 (0.2) | 9.6 (0.3) | 8.2 (0.2) | <0.001 |
| Vegetable oil | 35.1 (0.9) | 28.3 (1.6) | 32.2 (0.8) | 33.6 (1.0) | 31.0 (1.4) | 32.8 (0.8) | <0.001 |
| Animal oil | 2.3 (0.6) | 10.2 (1.3) | 5.6 (0.6) | 1.6 (0.5) | 6.2 (1.0) | 2.9 (0.4) | <0.001 |
| 2002 | 2010–2012 | p Value ** | |||||
|---|---|---|---|---|---|---|---|
| Urban | Rural | Total | Urban | Rural | Total | ||
| Male | |||||||
| Energy intake (kcal/day) | 2168.8 (45.5) | 2628.5 (28.8) | 2378.3 (28.2) | 2042.2 (36.2) | 2350.0 (58.8) | 2150.0 (31.1) | <0.001 |
| Carbohydrate Intake (g/day) | 265.4 (7.9) | 394.1 (4.7) | 324.0 (5.0) | 255.2 (6.4) | 348.9 (10.6) | 288.0 (5.6) | <0.001 |
| Fat Intake (g/day) | 87.2 (2.1) | 79.6 (1.8) | 83.7 (1.4) | 85.2 (1.8) | 79.2 (2.0) | 83.1 (1.4) | <0.001 |
| Protein intake (g/day) | 71.7 (1.9) | 74.0 (1.1) | 72.7 (1.1) | 66.2 (1.4) | 63.7 (1.4) | 65.4 (1.1) | <0.001 |
| %E carbohydrate | 50.0 (0.9) | 61.6 (0.5) | 55.3 (0.5) | 50.1 (0.6) | 59.2 (0.6) | 53.2 (0.4) | <0.001 |
| %E fat | 36.3 (0.7) | 26.9 (0.5) | 32.0 (0.5) | 36.9 (0.6) | 29.9 (0.6) | 34.4 (0.4) | <0.001 |
| %E protein | 13.6 (0.3) | 11.5 (0.1) | 12.7 (0.2) | 13.0 (0.2) | 10.9 (0.1) | 12.3 (0.1) | <0.001 |
| Female | |||||||
| Energy intake (kcal/day) | 1785.4 (30.0) | 2207.4 (23.8) | 1965.9 (20.2) | 1666.9 (24.8) | 1954.4 (44.2) | 1750.8 (21.9) | <0.001 |
| Carbohydrate Intake (g/day) | 222.1 (5.6) | 336.0 (4.0) | 270.8 (3.7) | 213.5 (4.4) | 294.4 (8.1) | 237.1 (4.0) | <0.001 |
| Fat Intake (g/day) | 72.9 (1.6) | 67.7 (1.5) | 70.7 (1.1) | 70.0 (1.3) | 66.2 (1.6) | 68.9 (1.0) | <0.001 |
| Protein intake (g/day) | 59.7 (1.6) | 63.0 (0.9) | 61.1 (1.0) | 54.6 (1.2) | 54.4 (1.3) | 54.6 (1.0) | <0.001 |
| %E carbohydrate | 50.2 (0.8) | 61.7 (0.5) | 55.1 (0.5) | 50.6 (0.6) | 59.4 (0.5) | 53.2 (0.4) | <0.001 |
| %E fat | 36.2 (0.6) | 26.8 (0.5) | 32.2 (0.4) | 36.5 (0.5) | 29.6 (0.5) | 34.5 (0.4) | <0.001 |
| %E protein | 13.6 (0.3) | 11.5 (0.1) | 12.7 (0.2) | 12.9 (0.2) | 11.0 (0.2) | 12.4 (0.2) | <0.001 |
| Q1 | Q2 | Q3 | Q4 | p Value | |
|---|---|---|---|---|---|
| Survey 2002 | |||||
| Rice | 1 | 1.12 (0.85–1.46) | 1.24 (0.92–1.68) | 0.93 (0.65–1.33) | 0.230 |
| Wheat # | 1 | 0.97 (0.75–1.25) | 0.58 (0.41–0.82) | - | <0.001 |
| Other cereals & | 1 | 1.01 (0.85–1.20) | - | - | 0.914 |
| Vegetables | 1 | 1.09 (0.81–1.48) | 1.25 (1.01–1.56) | 1.16 (0.83–1.64) | 0.210 |
| Fruits # | 1 | 1.40 (1.02–1.90) | 1.15 (0.90–1.47) | - | 0.097 |
| Eggs | 1 | 1.35 (0.39–4.70) | 1.08 (0.87–1.34) | 1.26 (0.98–1.62) | 0.300 |
| Fish # | 1 | 1.32 (0.99–1.76) | 1.55 (1.21–2.00) | - | 0.003 |
| Milk & | 1 | 1.12 (0.87–1.44) | - | - | 0.376 |
| Poultry & | 1 | 1.19 (0.95–1.50) | - | - | 0.129 |
| Pork # | 1 | 1.11 (0.88–1.39) | 1.28 (0.98–1.68) | - | 0.193 |
| Red meat offal & | 1 | 1.34 (1.00–1.80) | - | - | 0.048 |
| Other red meat & | 1 | 0.92 (0.69–1.24) | - | - | 0.589 |
| Legume # | 1 | 0.86 (0.66–1.12) | 1.00 (0.80–1.25) | - | 0.507 |
| Tuber # | 1 | 0.76 (0.60–0.97) | 0.72 (0.55–0.94) | - | 0.025 |
| Nuts & | 1 | 1.27 (1.00–1.62) | - | - | 0.050 |
| Cakes & | 1 | 1.00 (0.78–1.28) | - | - | 0.982 |
| Sugar & | 1 | 0.88 (0.70–1.11) | - | - | 0.281 |
| Salt | 1 | 0.94 (0.71–1.24) | 0.95 (0.73–1.24) | 0.97 (0.76–1.24) | 0.975 |
| Vegetable oil | 1 | 1.00 (0.74–1.34) | 0.86 (0.65–1.13) | 0.81 (0.61–1.07) | 0.311 |
| Animal oil # | 1 | 1.04 (0.72–1.52) | 1.19 (0.90–1.58) | - | 0.422 |
| Survey 2010–2012 | 1 | ||||
| Rice | 1 | 1.05 (0.86–1.29) | 1.22 (0.95–1.56) | 1.25 (0.93–1.68) | 0.377 |
| Wheat # | 1 | 0.89 (0.76–1.06) | 0.82 (0.66–1.02) | - | 0.172 |
| Other cereals & | 1 | 0.83 (0.69–0.99) | - | - | 0.035 |
| Vegetables | 1 | 1.29 (0.91–1.53) | 1.07 (0.89–1.28) | 1.17 (0.94–1.45) | 0. 202 |
| Fruits # | 1 | 1.12 (0.91–1.38) | 0.92 (0.81–1.05) | - | 0.232 |
| Eggs | 1 | 0.95 (0.77–1.17) | 1.10 (0.95–1.28) | 0.96 (0.83–1.12) | 0.357 |
| Fish # | 1 | 1.11 (0.94–1.31) | 1.51 (1.22–1.87) | - | <0.001 |
| Milk & | 1 | 1.08 (0.93–1.26) | - | - | 0.308 |
| Poultry | 1 | 1.19 (0.72–1.96) | 1.22 (1.02–1.44) | - | 0.074 |
| Pork | 1 | 1.10 (0.95–1.27) | 1.29 (1.08–1.55) | 1.81 (1.45–2.24) | <0.001 |
| Red meat offal & | 1 | 0.99 (0.78–1.26) | - | - | 0.945 |
| Other red meat & | 1 | 0.96 (0.81–1.13) | - | - | 0.625 |
| Legume # | 1 | 0.87 (0.75–1.00) | 0.67 (0.57–0.79) | - | <0.001 |
| Tuber # | 1 | 0.89 (0.76–1.04) | 0.79 (0.69–0.91) | - | 0.004 |
| Nuts & | 1 | 1.01 (0.84–1.21) | - | - | 0.926 |
| Cakes & | 1 | 0.90 (0.77–1.06) | - | - | 0.223 |
| Sugar & | 1 | 1.15 (0.96–1.37) | - | - | 0.129 |
| Salt | 1 | 0.97 (0.81–1.17) | 0.86 (0.72–1.03) | 0.82 (0.67–1.00) | 0.076 |
| Vegetable oil | 1 | 0.82 (0.69–0.98) | 0.74 (0.60–0.90) | 0.70 (0.58–0.83) | <0.001 |
| Animal oil & | 1 | 1.25 (1.04–1.48) | - | - | 0.014 |
| Q1 | Q2 | Q3 | Q4 | p Value | |
|---|---|---|---|---|---|
| Survey 2002 | |||||
| Energy intake | 1 | 0.95 (0.75–1.21) | 1.06 (0.81–1.38) | 0.95 (0.70–1.30) | 0.791 |
| Carbohydrate | 1 | 0.86 (0.66–1.11) | 0.72 (0.51–1.02) | 0.61 (0.39–0.96) | 0.168 |
| Fat | 1 | 1.27 (0.94–1.71) | 1.26 (0.95–1.67) | 1.29 (0.90–1.85) | 0.397 |
| Protein | 1 | 1.17 (0.94–1.45) | 1.56 (1.17–2.08) | 1.96 (1.38–2.79) | 0.003 |
| Protein from animal | 1 | 1.08 (0.78–1.50) | 1.66 (1.21–2.27) | 2.04 (1.49–2.81) | <0.001 |
| Protein from plant | 1 | 0.98 (0.82–1.17) | 0.72 (0.57–0.93) | 0.84 (0.62–1.14) | 0.048 |
| Survey 2010–2012 | |||||
| Energy intake | 1 | 1.02 (0.87–1.19) | 1.04 (0.88–1.23) | 1.07 (0.90–1.28) | 0.875 |
| Carbohydrate | 1 | 0.91 (0.76–1.09) | 0.93 (0.76–1.15) | 0.76 (0.56–1.03) | 0.180 |
| Fat | 1 | 1.15 (0.93–1.41) | 1.05 (0.86–1.30) | 1.12 (0.87–1.44) | 0.583 |
| Protein | 1 | 1.30 (1.09–1.57) | 1.35 (1.10–1.66) | 1.72 (1.24–2.40) | 0.006 |
| Protein from animal | 1 | 1.22 (1.04–1.43) | 1.59 (1.30–1.94) | 2.04 (1.63–2.56) | <0.001 |
| Protein from plant | 1 | 0.88 (0.75–1.02) | 0.78 (0.65–0.94) | 0.68 (0.54–0.87) | 0.009 |
© 2017 by the authors. Licensee MDPI, Basel, Switzerland. This article is an open access article distributed under the terms and conditions of the Creative Commons Attribution (CC BY) license ( http://creativecommons.org/licenses/by/4.0/).
Share and Cite
Song, P.-k.; Li, H.; Man, Q.-q.; Jia, S.-s.; Li, L.-x.; Zhang, J. Trends in Determinants of Hypercholesterolemia among Chinese Adults between 2002 and 2012: Results from the National Nutrition Survey. Nutrients 2017, 9, 279. https://doi.org/10.3390/nu9030279
Song P-k, Li H, Man Q-q, Jia S-s, Li L-x, Zhang J. Trends in Determinants of Hypercholesterolemia among Chinese Adults between 2002 and 2012: Results from the National Nutrition Survey. Nutrients. 2017; 9(3):279. https://doi.org/10.3390/nu9030279
Chicago/Turabian StyleSong, Peng-kun, Hong Li, Qing-qing Man, Shan-shan Jia, Li-xiang Li, and Jian Zhang. 2017. "Trends in Determinants of Hypercholesterolemia among Chinese Adults between 2002 and 2012: Results from the National Nutrition Survey" Nutrients 9, no. 3: 279. https://doi.org/10.3390/nu9030279
APA StyleSong, P.-k., Li, H., Man, Q.-q., Jia, S.-s., Li, L.-x., & Zhang, J. (2017). Trends in Determinants of Hypercholesterolemia among Chinese Adults between 2002 and 2012: Results from the National Nutrition Survey. Nutrients, 9(3), 279. https://doi.org/10.3390/nu9030279