Review

Relationship between Long Chain n-3 Polyunsaturated Fatty Acids and Autism Spectrum Disorder: Systematic Review and Meta-Analysis of Case-Control and Randomised Controlled Trials

1
Massey Institute of Food Science and Technology, School of Food and Nutrition, Massey University, Auckland 0745, New Zealand
2
Commonwealth Scientific Industrial Research Organisation (CSIRO) Food, Nutrition and Bioproducts, Adelaide SA 5000, Australia
3
Massey Institute of Food Science and Technology, School of Food and Nutrition, Massey University, Palmerston North 4410, New Zealand
*
Author to whom correspondence should be addressed.
Nutrients 2017, 9(2), 155; https://doi.org/10.3390/nu9020155
Submission received: 9 December 2016 / Revised: 8 February 2017 / Accepted: 13 February 2017 / Published: 19 February 2017
(This article belongs to the Special Issue Dietary Intake and Behavior in Children)

Abstract

:
Omega-3 long chain polyunsaturated fatty acid supplementation (n-3 LCPUFA) for treatment of Autism Spectrum Disorder (ASD) is popular. The results of previous systematic reviews and meta-analyses of n-3 LCPUFA supplementation on ASD outcomes were inconclusive. Two meta-analyses were conducted; meta-analysis 1 compared blood levels of LCPUFA and their ratios arachidonic acid (ARA) to docosahexaenoic acid (DHA), ARA to eicosapentaenoic acid (EPA), or total n-6 to total n-3 LCPUFA in ASD to those of typically developing individuals (with no neurodevelopmental disorders), and meta-analysis 2 compared the effects of n-3 LCPUFA supplementation to placebo on symptoms of ASD. Case-control studies and randomised controlled trials (RCTs) were identified searching electronic databases up to May, 2016. Mean differences were pooled and analysed using inverse variance models. Heterogeneity was assessed using I2 statistic. Fifteen case-control studies (n = 1193) were reviewed. Compared with typically developed, ASD populations had lower DHA (−2.14 [95% CI −3.22 to −1.07]; p < 0.0001; I2 = 97%), EPA (−0.72 [95% CI −1.25 to −0.18]; p = 0.008; I2 = 88%), and ARA (−0.83 [95% CI, −1.48 to −0.17]; p = 0.01; I2 = 96%) and higher total n-6 LCPUFA to n-3 LCPUFA ratio (0.42 [95% CI 0.06 to 0.78]; p = 0.02; I2 = 74%). Four RCTs were included in meta-analysis 2 (n = 107). Compared with placebo, n-3 LCPUFA improved social interaction (−1.96 [95% CI −3.5 to −0.34]; p = 0.02; I2 = 0) and repetitive and restricted interests and behaviours (−1.08 [95% CI −2.17 to −0.01]; p = 0.05; I2 = 0). Populations with ASD have lower n-3 LCPUFA status and n-3 LCPUFA supplementation can potentially improve some ASD symptoms. Further research with large sample size and adequate study duration is warranted to confirm the efficacy of n-3 LCPUFA.

1. Introduction

The prevalence of Autism Spectrum Disorder (ASD) has dramatically increased over the past few years. While previous prevalence studies of ASD identified less than 10 in 10,000 individuals [1], recent estimates suggest rates of 90 to 250 in 10,000 individuals [2,3,4,5]. ASD is a life-long neurodevelopment disorder that appears during the first years of life [6]. Depending on the child’s predominant symptomatology, children with ASD exhibit difficulties with expressing and understanding certain emotions, understanding others’ mood, expressive language, and maintaining normal eye contact, as well as preference for minimal changes to routine, restricted ways of using toys and isolated play, all of which make it difficult for individuals to establish relationships with others, to act in an appropriate way and to live independently [6]. In addition, children with ASD frequently experience behaviour problems and medical conditions, including inflammation, oxidative stress, and autoimmune disorders [7,8,9,10,11,12], and altered brain structure and function (in a subset of individuals) [13,14]. The rising ASD rates are ascribed, in part, to a complex interaction between multiple genes and environmental risk factors [15], among which omega-3 long chain polyunsaturated fatty acids (n-3 LCPUFAs) is a strong candidate. LCPUFAs and their metabolic products have been implicated in ASD via their roles in brain structure and function, neurotransmission, cell membrane structure and microdomain organisation, inflammation, immunity and oxidative stress [16,17,18,19,20].
Blood polyunsaturated fatty acids (plasma, serum, red blood cell (RBC), and whole blood) levels are considered reliable biomarkers of their status [21]. Abnormality in blood levels of n-3 LCPUFA has been reported in psychiatric disorders including, but not limited to, attention deficit hyperactivity disorder (ADHD) and ASD [22,23,24]. Explanations for such abnormalities have been suggested to be lower dietary intake of n-3 LCPUFAs, and disturbances in fatty acid metabolism and incorporation of these fatty acids into cellular membranes in autistic populations compared to healthy controls [24,25,26]. A smattering of reports indicate differences in n-3 LCPUFAs, n-6 LCPUFAs and/or n-6 to n-3 LCPUFA ratios between populations with autism and healthy controls [14,26], but a few also failed to show any differences [27,28]. The reason for such discrepancies is not well examined, and there have been no attempts to systematically compare these studies. Hence, systematic analysis and synthesis of the evidence are warranted to determine if there are any differences in these blood fatty acids levels among healthy and individuals with ASD, and if so, whether n-3 LCPUFA supplementation may be beneficial in reducing symptoms in ASD.
To our knowledge, the efficacy of n-3 LCPUFA supplementation in ASD has been investigated by six open-label trials [29,30,31,32,33,34] and one case study [35], the majority of which (six out of seven studies) showed significant improvement in symptoms of ASD (Table S1). Despite this promising evidence, randomised controlled trials (RCTs) examining the beneficial effect of n-3 LCPUFAs in reducing symptoms of ASD have yielded inconclusive results. For example, Amminger et al. (2007) showed that supplementation with n-3 LCPUFA (EPA + DHA) was superior over placebo in reducing stereotypy, inappropriate speech and hyperactivity [36], while Mankad et al. (2015) failed to show any effect of n-3 LCPUFA supplementation on autism severity symptoms, adaptive functioning, externalizing behaviour or verbal ability [37].
To date, two systematic reviews of interventions with n-3 LCPUFA in ASD have been published [38,39]. In the review by Bent et al., published in 2009, authors set broad inclusion criteria and included all intervention trials of n-3 LCPUFAs of any type, dose, and duration addressing core and associated symptoms of ASD [38]. They identified six studies; one randomised controlled trial, four open-label trials and one case-study and concluded that the evidence was insufficient to support clinical recommendations [38].
Two years later, James, Montgomery and Williams (2011) published a Cochrane review including only two RCTs and performing meta-analyses on three primary outcomes (social interaction, communication and stereotypy) and one secondary outcome (hyperactivity) [39]. The authors reached the same conclusion as the Bent et al. review [38], and identified four ongoing studies. At the time of writing this review, the findings of one trial was published [37], one was terminated in 2014 (NCT01248130), and no information was available regarding the recruitment status or the availability of data for two trials (NCT00467818 and NCT01260961).
An updated systematic review is timely; more studies are now available, the prevalence of ASD is increasing together with a greater interest in the medical community (health professionals) on the beneficial effect of n-3 LCPUFA in the treatment of neurodevelopment disorders, as well as an increasing interest in using complementary and alternative medication in this population [40]. We aimed to conduct a current examination of evidence. We designed two systematic reviews and meta-analyses;
  • Meta-analysis 1: a meta-analysis of evidence regarding blood n-3 LCPUFA levels in populations with ASD compared to typically developing counterparts (with no neurodevelopmental disorders) of any age and sex. A secondary aim for meta-analysis 1 was to perform a priori subgroup analysis to investigate the influence of ASD on fatty acid composition across different age groups (studies including only young children vs. studies also including children, teenagers, and adults).
  • Meta-analysis 2: a meta-analysis of randomised controlled trials of n-3 LCPUFA supplementation (of any type, dose and duration) in ASD populations (of any age and sex) to assess the clinical efficacy of n-3 LCPUFAs treatment in reducing core symptoms of ASD and co-existing conditions.

2. Materials and Methods

All study procedures for both meta-analyses were pre-defined, but have not been registered or published elsewhere.

2.1. Eligibility Criteria

For meta-analysis 1, we included case-control observational studies that examined the differences in blood fatty acid levels between populations with ASD and healthy typically developing controls (with no neurodevelopmental disorders) of any age and sex. Studies were excluded it they included non-typically developing controls, were non-English or unpublished. Because DHA, EPA and ARA are amongst the most reported fatty acids of n-3 LCPUFAs and n-6 LCPUFAs categories, respectively, and have been shown to be more biologically active in the brain and been linked to neurodevelopment disorders, we focused on these fatty acids as well as the ratio of ARA to EPA and DHA and the ratio of n-6 LCPUFA to n-3 LCPUFA [41,42]. We included studies that reported LCPUFA in various blood fractions expressed as either % of total fatty acids or in concentration units, including RBC, serum, plasma, plasma phospholipids and whole blood [21]. These fractions have been shown to be reliable markers for the general fatty acid pool [21].
For meta-analysis 2, we included RCTs of any dose, type, and duration of n-3 LCPUFAs in participants with ASD of any age and sex who were randomised to receive either intervention or placebo, and reporting one of the following outcome measures: core symptoms of ASD including social interaction, communication, and repetitive restrictive behaviours or interests (RRB), and symptoms or behaviours associated with ASD including hyperactivity, irritability, sensory issues, and gastrointestinal symptoms. Unpublished and non-English studies were excluded.
Meta-analyses were performed if at least two studies employed the same assessment tool to measure the outcome of interest. There is a large variability in outcome assessment methods in ASD studies [43]. This use of different tools not only compromises the validity of a study by increasing the likelihood of type 1 error [44], but also complicates an effective comparison across studies.

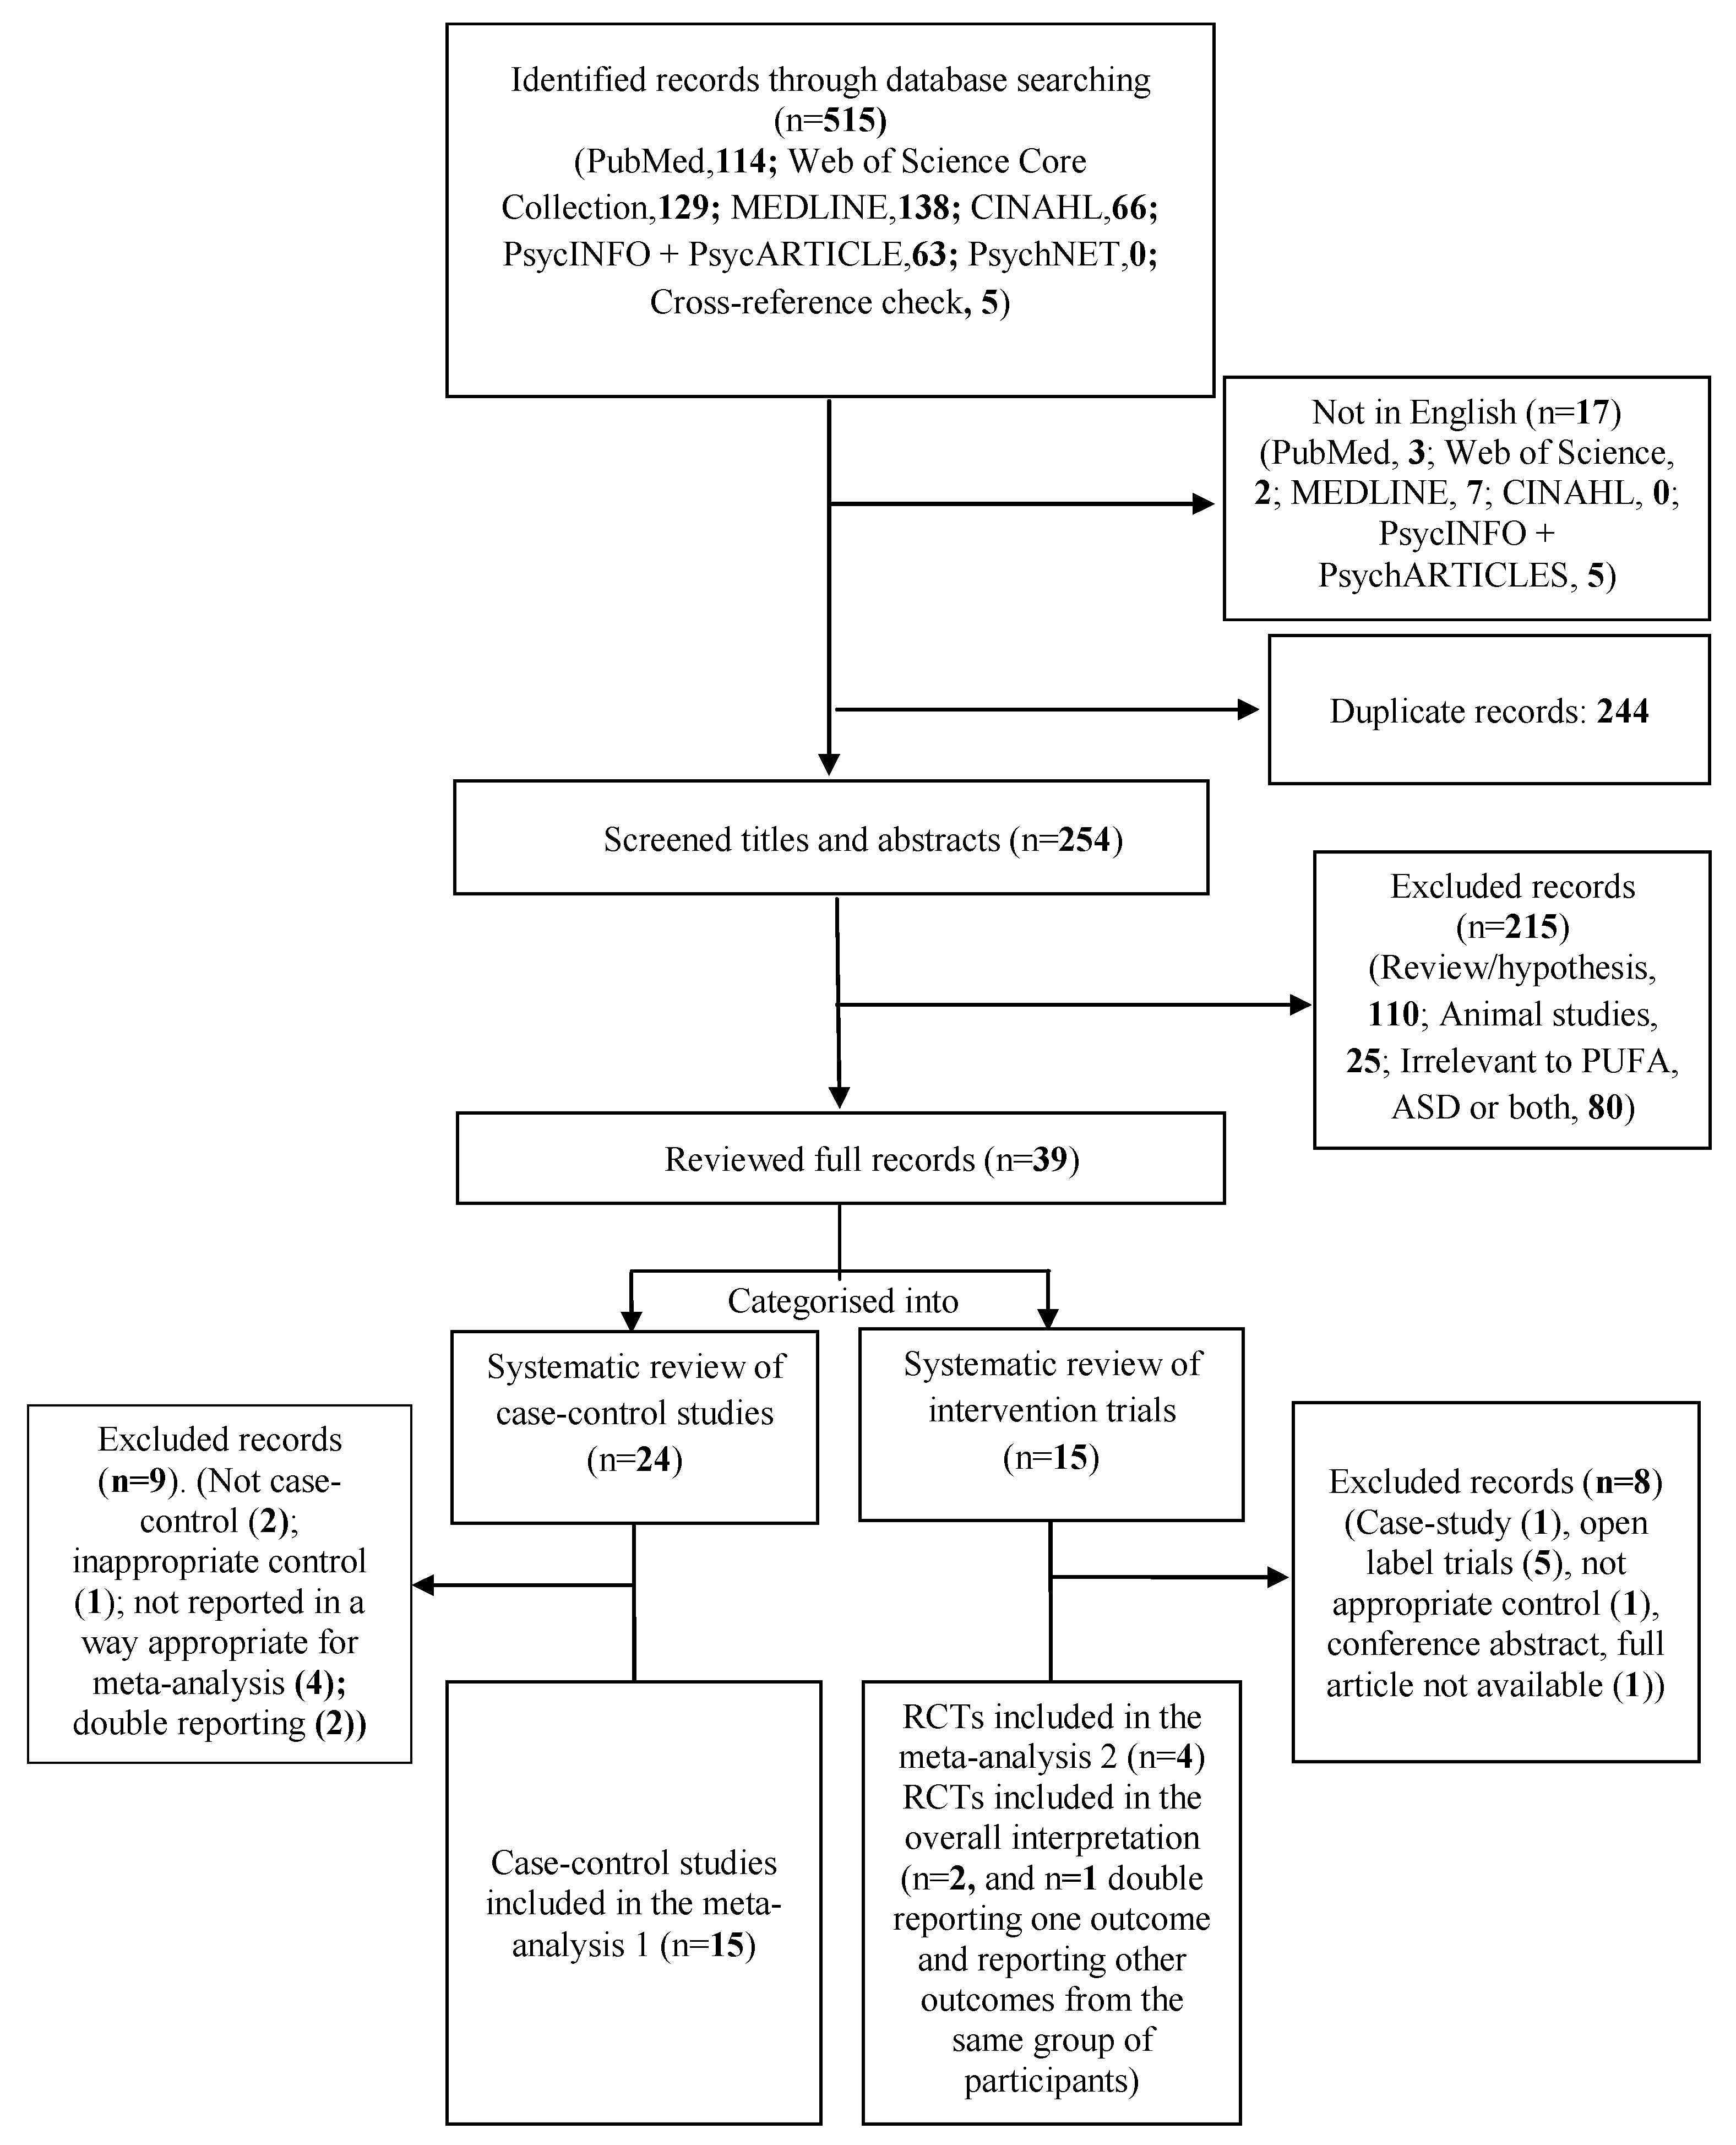
2.2. Search Methods for Identification of Studies

We searched PubMed, MEDLINE, Web of Science, CINAHL, PsycINFO, PsycARTICLES and PsycNET up to May, 2016 to identify relevant studies in English. We employed broad search terms to include all potential studies that may fall within each of the mentioned reviews. The search strategy used the following terms: (“omega 3” OR “omega3” OR “omega-3” OR “polyunsaturated fatty acids” OR “polyunsaturated fatty acid” OR “essential fatty acids” OR “essential fatty acid”) AND (“autism” OR “autistic” OR “autism spectrum disorder” OR “Asperger”). We also reviewed the reference lists of all identified studies to identify additional studies. Results from each database were downloaded into EndNote (version X6, 2012, Thomson Reuters, Philadelphia, PA, USA). Duplicates were removed and abstracts were screened. When an abstract met the eligibility requirements, it was assigned to one of two meta-analyses and the full article was read to ensure the inclusion and exclusion criteria were met. The study identification was done by one investigator (H.M.).

2.3. Data Extraction, Management, and Quality Assessment

Two reviewers (H.M. and M.D.) independently performed data extraction from each study into pre-piloted extraction tables. Discrepancies in the data extraction were resolved by discussion and reaching consensus.
The following data were extracted for both meta-analyses: author, date of publication and setting, sources of funding, conflict of interest, aims, objectives and hypothesis, and population characteristics while extractions specific to each meta-analyses are described below.
For meta-analysis 1, the following data were also extracted: the mean and SD for blood n-3 LCPUFAs (DHA, EPA or total), n-6 LCPUFAs (ARA or total), and for n-6 to n-3 LCPUFA ratios (ARA to DHA, ARA to EPA, or total n-6 to total n-3 LCPUFA), fatty acid analysis method, the body tissue in which the fatty acid was measured, the unit of measure, and the significance value. If a study reported LCPUFA in two different blood tissues, the priority was given to RBC, followed by plasma phospholipids, serum/plasma, and whole blood. While RBC and plasma phospholipids LCPUFA reflects long-term fatty acid intake, serum/plasma or whole blood LCPUFA are influenced by recent intake of these fatty acids [21,45]. If a study reported both relative and absolute measures, the former measures were included in the meta-analysis to limit the methodological heterogeneity. The method by which blood fatty acid composition is expressed (relative vs. absolute) has been shown to modify the LCPUFA—disease relationship [46]. Inter-study variation in extraction and separation efficiencies in fatty acid analyses can be overcome by relative expression of fatty acids (expressed as a percentage of a fatty acid normalised to the total amount of all measured fatty acids in a sample) [46]. If more than two groups were included, only relevant groups were selected. A quality appraisal was performed in duplicate by two investigators (H.M. and M.D.) using the “Health Canada Quality Appraisal Tools for Observational Studies” [47]. A quality score of ≤6 was considered lower quality [47]. No studies were excluded based on quality scores, but sensitivity analysis was performed to assess the impact of these studies on the overall results.
For meta-analysis 2, study design, intervention (the dose of intervention was converted, where required, to gram from milligram for easy comparison), delivery method, compliance, intervention period, outcome measures, assessment tools, results, conclusion, potential confounders and assessment of bias risk following Cochrane bias risk assessment including selection, performance, detection, attrition, reporting and commercial bias were also extracted [48]. A further quality appraisal was performed in duplicate by two investigators (H.M. and M.D.) using the “Health Canada Quality Appraisal Tools for Randomised Controlled Trials” to assess the quality of the individual studies [47]. A quality score of ≤7 was considered lower quality [47].

2.4. Statistical Analysis

Both meta-analyses were performed using Review Manager (RevMan, version 5.3, The Nordic Cochrane Centre, Copenhagen, Denmark).

2.4.1. Meta-Analysis 1

For each outcome, the mean and SD for each study group (cases and controls) was entered into Review Manager. If n-3 to n-6 fatty acid (total n-3 to n-6 LCPUFA, EPA to ARA or DHA to ARA) was reported, the ratio was converted to n-6/n-3 (1/ratio). The Review Manager calculator (between group differences) was employed to calculate the SD for these reverse ratios. The reverse ratio and SD were calculated for five studies [49,50,51,52,53].
The primary meta-analysis compared mean differences (95% confidence intervals (CI)) in outcomes across study groups. Due to significant heterogeneity a random effects model was used to calculate the forest plots with standardised mean differences and 95% CI. Standardised mean differences were calculated because blood levels of LCPUFA were measured and reported in different ways. A combination of Chi2-statistic (p < 0.1), I2 statistics (I2 0%–40%, low; 30%–60%, moderate; 50%–90%, substantial; 75%–100%, considerable heterogeneity), and considering the variation of point estimates and the overlap of CIs across different studies was performed to measure heterogeneity [48].
To avoid false positive or negative results, we limited the number of subgroup analyses to one (stratified by age) and sensitivity analyses to three (blood tissue type, study quality, and author’s calculations). Then a priori subgroup analysis was performed using Chi2-statistic with a p value of <0.05 taken to indicate statistical significance [48]. We could not conduct meta-regression to investigate the impact of the potential mediators (location, sex, and the way by which fatty acid composition is expressed) due to the limited study numbers. To include one mediator in the analysis, at least 10 studies are required [48]. These variables were however carefully examined when the results were interpreted. Publication bias was examined using funnel plots in which the SE of the studies were plotted against their corresponding effect sizes.

2.4.2. Meta-Analysis 2

For each outcome, the mean change and SD of change from baseline to endpoint for each intervention group (n-3 LCPUFA and placebo) was entered into Review Manager. If only baseline and end data were available the mean change was calculated by deducting the baseline from the end value, and the SD was then imputed from a mean correlation coefficient for an outcome from other studies in the meta-analysis. Standard deviations were calculated for one study [54]. Study authors were contacted for missing data, and if no response was received the data was not included in the meta-analysis. Data was unable to be retrieved for three studies [55,56,57].
The primary meta-analyses compared mean (95% CI) differences (net change in scores) in each domain between n-3 LCPUFA and control groups. Heterogeneity between studies was small hence a fixed-effects model was used to calculate forest plots with mean differences and 95% CI. Heterogeneity between studies was indicated using the same analyses employed in meta-analysis 1. No subgroup analyses or meta-regression were performed due to limited number of studies included in the meta-analysis. However, one sensitivity analysis was performed to evaluate the impact of calculations (SDs) and major methodological differences on heterogeneity and the overall results. Publication bias was not assessed due to the small number of studies included in this meta-analysis.

3. Results

From the initial searches, 510 articles and from the cross-reference check, five articles were retrieved. Titles and abstracts of 254 articles were screened after non-English and duplicates were removed. At this level, 216 were excluded as not relevant to the current topic. The remaining 38 articles were read and categorised into two groups; 24 articles into the case-control studies group and 15 into the intervention group (Figure 1, PRISMA Flow Diagram).

3.1. Systematic Review and Meta-Analysis 1

Of the 24 articles identified for meta-analysis 1, 15 were included in the meta-analysis. Reasons for exclusion were: not a case-control design [58,59], inappropriate control [25], the data not reported in a form suitable for analysis [26,60,61,62], and double-reporting [63,64]. Characteristics of included studies can be found in Table 1.
The majority of studies were conducted in the Middle East (n = 5; 2 Saudi Arabia (from one study group), 1 Oman, 2 Egypt) and Europe (n = 4; 2 UK, 1 Belgium, 1 Italy), with others conducted in the US (n = 2), Latin America (n = 1), Canada (n = 1), Asia (Japan, n = 1), and Australia (n = 1).
The 15 studies included 623 children and young people with ASD and 570 controls. Most studies included children under the age of 12, while a few included teenagers and adults also (n = 3) [24,49,53]. One study included adults up to age 22 years [49]. Cases and controls were matched on both age and sex (n = 8), two of which included other attributes such as IQ, home environment and dietary intake (n = 1) or geographical region (n = 1). Others matched two groups on either age (n = 3) or sex (n = 1), and one study included only males. Matching of cases and controls was not reported in two studies. In those studies including both sexes and reporting the sex distribution, the male/female ratio ranged from 2/1 to 12/1.
Most studies did not report the fasting state of blood samples while one study analysed non-fasting blood samples, and five studies fasting blood sample (ranging from 2 h to overnight fasting) [28,49,50,51,65]. Fasting state is considered to affect fatty acid composition measured in plasma/serum but not in RBC [21,45]. While most studies reported serum/plasma fatty acid composition, four studies reported RBC levels [24,28,52,66] and two reported both [27,51]. Most studies reported relative levels while five studies reported absolute levels (all from the Middle East) [26,30,50,65,67], and one both levels [53]. Sensitivity analysis showed no impact of blood tissue type and the way by which fatty acid composition is expressed on the heterogeneity. However, the way by which fatty acid composition is expressed affected the overall effect size for some measures (Refer to the next section).
The majority of studies reported DHA, EPA and ARA levels while two studies did not report levels of EPA [26,67], and one ARA [67]. Five studies reported both total n-3 LCPUFA and total n-6 LCPUFA levels. One study did not report either of the mentioned measures but the ratio of ARA to DHA and ARA to EPA [50]. Total n-6/n-3 LCPUFA ratio was reported in six studies, of which two reported ARA/EPA ratio [27,52], and one reported both ARA/EPA and ARA/DHA also [51]. Of the remaining studies, two reported the ratio of ARA/EPA [28,66] and ARA/DHA each [26,30], one both [53], and three no ratios [65,67,68]. Reverse ratios and SDs were calculated in five studies ([50] (only the ARA to EPA) and [49,51,52,53]). With the exception of one study [50] (refer to the next section), sensitivity analysis showed no impact of calculation on the overall results.
All studies included in the review scored between four and nine points out of a possible 11 in our quality assessment tool, with three studies scoring ≤ 6 [24,66,67] (Table S2). It should be noted that the maximum score for the “Health Canada Quality Appraisal Tools for Observational Studies” is 12 [47] but because “measuring the exposure in duplicate or more” is of no relevance for case-control studies and all studies received a score of “0” for this criterion, the maximum score adds up to 11 for this review. Studies with scores of ≥7 are considered having higher quality. Sensitivity analysis showed no impact of removing studies with a quality score ≤6 on the heterogeneity or overall results.
The quality criteria failed by most studies were attrition and the reasons for attrition. Although attrition is not important for case-control studies, it could be of relevance to ASD clinical studies. Drop out of some populations with particular characteristics such as high anxiety levels or sensory issues (a distinct criterion under RRB domain in ASD diagnosis [6]) that are associated with fear of blood test and consequently inability to obtain a blood sample or withdrawal from a study could affect the external validity of a study. The most prevalent confounding factors that were not controlled for in statistical analysis were dietary intake of LCPUFA and medication use. No conflict of interest that may have affected study outcomes was apparent in any study.

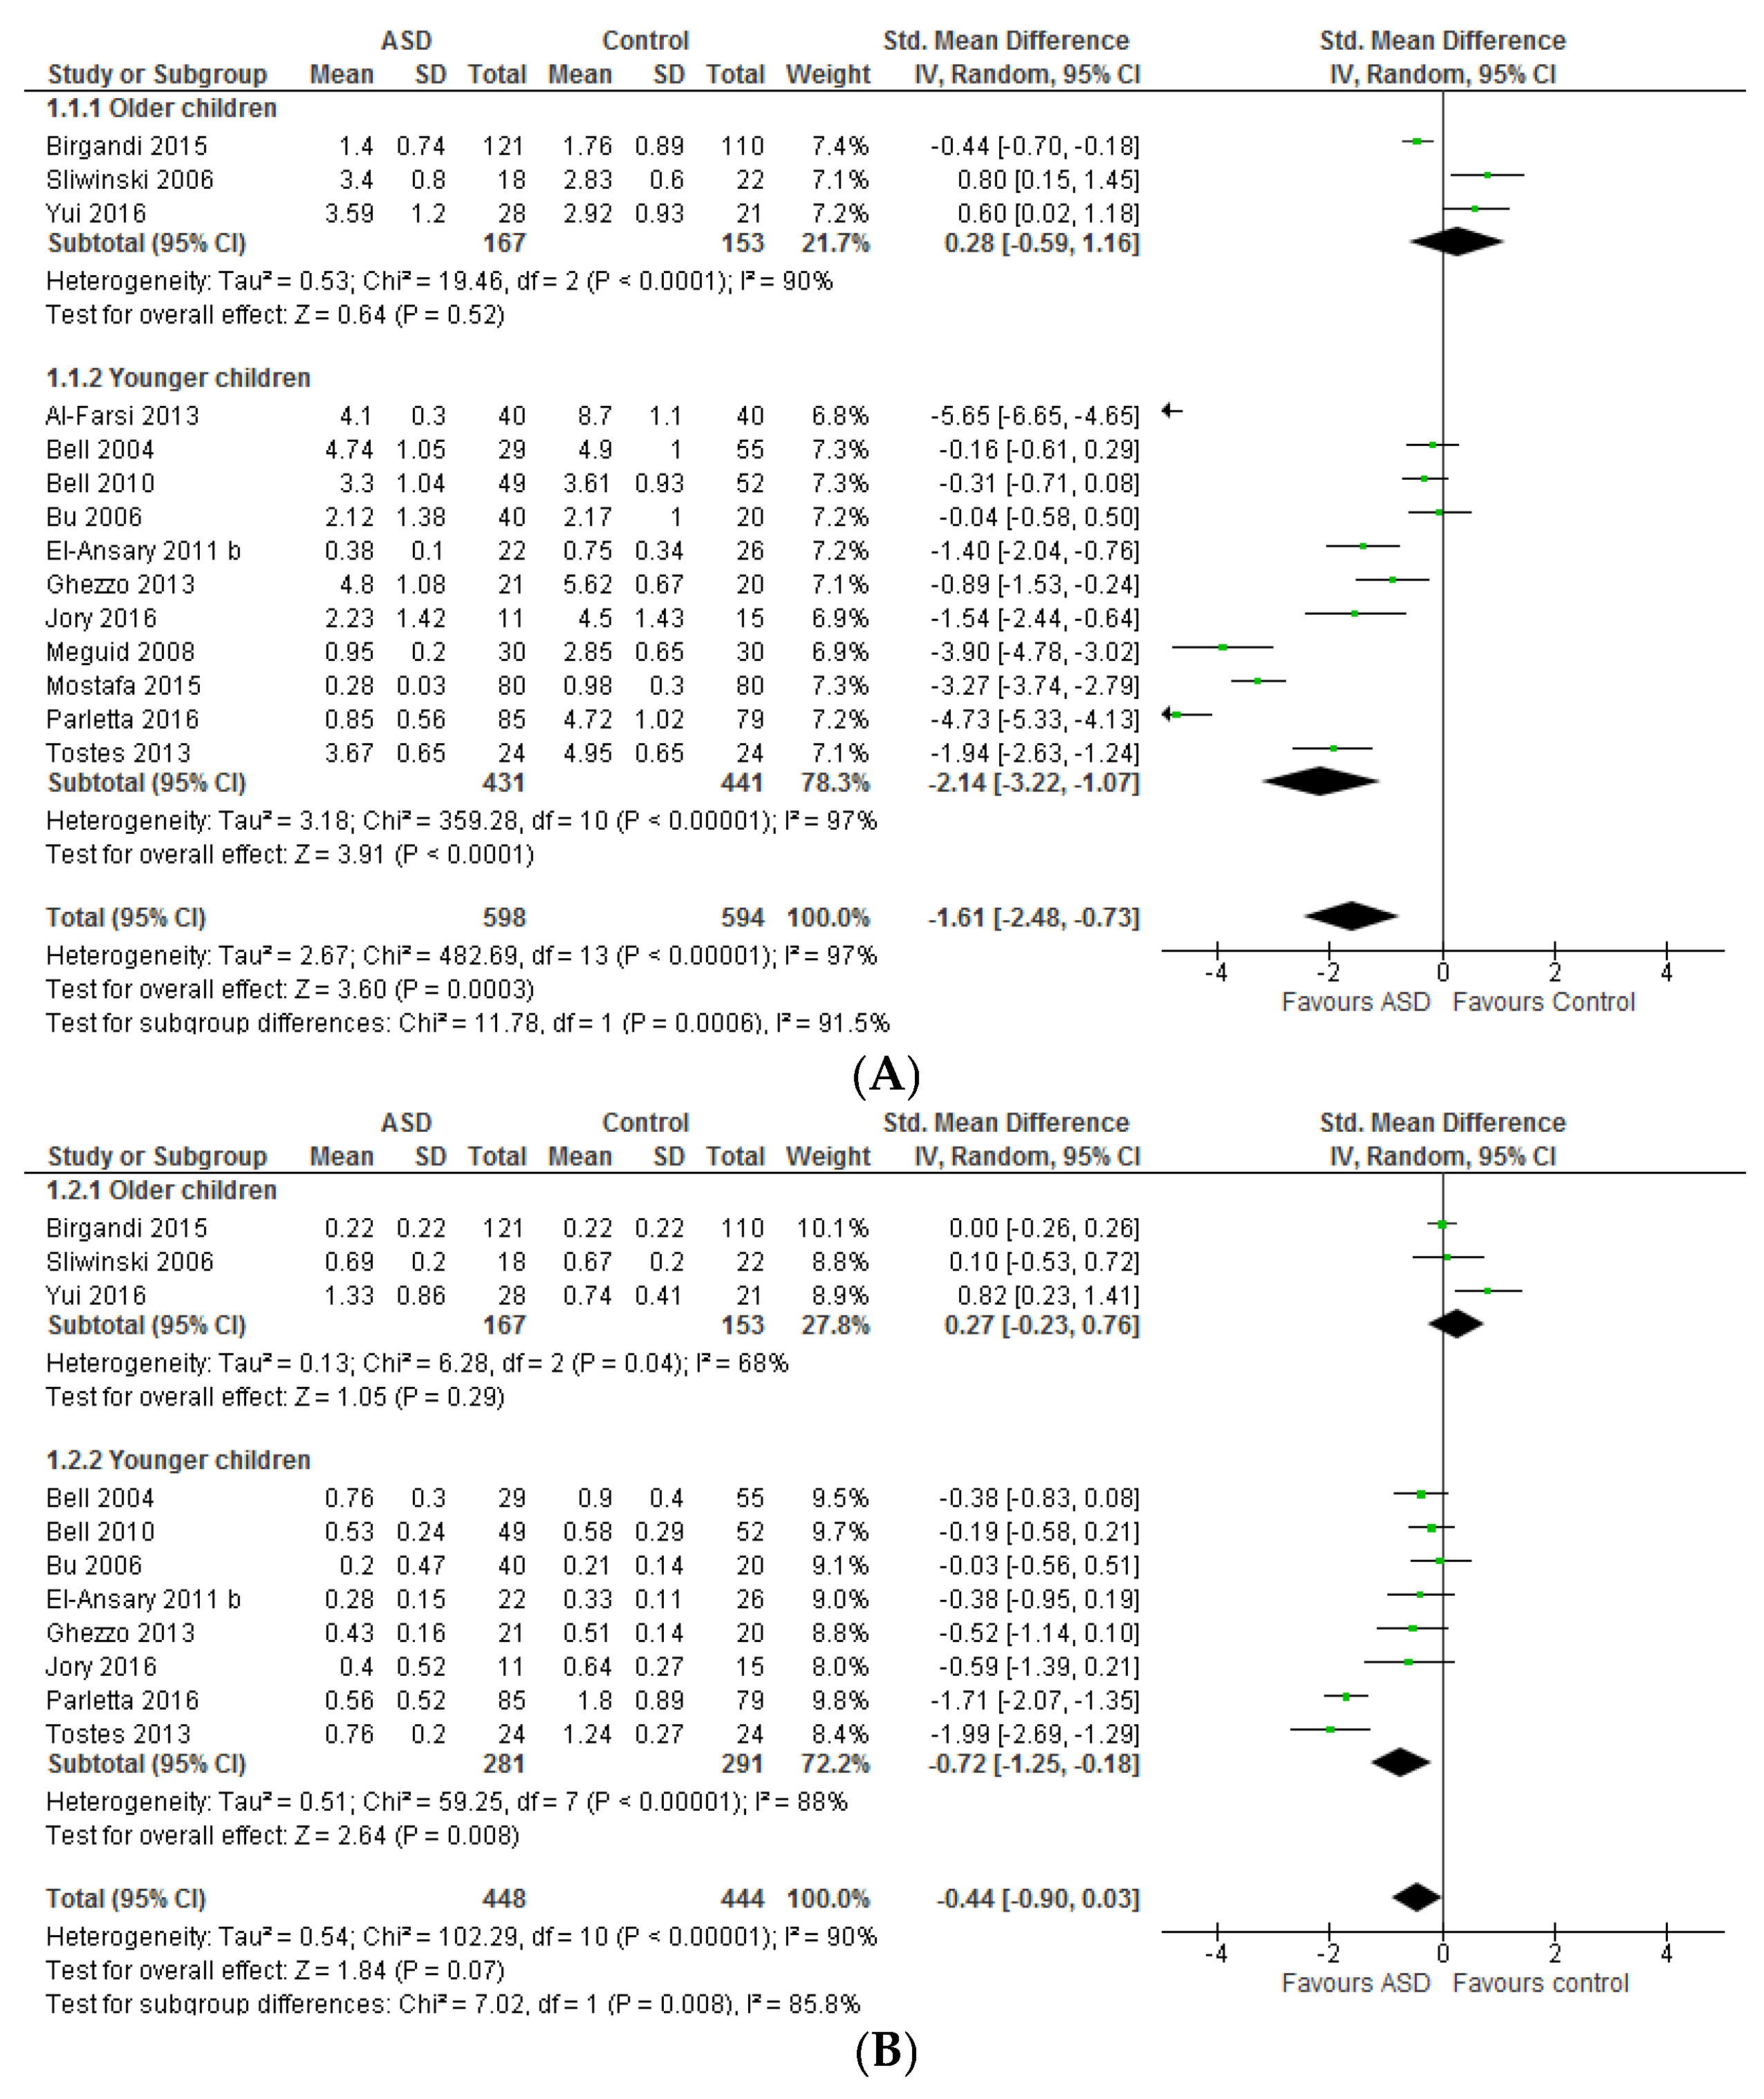
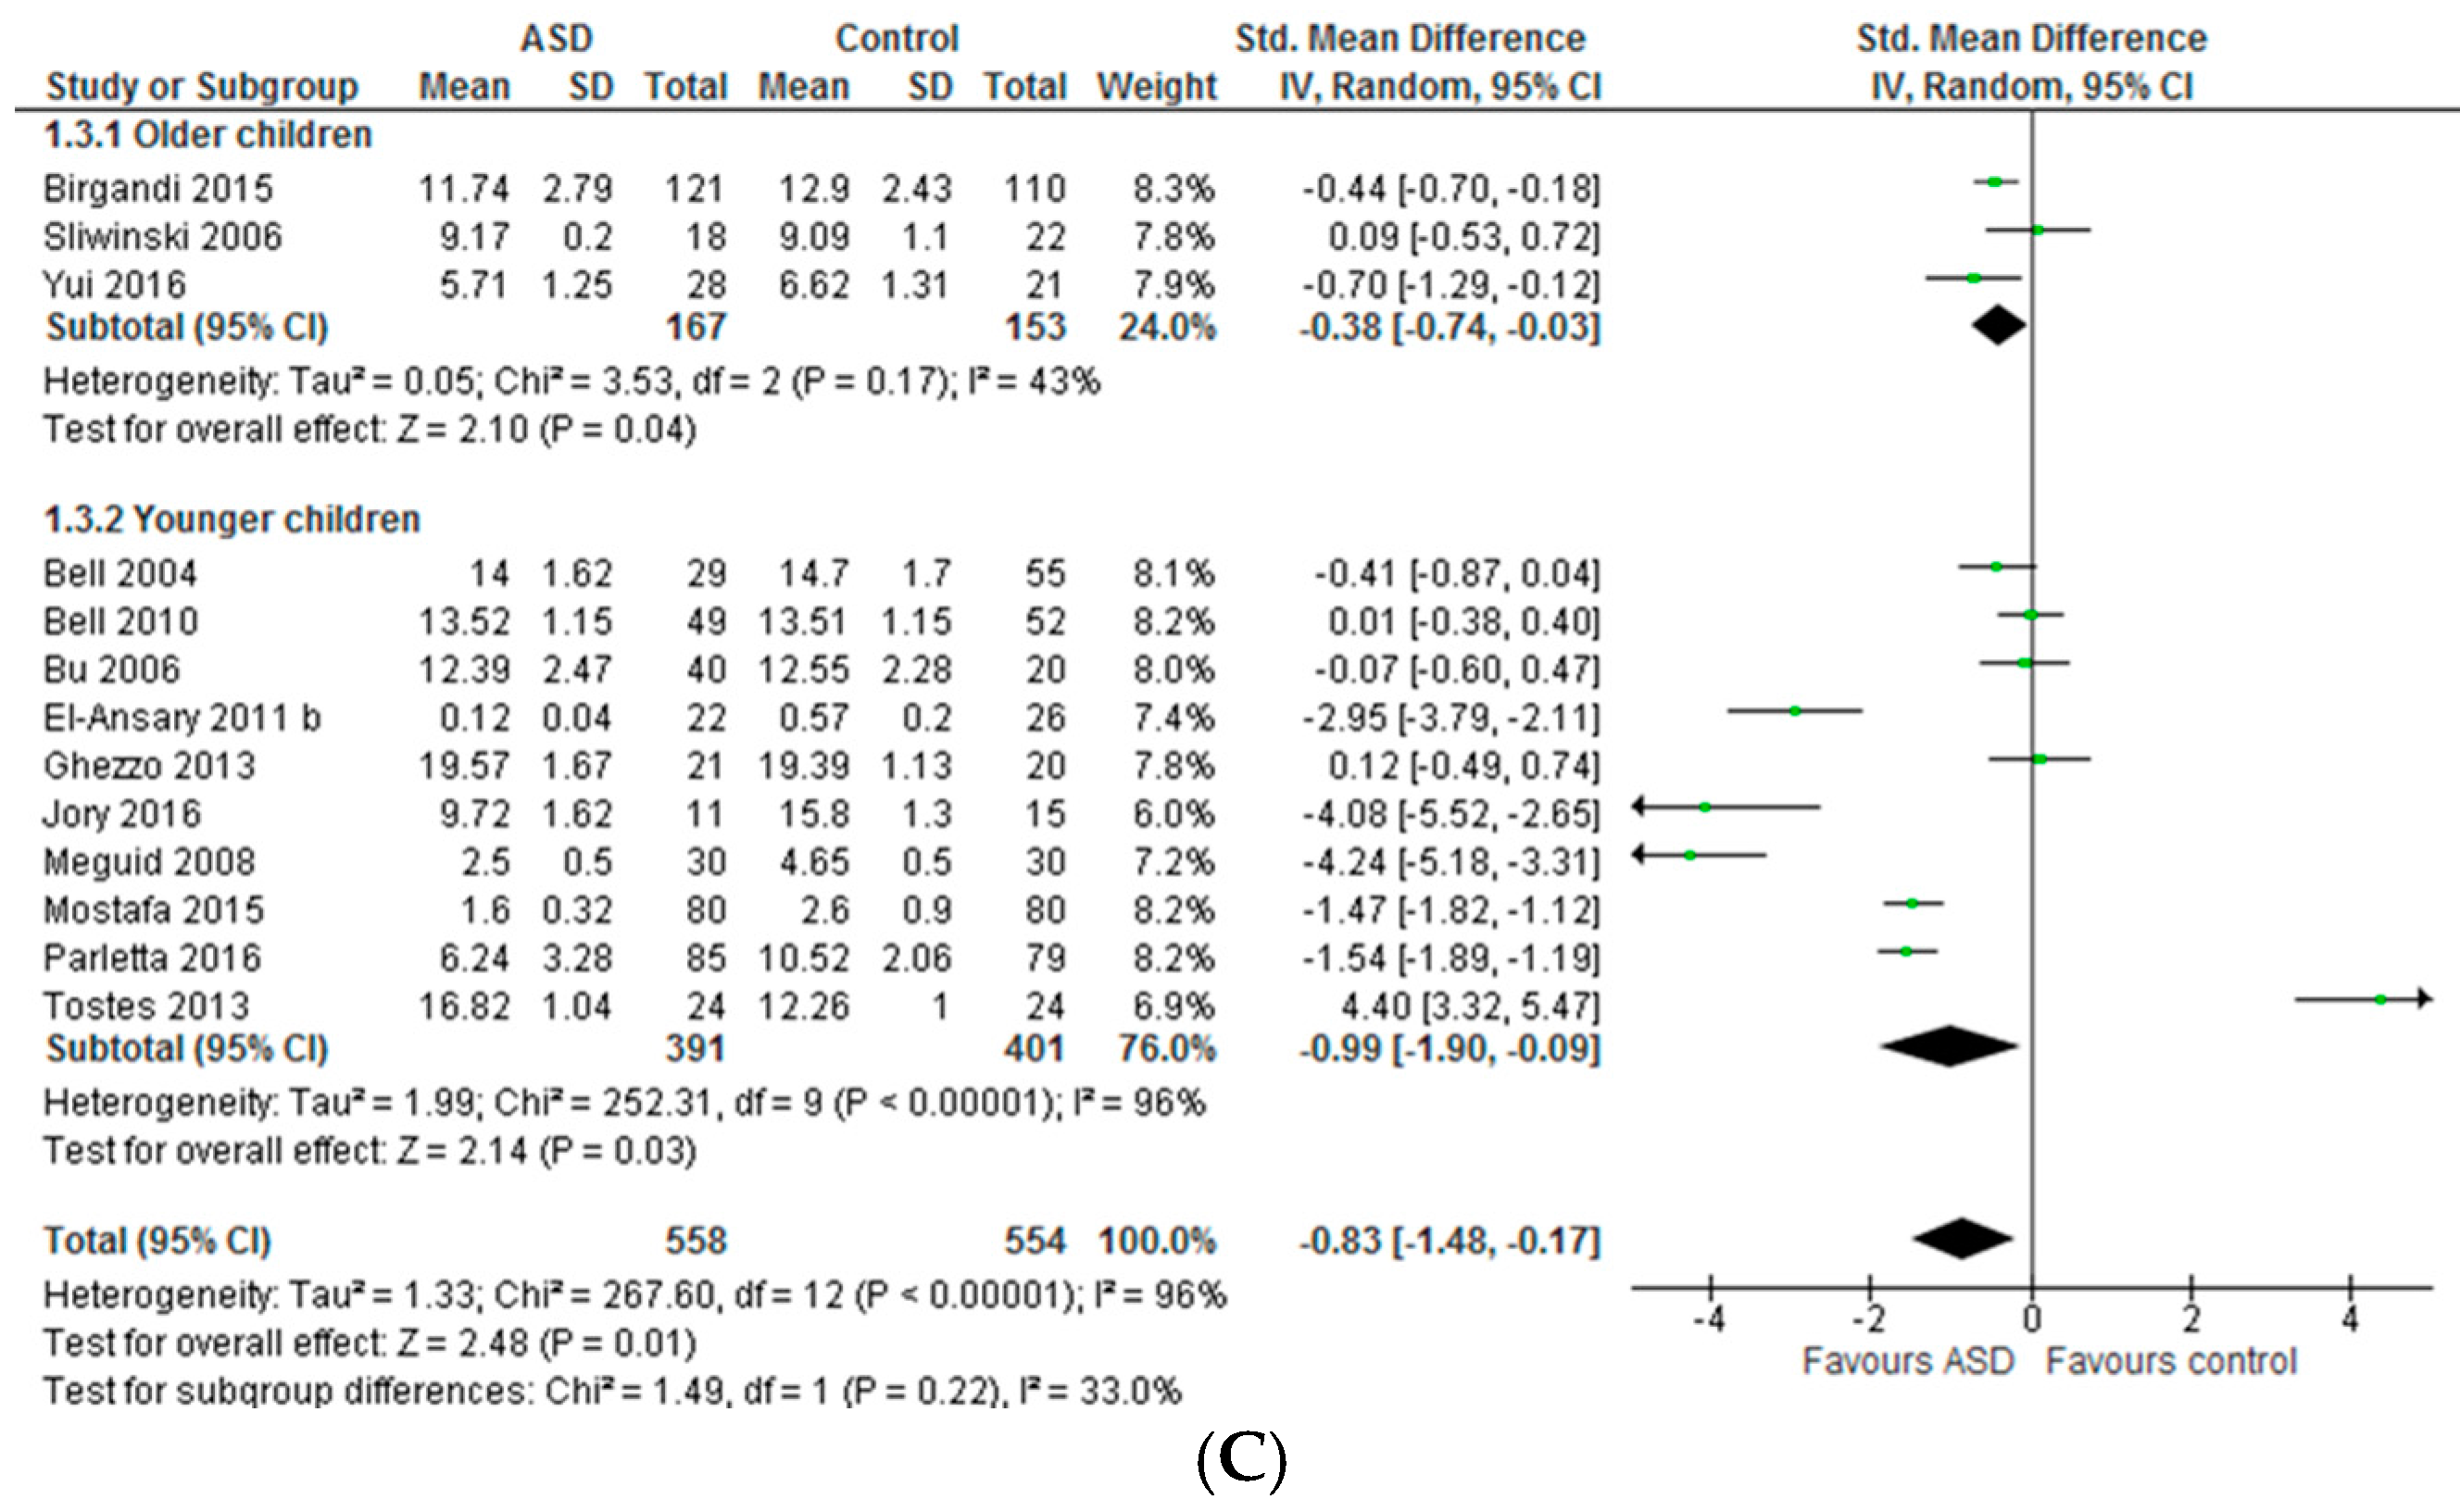
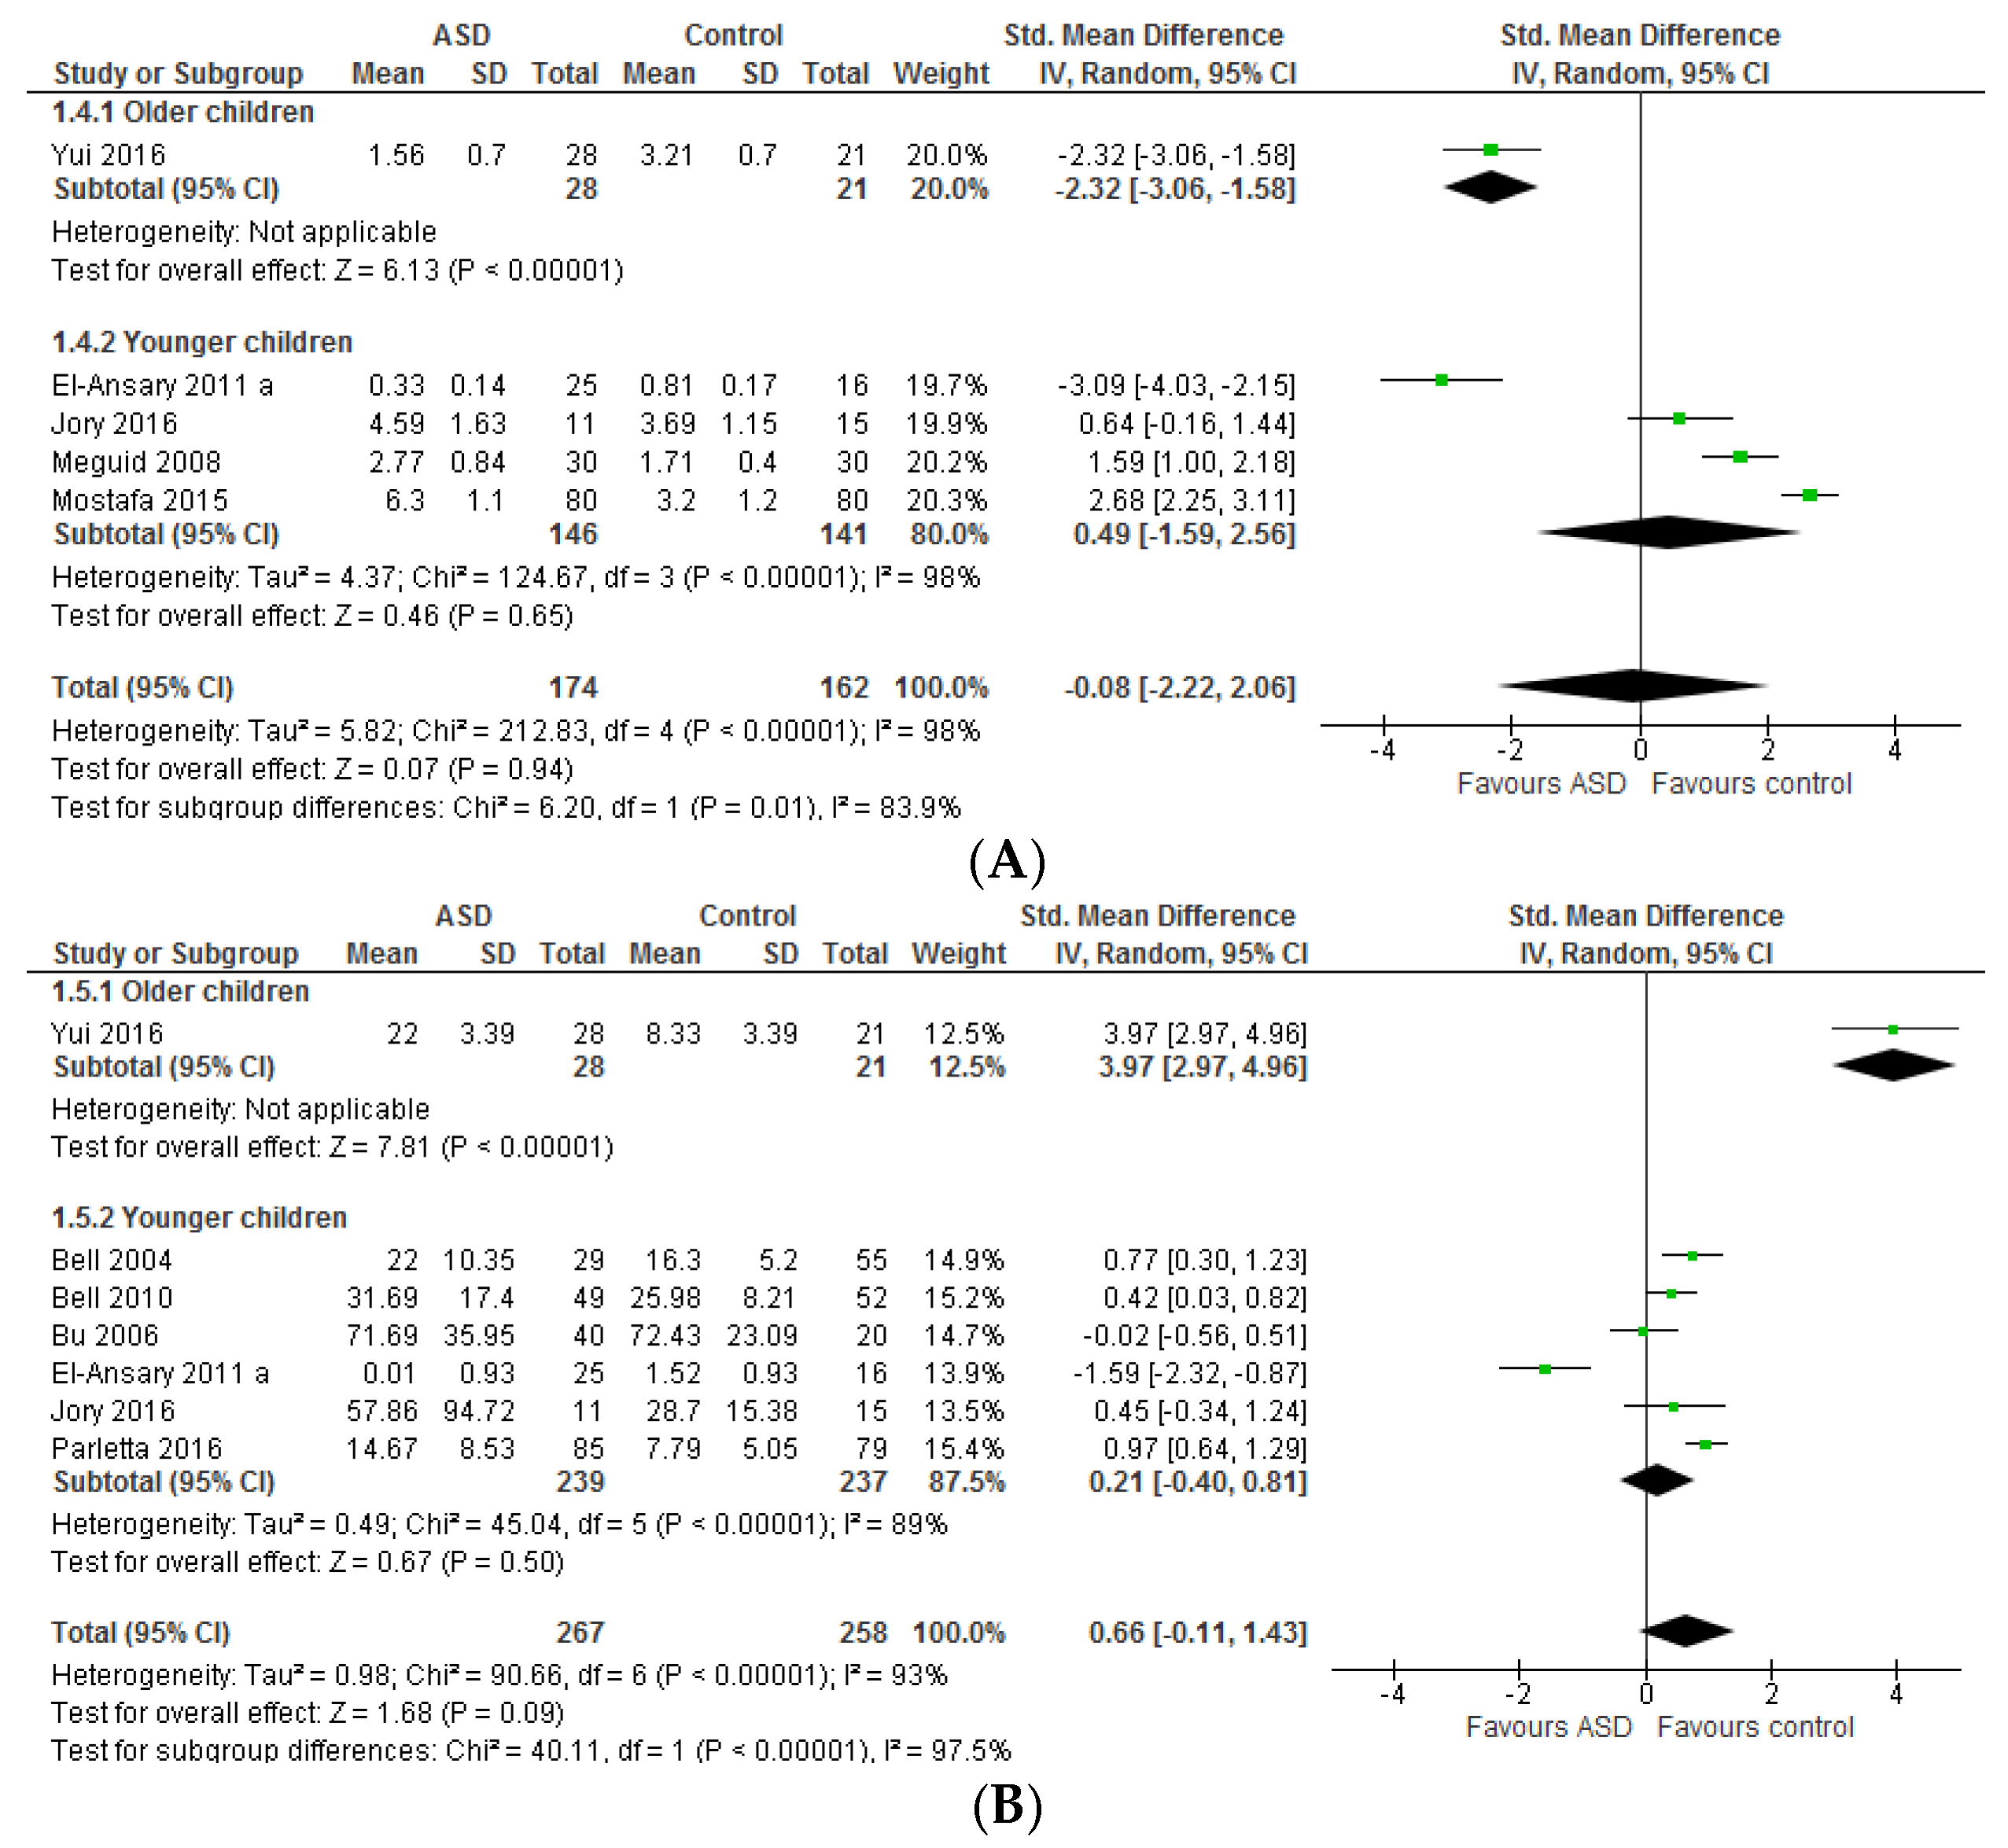
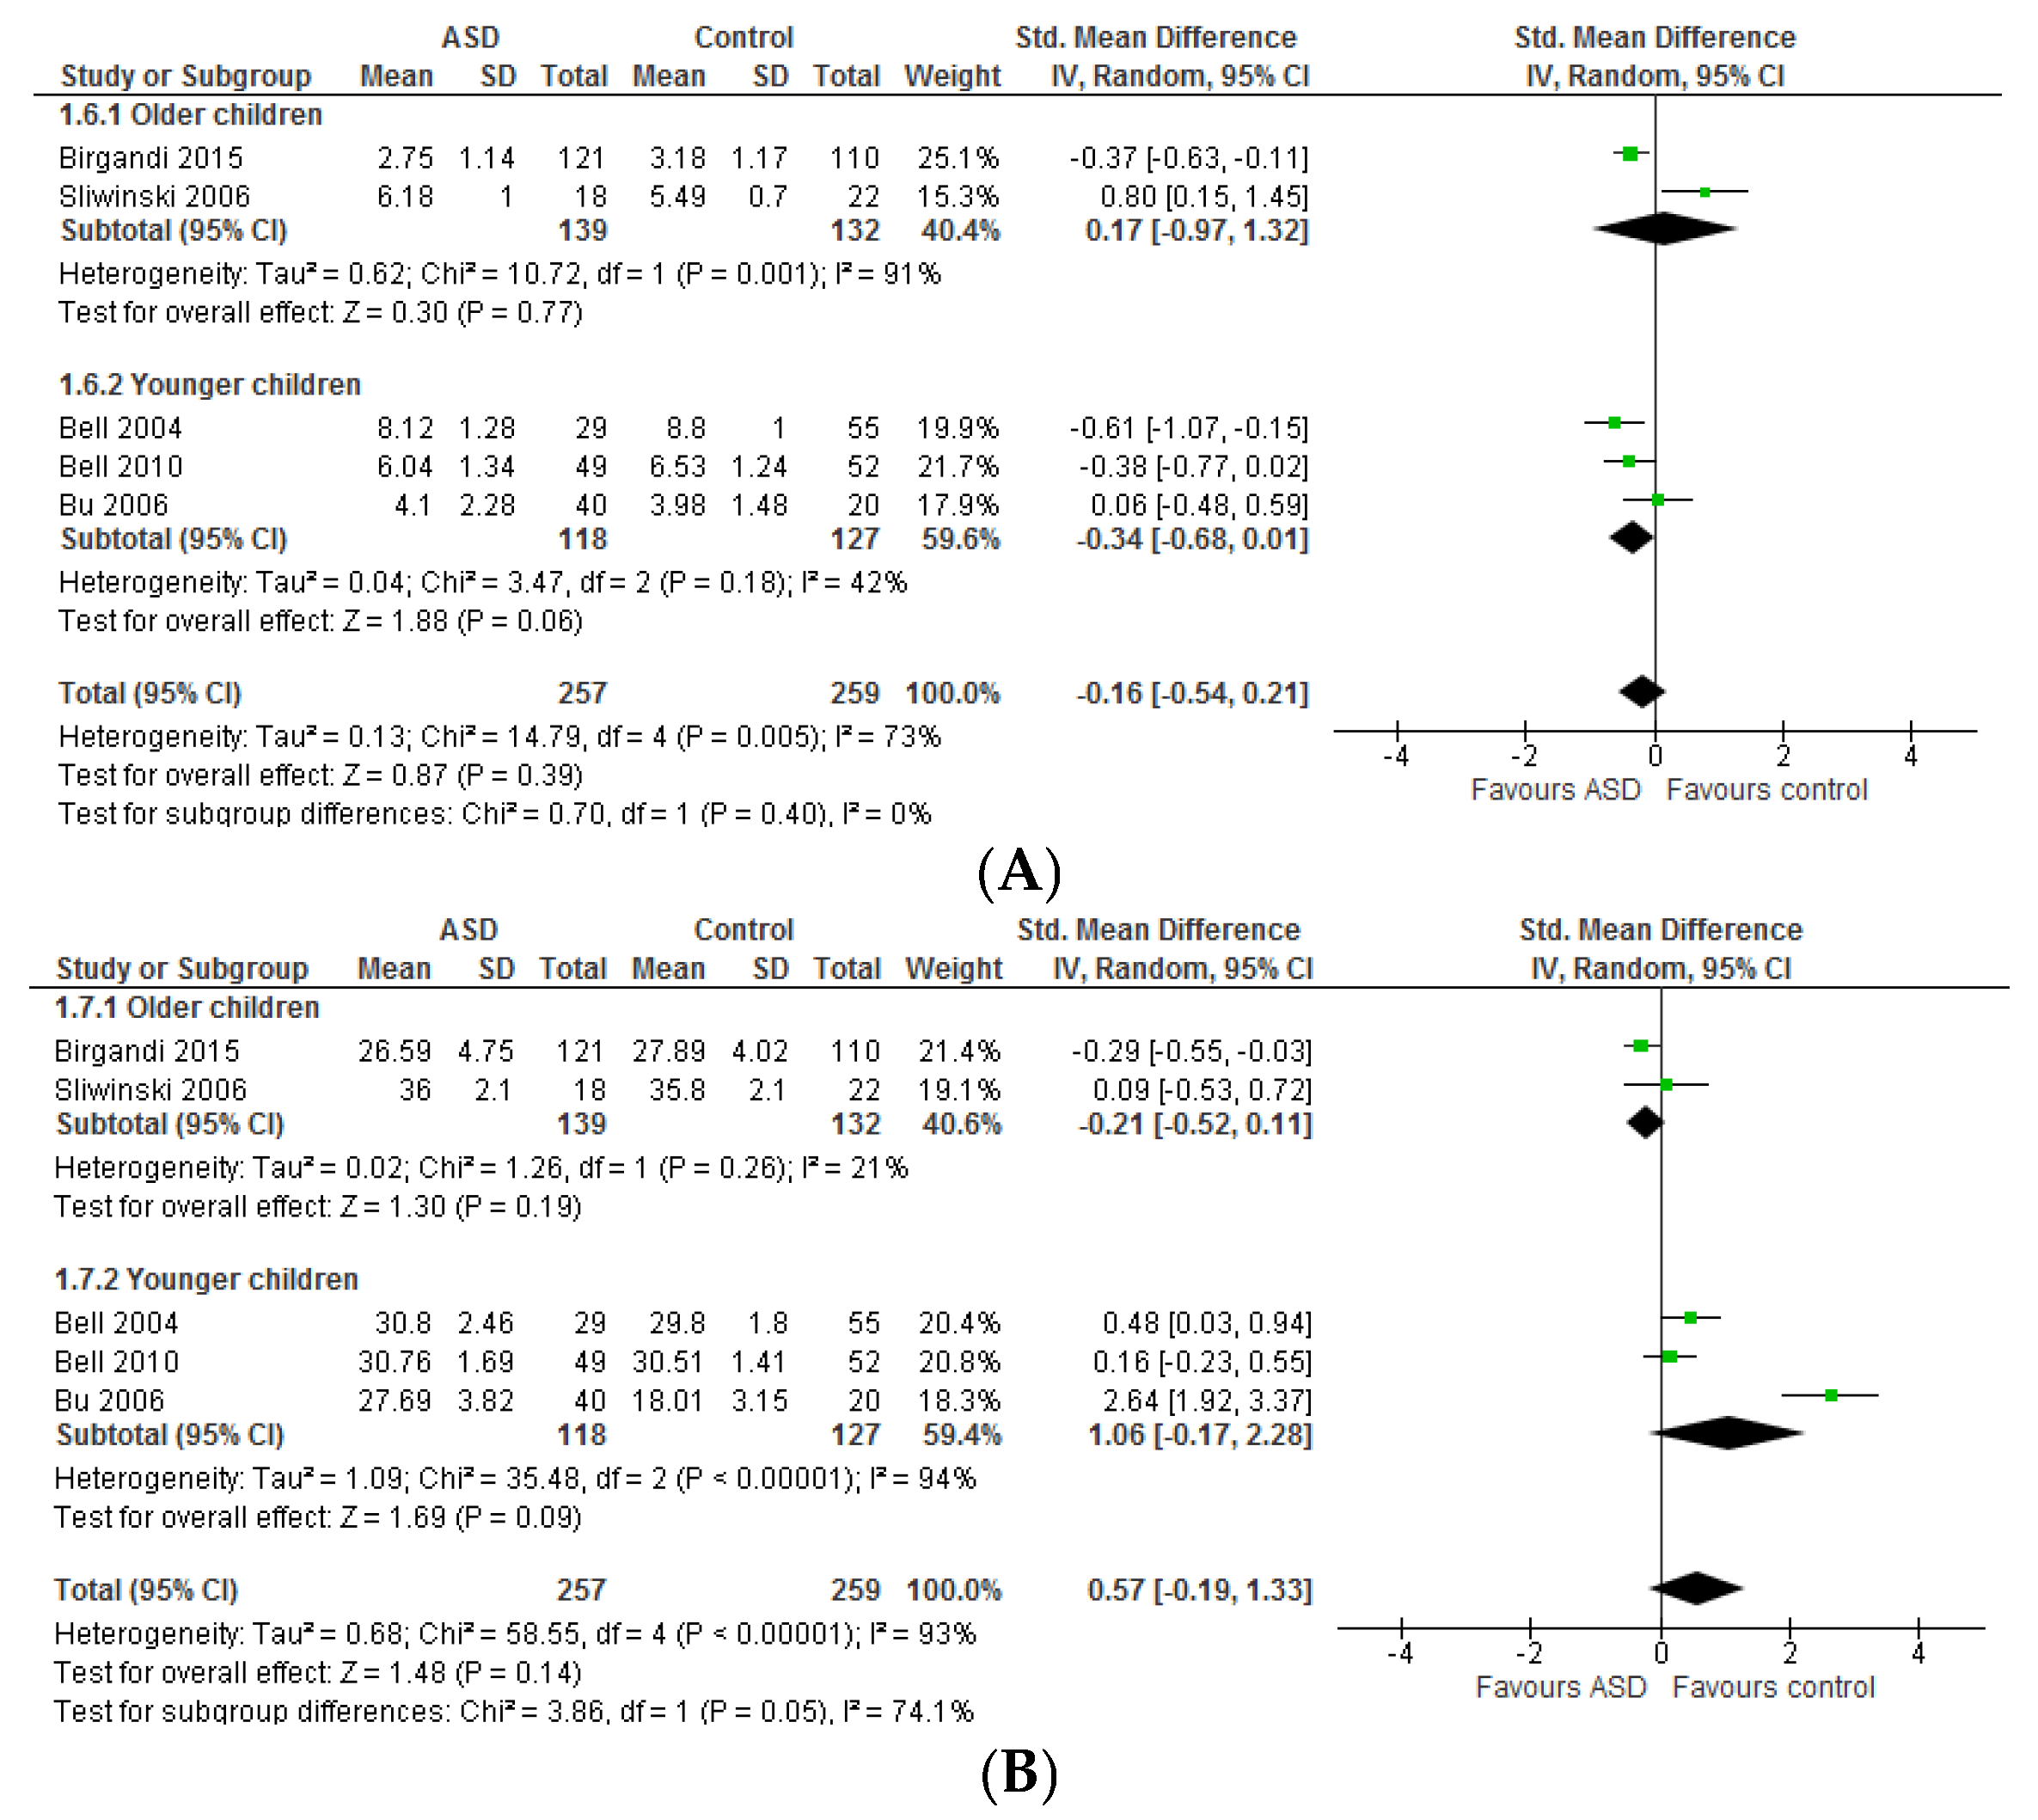
3.1.1. Individual n-3 LCPUFA (DHA, EPA, and ARA) and Their Ratios (ARA to DHA and ARA to EPA)

Significant differences were seen between those studies that recruited children only vs. those that also included teenagers and adults for blood levels of DHA and EPA (Chi2 = 11.78, p = 0.0006 and Chi2 = 7.02, p = 0.008, respectively) but not ARA (Chi2 = 1.49, p = 0.22) (Figure 2). Hence results for DHA and EPA for these subgroups were described separately. For ARA, the results described are from all studies combined.
Overall, in the younger age group studies, ASD children had significantly lower DHA and EPA levels than typically developing controls (standardised mean difference (95% CI) −2.14 [−3.22, −1.07], Z = 3.91, p < 0.0001 and −0.72 [−1.25, −0.18], Z = 2.64, p = 0.008, respectively). Considerable heterogeneity was seen for DHA (I2 = 97%, p < 0.00001) and EPA (I2 = 88%, p < 0.00001). Heterogeneity for DHA was not altered by removing any studies. Heterogeneity for EPA reduced slightly by removing the Parletta, 2016 study [52] (I2 = 74%, p = 0.0008). Removal of this study together with the Tostes, 2013 study [68] significantly reduced heterogeneity for EPA (I2 = 0%, p = 0.78) that was accompanied by a reduction in the difference between cases and controls (−0.30 [−0.51, −0.08], Z = 2.73, p = 0.006, n = 356). These two studies were different with respect to some characteristics that may affect outcomes compared to other studies; children with ASD were significantly younger than typically developing children in the Parletta, 2016 study [52], and 88% of children with ASD in the Tostes, 2013 study were on psychotropic drugs [68].
In studies including all age groups (children, teenagers, and adults), no significant differences were seen in DHA and EPA levels between cases and controls (0.28 [−0.59, 1.16] and 0.27 [−0.23, 0.76], respectively). Heterogeneity for DHA and EPA was substantial (I2 = 90%, p = 0.0001 and I2 = 68%, p = 0.04, respectively). Removal of the Brigandi, 2015 study [24] reduced the heterogeneity significantly for DHA (I2 = 0%, p = 0.65) and slightly for EPA (I2 = 64%, p = 0.10). Removal of this study resulted in children with ASD having significantly higher DHA (0.69 [0.26, 1.12], Z = 3.13, p = 0.002, n = 89) levels than typically developing controls but no impact on EPA. The Brigandi, 2015 study [24] was different from the other two studies in this subgroup in that both classic and regressive type ASD were included, cases and controls were not matched by any attributes, intellectual functioning of patients was not considered, and this study had a low quality appraisal score. The Sliwinski, 2006 [49] and Yui, 2016 [53] studies included ASD patients with a borderline or normal intellectual functioning (IQ > 70). The results should be interpreted with caution because the number of studies included is small (n = 3).
With regard to ARA, children with ASD had significantly lower ARA levels than typically developing controls (−0.83 [−1.48, −0.17], Z = 2.48, p = 0.01), but heterogeneity between studies was substantial (I2 = 96%, p = 0.00001). Heterogeneity was not reduced by excluding any single study. However, removing studies that reported absolute levels [26,30,65] resulted in a smaller overall effect estimate (−0.24 [−0.88, 0.41], Z = 0.71, p = 0.48, n = 840).
Only one study that included all age groups (children, teenagers, and adults) reported either ARA/DHA or ARA/EPA [53] thus the combined results of older and younger children are described (Figure 3). The ratio of ARA/DHA and ARA/EPA did not differ significantly between ASD populations and typically developing controls (p = 0.94 and p = 0.09, respectively). The heterogeneity was considerably high for both ratios. Heterogeneity was not reduced by excluding any studies (both ARA/DHA and ARA/EPA). With regard to ARA/EPA, however, the overall effect estimate changed considerably by the removal of El-Ansary, 2011a study [50] (0.99 [0.32, 1.67], Z = 2.88, p = 0.004, I2 = 91%). Cases and controls were not matched on sex in this study, the reverse ratio and SD was calculated, and the absolute level was reported.

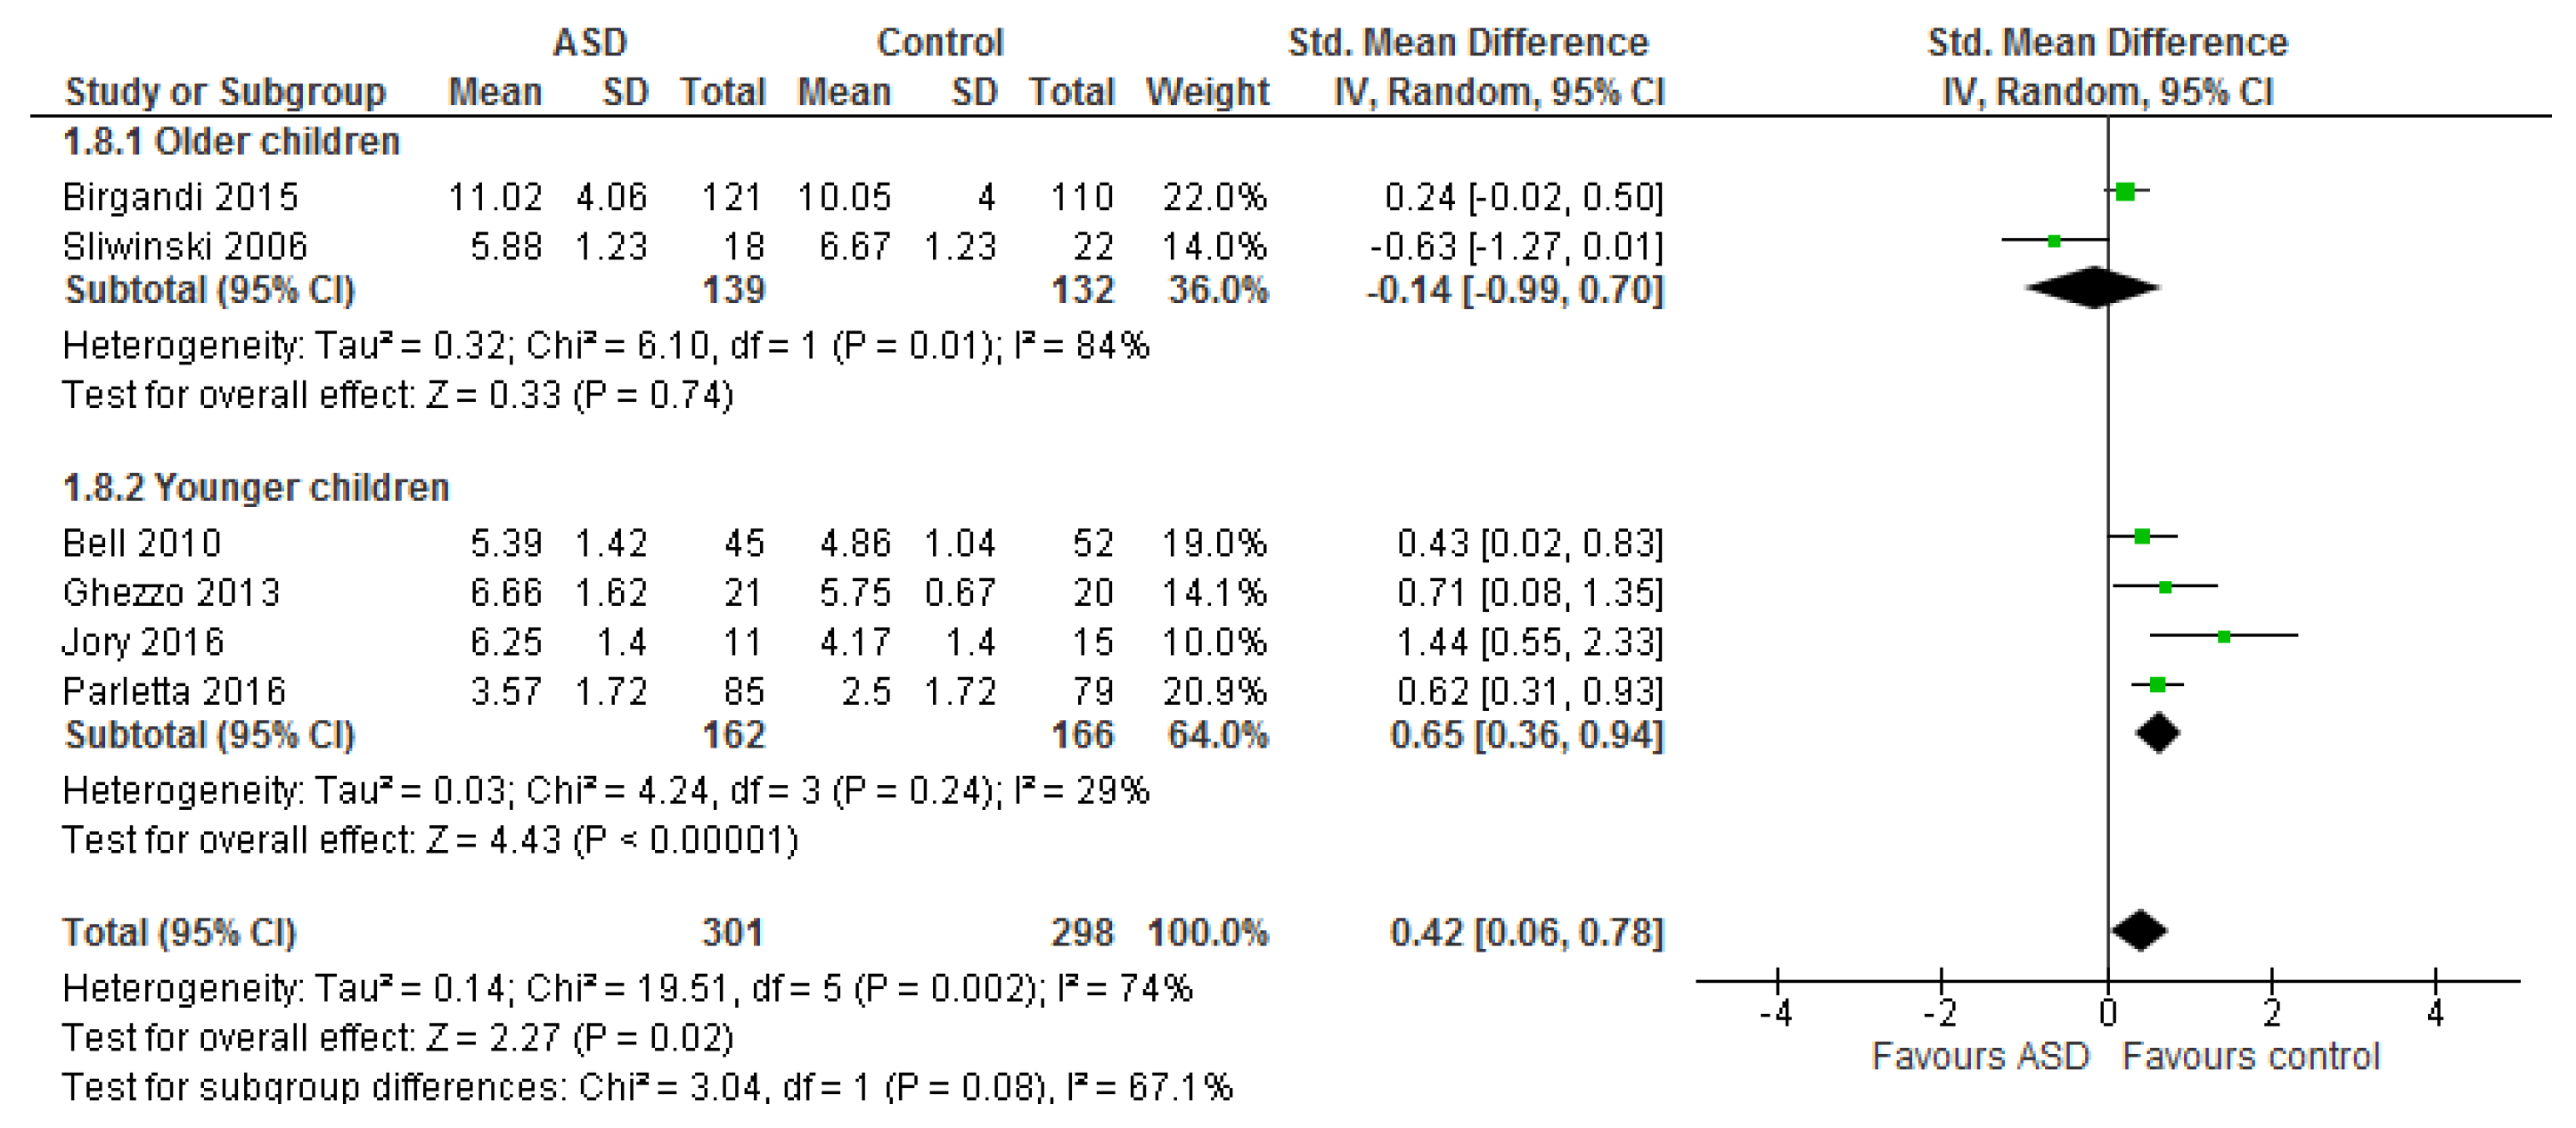
3.1.2. Total n-3 and n-6 LCPUFA and Their Ratios

No significant differences were observed in total n-3 and n-6 LCPUFA between studies including young children only and those including all age groups (children, teenagers, and adults) (Chi2 = 0.70, p = 0.40 and Chi2 = 3.84, p = 0.05, respectively) thus the results for the combined groups are described (Figure 4).
The pooled standard mean differences for the total n-3 LCPUFA and total n-6 LCPUFA between ASD and typically developing children were −0.16 [−0.54, 0.21] (I2 = 73%, substantial heterogeneity) and 0.57 [−0.19, 1.33] (I2 = 93%, considerable heterogeneity), respectively. Both were not statistically significant. Excluding comparisons that included teenagers and adults also [24,49] reduced heterogeneity in total n-3 LCPUA (I2 = 42%, p = 0.18) (−0.34 [−0.68, 0.01], Z = 1.88, p = 0.06, n = 245). Heterogeneity was reduced to an acceptable level when the Sliwinski, 2006 study [49] only was removed (I2 = 14%, p = 0.32) (−0.36 [−0.56, −0.15], Z = 3.40, p = 0.0007, n = 472). The Sliwinski, 2006 study [49] was different from other studies with respect to several characteristics; it included post pubertal youngsters up to age 22 years, it was a male-only study, and included those with an IQ > 55. Heterogeneity in total n-6 LCPUFA was not altered by the removal of any studies.
The ratio of total n-6 LCPUFA to n-3 LCPUFA did not differ significantly between studies including young children only and those including all age groups (children, teenagers, and adults) (Chi2 = 3.04, p = 0.08) thus the overall results are described here (Figure 5). Children with ASD had a significantly higher n-6 LCPUFA to n-3 LCPUFA ratio (0.42 [0.06, 0.78], Z = 2.27, p = 0.02). The heterogeneity was substantial and was decreased by the exclusion of comparisons that also included teenagers and adults [24,49] (I2 = 29%, p = 0.24). The difference between cases and controls as well as the effect size increased considerably, 0.65 [0.36, 0.94], Z = 4.43, p < 0.00001, n = 328.
The funnel plots for DHA and ARA, indicated publication bias with a lack of smaller studies [studies with larger standard errors (SEs)] reporting negative results. Examination of funnel plot for EPA indicated no evidence of publication bias.

3.2. Systematic Review and Meta-Analysis 2

Of the 15 RCTs identified for systematic review and meta-analysis 2, four were included in the meta-analysis [36,54,69,70], two were included in the overall interpretation but not included in the meta-analysis [37,55], one was a double-reporting of one outcome [54] and reporting other outcomes from the same group of participants [57], and eight were excluded (Figure 1). Reasons for not being included in the meta-analysis 2 but being included in the overall interpretation were: data not reported in a format suitable for analysis [55], and use of an assessment tool not used by others [37]. Reasons for complete exclusion were: a conference paper with unpublished results at the time of writing this review [56], one open label randomised parallel intervention trial including a low sugar healthy diet as the control [29], and not being a RCT (n = 6, one case-study and 5 open label trials [30,31,32,33,34,35]). Characteristics of included studies can be found in Table 2 and of excluded studies in Table S1.
Of those included in the meta-analysis 2, two were conducted in the US [69,70], one in Austria [36], and one in Japan [54]. In the four studies, 55 participants with ASD received n-3 LCPUFA supplements and 52 received placebo. The Bent, 2011 and 2014 studies included children under the age of 8 years [69,70], the Amminger, 2007 study included children under 17 years [36], and the Yui, 2011 study included children older than 6 years and adults up to 28 years [54].
Of the two studies that could not be included in the meta-analysis, one study was from the US [55] and one from Canada [37] together including 37 and 34 individuals in the intervention and placebo groups, respectively. Children under the age of 5 and 10 years were included in the Mankad, 2015 and Voigt, 2014 studies, respectively [37,55].
All but one (the Amminger, 2007 study included only males [36]) included both males and females. Study groups were not matched on sex in these trials. The male to female ratio ranged from 3/1 to 12/1.
Of the RCTs included in the meta-analysis 2, the severity of autism at baseline was not considered in two trials [36,70], and the other two included patients with pre-defined severity (moderate severity and ABC social withdrawal subscale of >10 in the Bent, 2011 and Yui, 2011 studies, respectively) and IQ level (>50 and >80 in the Bent, 2011 and Yui, 2011 studies, respectively [54,69]). Of those included in the overall interpretation, the Voigt, 2014 study included patients with pre-defined severity (CARS score of >30 [55] and the Mankad, 2015 study equally distributed the severity across groups [37]. Co-existing problem behaviour was an inclusion criteria in two trials entered the meta-analysis 2 (hyperactivity in the Amminger, 2007 [36] and Bent, 2014 studies [70]).
Study length ranged from 6–16 weeks in RCTs included in the meta-analysis 2 and was 26 weeks in RCTs included in the overall interpretation. The majority of participants were supplemented with both EPA and DHA. The Yui, study (2011 and 2012) [54,57] used a combination of DHA and AA and the Voigt, 2014 study used only DHA [55]. Intake of EPA and DHA ranged from 0.70 to 0.84 g/day and 0.24 to 0.70 g/day, respectively, with the Yui, 2011 (and 2012) and Voigt, 2014 studies having the lowest DHA dose [54,55,57]. The Mankad, 2015 study reported an initial total dose of EPA and DHA of 0.75 g/day for two weeks which was doubled when tolerability to that dose was determined [37]. Placebos used were olive oil [37,54,57], safflower oil [69,70], corn oil + soybean oil [55], and coconut oil [36].
Behaviours were assessed using a variety of assessment tools (ranging from one to six tools used in each study) including, Aberrant Behaviour Checklist (ABC) ([36,54,55,69,70] but the outcome was not reported), Social Responsiveness Scale (SRS) [57,69,70], Behaviour Assessment System for Children (BASC) [37,55,69], Clinical Global Impression (CGI) [37,55,69,70], and further several tools that were used in isolation. Of these, full data was available for only four studies using the same assessment tool (ABC) [36,54,69,70].
All studies included in the review were of good quality, scoring 11–14 points out of a possible 15 (Table S3). Studies with scores of >7 are considered as having higher quality.
The quality criteria failed by most studies were whether intention-to-treat or per-protocol analysis was conducted (though according to final sample size analysed—larger than the sample size with drop outs deducted—it was apparent that the majority employed intention-to-treat analysis), and controlling for potential confounders. The most prevalent potential confounding factors that were not reported or reported but not considered in statistical analysis were dietary intake of LCPUFA or baseline LCPUFA status (as a measure of LCPUFA status, either dietary intake or blood level of LCPUFA needs to be reported).With the exception of the Bent, 2011 study [69] which investigated the impact of baseline LCPUFA status on behavioural changes in response to supplementation, the majority of studies failed to examine such a relationship while assessing baseline LCPUFA status [37,54,55,57]. Further factors were compliance (not reported in most studies) and medical regimen (most studies recruited patients on a stable medical regimen but did not report the type of regimen and its distribution across groups). It is also worth noting that a small number of females were included in these studies (with a male/female ratio ranging from 1/3 to 1/12) which could be a limitation in terms of generalisability, though reflecting the gender distribution of ASD.
The risk of bias for each study is summarized in Figure S1. Participants in the Amminger, 2007 and Yui 2011 (and 2012) studies were reported to be randomised but no details were available for random sequence generation [36,54,57]. Other studies used computer generated number [69,70] and block randomisation stratified by attributes including severity [37] and sex [55]. With the exception of the Amminger, 2007 study [36], randomisation was prepared by a third party in all trials [37,54,55,57,69,70]. The Amminger, 2007 provided no details regarding who performed the randomization [36]. All studies were reported as double-blinded (both researchers/assessors and participants) [37,54,55,57,69,70]. However, in the Amminger, 2007 study it is unclear if the researchers/assessors were blinded [36]. It is also unclear when researchers/assessors and participants were unblinded in the Amminger, 2007, Yui, 2011 (and 2012), and Mankad, 2015 studies [36,37,54,57]. The blinding was kept for the entire study (including data analyses) in the Bent, 2011, Bent 2014, and Voigt, 2014 studies [55,69,70]. With the exception of the Yui, 2011 (and 2012, no drop outs) [54,57] and Bent, 2014 (all included in the final analyses) [70] studies, participants were lost to follow up in the Amminger, 2007 (one individual from control) [36], Mankad, 2015 (one individual from n-3 LCPUFA group) [37], Bent 2011 (two individuals; one from each arm) [69], and Voigt, 2014 (five from n-3 LCPUFA and nine from control) [55] studies. The reason for drop outs in the Voigt, 2014 study were difficulty with participation (four from n-3 LCPUFA and three from control), trouble taking the supplements (one from n-3 LCPUFA and three from control), and concerns about supplement side effects (three from control) [55]. Regarding the latter concern, it is not clear if participants withdrew due to worsening behaviour, not observing any improvement, or because of an actual side effect during the intervention. With the exception of the Voigt, 2014 study [55], all outcomes in all trials were reported. The Voigt, 2014 study examined 52 behavioural subscales but only three outcomes were reported [55]. It is worth noting that the primary outcome was the measure of CGI which was completely reported. Other sources of bias including commercial bias were not apparent in any study.

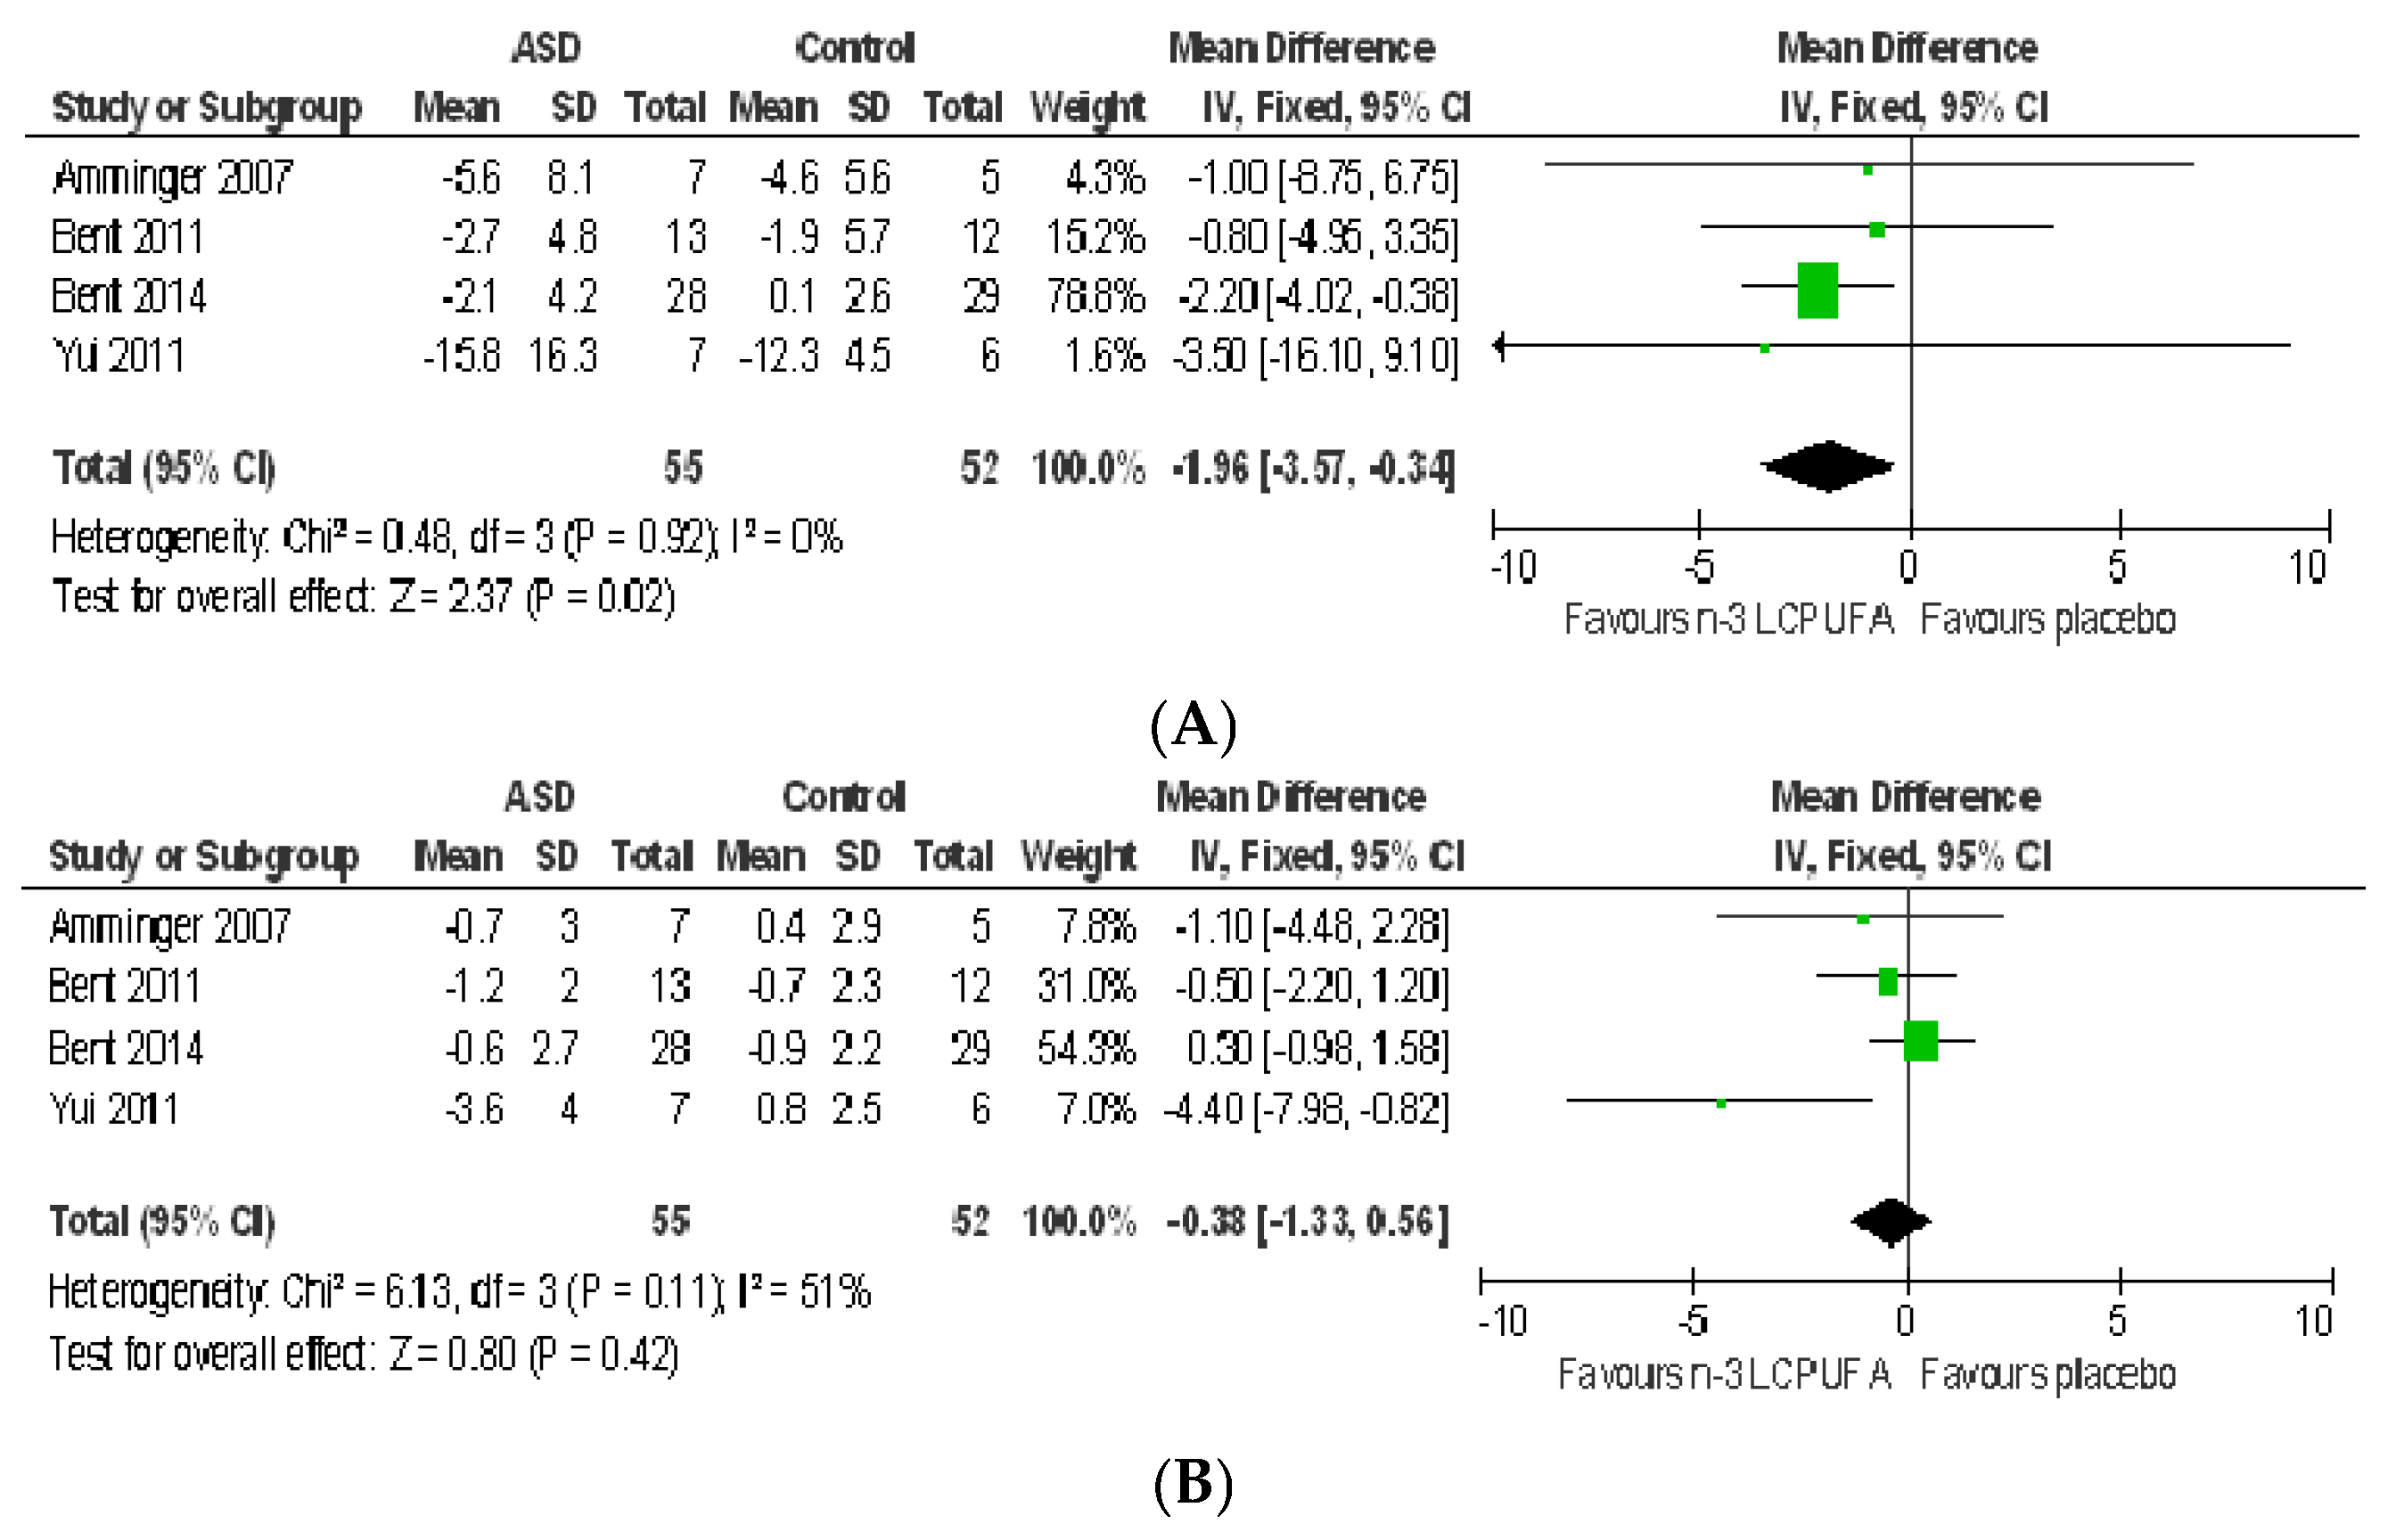
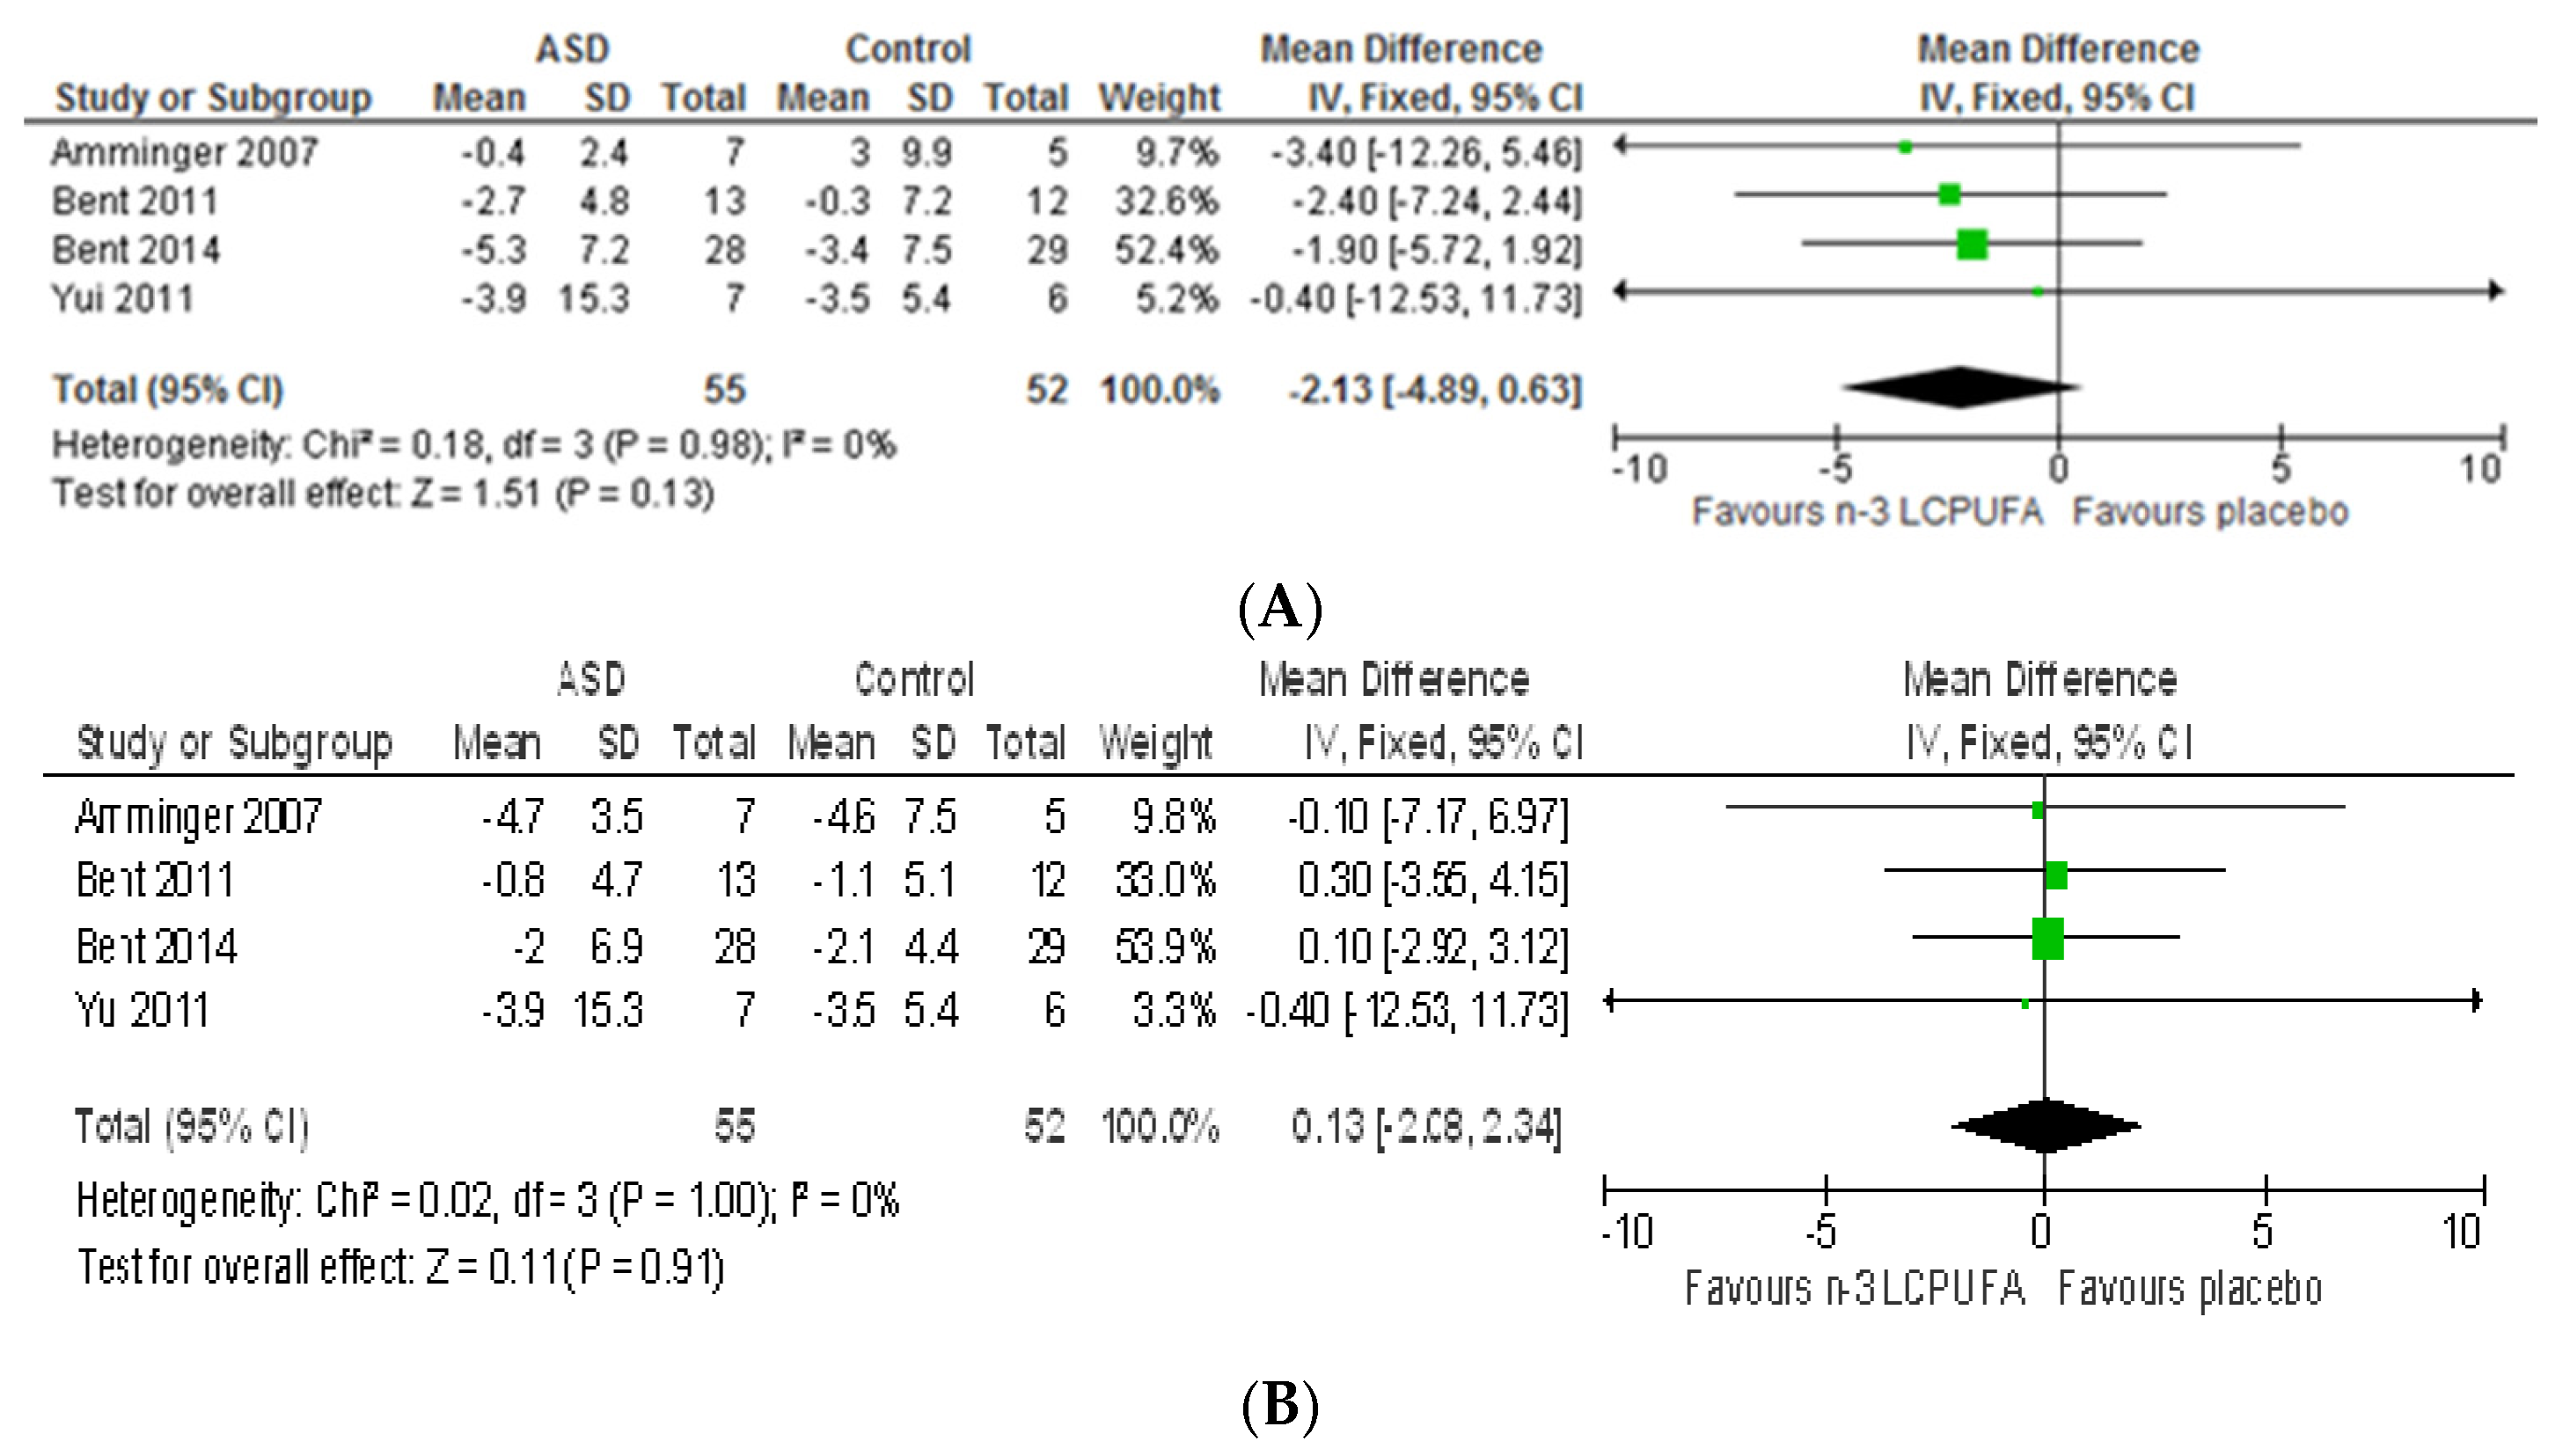
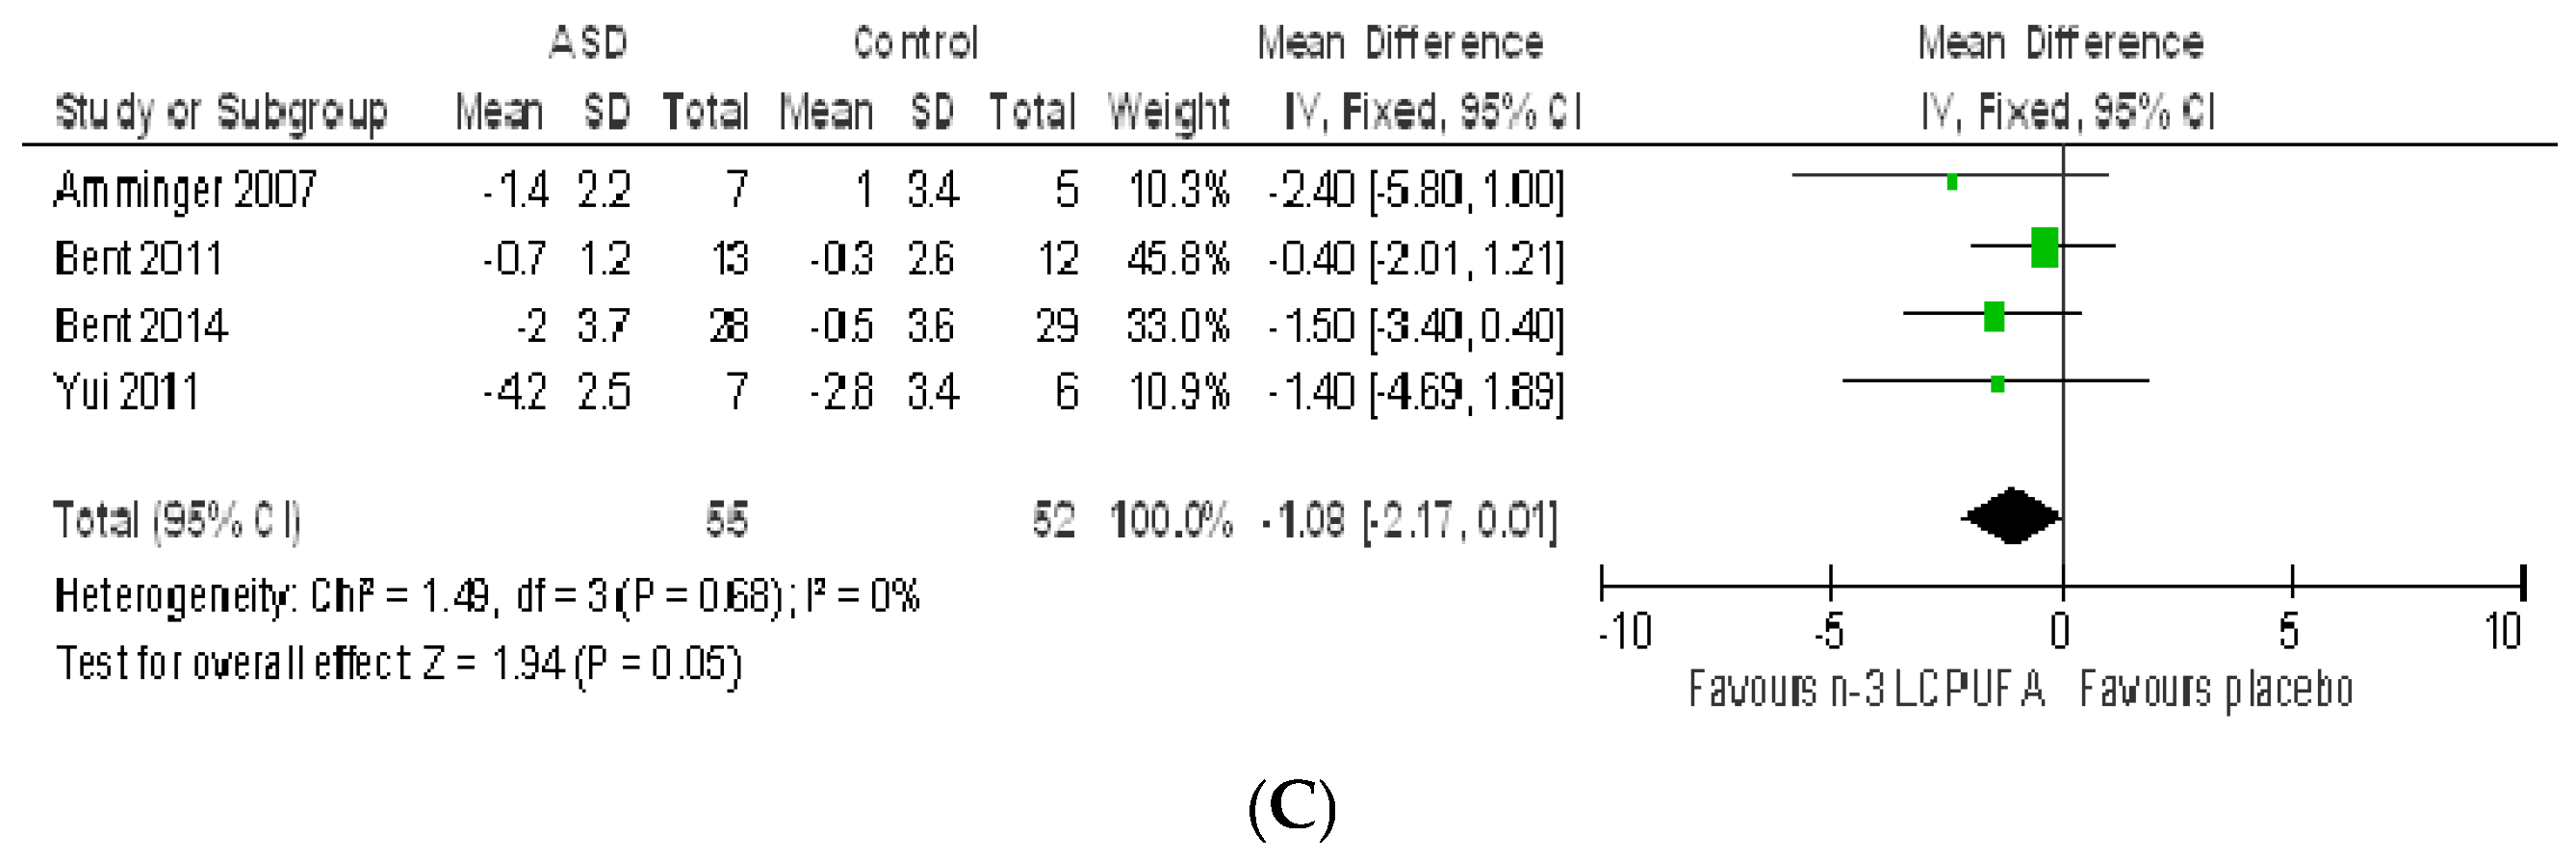
3.2.1. Effect of n-3 LCPUFA on Core Symptoms of ASD

Social interaction: The fixed mean difference for social interaction (assessed using ABC) significantly favoured n-3 LCPUFA with small effect (−1.96 [−3.5, −0.34], Z = 2.37, p = 0.02) and no heterogeneity (I2 = 0%, p = 0.92) (Figure 6A). Removing the Yui, 2011 study [54] did not change the results. The Yui, 2011 study [54] differs from others in that their sample included older participants (2–28 years) and those with IQ > 50, the daily dose of DHA was lower (0.24 g/day) and ARA (0.24 g/day) was added to the supplement, they used different dosing regimens for different age groups (half a dose for children aged 6–10 years) and SD was imputed resulting in a substantially greater SD in the n-3 LCPUFA group compared to the placebo group and other studies. Using SRS social interaction sub-domains (social motivation, social cognition, and social awareness), the Bent, 2014 study [70] found no effect of n-3 LCPUFA on social interaction (all domains > 0.05). Similarly, the Yui, 2012 study [57] did not find any effect of n-3 LCPUFA on any sub-domains of social interaction (measured by SRS, all p > 0.05). The social interaction in response to intervention did not differ across groups in the Mankad, 2015 study [37] where the authors used other assessment tools. The mean change scores decreased (showing an improvement) in both treatment groups in these studies. Voigt et al. (2014) found a significant difference in BASC social skills, favouring n-3 LCPUFA (−0.2 vs. 3.0, p = 0.04), which disappeared after correction for multiple comparisons [55].
Communication: Communication scores (assessed using ABC) did not differ between n-3 LCPUFA and placebo groups (−0.38 [−1.33, 0.56], p = 0.42) (Figure 6B). Moderate heterogeneity was seen in the meta-analysis for communication (I2 = 51%, p = 0.11). Removing the Yui, 2011 study [54] reduced the heterogeneity to 0% but had no impact on the overall result. Bent et al. (2011) and Bent et al. (2014) also used other tools including Peabody Picture Vocabulary Test (PPVT), Expressive Vocabulary Test (EVT) and the communication sub-domain of SRS, respectively [69,70]. Neither study found any effect of n-3 LCPUFA on communication. Similarly, the Mankad, 2015 study [37] did not find any differences across groups and the Voigt, 2014 study [55] reported worsened outcome (reported by teachers) in response to n-3 LCPUFA supplementation compared to placebo that showed improvement (1.4 vs. −4.5, p = 0.02). However, the Yui, 2012 study [57] found greater improvements in SRS communication sub-scale scores in n-3 LCPUFA group than the placebo group (−23.6 vs. −20.6, p = 0.03).
Repetitive and restricted interests and behaviours: The fixed mean difference for RRB (assessed using ABC) favoured n-3 LCPUFA with small effect (−1.08 [−2.17, −0.01], Z = 1.94, p = 0.05) (Figure 6C) and nil heterogeneity (I2 = 0%, p = 0.68). Removing the Yui, 2011 study [54] removed the significance (p = 0.08) perhaps due to low statistical power. Using the Autism Diagnostic Interview-Revised (ADI-R) scale, Yui et al. (2011) also reported a significant improvement in one of four RRB sub-domains, stereotyped and repetitive motor movement (−1.7 vs. −0.7, p = 0.04). However, Bent et al. (2014), using the RRB sub-domain of SRS, reported a trend favouring placebo, −2.9 ± 12.0 (placebo) vs. −8.6 ± 11.4 (n-3 LCPUFA), p = 0.08 [70]. Neither Yui et al. (2012) (using SRS RRB subscale) nor Mankad et al. (using Pervasive Developmental Disorders Behavioural Inventory (PDDBI) resistance to change subscale) showed an effect of n-3 LCPUFA intervention on RRB (p > 0.05) [37,57]. The mean scores improved in both treatment groups in these studies.

3.2.2. Effect of LCPUFA on Co-Existing Conditions

Hyperactivity: Hyperactivity scores (assessed using ABC) did not differ between treatment groups (−2.13 [−4.89, 0.62], p = 0.13) (Figure 7A) and heterogeneity was nil (I2 = 0%, p = 0.98). Sensitivity analysis by removing studies including older participants [36,54] had no effect on the overall result. Similarly, using BASC hyperactivity sub-domain, the Bent, 2011 study [69] did not find any difference between groups (p = 0.83). Using the BASC externalizing behaviour scale, Mankad et al. (2015) reported a significantly worsened outcome in response to n-3 LCPUFA supplementation compared to placebo (3.2 vs. −3.0, p = 0.02) [37]. It should be noted that BASC externalizing behaviour is a composite measure of hyperactivity, aggression and conduct problem. The authors suggested that greater pre-existing gastrointestinal distress at baseline (8/19 vs. 1/19, in the n-3 LCPUFA group vs. placebo group) may have predisposed the n-3 LCPUFA group to higher externalizing behaviour.
Irritability: Irritability scores (assessed using ABC) did not differ between groups (0.13 [−2.08, 2.34], p = 0.91) (Figure 7B) and heterogeneity was nil (I2 = 0%, p = 1.00). Sensitivity analysis by removing studies including older participants [36,54] had no effect on the overall result.
Sensory issues: The Mankad, 2015 study [37] was the only study that assessed the effect of n-3 LCPUFA supplementation on sensory issues (using sensory/perceptual approach behaviour domain of PDDBI). Sensory symptoms comparably improved in both study groups. It should be noted that this domain has five clusters, all of which tap into a variety of repetitive behaviours.
Gastrointestinal symptoms: The Mankad, 2015 study [37] was the only study that assessed the effect of the intervention on gastrointestinal distress and found no differences across treatment groups (p > 0.9) (assessed using CGI-I).
Publication bias could not be determined for any outcome measures due to small number of studies included in the meta-analysis (n = 4).

3.2.3. Tolerability and Safety of LCPUFA Supplementation

All RCTs included in this review concluded that LCPUFA supplementation was well tolerated and safe. Adverse effects reported were not serious and were comparable across treatment groups.

4. Discussion

The findings of each meta-analysis are individually discussed (starting with a discussion of findings of meta-analysis 1 and then meta-analysis 2) followed by a discussion on potential mechanistic pathways that might underlie the relationship between LCPUFA and ASD.

4.1. Systematic Review and Meta-Analysis 1

The current study (meta-analysis 1), to our knowledge, is the first meta-analysis of case control studies of blood fatty acid levels in populations with ASD. The findings of this study were that children with ASD had lower levels of DHA, EPA, and higher total n-6 LCPUFA to n-3 LCPUFA ratio, but not ARA to DHA and ARA to EPA ratios, compared to typically developing children. However, the differences were only evident in studies that included children only and not in studies with wide age ranges that also included adolescents and adults. One should be cautious to make conclusions regarding the modulating effect of age on the relationship since the number of studies including homogenous samples of adolescents and homogenous samples of adults are limited.
Herein we compare the findings of the current study with those of meta-analyses in ADHD because there is an overlap in symptoms between ASD and ADHD. Our results are in agreement with recently published meta-analyses showing lower n-3 LCPUFA levels, with larger effect size when DHA and EPA within each study were pooled than when these fatty acids were separately considered [71], and higher ratios of n-6 LCPUFA to n-3 LCPUFA [42] in patients with ADHD compared with healthy controls.
Another finding of the current study is that while the majority of included studies were of high quality, there was large methodological and clinical heterogeneity between studies, highlighting the importance of discussing the results in light of the study and population characteristics. The type of blood tissue in which the fatty acid composition is analysed has been suggested to affect the findings of case-control studies [27,51]. Bell et al. (2010) and Jory (2016) compared plasma/serum fatty acid composition with those of RBC [27,51]. The authors found significantly lower LA [27], ARA, DHA, and EPA [51] and higher n-6 LCPUFA to n-3 LCPUFA ratio [51] in RBC of autistic children compared with healthy controls. No polyunsaturated fatty acids in Bell et al.’s study [27] and only DHA in Jory’s study [51] were found to be significantly different across groups when plasma/serum were compared. However, sensitivity analysis in the current study revealed no effect of removing studies that reported RBC fatty acids on heterogeneity.
The method by which blood fatty acid composition is expressed (relative vs. absolute) has also been shown to alter the findings of case-control studies investigating the fatty acid composition across groups and to modify the LCPUFA—disease relationship [46,53]. Yui et al. (2016) compared relative levels of plasma fatty acids with the same fatty acids expressed as absolute [53]. The authors found a significant difference in DHA, EPA, DPA, and arachidic acid, and the ratios of ARA to DHA and ARA to EPA (the reverse ratios were reported) across groups when relative levels were expressed. However, the significance disappeared for DHA and arachidic acid when absolute levels were compared. Although the removal of those studies reporting absolute levels had no impact on the heterogeneity, it resulted in the loss of significance across groups for ARA and in a significantly higher ARA to EPA in populations with ASD than typically developing controls. These findings highlight the importance of taking the method by which blood fatty acid composition is expressed into account when blood fatty acid profile is investigated. A potential explanation for such findings could be the inter-study variation in extraction and separation efficiencies in fatty acid analysis [46].
The high heterogeneity reported in this meta-analysis could also be explained by populations’ characteristics. The role of age and sex on fatty acid status has been well documented [60,72,73]. Using a linear model, Wiest et al. (2009) demonstrated that ARA level was modified by sex; while ARA level did not differ between male autistic children and healthy controls, female autistic children had significantly lower ARA than healthy controls [60]. Thus, an uneven distribution of age (particularly if a wide age range is included) and sex across groups could alter the results in different ways; mask the difference, change the effect direction, or influence the effect size, all of which may contribute to heterogeneity seen in this study. Lack of effect in the Bell, 2004 study (EPA, DHA, and ARA) [66], change of direction in the El-Ansary, 2011a (ARA/EPA and ARA/DHA ratios) and 2011b (ARA), and Sliwinski, 2006 studies (total n-3 LCPUFA, DHA, and total n-6/n-3 LCPUFA ratio) [49,50,65], and the large effect size in the Parletta, 2016 study (EPA, DHA, ARA and their ratios) [52] may be explained by such characteristics.
The use of psychotropic medication can be another modifier. Psychotropic medications such as rispiradone may affect RBC fatty acid composition through their effect on oxidative stress and lipid peroxidation [23,74]. The Parletta, 2016 study [52] together with the Tostes, 2013 study [68] resulted in high levels of heterogeneity in EPA. ASD children in the former study were significantly younger than typically developing children [52], and approximately 88% of children with ASD in the Tostes, 2013 study were on psychotropic medication [68].
Location is another factor that may modify the fatty acid composition–autism relationship. With reference to those studies included in this meta-analysis, the Yui, 2016 [53] and Sliwinski, 2006 [49] were conducted in Japan and Belgium (among European countries) where the habitual dietary intake of fish and fish products are potentially high [75]. Both studies reported the autistic population having significantly higher DHA and EPA levels and lower n-6 to n-3 LCPUFA ratio than healthy controls, and both affected heterogeneity largely [49,53]. High consumption of n-3 LCPUFA rich foods can mask the difference, and in populations who are potentially prone to disturbances in fatty acid metabolism can alter the effect direction [49,53].
Altered fatty acid composition in ASD has been suggested to be, in part, due to low dietary intake of LCPUFA. Children with ASD have very limited food preferences that may result in these children having limited intake of LCPUFA rich foods [67]. Only three studies included in this meta-analysis assessed the dietary intake of fatty acids [14,53,67]. Al-Farsi, 2013 reported a lower intake of ALA, assessed using a semi-quantitative food frequency questionnaire, in children with ASD than healthy controls [0.8 (0.2) vs. 1.2 (0.4) g/day, p = 0.001] [67]. However, Ghezzo et al. (2013) [14] and Yui et al. (2016) [53] found no difference in LCPUFA intake across groups, pointing to the facts that these abnormalities could be due to disturbances in fatty acid metabolism rather than intake. For a brief discussion on the potential mechanistic pathways of LCPUFA in ASD refer to Section 4.3 (Potential mechanistic pathways).

4.2. Systematic Review and Meta-Analysis 2

Few RCTs have been completed and reported to date on n-3 LCPUFA supplementation for ASD; only six trials were included in this review (four included in the meta-analysis and two in the overall interpretation), with a total of 178 participants. In this meta-analysis, a small but significant benefit of n-3 LCPUFA supplementation was found for social interaction and RRB but not communication and co-existing behaviours and conditions. No evidence of significant heterogeneity between trials were found.
Four trials included in the present meta-analysis with a total of 107 participants are however insufficient to provide robust evidence. Furthermore, the findings cannot be generalised to all children on the autism spectrum because the included children predominantly comprised males, were of different age groups (less than eight years and up to 28 years), displayed moderate to severe symptoms [54,69] or high hyperactivity level [36,70].
The findings of this review to some extent contradict the results of previous systematic reviews and meta-analysis [38,39]. These reviews did not find any statistically significant improvement in behaviour, but reported a larger positive effect on hyperactivity [38,39] while the present review found a significant improvement in social interaction and no improvement in hyperactivity. Our results, however, are in line with those of previous reviews [38,39] in that no improvement was identified in communication and irritability. With respect to RRB, sensory issues and gastrointestinal symptoms, no comparison can be made because they were not considered by these reviews. It should be noted that the small number of RCTs included in the review by Bent et al. (n = 1) [38] and James et al. (n = 2) [39] could have compromised the statistical power to detect any difference across groups.
Although case-control and open label studies provided evidence for a role of n-3 LCPUFA in ASD, RCTs of supplementation with n-3 LCPUFA yielded mixed results. One reason for such inconsistencies between studies may result from inadequately controlling for age, trial duration, habitual dietary intake of n-3 LCPUFA and levels of these fatty acids in the circulation over the course of trial, participants’ general health conditions at the baseline and over the course of study, and outcome tools assessing behaviour. Response to n-3 LCPUFA supplementation has been shown to be predicted by body weight adjusted dose, baseline omega-3 index (RBC DHA + EPA), sex, age, and physical activity level; with populations receiving larger doses, having lower starting omega-3 index, older population, females and those with higher physical activity level experiencing a greater increase in the omega-3 index in response to supplementation [76].
Dietary intake of n-3 LCPUFA rich foods in children with autism is low [67]. However, omega-3 fatty acid supplements are among the most commonly used complementary and alternative medication in ASD [40]. It is plausible to suggest that even though the mentioned trials excluded participants that used n-3 LCPUFA supplements on their own initiatives at baseline, participants may have had high habitual dietary intake of these fatty acids due to their popularity, therefore responding differently to supplements which leads to diminishing the differences across treatment groups. An example of such implication could be the Voigt, 2014 study [55]; all children in this study had baseline LCPUFA levels above paediatric reference ranges for nutritional deficiencies and metabolic disorders (established at the Mayo Clinic [77]), and despite an increase of 431% in plasma DHA level, no improvement in behaviour was reported. Bent et al. (2011), on the other hand, showed that higher baseline level of some n-6 and n-3 polyunsaturated fatty acids including eicosadienoic acid (r = −0.79, p = 0.02), docosadienoate acid (r = −0.65, p = 0.03), and ALA (r = −0.64, p = 0.03) were associated with reduction in hyperactivity [69]. In an open label trial of n-3 LCPUFA in 41 autistic children aged 7–18 years, Ooi et al. (2015) showed an inverse correlation between autism mannerism severity and change in RBC fatty acids after 12 weeks of intervention and the severity was associated with baseline EPA level [32]. Unfortunately, the number of trials included in this review was inadequate to provide data on the effect of baseline n-3 LCPUFA intake or status on behavioural changes in response to supplementation.
The sex differences in ASD might be partly explained by sex differences in fatty acid metabolism; males may be more vulnerable than females to deficiencies in LCPUFA because of hormonal reasons [78], and thus may respond poorly to supplements [76]. With the exception of one study [36], no trials included in this review stratified the randomisation by sex. Unfortunately, no analysis could be performed for subgroups stratified by sex in this review because far more males than females were included and no studies reported behavioural changes in response to supplementation for males and females separately. With regard to the potential effect of age, three out of six studies included a wide age range (children and young people up to 28 years) which may have resulted in greater response variability. Due to the small number of studies included in this review, we could not perform subgroup analysis for different age bands to examine the effect of age on behavioural change in response to omega-3 supplementation.
The trial duration varied widely in studies included in this review (6–26 weeks). Evidence suggests that PUFA erythrocyte membrane reaches a steady state after 6 months [79] and at least 4 months is needed to demonstrate an effect on cognitive performance [41]. It has also been suggested that longer study periods of one year might be needed to demonstrate behavioural changes in response to n-3 LCPUFA supplementation [80]. Furthermore, the majority of outcome assessment tools are retrospectively completed (and duration over which behaviour is assessed varies depending on the assessment tool used); for example, parents are required to consider the behaviour over the past four weeks when completing ABC questionnaire while the timeframe for SRS is the past six months. It is of importance to avoid assessing and considering behaviour when the LCPUFA erythrocyte membrane has not yet reached its steady state. Therefore, wide variation and insufficient trial duration could explain the inconsistencies. Due to the small number of studies included in this review, we could not perform subgroup analysis for different intervention lengths to examine the effect of duration on behavioural change in response to omega-3 supplementation.
Gastrointestinal symptoms are highly prevalent in populations with ASD [81,82,83]. Mazurek et al. (2013) reported that of 2973 children with ASD, 24.7% had at least one chronic gastrointestinal symptom [83]. Compared to typically developing children, developmentally delayed and ASD children were more likely to have at least one frequent gastrointestinal symptom [83]. ASD children with frequent abdominal pain, gaseousness, diarrhea, constipation or pain on stooling had worse scores in four (irritability, social withdrawal, stereotypy, and hyperactivity) out of five ABC subscales than ASD children with no frequent gastrointestinal symptoms [84]. The pain and discomfort caused by gastrointestinal distress can worsen the behaviour in people with ASD, more particularly in non-verbal individuals who cannot express their feelings. Mankad et al. (2015) reported significantly worsened externalizing behaviours in response to n-3 LCPUFA supplementation which could be attributed to higher gastrointestinal distress reported in the active treatment group compared with the placebo (8/19 vs. 1/19, respectively) [37]. Thus, it is important to consider the potential modulating effect of gastrointestinal symptoms over the course of study on behavioural changes in response to supplementation.
Additionally, a variety of assessment tools (ranging from one to six tools) were used in each study which complicated effective comparisons across studies resulting in the exclusion of three studies from the meta-analysis, and potentially compromised the validity of a study by increasing the likelihood of type 1 error [44]. With the exception of ABC, a widely-used tool to assess problem behaviours in pharmacological trials in ASD, the majority of assessment tools have been designed for diagnostic purposes and there is a lack of evidence regarding the sensitivity of these tools to slight changes in behaviour in response to intervention in ASD populations. It is also worth noting that the inappropriate speech subscale of ABC is not a comprehensive measure of communication compared to other tools like SRS (inappropriate speech subscale of ABC comprises of four questions while the SRS communication subscale consists of 22 questions). Thus, findings regarding communication (measured by ABC) should be interpreted with caution.
It is also worth noting that the small or lack of effect reported here could be due to large placebo response in many trials included in this review. The large placebo response may have limited our capacity to identify any differences in some behaviour across groups. It is documented that different factors [e.g., raters of outcome assessment tools (clinicians vs. parents), increased response to active intervention, location, pharmacological and adjunctive intervention, participants’ age (younger vs. older), study duration (shorter vs. longer), and severity of condition (lower baseline severity vs. higher severity)] are associated with the increased placebo response in ASD and other neurodevelopment and psychiatric disorders [85,86,87]. However, the reason for observed improvement in placebo groups included in this review is unclear and could not be determined due to small number of studies included.

4.3. Potential Mechanistic Pathways

There are, though not very well understood, several potential biological pathways for a role of LCPUFA in ASD [88,89]. Approximately 60% of the brain’s dry weight is fat, with DHA comprising 60% and 40% of the PUFA in the retina and brain, respectively [90], suggesting that it is structurally important. Evidence suggests that some individuals with ASD have abnormalities in the gray and white matter of brain regions that are involved in social interaction, RRB, and sensory processing [13,91,92,93]. Ingestion of DHA (through diet or supplementation) has been shown to be positively associated with gray matter volume and its functional integrity and with white matter microstructural integrity in healthy individuals [16,17,94].
At the cellular level, PUFA interact with and influence the functioning of integral membrane proteins, including enzymes, receptors, and ion channels [95,96]. Evidence suggests that the activity of Na+/K+-ATPase (an enzyme that controls ion transport produced by neurotransmission) and adenylate cyclase (an enzyme that catalyses the conversion of ATP to cyclic AMP and has been shown to modulate social behaviours [97]) is disturbed in individuals with ASD [14,98]. Ghezzo et al. (2013) reported children with ASD having a significant reduction in Na+/K+-ATPase activity, alterations in erythrocyte fatty acid membrane (a decrease in n-3 LCPUFA and consequently an increase in n-6 LCPUFA to n-3 LCPUFA ratio, and an increase in monounsaturated fatty acids), and a reduction in erythrocyte membrane fluidity [14]. These alterations correlated with clinical features of ASD, particularly hyperactivity scores [14].
Further evidence for a relationship between n-3 LCPUFA and ASD comes from studies investigating its role in neurogenesis and several neurotransmitter systems. LCPFA, particularly n-3 series DHA, has been shown to favourably affect neurite survival, outgrowth and myelination in animal cultured cortical [99,100,101], sensory [102], and hippocampal neurons [18,103,104]. The development of axons and dentrites as well as myelination in multiple brain areas (involved in social behaviours, emotions, and RRB) has been reported to be impaired in individuals with ASD [105,106]. Similarly, an abnormal level of brain derived neurotrophic factor (BDNF, a protein that promotes the survival of neurons) in the circulation has been reported in children with ASD, which was associated with the severity of condition [88,107,108]. Docosahexaenoic acid administration normalised BDNF in the hippocampus, increased the growth of uninjured corticospinal and serotonergic fibres, and enhanced synaptic plasticity in an animal model of spinal cord injury [101,109].
Autistic children have been shown to exhibit significantly higher levels of several dopamine derivatives (in urine), dopamine transporter binding proteins, and serotonin in brain, and lower levels of serotonin transporter binding protein (in brain), glutamine signal (in basal ganglia), and oxytocin than healthy controls [110,111,112,113,114,115,116]. Furthermore, within the ASD populations, basal ganglia glutamine signal and plasma oxytocin negatively correlated with impaired behaviour [114,116]. In response to an n-3 PUFA limited diet in rats, dopamine levels reduced and basal synaptic release of serotonin increased while the turn over metabolites of dopamine increased and those of serotonin decreased [19,117,118,119]. A DHA depleted diet also altered the glutamergic system in offspring female rats [120]. This alteration was associated with anxiety-like behaviours, memory deficit and exploratory behaviours during adulthood [120]. On the other hand, DHA treatment significantly increased synaptic plasticity in hippocampal neurons and enhanced glutamatergic activity [121].
Another plausible mechanism supporting the association between LCPUFA and ASD is the anti- and pro-inflammatory properties of LCPUFA metabolic products. Eicosanoids (a collective name for prostaglandins, thromboxanes, leukotrienes and a variety of hydroxyl and hydroproxy fatty acid) are the enzymatic metabolic products of PUFA, and have important roles in inflammation [20]. While EPA or DHA derived eicosanoids have anti-inflammatory properties, those derived from ARA have pro-inflammatory properties [20]. Elevated levels of several peripheral pro-inflammatory cytokines and nuclear factor Kappa B (NF-κB, a transcription factor involved in inflammatory signaling pathways) has been reported in children with ASD [122,123,124]. Brigandi et al. [24] reported children with ASD having significantly higher plasma levels of PGE2 than healthy controls, a finding confirmed by El-Ansary and Al-Ayadhi (2012) [125] who also reported higher levels of leukotriene and 8-isoprostane together with PGE2 in children with ASD. In addition, lower levels of antioxidant proteins and increased levels of oxidative stress markers was associated with more severe ASD symptoms, including sensory issues [14,124,126]. Supplementation with n-3 PUFA, on the other hand, decreased the gene expression of NF-κB, IL-12 and IL-13 [127], macrophage inflammatory protein-2 (MIP2), IL-6 [128] and tumor necrosis factor-α (TNF-α) [128,129,130].
Decreased antioxidant capacity and increased lipid peroxidation may result in RBC LCPUFA instability and decrease these fatty acids in autism [23,74]. Instability in RBC LCPUFA composition has been shown by a great loss in PUFA levels when the blood samples of autistic children were stored at −20 °C, a finding not observed in the blood sample of healthy controls [62]. The reason for such instability could be related to cellular phospholipase activity. Tostes et al. (2013) [68] and Bell et al. (2004) [66] reported children with ASD having significantly higher phospholipase A2 (PLA2) activity than typically developing controls that was reduced by EPA supplementation [66]. PLA2 is responsible for releasing fatty acids, more particularly ARA, from phospholipids [66].
Finally, the role of LCPUFA in ASD could be explained by defects in enzymes involved in the conversion of LCPUFA from their precursors or deficits in the process of incorporation of LCPUFA into the cell membrane [24,25,26]. Gene variants in fatty acid desaturase (FADS)—one of the strongest genome wide associated signals—have been shown to enhance the conversion of ARA from its precursor and to be sex- and ethnicity-specific [131,132]. The effect of FADS genotype has been shown to be more pronounced in African Americans than Europeans (approximately two fold higher) [131]. The higher frequency of this genetic variant, but not the allelic effect of G allele, explained such a difference [131]. Also, while in Caucasians, one FADS2 single nucleotide polymorphism (SNP) and multiple FADS2 SNP (two SNP in males and nine SNP in females) were associated with n-6 aggregate desaturase indices, it was associated with five FADS2 SNP in East Asian Females [132]. In addition, carriers of APOE4 allele seems to have altered long chain omega-3 metabolism [133]. Compared to the non APOE4-carriers, the carriers have higher β-oxidisation rates of n-3 LCPUFA [133]. Furthermore, Shimamoto et al. (2014) showed altered mRNA gene expression levels of fatty acid binding protein 7 (FABP7) in post-mortem ASD brains, and increased hyperactivity and anxiety-related phenotype (two common features in ASD) in FABP7 knockout mice [134]. Although the modifying role of genetic variants in enzymes involved in fatty acid metabolism in the LCPUFA-disease relationship has been well documented, in the context of ASD, it warrants further investigation.

5. Conclusions

The current meta-analysis of case-controls studies, to our knowledge, is the first to investigate fatty acid composition in populations with ASD. Future observational studies of n-3 LCPUFA in children with ASD are encouraged while including a uniform biomarker (e.g., omega-3 index or percentage of n-3 LCPUFA in RBC) and reporting method (e.g., relative or absolute), collecting dietary intake of both n-3 and n-6 LCPUFA, and matching cases and controls on potential modulating attributes (e.g., age, sex, severity, genotype, and medication use). It is also critical to know whether inadequate LCPUFA status in ASD is attributed to inefficient or disrupted metabolism or other factors like LCPUFA consumption.
Based on the current evidence, n-3 LCPUFA supplementation cannot be recommended as an alternative to support behavioural therapies for ASD children. However, it seems prudent that n-3 LCPUFA could be used to complement other therapies in ASD populations given its long-term tolerability and acceptability (up to six months), potentially inefficient or disrupted LCPUFA metabolic pathways in this population, and its critical role in brain function and development, and various body processes some of which are involved in the pathobiology of ASD. It should be noted that this recommendation is made cautiously because the results of this study are based on a very small sample of studies (with methodological differences and limitations) and short duration of the interventions. Therefore, the generated statistics should not be over-interpreted but seen as indicative of the need to study the issue further (while controlling for potential modifying and confounding variables) to pursue the trends observed in this study. The effect of n-3 LCPUFA on behaviour may be modulated by background diet and baseline LCPUFA status, sex, age, trial duration, and gastrointestinal stress at baseline and over the study period, all of which are recommended to be considered in future research. Furthermore, an investigation of the potential modulating effect of genotype (e.g., APOE) on behavioural changes in response to LCPUFA supplementation is warranted. It is also recommended that future studies include a uniform assessment tool that is sensitive to minor behavioural changes in response to complementary/nutritional therapies. Finally, the potential placebo effect and the reasons for such effects are encouraged to be investigated and accounted for in the design stage of RCTs.

Supplementary Materials

The following are available online at https://www.mdpi.com/2072-6643/9/2/155/s1, Table S1: Study characteristics of open label trials and case-studies excluded from systematic literature review; Table S2: Quality appraisal of included case-control studies; Table S3: Quality appraisal of included RCTs; Figure S1: Risk of bias table showing judgments on each risk factor for each primary study included in both meta-analysis and overall interpretation.

Acknowledgments

No funding was received in support of this research work. Massey University provided funds for covering the costs to publish this research work in open access.

Author Contributions

H.M. conceived the manuscript idea, H.M. researched the manuscript and identified eligible studies, H.M. and M.D. extracted data and performed the quality appraisal of studies; H.M. performed the meta-analyses and drafted the manuscript, all other authors critically reviewed the manuscript.

Conflicts of Interest

The authors declare no conflict of interest.

References

  1. Chakrabarti, S.; Fombonne, E. Pervasive developmental disorders in preschool children. JAMA 2001, 285, 3093–3099. [Google Scholar] [CrossRef] [PubMed]
  2. New Zealand Guidelines Group. What Does ASD Look Like? A Resource to Help Identify Autism Spectrum Disorder; New Zealand Guidelines Group: Wellington, New Zealand, 2010. [Google Scholar]
  3. Baio, J. Prevalence of Autism Spectrum Disorders—Autism and Developmental Disabilities Monitoring Network, 14 Sites, United States, 2008. Surveill. Summ. 2012, 61, 1–19. [Google Scholar]
  4. Ghanizadeh, A. A preliminary study on screening prevalence of pervasive developmental disorder in schoolchildren in Iran. J. Autism Dev. Disord. 2008, 38, 759–763. [Google Scholar] [CrossRef] [PubMed]
  5. Kogan, M.D.; Blumberg, S.J.; Schieve, L.A.; Boyle, C.A.; Perrin, J.M.; Ghandour, R.M.; Singh, G.K.; Strickland, B.B.; Trevathan, E.; van Dyck, P.C. Prevalence of Parent-Reported Diagnosis of Autism Spectrum Disorder Among Children in the US, 2007. Pediatrics 2009, 124, 1395–1403. [Google Scholar] [CrossRef] [PubMed]
  6. Diagnostic and Statistical Manual of Mental Disorders. In Diagnostic and Statistical Manual of Mental Disorders: DSM-5; American Psychiatric Association: Washington, DC, USA, 2013.
  7. Napolioni, V.; Ober-Reynolds, B.; Szelinger, S.; Corneveaux, J.J.; Pawlowski, T.; Ober-Reynolds, S.; Kirwan, J.; Perisco, A.M.; Melmed, R.D.; Craig, D.W.; et al. Plasma cytokine profiling in sibling pairs discordant for Autism Spectrum Disorder. J. Neuroinflamm. 2013, 10, 38. [Google Scholar] [CrossRef] [PubMed]
  8. Rossignol, D.A.; Frye, R.E. Evidence linking oxidative stress, mitochondrial dysfunction, and inflammation in the brain of individuals with autism. Front. Physiol. 2014, 5, 150. [Google Scholar] [CrossRef] [PubMed]
  9. Singh, V.K. Phenotypic expression of autoimmune autistic disorder (AAD): A major subset of autism. Ann. Clin. Psychiatry 2009, 21, 148–161. [Google Scholar] [PubMed]
  10. Napoli, E.; Wong, S.; Hertz-Picciotto, I.; Giulivi, C. Deficits in Bioenergetics and Impaired Immune Response in Granulocytes From Children With Autism. Pediatrics 2014, 133, e1405–e1410. [Google Scholar] [CrossRef] [PubMed]
  11. Rose, S.; Frye, R.E.; Slattery, J.; Wynne, R.; Tippett, M.; Pavliv, O.; Melnyk, S.; James, S.J. Oxidative Stress Induces Mitochondrial Dysfunction in a Subset of Autism Lymphoblastoid Cell Lines in a Well-Matched Case Control Cohort. PLoS ONE 2014, 9, e85436. [Google Scholar] [CrossRef] [PubMed]
  12. Melnyk, S.; Fuchs, G.J.; Schulz, E.; Lopez, M.; Kahler, S.G.; Fussell, J.J.; Bellando, J.; Pavliv, O.; Rose, S.; Seidel, L.; et al. Metabolic imbalance associated with methylation dysregulation and oxidative damage in children with autism. J. Autism Dev. Disord. 2012, 42, 367–377. [Google Scholar] [CrossRef] [PubMed]
  13. D’Mello, A.M.; Crocetti, D.; Mostofsky, S.H.; Stoodley, C.J. Cerebellar gray matter and lobular volumes correlate with core autism symptoms. NeuroImage Clin. 2015, 7, 631–639. [Google Scholar] [CrossRef] [PubMed]
  14. Ghezzo, A.; Visconti, P.; Abruzzo, P.M.; Bolotta, A.; Ferreri, C.; Gobbi, G.; Malisardi, G.; Manfredini, S.; Marini, M.; Nanetti, L.; et al. Oxidative Stress and Erythrocyte Membrane Alterations in Children with Autism: Correlation with Clinical Features. PLoS ONE 2013, 8, e66418. [Google Scholar] [CrossRef] [PubMed]
  15. Schaaf, C.P.; Zoghbi, H.Y. Solving the autism puzzle a few pieces at a time. Neuron 2011, 70, 806–808. [Google Scholar] [CrossRef] [PubMed]
  16. McNamara, R.K.; Able, J.; Jandacek, R.; Rider, T.; Tso, P.; Eliassen, J.C.; Alfieri, D.; Weber, W.; Jarvis, K.; DelBello, M.P.; et al. Docosahexaenoic acid supplementation increases prefrontal cortex activation during sustained attention in healthy boys: A placebo-controlled, dose-ranging, functional magnetic resonance imaging study. Am. J. Clin. Nutr. 2010, 91, 1060–1067. [Google Scholar] [CrossRef] [PubMed]
  17. Witte, A.V.; Kerti, L.; Hermannstädter, H.M.; Fiebach, J.B.; Schreiber, S.J.; Schuchardt, J.P.; Hahn, A.; Flöel, A. Long-Chain Omega-3 Fatty Acids Improve Brain Function and Structure in Older Adults. Cereb. Cortex 2013, 24, 3059–3068. [Google Scholar] [CrossRef] [PubMed]
  18. Pu, H.; Guo, Y.; Zhang, W.; Huang, L.; Wang, G.; Liou, A.K.; Zhang, J.; Zhang, P.; Leak, R.K.; Wang, Y.; et al. Omega-3 polyunsaturated fatty acid supplementation improves neurologic recovery and attenuates white matter injury after experimental traumatic brain injury. J. Cereb. Blood Flow Metab. 2013, 33, 1474–1484. [Google Scholar] [CrossRef] [PubMed]
  19. Tang, M.; Zhang, M.; Cai, H.; Li, H.; Jiang, P.; Dang, R.; Liu, Y.; He, X.; Xue, Y.; Cao, L.; et al. Maternal diet of polyunsaturated fatty acid altered the cell proliferation in the dentate gyrus of hippocampus and influenced glutamatergic and serotoninergic systems of neonatal female rats. Lipids Health Dis. 2016, 15, 71. [Google Scholar] [CrossRef] [PubMed]
  20. Calder, P.C. n-3 Polyunsaturated fatty acids, inflammation, and inflammatory diseases. Am. J. Clin. Nutr. 2006, 83, S1505–S1519. [Google Scholar]
  21. Serra-Majem, L.; Nissensohn, M.; Overby, N.C.; Fekete, K. Dietary methods and biomarkers of omega 3 fatty acids: A systematic review. Br. J. Nutr. 2012, 107 (Suppl. 2), S64–S76. [Google Scholar] [CrossRef] [PubMed]
  22. Spahis, S.; Vanasse, M.; Bélanger, S.A.; Ghadirian, P.; Grenier, E.; Levy, E. Lipid profile, fatty acid composition and pro- and anti-oxidant status in pediatric patients with attention-deficit/hyperactivity disorder. Prostaglandins Leukot. Essent. Fatty Acids 2008, 79, 47–53. [Google Scholar] [CrossRef] [PubMed]
  23. Khan, M.M.; Evans, D.R.; Gunna, V.; Scheffer, R.E.; Parikh, V.V.; Mahadik, S.P. Reduced erythrocyte membrane essential fatty acids and increased lipid peroxides in schizophrenia at the never-medicated first-episode of psychosis and after years of treatment with antipsychotics. Schizophr. Res. 2002, 58, 1–10. [Google Scholar] [CrossRef]
  24. Brigandi, S.; Shao, H.; Qian, S.; Shen, Y.; Wu, B.-L.; Kang, J. Autistic Children Exhibit Decreased Levels of Essential Fatty Acids in Red Blood Cells. Int. J. Mol. Sci. 2015, 16, 10061. [Google Scholar] [CrossRef]
  25. Vancassel, S.; Durant, G.; Lejeune, B.; Martineau, J.; Guiloteau, D.; Andres, C.; Chalon, S. Plasma fatty acid levels of autistic children. Prostaglandins Leukot. Essent. Fatty Acids 2001, 65, 1–7. [Google Scholar] [CrossRef] [PubMed]
  26. Mostafa, G.A.; Al-Ayadhi, L.Y. Reduced levels of plasma polyunsaturated fatty acids and serum carnitine in autistic children: Relation to gastrointestinal manifestations. Behav. Brain Funct. 2015, 11, 4. [Google Scholar] [CrossRef] [PubMed]
  27. Bell, J.G.; Miller, D.; MacDonald, D.J.; MacKinlay, E.E.; Dick, J.R.; Cheseldine, S.; Boyle, R.M.; Graham, C.; O’Hare, A.E. The fatty acid compositions of erythrocyte and plasma polar lipids in children with autism, developmental delay or typically developing controls and the effect of fish oil intake. Br. J. Nutr. 2010, 103, 1160–1167. [Google Scholar] [PubMed]
  28. Bu, B.; Ashwood, P.; Harvey, D.; King, I.B.; van de Water, J.; Jin, L.W. Fatty acid compositions of red blood cell phospholipids in children with autism. Prostaglandins Leukot. Essent. Fatty Acids 2006, 74, 215–221. [Google Scholar] [CrossRef] [PubMed]
  29. Johnson, C.; Handen, B.; Zimmer, M.; Sacco, K. Polyunsaturated Fatty Acid Supplementation in Young Children with autism. J. Dev. Phys. Disabil. 2010, 22, 1–10. [Google Scholar] [CrossRef]
  30. Meguid, N.A.; Atta, H.M.; Gouda, A.S.; Khalil, R.O. Role of polyunsaturated fatty acids in the management of Egyptian children with autism. Clin. Biochem. 2008, 41, 1044–1048. [Google Scholar] [CrossRef] [PubMed]
  31. Meiri, G.; Bichovsky, Y.; Belmaker, R.H. Omega 3 fatty acid treatment in autism. J. Child Adolesc. Psychopharmacol. 2009, 19, 449–451. [Google Scholar] [CrossRef] [PubMed]
  32. Ooi, Y.P.; Weng, S.J.; Jang, L.Y.; Low, L.; Seah, J.; Teo, S.; Ang, R.P.; Lim, C.G.; Liew, A.; Fung, D.S.; Sung, M. Omega-3 fatty acids in the management of Autism Spectrum Disorders: Findings from an open-label pilot study in Singapore. Eur. J. Clin. Nutr. 2015, 69, 969–971. [Google Scholar] [CrossRef] [PubMed]
  33. Patrick, L.; Salik, R. The Effect Of Essential Fatty Acid Supplementation on Language Development and Learning Skills in Autism and Aspergers Syndrome. Autism Asperger’s Digest. Jan-Feb 2005, 36–37. [Google Scholar]
  34. Politi, P.; Cena, H.; Comelli, M.; Marrone, G.; Allegri, C.; Emanuele, E.; Ucelli di Nemi, S. Behavioral Effects of Omega-3 Fatty Acid Supplementation in Young Adults with Severe Autism: An Open Label Study. Arch. Med. Res. 2008, 39, 682–685. [Google Scholar] [CrossRef] [PubMed]
  35. Johnson, S.M.; Hollander, E. Evidence that eicosapentaenoic acid is effective in treating Autism. J. Clin. Psychiatry 2003, 64, 848–849. [Google Scholar] [CrossRef] [PubMed]
  36. Amminger, G.P.; Berger, G.E.; Schäfer, M.R.; Klier, C.; Friedrich, M.H.; Feucht, M. Omega-3 Fatty Acids Supplementation in Children with Autism: A Double-blind Randomized, Placebo-controlled Pilot Study. Biol. Psychiatry 2007, 61, 551–553. [Google Scholar] [CrossRef] [PubMed]
  37. Mankad, D.; Dupuis, A.; Smile, S.; Roberts, W.; Brian, J.; Lui, T.; Genore, L.; Zaghloul, D.; Iaboni, A.; Marcon, P.M.; et al. A randomized, placebo controlled trial of omega-3 fatty acids in the treatment of young children with autism. Mol. Autism 2015, 6, 18. [Google Scholar] [CrossRef]
  38. Bent, S.; Bertoglio, K.; Hendren, R.L. Omega-3 fatty acids for Autistic Spectrum Disorder: A systematic review. J. Autism Dev. Disord. 2009, 39, 1145–1154. [Google Scholar] [CrossRef] [PubMed]
  39. James, S.; Montgomery, P.; Williams, K. Omega-3 fatty acids supplementation for Autism Spectrum Disorders (ASD). Cochrane Database Syst. Rev. 2011, 9, CD007992. [Google Scholar]
  40. Brondino, N.; Brondino, N.; Fusar-Poli, L.; Rocchetti, M.; Provenzani, U.; Barale, F.; Politi, P. Complementary and Alternative Therapies for Autism Spectrum Disorder. Evid. Based Complement. Altern. Med. eCAM 2015, 2015, 258589. [Google Scholar] [CrossRef] [PubMed]
  41. Stonehouse, W. Does Consumption of LC Omega-3 PUFA Enhance Cognitive Performance in Healthy School-Aged Children and throughout Adulthood? Evidence from Clinical Trials. Nutrients 2014, 6, 2730–2758. [Google Scholar] [CrossRef] [PubMed]
  42. LaChance, L.; McKenzie, K.; Taylor, V.H.; Vigod, S.N. Omega-6 to Omega-3 Fatty Acid Ratio in Patients with ADHD: A Meta-Analysis. J. Can. Acad. Child Adolesc. Psychiatry 2016, 25, 87–96. [Google Scholar] [PubMed]
  43. Bolte, E.E.; Diehl, J.J. Measurement tools and target symptoms/skills used to assess treatment response for individuals with Autism Spectrum Disorder. J. Autism Dev. Disord. 2013, 43, 2491–2501. [Google Scholar] [CrossRef] [PubMed]
  44. Leon, A.C. Implications of Clinical Trial Design on Sample Size Requirements. Schizophr. Bull. 2008, 34, 664–669. [Google Scholar] [CrossRef] [PubMed]
  45. Sun, Q.; Ma, J.; Campos, H.; Hankinson, S.E.; Hu, F.B. Comparison between plasma and erythrocyte fatty acid content as biomarkers of fatty acid intake in US women. Am. J. Clin. Nutr. 2007, 86, 74–81. [Google Scholar] [PubMed]
  46. Sergeant, S.; Ruczinski, I.; Ivester, P.; Lee, T.C.; Morgan, T.M.; Nicklas, B.J.; Mathias, R.A.; Chilton, F.H. Impact of methods used to express levels of circulating fatty acids on the degree and direction of associations with blood lipids in humans. Br. J. Nutr. 2016, 115, 251–261. [Google Scholar] [CrossRef] [PubMed]
  47. Health Canada. Guidance Document for Preparing a Submission for Food Health Claims, Bureau of Nutritional Sciences Food Directorate; Health Products and Food Branch Health Canada: Ottawa, ON, Canada, 2009.
  48. Higgins, J.P.T.; Green, S. Cochrane Handbook for Systematic Reviews of Interventions. Available online: http://training.cochrane.org/handbook (accessed on 11 February 2016).
  49. Sliwinski, S.; Croonenberghs, J.; Christophe, A.; Deboutte, D.; Maes, M. Polyunsaturated fatty acids: Do they have a role in the pathophysiology of autism? Neuro Endocrinol. Lett. 2006, 27, 465–471. [Google Scholar] [PubMed]
  50. El-Ansary, A.K.; Ben Bacha, A.G.; Al-Ayahdi, L.Y. Impaired plasma phospholipids and relative amounts of essential polyunsaturated fatty acids in autistic patients from Saudi Arabia. Lipids Health Dis. 2011, 10, 63. [Google Scholar] [CrossRef] [PubMed]
  51. Jory, J. Abnormal fatty acids in Canadian children with autism. Nutrition 2016, 32, 474–477. [Google Scholar] [CrossRef] [PubMed]
  52. Parletta, N.; Niyonsenga, T.; Duff, J. Omega-3 and Omega-6 Polyunsaturated Fatty Acid Levels and Correlations with Symptoms in Children with Attention Deficit Hyperactivity Disorder, Autistic Spectrum Disorder and Typically Developing Controls. PLoS ONE 2016, 11, e0156432. [Google Scholar] [CrossRef] [PubMed]
  53. Yui, K.; Imataka, G.; Kawasak, Y.; Yamada, H. Increased omega-3 polyunsaturated fatty acid/arachidonic acid ratios and upregulation of signaling mediator in individuals with Autism Spectrum Disorders. Life Sci. 2016, 145, 205–212. [Google Scholar] [CrossRef] [PubMed]
  54. Yui, K.; Koshiba, M.; Nakamura, S.; Kobayashim, Y.; Ohnishi, M. Efficacy of Adding Large Doses of Arachidonic Acid to Docosahexaenoic Acid against Restricted Repetitive Behaviors in Individuals with Autism Spectrum Disorders: A Placebo-Controlled Trial. J. Addict. Res.Ther. 2011. [Google Scholar] [CrossRef]
  55. Voigt, R.G.; Mellon, M.W.; Katusic, S.K.; Weaver, A.L.; Matern, D.; Mellon, B.; Jensen, C.L.; Barbaresi, W.J. Dietary docosahexaenoic acid supplementation in children with autism. J. Pediatr. Gastroenterol. Nutr. 2014, 58, 715–722. [Google Scholar] [PubMed]
  56. Parellada, M.; Llorente, C.; Calvo, R.; Gutierrez, S.; Lazaro, L.; Graell, M.; Alvarez, M.; Guisasola, M.; Dulin, E.; Dorado, M.L.; et al. Double-blind crossed-over randomized controlled-trial with omega-3 fatty acids for Autism Spectrum Disorders. Eur. Neuropsychopharmacol. 2015, 25, S138. [Google Scholar] [CrossRef]
  57. Yui, K.; Koshiba, M.; Nakamura, S.; Kobayashi, Y. Effects of Large Doses of Arachidonic Acid Added to Docosahexaenoic Acid on Social Impairment in Individuals With Autism Spectrum Disorders: A Double-Blind, Placebo-Controlled, Randomized Trial. J. Clin. Psychopharmacol. 2012, 32, 200–206. [Google Scholar] [CrossRef] [PubMed]
  58. Esparham, A.E.; Smith, T.; Belmont, J.M.; Haden, M.; Wagner, L.E.; Evans, R.G.; Drisko, J.A. Nutritional and Metabolic Biomarkers in Autism Spectrum Disorders: An Exploratory Study. Integr. Med. 2015, 14, 40–53. [Google Scholar]
  59. Wang, H.; Liang, S.; Wang, M.; Gao, J.; Sun, C.; Wang, J.; Xia, W.; Wu, S.; Sumner, S.J.; Zhang, F.; et al. Potential serum biomarkers from a metabolomics study of autism. J. Psychiatry Neurosci. 2016, 41, 27–37. [Google Scholar] [CrossRef] [PubMed]
  60. Wiest, M.M.; German, J.B.; Harvey, D.J.; Watkins, S.M.; Hertz-Picciotto, I. Plasma fatty acid profiles in autism: A case-control study. Prostaglandins Leukot. Essent. Fatty Acids 2009, 80, 221–227. [Google Scholar] [CrossRef] [PubMed]
  61. Pastural, É.; Ritchie, S.; Lu, Y.; Jin, W.; Kavianpour, A.; Khine, S.-M.K.; Heath, D.; Wood, P.L.; Fisk, M.; Goodenowe, D.B. Novel plasma phospholipid biomarkers of autism: Mitochondrial dysfunction as a putative causative mechanism. Prostaglandins Leukot. Essent. Fatty Acids 2009, 81, 253–264. [Google Scholar] [CrossRef] [PubMed]
  62. Bell, J.G.; Sargent, J.R.; Tocher, D.R.; Dick, J.R. Red blood cell fatty acid compositions in a patient with Autistic Spectrum Disorder: A characteristic abnormality in neurodevelopmental disorders? Prostaglandins Leukot. Essent. Fatty Acids 2000, 63, 21–25. [Google Scholar] [CrossRef] [PubMed]
  63. Yui, K.; Imataka, G.; Kawasaki, Y. Competitive Interaction Between Plasma Omega-3 Fatty Acids and Arachidonic Acid is Related to Down-Regulation of A Signaling Mediator. Med. Chem. 2016, 12, 318–327. [Google Scholar] [CrossRef] [PubMed]
  64. Yui, K.; Imataka, G.; Kawasaki, Y.; Yamada, T. Down-regulation of Signaling Mediator in Related to Increased Ratio of Docosahexaenoic Acid/Arachidonic Acid in Individuals with Autism Spectrum Disorders. J. Transl. Med. Dev. Disord. 2015, 2, 1–9. [Google Scholar]
  65. El-Ansary, A.K.; Ben Bacha, A.G.; Al-Ayahdi, L.Y. Plasma fatty acids as diagnostic markers in autistic patients from Saudi Arabia. Lipids Health Dis. 2011, 10. [Google Scholar] [CrossRef] [PubMed]
  66. Bell, J.G.; MacKinlay, E.E.; Dick, J.R.; MacDonald, D.J.; Boyle, R.M.; Glen, A.C. Essential fatty acids and phospholipase A2 in Autistic Spectrum Disorders. Prostaglandins Leukot. Essent. Fatty Acids 2004, 71, 201–204. [Google Scholar] [CrossRef] [PubMed]
  67. Al-Farsi, Y.M.; Waly, M.I.; Deth, R.C.; Al-Sharbati, M.M.; Al-Shafaee, M.; Al-Farsi, O.; Al-Khaduri, M.M.; Al-Adawi, S.; Hodgson, N.W.; Gupta, I.; et al. Impact of nutrition on serum levels of docosahexaenoic acid among Omani children with autism. Nutrition 2013, 29, 1142–1146. [Google Scholar] [CrossRef] [PubMed]
  68. Tostes, M.H.; Polonini, H.C.; Mendes, R.; Brandao, M.A.; Gattaz, W.F.; Raposo, N.R. Fatty acid and phospholipase A2 plasma levels in children with autism. Trends Psychiatry Psychother. 2013, 35, 76–80. [Google Scholar] [CrossRef] [PubMed]
  69. Bent, S.; Bertoglio, K.; Ashwood, P.; Bostrom, A.; Hendren, R.L. A pilot randomized controlled trial of omega-3 fatty acids for Autism Spectrum Disorder. J. Autism Dev. Disord. 2011, 41, 545–554. [Google Scholar] [CrossRef] [PubMed]
  70. Bent, S.; Hendren, R.L.; Zandi, T.; Law, K.; Choi, J-E.; Widjaja, F.; Kalb, L.; Nestle, J.; Law, P. Internet-Based, Randomized, Controlled Trial of Omega-3 Fatty Acids for Hyperactivity in Autism. J. Am. Acad. Child Adolesc. Psychiatry 2014, 53, 658–666. [Google Scholar] [CrossRef] [PubMed]
  71. Hawkey, E.; Nigg, J.T. Omega-3 fatty acid and ADHD: Blood level analysis and meta-analytic extension of supplementation trials. Clin. Psychol. Rev. 2014, 34, 496–505. [Google Scholar] [CrossRef] [PubMed]
  72. Harris, W.S.; Pottala, J.V.; Varvel, S.A.; Borowski, J.J.; Ward, J.N.; McConnell, J.P. Erythrocyte omega-3 fatty acids increase and linoleic acid decreases with age: Observations from 160,000 patients. Prostaglandins Leukot Essent Fatty Acids 2013, 88, 257–263. [Google Scholar] [CrossRef] [PubMed]
  73. Laryea, M.; Cieslicki, P.; Diekmann, E.; Wendel, U. Age-dependent fatty acid composition of erythrocyte membrane phospholipids in healthy children. Z. Ernahrungswiss. 1990, 29, 284–294. [Google Scholar] [CrossRef] [PubMed]
  74. Evans, D.R.; Parikh, V.V.; Khan, M.M.; Coussons, C.; Buckley, P.F.; Mahadik, S.P. Red blood cell membrane essential fatty acid metabolism in early psychotic patients following antipsychotic drug treatment. Prostaglandins Leukot. Essent. Fatty Acids 2003, 69, 393–399. [Google Scholar] [CrossRef] [PubMed]
  75. Castano, A.; Cutanda, F.; Esteban, M.; Part, P.; Navarro, C.; Gomez, S.; Rosado, M.; Lopez, A.; Lopez, E.; Exley, K.; et al. Fish consumption patterns and hair mercury levels in children and their mothers in 17 EU countries. Environ. Res. 2015, 141, 58–68. [Google Scholar] [CrossRef] [PubMed]
  76. Flock, M.R.; Skulas-Ray, A.C.; Harris, W.S.; Etherton, T.D.; Fleming, J.A.; Kris-Etherton, P.M. Determinants of erythrocyte omega-3 fatty acid content in response to fish oil supplementation: A dose-response randomized controlled trial. J. Am. Heart Assoc. 2013, 2, e000513. [Google Scholar] [CrossRef] [PubMed]
  77. Lagerstedt, S.A.; Hinrichs, D.R.; Batt, S.M.; Magera, M.J.; Rinaldo, P.; McConnell, J.P. Quantitative determination of plasma c8-c26 total fatty acids for the biochemical diagnosis of nutritional and metabolic disorders. Mol. Genet. Metab. 2001, 73, 38–45. [Google Scholar] [CrossRef] [PubMed]
  78. Alessandri, J.M.; Extier, A.; Al-Gubory, K.H.; Harbeby, E.; Lallemand, M.S.; Linard, A.; Lavialle, M.; Guesnet, P. Influence of gender on DHA synthesis: The response of rat liver to low dietary alpha-linolenic acid evidences higher omega3 4-desaturation index in females. Eur. J. Nutr. 2012, 51, 199–209. [Google Scholar] [CrossRef] [PubMed]
  79. Katan, M.B.; Deslypere, J.P.; van Birgelen, A.P.; Penders, M.; Zegwaard, M. Kinetics of the incorporation of dietary fatty acids into serum cholesteryl esters, erythrocyte membranes, and adipose tissue: An 18-month controlled study. J. Lipid Res. 1997, 38, 2012–2022. [Google Scholar] [PubMed]
  80. Raine, A.; Portnoy, J.; Liu, J.; Mahoomed, T.; Hibbeln, J.R. Reduction in behavior problems with omega-3 supplementation in children aged 8–16 years: A randomized, double-blind, placebo-controlled, stratified, parallel-group trial. J. Child Psychol. Psychiatry 2015, 56, 509–520. [Google Scholar] [CrossRef] [PubMed]
  81. Sun, C.; Xia, W.; Zhao, Y.; Li, N.; Zhao, D.; Wu, L. Nutritional status survey of children with autism and typically developing children aged 4–6 years in Heilongjiang Province, China. J. Nutr. Sci. 2013, 2, e16. [Google Scholar]
  82. Wang, L.W.; Tancredi, D.J.; Thomas, D.W. The prevalence of gastrointestinal problems in children across the United States with Autism Spectrum Disorders from families with multiple affected members. J. Dev. Behav. Pediatr. 2011, 32, 351–360. [Google Scholar] [CrossRef] [PubMed]
  83. Mazurek, M.O.; Vasa, R.A.; Kalb, L.G.; Kanne, S.M.; Rosenberg, D.; Keefer, A.; Murray, D.S.; Freedman, B.; Lowery, L.A. Anxiety, sensory over-responsivity, and gastrointestinal problems in children with Autism Spectrum Disorders. J. Abnorm. Child Psychol. 2013, 41, 165–176. [Google Scholar] [CrossRef] [PubMed]
  84. Chaidez, V.; Hansen, R.L.; Hertz-Picciotto, I. Gastrointestinal problems in children with autism, developmental delays or typical development. J. Autism Dev. Disord. 2014, 44, 1117–1127. [Google Scholar] [CrossRef] [PubMed]
  85. Agid, O.; Siu, C.O.; Potkin, S.G.; Kapur, S.; Watsky, E.; Vanderburg, D.; Zipursky, R.B.; Remington, G. Meta-regression analysis of placebo response in antipsychotic trials, 1970–2010. Am. J. Psychiatry 2013, 170, 1335–1344. [Google Scholar] [CrossRef] [PubMed]
  86. Masi, A.; Lampit, A.; Glozier, N.; Hickie, I.B.; Guastella, A.J. Predictors of placebo response in pharmacological and dietary supplement treatment trials in pediatric Autism Spectrum Disorder: A meta-analysis. Transl. Psychiatry 2015, 5, e640. [Google Scholar] [CrossRef] [PubMed]
  87. King, B.H.; Dukes, K.; Donnelly, C.L.; Sikich, L.; McCracken, J.T.; Scahill, L.; Hollander, E.; Bregman, J.D.; Anagnostou, E.; Robinson, F.; et al. Baseline factors predicting placebo response to treatment in children and adolescents with Autism Spectrum Disorders: A multisite randomized clinical trial. JAMA Pediatr. 2013, 167, 1045–1052. [Google Scholar] [CrossRef] [PubMed]
  88. Das, U.N. Autism as a disorder of deficiency of brain-derived neurotrophic factor and altered metabolism of polyunsaturated fatty acids. Nutrition 2013, 29, 1175–1185. [Google Scholar] [CrossRef] [PubMed]
  89. Das, U.N. Nutritional factors in the pathobiology of autism. Nutrition 2013, 29, 1066–1069. [Google Scholar] [CrossRef] [PubMed]
  90. Singh, M. Essential fatty acids, DHA and human brain. Indian J. Pediatr. 2005, 72, 239–242. [Google Scholar] [CrossRef] [PubMed]
  91. Petropoulos, H.; Friedman, S.D.; Shaw, D.W.; Artru, A.A.; Dawson, G.; Dager, S.R. Gray matter abnormalities in Autism Spectrum Disorder revealed by T2 relaxation. Neurology 2006, 67, 632–636. [Google Scholar] [CrossRef] [PubMed]
  92. Rojas, D.C.; Peterson, E.; Winterrowd, E.; Reite, M.L.; Rogers, S.J.; Tregellas, J.R. Regional gray matter volumetric changes in autism associated with social and repetitive behavior symptoms. BMC Psychiatry 2006, 6, 56. [Google Scholar] [CrossRef] [PubMed]
  93. Pryweller, J.R.; Schauder, K.B.; Anderson, A.W.; Heacock, J.L.; Foss-Feig, J.H.; Newsom, C.R.; Loring, W.A.; Cascio, C.J. White matter correlates of sensory processing in autism spectrum disorders. NeuroImage Clin. 2014, 6, 379–387. [Google Scholar] [CrossRef] [PubMed]
  94. Conklin, S.M.; Gianaros, P.J.; Brown, S.M.; Yao, J.K.; Hariri, A.R.; Manuck, S.B.; Muldoon, M.F. Long-chain omega-3 fatty acid intake is associated positively with corticolimbic gray matter volume in healthy adults. Neurosci. Lett. 2007, 421, 209–212. [Google Scholar] [CrossRef] [PubMed]
  95. Murphy, M.G. Dietary fatty acids and membrane protein function. J. Nutr. Biochem. 1990, 1, 68–79. [Google Scholar] [CrossRef]
  96. Ibarguren, M.; López, D.J.; Escribá, P.V. The effect of natural and synthetic fatty acids on membrane structure, microdomain organization, cellular functions and human health. Biochim. Biophys. Acta 2014, 1838, 1518–1528. [Google Scholar] [CrossRef] [PubMed]
  97. Donahue, R.J.; Venkataraman, A.; Carroll, F.I.; Meloni, E.G.; Carlezon, W.A., Jr. Pituitary adenylate cyclase activating polypeptide disrupts motivation, social interaction, and attention in male Sprague-Dawley rats. Biol. Psychiatry 2016, 80, 955–964. [Google Scholar] [CrossRef] [PubMed]
  98. Abu Shmais, G.A.; Al-Ayadhi, L.Y.; Al-Dbass, A.M.; El-Ansary, A.K. Mechanism of nitrogen metabolism-related parameters and enzyme activities in the pathophysiology of autism. J. Neurodev. Disord. 2012, 4, 4. [Google Scholar] [CrossRef] [PubMed]
  99. Cao, D.; Xue, R.; Xu, J.; Liu, Z. Effects of docosahexaenoic acid on the survival and neurite outgrowth of rat cortical neurons in primary cultures. J. Nutr. Biochem. 2005, 16, 538–546. [Google Scholar] [CrossRef] [PubMed]
  100. Mita, T.; Mayanagi, T.; Ichijo, H.; Fukumoto, K.; Otsuka, K.; Sakai, A.; Sobue, K. Docosahexaenoic acid promotes axon outgrowth by translational regulation of tau and collapsin response mediator protein 2 expression. J. Biol. Chem. 2016, 291, 4955–4965. [Google Scholar] [CrossRef] [PubMed]
  101. Liu, Z.-H.; Yip, P.K.; Adams, L.; Davies, M.; Lee, J.W.; Michael, G.J.; Priestley, J.V.; Michael-Titus, A.T. A single bolus of docosahexaenoic acid promotes neuroplastic changes in the innervation of spinal cord interneurons and motor neurons and improves functional recovery after spinal cord injury. J. Neurosci. 2015, 35, 12733–12752. [Google Scholar] [CrossRef]
  102. Robson, L.G.; Dyall, S.; Sidloff, D.; Michael-Titus, A.T. Omega-3 polyunsaturated fatty acids increase the neurite outgrowth of rat sensory neurones throughout development and in aged animals. Neurobiol. Aging 2010, 31, 678–687. [Google Scholar] [CrossRef] [PubMed]
  103. Calderon, F.; Kim, H.Y. Docosahexaenoic acid promotes neurite growth in hippocampal neurons. J. Neurochem. 2004, 90, 979–988. [Google Scholar] [CrossRef] [PubMed]
  104. Nakato, M.; Matsuo, M.; Kono, N.; Arita, M.; Arai, H.; Ogawa, J.; Kioka, N.; Ueda, K. Neurite outgrowth stimulation by n-3 and n-6 PUFAs of phospholipids in apoE-containing lipoproteins secreted from glial cells. J. Lipid Res. 2015, 56, 1880–1890. [Google Scholar] [CrossRef] [PubMed]
  105. Zikopoulos, B.; Barbas, H. Changes in prefrontal axons may disrupt the network in autism. J. Neurosci. 2010, 30, 14595–14609. [Google Scholar] [CrossRef] [PubMed]
  106. Zikopoulos, B.; Barbas, H. Altered neural connectivity in excitatory and inhibitory cortical circuits in autism. Front. Hum. Neurosci. 2013, 7, 609. [Google Scholar] [CrossRef] [PubMed]
  107. Kasarpalkar, N.J.; Kothari, S.T.; Dave, U.P. Brain-derived neurotrophic factor in children with autism spectrum disorder. Ann. Neurosci. 2014, 21, 129–133. [Google Scholar] [CrossRef] [PubMed]
  108. Bryn, V.; Halvorsen, B.; Ueland, T.; Isaksen, J.; Kolkova, K.; Ravn, K.; Skjeldal, O.H. Brain derived neurotrophic factor (BDNF) and Autism Spectrum Disorders (ASD) in childhood. Eur. J. Paediatr. Neurol. 2015, 19, 411–414. [Google Scholar] [CrossRef] [PubMed]
  109. Wu, A.; Ying, Z.; Gomez-Pinilla, F. Dietary omega-3 fatty acids normalize BDNF levels, reduce oxidative damage, and counteract learning disability after traumatic brain injury in rats. J. Neurotrauma 2004, 21, 1457–1467. [Google Scholar] [CrossRef] [PubMed]
  110. Martineau, J.; Barthelemy, C.; Jouve, J.; Muh, J.P.; Lelord, G. Monoamines (serotonin and catecholamines) and their derivatives in infantile autism: Age-related changes and drug effects. Dev. Med. Child Neurol. 1992, 34, 593–603. [Google Scholar] [CrossRef] [PubMed]
  111. Nakamura, K.; Sekine, Y.; Ouchi, Y.; Tsujii, M.; Yoshikawa, E.; Futatsubashi, M.; Tsuchiya, K.J.; Sugihara, G.; Iwata, Y.; Suzuki, K.; et al. Brain serotonin and dopamine transporter bindings in adults with high-functioning autism. Arch. Gen. Psychiatry 2010, 67, 59–68. [Google Scholar] [CrossRef] [PubMed]
  112. Chugani, D.C.; Muzik, O.; Behen, M.; Rothermel, R.; Janisse, J.J.; Lee, J.; Chugani, H.T. Developmental changes in brain serotonin synthesis capacity in autistic and nonautistic children. Ann. Neurol. 1999, 45, 287–295. [Google Scholar] [CrossRef]
  113. Mulder, E.J.; Anderson, G.M.; Kema, I.P.; de Bildt, A.; van Lang, N.D.; den Boer, J.A.; Minderaa, R.B. Platelet serotonin levels in pervasive developmental disorders and mental retardation: Diagnostic group differences, within-group distribution, and behavioral correlates. J. Am. Acad. Child Adolesc. Psychiatry 2004, 43, 491–499. [Google Scholar] [CrossRef] [PubMed]
  114. Husarova, V.M.; Lakatosova, S.; Pivovarciova, A.; Babinska, K.; Bakos, J.; Durdiakova, J.; Kubranska, A.; Ondrejka, I.; Ostatnikova, D. Plasma oxytocin in children with autism and its correlations with behavioral parameters in children and parents. Psychiatry Investig. 2016, 13, 174–183. [Google Scholar] [CrossRef] [PubMed]
  115. Modahl, C.; Green, L.; Fein, D.; Morris, M.; Waterhouse, L.; Feinstein, C.; Levin, H. Plasma oxytocin levels in autistic children. Biol. Psychiatry 1998, 43, 270–277. [Google Scholar] [CrossRef]
  116. Horder, J.; Lavender, T.; Mendez, M.A.; O’Gorman, R.; Daly, E.; Craig, M.C.; Lythgoe, D.J.; Barker, G.J.; Murphy, D.G. Reduced subcortical glutamate/glutamine in adults with Autism Spectrum Disorders: A [lsqb]1H[rsqb]MRS study. Transl. Psychiatry 2013, 3, e279. [Google Scholar] [CrossRef] [PubMed] [Green Version]
  117. Delion, S.; Chalon, S.; Herault, J.; Guilloteau, D.; Besnard, J.C.; Durand, G. Chronic dietary alpha-linolenic acid deficiency alters dopaminergic and serotoninergic neurotransmission in rats. J. Nutr. 1994, 124, 2466–2476. [Google Scholar] [PubMed]
  118. Zimmer, L.; Hembert, S.; Durand, G.; Breton, P.; Guilloteau, D.; Besnard, J.C.; Chalon, S. Chronic n-3 polyunsaturated fatty acid diet-deficiency acts on dopamine metabolism in the rat frontal cortex: A microdialysis study. Neurosci. Lett. 1998, 240, 177–181. [Google Scholar] [CrossRef]
  119. Kodas, E.; Galineau, L.; Bodard, S.; Vancassel, S.; Guilloteau, D.; Besnard, J.C.; Chalon, S. Serotoninergic neurotransmission is affected by n-3 polyunsaturated fatty acids in the rat. J. Neurochem. 2004, 89, 695–702. [Google Scholar] [CrossRef] [PubMed]
  120. Moreira, J.D.; Knorr, L.; Ganzella, M.; Thomazi, A.P.; de Souza, C.G.; de Souza, D.G.; Pitta, C.F.; Mello e Souza, T.; Wofchuk, S.; Elisabetsky, E.; et al. Omega-3 fatty acids deprivation affects ontogeny of glutamatergic synapses in rats: Relevance for behavior alterations. Neurochem. Int. 2010, 56, 753–759. [Google Scholar] [CrossRef] [PubMed]
  121. Kim, H.-Y.; Spector, A.A.; Xiong, Z.-M. A synaptogenic amide N-docosahexaenoylethanolamide promotes hippocampal development. Prostaglandins Other Lipid Mediat. 2011, 96, 114–120. [Google Scholar] [CrossRef] [PubMed]
  122. Naik, U.S.; Gangadharan, C.; Abbagani, K.; Nagalla, B.; Dasari, N.; Manna, S.K. A Study of nuclear transcription factor-kappa b in childhood autism. PLoS ONE 2011, 6, e19488. [Google Scholar] [CrossRef] [PubMed]
  123. Inga Jácome, M.; Morales Chacòn, L.M.; Vera Cuesta, H.; Maragoto Rizo, C.; Whilby Santiesteban, M.; Ramos Hernandez, L.; Noris García, E.; González Fraguela, M.E.; Fernandez Verdecia, C.I.; Vegas Hurtado, Y.; et al. Peripheral Inflammatory Markers Contributing to Comorbidities in Autism. Behav. Sci. 2016, 6, 29. [Google Scholar] [CrossRef] [PubMed]
  124. El-Ansary, A.; Hassan, W.M.; Qasem, H.; Das, U.N. Identification of biomarkers of impaired sensory profiles among autistic patients. PLoS ONE 2016, 11, e0164153. [Google Scholar] [CrossRef] [PubMed]
  125. El-Ansary, A.; Al-Ayadhi, L. Lipid mediators in plasma of autism spectrum disorders. Lipids Health Dis. 2012, 11, 1–9. [Google Scholar] [CrossRef] [PubMed]
  126. Adams, J.B.; Baral, M.; Geis, E.; Mitchell, J.; Ingram, J.; Hensley, A.; Zappia, I.; Newmark, S.; Gehn, E.; Rubin, R.A.; et al. The severity of autism is associated with toxic metal body burden and red blood cell glutathione levels. J. Toxicol. 2009, 2009, 532640. [Google Scholar] [CrossRef] [PubMed]
  127. SalLam, M.M.; Motaleb, F.I.A.; Ahmed, M.B.; Mahmoud, A.A. Anti-inflammatory effect of omega-3 polyunsaturated fatty acids in children with bronchial asthma; relation to nuclear factor-kappa B (NF-κB) and inflammatory cytokines IL-12 and IL-13. Egypt. J. Biochem. Mol. Biol. 2010, 28, 51–66. [Google Scholar]
  128. Zhang, R.; He, G.-Z.; Wang, Y.-K.; Zhou, K.-G.; Ma, E.-L. Omega-3 polyunsaturated fatty acids inhibit the increase in cytokines and chemotactic factors induced in vitro by lymph fluid from an intestinal ischemia-reperfusion injury model. Nutrition 2015, 31, 508–514. [Google Scholar] [CrossRef] [PubMed]
  129. Zhao, Y.; Joshi-Barve, S.; Barve, S.; Chen, L.H. Eicosapentaenoic acid prevents LPS-induced TNF-α expression by preventing NF-κB activation. J. Am. Coll. Nutr. 2004, 23, 71–78. [Google Scholar] [CrossRef] [PubMed]
  130. Allam-Ndoul, B.; Guénard, F.; Barbier, O.; Vohl, M.-C. Effect of n-3 fatty acids on the expression of inflammatory genes in THP-1 macrophages. Lipids Health Dis. 2016, 15, 69. [Google Scholar] [CrossRef] [PubMed]
  131. Mathias, R.A.; Sergeant, S.; Ruczinski, I.; Torgerson, D.G.; Hugenschmidt, C.E.; Kubala, M.; Vaidya, D.; Suktitipat, B.; Ziegler, J.T.; Ivester, P.; et al. The impact of FADS genetic variants on ω6 polyunsaturated fatty acid metabolism in African Americans. BMC Genet. 2011, 12, 50. [Google Scholar] [CrossRef] [PubMed]
  132. Abdelmagid, S.A.; Clarke, S.E.; Roke, K.; Nielsen, D.E.; Badawi, A.; El-Sohemy, A.; Mutch, D.M.; Ma, D.W.L. Ethnicity, sex, FADS genetic variation, and hormonal contraceptive use influence delta-5- and delta-6-desaturase indices and plasma docosahexaenoic acid concentration in young Canadian adults: A cross-sectional study. Nutr. Metab. (Lond.) 2015, 12, 14. [Google Scholar] [CrossRef] [PubMed]
  133. Chouinard-Watkins, R.; Plourde, M. Fatty acid metabolism in carriers of apolipoprotein e epsilon 4 allele: Is it contributing to higher risk of cognitive decline and coronary heart disease? Nutrients 2014, 6, 4452–4471. [Google Scholar] [CrossRef] [PubMed]
  134. Shimamoto, C.; Ohnishi, T.; Maekawa, M.; Watanabe, A.; Ohba, H.; Arai, R.; Iwayama, Y.; Hisano, Y.; Toyota, T.; Toyoshima, M.; et al. Functional characterization of FABP3, 5 and 7 gene variants identified in schizophrenia and autism spectrum disorder and mouse behavioral studies. Hum. Mol. Genet. 2014, 23, 6495–6511. [Google Scholar] [CrossRef] [PubMed]
Figure 1. Flow diagram for selection of studies (PRISMA flow diagram).
Nutrients 09 00155 g001
Figure 2. Forest plots of mean (95% confidence interval (CI)) weighted difference in blood levels of docosahexaenoic acid (DHA) (A); eicosapentaenoic acid (EPA) (B); and arachidonic acid (ARA) (C) between populations with Autism Spectrum Disorder (ASD) and typically developing controls stratified for subgroups with studies including all age groups (children, teenagers, and adults) vs. those including children only. Direction of effect (negative, lower mean in ASD group; positive, lower mean in control group; zero, no difference between groups).
Nutrients 09 00155 g002aNutrients 09 00155 g002b
Figure 3. Forest plots of mean (95% confidence interval (CI)) weighted difference in the ratio of arachidonic acid (ARA) to docosahexaenoic acid (DHA) (A) and the ratio of ARA to eicosapentaenoic acid (EPA) (B) between populations with Autism Spectrum Disorder (ASD) and typically developing children stratified for subgroups with studies including all age groups (children, teenagers, and adults) vs. young children only. Direction of effect (negative, lower mean in ASD group; positive, lower mean in control group; zero, no difference between groups).
Nutrients 09 00155 g003
Figure 4. Forest plots of mean (95% confidence interval (CI)) weighted difference in the total n-3 long chain polyunsaturated fatty acids (n-3 LCPUFA) (A) and total n-6 long chain polyunsaturated fatty acids (n-6 LCPUFA) (B) between populations with Autism Spectrum Disorder (ASD) and typically developing children stratified for subgroups with studies including all age groups (children, teenagers, and adults) vs. young children only. Direction of effect (negative, lower mean in ASD group; positive, lower mean in control group; zero, no difference between groups).
Nutrients 09 00155 g004
Figure 5. Forest plot of mean (95% confidence interval (CI)) weighted difference in the ratio of total n-6 long chain polyunsaturated fatty acids (n-6 LCPUFA) to total n-3 long chain polyunsaturated fatty acids (n-3 LCPUFA) between populations with Autism Spectrum Disorder (ASD) and typically developing children stratified for subgroups with studies including all age groups (children, teenagers, and adults) vs. young children only. Direction of effect (negative, lower mean in ASD group; positive, lower mean in control group; zero, no difference between groups).
Nutrients 09 00155 g005
Figure 6. Forest plot of mean (95% confidence interval (CI)) fixed difference in change in social interaction (ABC) (A); communication (ABC) (B); and repetitive and restricted interests and behaviours (ABC) (C) in populations with Autism Spectrum Disorder (ASD) receiving n-3 long chain polyunsaturated fatty acid supplementation (LCPUFA) and placebo. Direction of effect (negative, more improvement in n-3 LCPUFA groups; positive, more improvement in placebo group; zero, no difference between groups).
Nutrients 09 00155 g006aNutrients 09 00155 g006b
Figure 7. Forest plot of mean (95% confidence interval (CI)) fixed difference in change in hyperactivity (ABC) (A) and irritability (ABC) (B) in populations with Autism Spectrum Disorder (ASD) receiving n-3 long chain polyunsaturated fatty acid supplementation (n-3 LCPUFA) and placebo. Direction of effect (negative, more improvement in n-3 LCPUFA group; positive, more improvement in placebo group; zero, no difference between groups).
Nutrients 09 00155 g007
Table 1. Characteristics of case-control studies included in meta-analysis 1.
Reference and SettingCases CharacteristicsControls CharacteristicsMatchingOutcomeQuality Score †
NCondition, Classification System, Tools ᵟAge (Years) *Sex (M, F)NHealth ConditionAge (Years) *Sex (M, F)Blood Tissue TypeFasting State (Length)Values Reported asFA and Ratios Compared and the Direction of Difference
Al-Farsi (2013) [67] Oman40Autism, based on DSM-IV, NR4.1 (0.9)NR40Healthy and TD4.1 (0.8)NRAge SexSerumNRµg/mLDHA ↓6
Bell (2004) [66] UK2911 classical autism and 18 regressive autism, NR, NRNRNR55Healthy and TDNRNRNoneRBCNR% of total FATotal n3 ↓ DHA ↓ EPA ↓ Total ↔ ARA ↔ ARA/EPA ↑4
Bell (2010) [27] UK45Autism, based on DSM-IV and ICD-10, ADI-R7.5 (3.5)39 M, 5 F52Healthy and TD7.5 (3.6)49 M, 3 FAge Sex (45 pairs matched)RBC PlasmaNR% of total FATotal n3 1 ↔ DHA ↔ EPA ↔ Total ↔ ARA ↔ Total n6/n3 2↑ ARA/EPA ↑8
Brigandi (2015) [24] US121Autism (but not Asperger or PDD-NOS), based on DSM-IV, CARS3–17 **NR110Non autistic and developmentally delayed3–17 **NRNRRBCNo% of total FATotal n3 ↓ DHA ↓ EPA ↔ Total n6 ↓ ARA ↓ Total n6/n3 2↑6
Bu (2006) [28] US40Autism and regressive autism, based on DSM-IV and ICD-10, ADI-R and ADOS3.6 ***37 M, 3 F20TD3.5 ***16 M, 4 FAge Sex Geographical residential areaRBCYes (2 h)% of total FATotal n3 ↔ DHA ↔ EPA ↔ Total ↔ ARA ↔ ARA/EPA ↔8
El-Ansari (2011a) [50] Saudi 25Autism, NR, ADI-R, ADOS, 3di4–12 **NR16Healthy and TD4–11 **NRAgePlasmaYes (10 h)mmol/LARA/DHA ↓7
El-Ansari (2011b) [65] Saudi Arabia22Autism, NR, ADI-R, ADOS, 3di4–12 **NR26Healthy and TD4–11 **NRAgePlasmaYes (10 h)mmol/LDHA ↓ EPA ↔ ARA ↓7
Ghezz (2013) [14] Italy21Autism, DSM-IV, ADOS and CARS6.8 (2.2)17 M, 4 F20Healthy and TD7.6 (1.9)14 M, 6 FAge SexSerumNR% of total FADHA ↓ EPA ↓ ARA ↔ Total n6/n3 ↑11
Jory (2016) [51] Canada11Autism, DSM (version NR), NR3.9 (1.7)8M, 3F15Healthy and TD3.9 (1.1)6 M, 9 FAgeRBC SerumYes (NR)% of total FADHA 1 ↓ EPA ↓ ARA ↓ Total n6/n3 ↑ ARA/DHA ↔ ARA/EPA ↔7
Meguid (2008) [30] Egypt30Autism, DSM-IV, clinical evaluations and CARS3–11 **18 M, 12 F30Healthy and TDNRNRAge SexWhole bloodNRµg/mLDHA ↓ ARA ↓ ARA/DHA ↓7
Mostafa (2015) [26] Egypt80Autism, DSM-IV, clinical evaluation and CARS7.4 (3.3)66 M, 14 F80Healthy and TD7.3 (3.1)66 M, 14 FAge SexPlasmaNRmmol/LDHA ↓ ARA ↓ ARA/DHA ↑8
Parletta (2016) [52] Australia85Autism, clinical evaluation and CARS5.3 (2.1) ^68 M, 17 F79Healthy and TD8.3 (2.5) ^61 M, 18 FSexRBCNR% of total FADHA ↓ EPA ↓ ARA ↓ Total n6/n3 ↑ ARA/EPA ↑9
Sliwinski (2006) [49] Belgium18Autism with IQ > 55 and post pubertal, DSM-IV, ADI-R12–20 **Only male22TD post pubertal12–22Only maleNonePlasmaYes (overnight)% of total FATotal n3 ↑ DHA ↑ EPA ↔ Total n6 ↔ ARA ↔ Total n6/n3 2↓8
Tostes (2013) [68] Brazil24Autism, DSM-IV, clinical evaluation7.4 (2.9)18M, 6F24Healthy and TD7.2 (1.8)18 M, 6 FAge sexPlasmaNR% of total FADHA ↓ EPA ↓ ARA ↑ ARA/DHA 3 ↑ ARA/EPA 3 ↑9
Yui (2016) [53] Japan28Autism with IQ/70, DSM-IV, ADI-R13.5 (4.7)20M, 8F21Healthy and TD13.9 (5.7)15 M, 6 FAge Sex IQ Eating habit Home environmentPlasmaNR% of total FA and µg/mLDHA 4 ↑ EPA ↑ ARA ↓ ARA/DHA ↓ ARA/EPA ↓8
ᵟ Psychological assessment tools used to confirm ASD diagnosis. * Reported as mean (SD) unless otherwise stated. † Health Canada Quality Appraisal Tool for Observational Studies; A quality score of ≥7 was considered higher quality [47]. ** Inclusion criteria. *** Median. ^ Significantly different. ↓ Cases had lower levels than controls (p < 0.05). ↑ Cases had higher levels than controls (p < 0.05). ↔ No difference across groups (p > 0.05). 1 RBC values are reported. 2 A borderline significance. 3 The significance was not reported. 4 % of total fatty acids is reported. ADI-R, Autism Diagnostic Interview-Revised; ADOS, Autism Diagnostic Observation Schedule; ARA, arachidonic acid; CARS, Childhood Autism Rating Scale; DHA, docosahexaenoic acid; DSM-IV, Diagnostic and Statistical Manual of Mental Disorder-Fourth Edition; EPA, eicosapentaenoic acid; F, female; FA, fatty acids; M, male; N, number of participants; NR, not reported; RBC, red blood cell; TD, typically developing; 3di, the Developmental, Dimensional, and Diagnostic Interview.
Table 2. Study characteristics of randomised controlled trials (RCTs) included in systematic literature review.
RCTs included in Meta-Analysis 2 (n = 4)
Reference and SettingAge (Years)Sex Distribution (M, F)Sample sizeInterventionDurationOutcome MeasureOutcomeQuality Score †
ActivePlacebo
Amminger (2007) [36] Austria Pilot5–17All maleIntervention (n = 7) Placebo (n = 6, 1 lost)0.84 g/day EPA 0.7 g/day DHA7 g/day coconut oil6 weeksABCNo significant differences between groups at 6 weeks, but a greater change in hyperactivity and stereotypy subscale with a large effect size in the omega-3 group than placebo (7 and 2.4 units, effect size of 0.71 and 0.72, respectively). Well tolerated and safe.10
Ben (2011) [69] US Pilot3–824 M, 3 FIntervention (n = 14, 1 lost and 4discontinued) Placebo (n = 13, 1 lost and 2 discontinued)0.7 g/day EPA 0.46 g/day DHAOrange flavoured pudding containing safflower oil12 weeksABC PPVT EVT BASC SRS CGI-SSignificant increase in the percentage of serum omega-3 fatty acids. No significant differences in all measure across groups. Non-significant greater improvement in hyperactivity subscale in omega-3 group than placebo (2.7 vs. 0.3 units, effect size of 0.38). Decreases in some fatty acids correlated with decreased in hyperactivity. Well tolerated and safe.13
Bent (2014) [70] US Internet-based5–850 M, 7 FIntervention (n = 29, 8 discontinued and 2 improper enrolment) Placebo (n = 28, 4 discontinued and 1 improper enrolment)0.7 g/day EPA 0.46 g/day DHAOrange flavoured pudding containing safflower oil6 weeksABC-(parent and teacher) SRS CGI-INo significant differences in changes in SRS and CGI-I between groups. Non-significant greater improvement in hyperactivity subscale in omega-3 group than placebo (−5.3 vs. −3.4, effect size of 0.26). Significantly greater improvements in stereotypy and lethargy subscales (p = 0.05 and 0.01, respectively). Well tolerated and safe.13
Yui (2011 and 2012) * [54,57] Japan Pilot6–2812 M, 1 FIntervention (n = 7) Placebo (n = 6)0.24 g/day DHA 0.24 g/day AAOlive oil16 weeksABC ADI-R SRSSignificant increase in plasma AA. No differences in plasma DHA and EPA. Significant improvement in social withdrawal subscale of ABC (p = 0.04) and stereotyped and repetitive behaviours of ADI-R (p = 0.04). Significant improvement in communication subscale of SRS reported in both treatment and placebo groups, though the effect size was more favourable for the treatment group than placebo group (0.87 vs. 0.44, respectively). Safe.10
RCTs Not included in the Meta-Analysis 2 but included in the Overall Interpretation (n = 2)
Reference and SettingAge (Years)Sex Distribution (M, F)Sample SizeInterventionDurationOutcome MeasureOutcomeQuality Score †
ActivePlacebo
Mankad (2015) [37] Canada2–527 M, 10 FIntervention (n = 19, 4 drop outs) Placebo (n = 19, 2 drop outs) Stratified by severity1.5 g/day EPA + DHARefined olive oil in medium chain triglyceride6 monthsPDDBI BASC-2 CGI-I VABS-II PLS-4No significant differences between groups in all measures at 6 months, but mild improvement in BASC-2 externalising subscale in placebo but worsening in omega-3 group (−3 vs. 3, respectively, p = 0.02) Relatively well tolerated and safe.13
Voigt (2014) [55] US3–1040 M, 8 FIntervention (n = 24, 5 discontinued) Placebo (n = 24, 9 discontinued) Stratified by age0.2 g/day DHA0.25 g/day corn oil + 0.25 g/day soybean oil6 monthsCGI-I CDI ABC BASC431% increase in plasma phospholipid DHA No significant differences in the percentage with a positive response (CGI-I) across groups and in all other measures across groups. Well tolerated and safe.13
† Health Canada Quality Appraisal Tool for Experimental Studies; A quality score of ≥8 was considered higher quality [47]. * Different outcomes from the same group of participants were reported in two different papers. AA, arachidonic acid; ABC, Aberrant Behaviour Checklist; ADI-R, Autism Diagnostic Interview-Revised; BASC, Behaviour Assessment System for Children; CDI, Child Development Inventory; CGI-I, Clinical Global Impression-Improvement; CGI-S, Clinical Global Impression-Severity; DHA, docosahexanoic acid; EPA, eicosapentanoic acid; EVT, Expressive Vocabulary Test; F, Female; M, Male; n, Number; PDDBI, Pervasive Developmental Disorders Behavioural Inventory; PLS-4, Preschool Language Scale; PPVT, Peabody Picture Vocabulary Test; SRS, Social Responsiveness Scale; US, United States; VABS-II, Vineland Adaptive Behaviour Scale.

