Efficacy and Effectiveness of Carnitine Supplementation for Cancer-Related Fatigue: A Systematic Literature Review and Meta-Analysis

 , , and
Abstract
:1. Introduction
2. Methods
2.1. Eligibility Criteria
2.2. Data Collection and Extraction
2.3. Assessment of Study Quality
2.4. Data Synthesis
3. Results
3.1. Study Characteristics
3.2. Carnitine Regimens
3.3. Outcome Measures
3.4. Compliance Measures
3.5. Quality Rating
3.6. Intervention Results on Cancer-Related Fatigue
3.7. Adverse Events
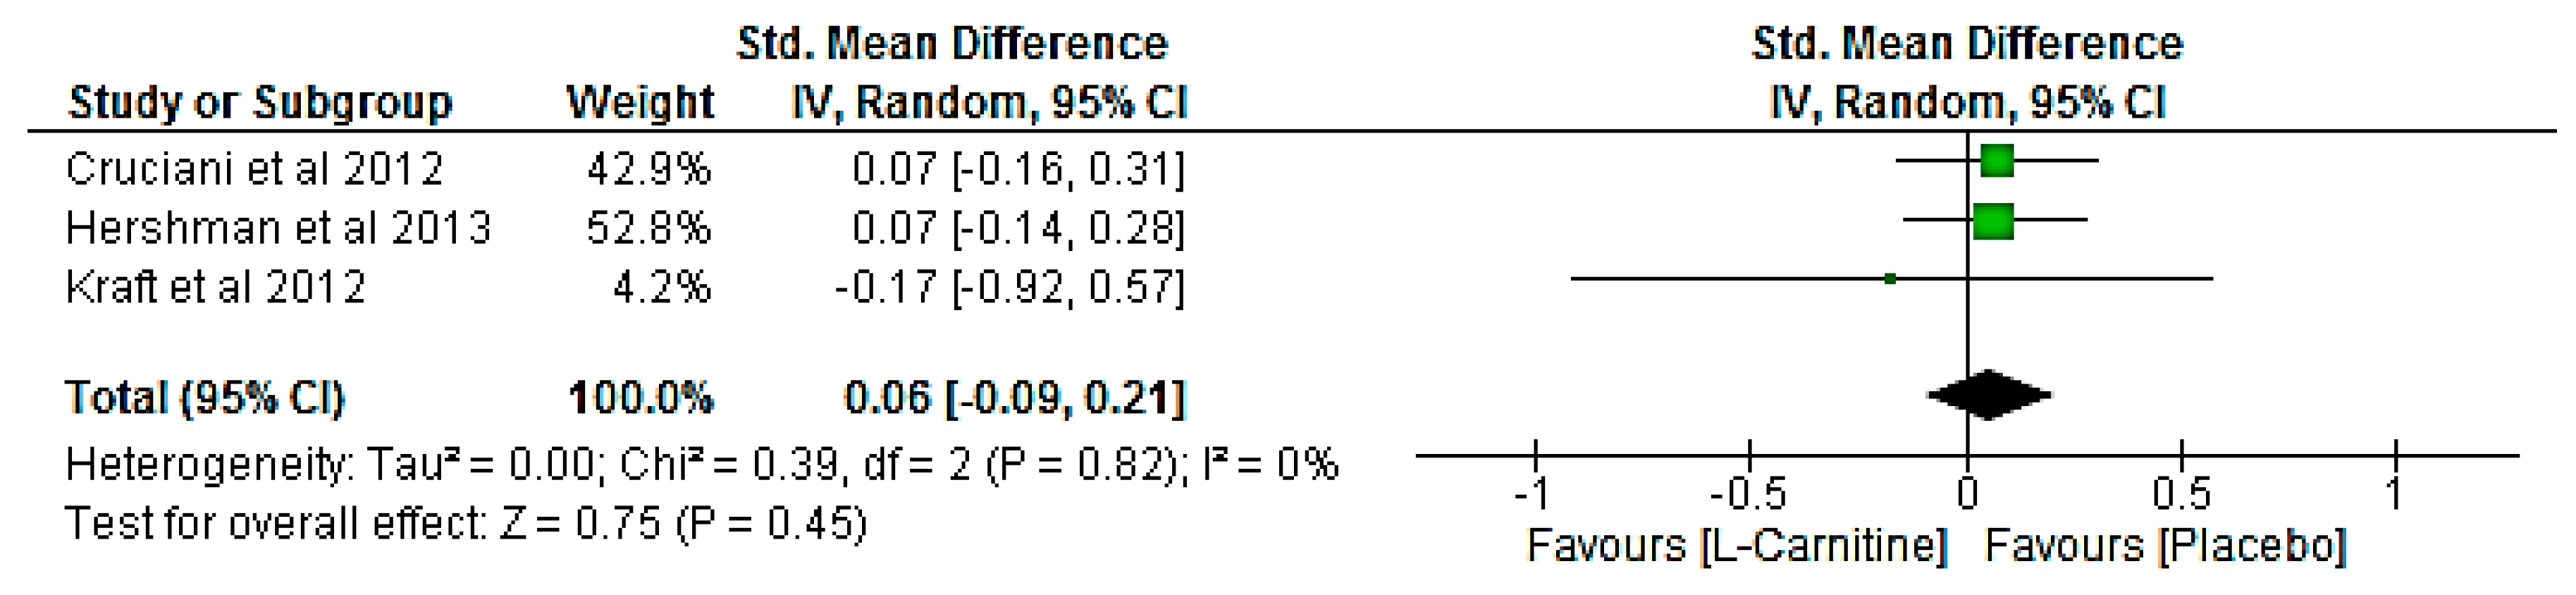
3.8. Meta-Analysis
4. Discussion
Future Directions and Clinical Implications
5. Conclusions
Acknowledgments
Author Contributions
Conflicts of Interest
References
- Lawrence, D.P.; Kupelnick, B.; Miller, K.; Devine, D.; Lau, J. Evidence report on the occurrence, assessment and treatment of fatigue in cancer patients. J. Natl. Cancer Inst. Monogr. 2004. [Google Scholar] [CrossRef] [PubMed]
- Carelle, N.; Piotto, E.; Bellanger, A.; Germanaud, J.; Thuillier, A.; Khayat, D. Changing patient perceptions of the side effects of cancer chemotherapy. Cancer 2002, 95, 155–163. [Google Scholar] [CrossRef] [PubMed]
- Curt, G.A.; Breitbart, W.; Cella, D.; Groopman, J.E.; Horning, S.J.; Itri, L.M.; Johnson, D.H.; Miaskowski, C.; Scherr, S.L.; Portenoy, R.K.; et al. Impact of cancer-related fatigue on the lives of patients: New findings from the Fatigue Coalition. Oncologist 2000, 5, 353–360. [Google Scholar] [CrossRef] [PubMed]
- Broeckel, J.A.; Jacobsen, P.B.; Horton, J.; Balducci, L.; Lyman, G.H. Characteristics and correlates of fatigue after adjuvant chemotherapy for breast cancer. J. Clin. Oncol. Off. J. Am. Soc. Clin. Oncol. 1998, 16, 1689–1696. [Google Scholar] [CrossRef] [PubMed]
- Curran, S.L.; Beacham, A.O.; Andrykowski, M.A. Ecological momentary assessment of fatigue following breast cancer treatment. J. Behav. Med. 2004, 27, 425–444. [Google Scholar] [CrossRef] [PubMed]
- Groenvold, M.; Petersen, M.A.; Idler, E.; Bjorner, J.B.; Fayers, P.M.; Mouridsen, H.T. Psychological distress and fatigue predicted recurrence and survival in primary breast cancer patients. Breast Cancer Res. Treat. 2007, 105, 209–219. [Google Scholar] [CrossRef] [PubMed]
- Quinten, C.; Maringwa, J.; Gotay, C.C.; Martinelli, F.; Coens, C.; Reeve, B.B.; Flechtner, H.; Greimel, E.; King, M.; Osoba, D.; et al. Patient self-reports of symptoms and clinician ratings as predictors of overall cancer survival. J. Natl. Cancer Inst. 2011, 103, 1851–1858. [Google Scholar] [CrossRef] [PubMed]
- Bower, J.E.; Ganz, P.A.; Desmond, K.A.; Bernaards, C.; Rowland, J.H.; Meyerowitz, B.E.; Belin, T.R. Fatigue in long-term breast carcinoma survivors: A longitudinal investigation. Cancer 2006, 106, 751–758. [Google Scholar] [CrossRef] [PubMed]
- Bower, J.E. Cancer-related fatigue mdash mechanisms, risk factors and treatments. Nat. Rev. Clin. Oncol. 2014, 11, 597–609. [Google Scholar] [CrossRef] [PubMed]
- Winter, S.C.; Szabo-Aczel, S.; Curry, C.J.; Hutchinson, H.T.; Hogue, R.; Shug, A. Plasma carnitine deficiency. Clinical observations in 51 pediatric patients. Am. J. Dis. Child. 1987, 141, 660–665. [Google Scholar] [CrossRef] [PubMed]
- Hockenberry, M.J.; Hooke, M.C.; Gregurich, M.; McCarthy, K. Carnitine plasma levels and fatigue in children/adolescents receiving cisplatin, ifosfamide, or doxorubicin. J. Pediatr. Hematol. Oncol. 2009, 31, 664–669. [Google Scholar] [CrossRef] [PubMed]
- Endo, K.; Tsuji, A.; Kondo, S.; Wakisaka, N.; Murono, S.; Yoshizaki, T. Carnitine is associated with fatigue following chemoradiotherapy for head and neck cancer. Acta Oto-Laryngol. 2015, 135, 846–852. [Google Scholar] [CrossRef] [PubMed]
- Marx, W.; Teleni, L.; Ferguson, M.; Walpole, E.; Isenring, E. The Effect of Chemotherapy on Serum Carnitine Levels and Fatigue in Chemotherapy Naïve Medical Oncology Patients: A Pilot Study. Carnitine, Chemotherapy and Fatigue. J. Nutr. Disord. Ther. 2014. [Google Scholar] [CrossRef]
- Mancinelli, A.; D’Iddio, S.; Bisonni, R.; Graziano, F.; Lippe, P.; Calvani, M. Urinary excretion of l-carnitine and its short-chain acetyl-l-carnitine in patients undergoing carboplatin treatment. Cancer Chemother. Pharmacol. 2007, 60, 19–26. [Google Scholar] [CrossRef] [PubMed]
- Marthaler, N.P.; Visarius, T.; Kupfer, A.; Lauterburg, B.H. Increased urinary losses of carnitine during ifosfamide chemotherapy. Cancer Chemother. Pharmacol. 1999, 44, 170–172. [Google Scholar] [CrossRef] [PubMed]
- Ringseis, R.; Keller, J.; Eder, K. Mechanisms underlying the anti-wasting effect of l-carnitine supplementation under pathologic conditions: Evidence from experimental and clinical studies. Eur. J. Nutr. 2013, 52, 1421–1442. [Google Scholar] [CrossRef] [PubMed]
- Moher, D.; Liberati, A.; Tetzlaff, J.; Altman, D.G.; PRISMA Group. Preferred Reporting Items for Systematic Reviews and Meta-Analyses: The PRISMA Statement. PLoS Med. 2009, 6, e1000097. [Google Scholar] [CrossRef] [PubMed]
- DerSimonian, R.; Laird, N. Meta-analysis in clinical trials. Control. Clin. Trials 1986, 7, 177–188. [Google Scholar] [CrossRef]
- Review Manager (RevMan). Available online: http://community.cochrane.org/tools/review-production-tools/revman-5 (accessed on 7 October 2017).
- Hershman, D.L.; Unger, J.M.; Crew, K.D.; Minasian, L.M.; Awad, D.; Moinpour, C.M.; Hansen, L.; Lew, D.L.; Greenlee, H.; Fehrenbacher, L.; et al. Randomized Double-Blind Placebo-Controlled Trial of Acetyl-l-Carnitine for the Prevention of Taxane-Induced Neuropathy in Women Undergoing Adjuvant Breast Cancer Therapy. J. Clin. Oncol. 2013. [Google Scholar] [CrossRef] [PubMed]
- Higgins, J.P.T.; Green, S. Cochrane Handbook for Systematic Reviews of Interventions; John Wiley & Sons: Hoboken, NJ, USA, 2011. [Google Scholar]
- Kraft, M.; Kraft, K.; Gärtner, S.; Mayerle, J.; Simon, P.; Weber, E.; Schütte, K.; Stieler, J.; Koula-Jenik, H.; Holzhauer, P.; et al. l-Carnitine-supplementation in advanced pancreatic cancer (CARPAN)—A randomized multicentre trial. Nutr. J. 2012, 11, 52. [Google Scholar] [CrossRef] [PubMed]
- Cruciani, R.A.; Dvorkin, E.; Homel, P.; Culliney, B.; Malamud, S.; Lapin, J.; Portenoy, R.K.; Esteban-Cruciani, N. l-carnitine supplementation in patients with advanced cancer and carnitine deficiency: A double-blind, placebo-controlled study. J. Pain Symptom Manag. 2009, 37, 622–631. [Google Scholar] [CrossRef] [PubMed]
- Cruciani, R.A.; Zhang, J.J.; Manola, J.; Cella, D.; Ansari, B.; Fisch, M.J. l-carnitine Supplementation for the Management of Fatigue in Patients With Cancer: An Eastern Cooperative Oncology Group Phase III, Randomized, Double-Blind, Placebo-Controlled Trial. J. Clin. Oncol. 2012, 30, 3864–3869. [Google Scholar] [CrossRef] [PubMed]
- Maccio, A.; Madeddu, C.; Gramignano, G.; Mulas, C.; Floris, C.; Sanna, E.; Cau, M.C.; Panzone, F.; Mantovani, G. A randomized phase III clinical trial of a combined treatment for cachexia in patients with gynaecological cancers: Evaluating the impact on metabolic and inflammatory profiles and quality of life. Gynecol. Oncol. 2012, 124, 417–425. [Google Scholar] [CrossRef] [PubMed]
- Mantovani, G.; Maccio, A.; Madeddu, C.; Serpe, R.; Massa, E.; Dessi, M.; Panzone, F.; Contu, P. Randomized phase III clinical trial of five different arms of treatment in 332 patients with cancer cachexia. Oncologist 2010, 15, 200–211. [Google Scholar] [CrossRef] [PubMed]
- Cruciani, R.A.; Dvorkin, E.; Homel, P.; Malamud, S.; Culliney, B.; Lapin, J.; Portenoy, R.K.; Esteban-Cruciani, N. Safety, tolerability and symptom outcomes associated with l-carnitine supplementation in patients with cancer, fatigue and carnitine deficiency: A phase I/II study. J. Pain Symptom Manag. 2006, 32, 551–559. [Google Scholar] [CrossRef] [PubMed]
- Gramignano, G.; Lusso, M.R.; Madeddu, C.; Massa, E.; Serpe, R.; Deiana, L.; Lamonica, G.; Dessi, M.; Spiga, C.; Astara, G.; et al. Efficacy of l-carnitine administration on fatigue, nutritional status, oxidative stress and related quality of life in 12 advanced cancer patients undergoing anticancer therapy. Nutrition 2006, 22, 136–145. [Google Scholar] [CrossRef] [PubMed]
- Iwase, S.; Kawaguchi, T.; Yotsumoto, D.; Doi, T.; Miyara, K.; Odagiri, H.; Kitamura, K.; Ariyoshi, K.; Miyaji, T.; Ishiki, H.; et al. Efficacy and safety of an amino acid jelly containing coenzyme Q10 and l-carnitine in controlling fatigue in breast cancer patients receiving chemotherapy: A multi-institutional, randomized, exploratory trial (JORTC-CAM01). Support. Care Cancer Off. J. Multinatl. Assoc. Support. Care Cancer 2016, 24, 637–646. [Google Scholar] [CrossRef] [PubMed]
- Madeddu, C.; Dessi, M.; Panzone, F.; Serpe, R.; Antoni, G.; Cau, M.C.; Montaldo, L.; Mela, Q.; Mura, M.; Astara, G.; et al. Randomized phase III clinical trial of a combined treatment with carnitine + celecoxib +/− megestrol acetate for patients with cancer-related anorexia/cachexia syndrome. Clin. Nutr. 2012, 31, 176–182. [Google Scholar] [CrossRef] [PubMed]
- Graziano, F.; Bisonni, R.; Catalano, V.; Silva, R.; Rovidati, S.; Mencarini, E.; Ferraro, B.; Canestrari, F.; Baldelli, A.M.; De Gaetano, A.; et al. Potential role of levocarnitine supplementation for the treatment of chemotherapy-induced fatigue in non-anaemic cancer patients. Br. J. Cancer 2002, 86, 1854–1857. [Google Scholar] [CrossRef] [PubMed]
- Callander, N.; Markovina, S.; Eickhoff, J.; Hutson, P.; Campbell, T.; Hematti, P.; Go, R.; Hegeman, R.; Longo, W.; Williams, E.; et al. Acetyl-l-carnitine (ALCAR) for the prevention of chemotherapy-induced peripheral neuropathy in patients with relapsed or refractory multiple myeloma treated with bortezomib, doxorubicin and low-dose dexamethasone: A study from the Wisconsin Oncology Network. Cancer Chemother. Pharmacol. 2014, 74, 875–882. [Google Scholar] [PubMed]
- Cruciani, R.A.; Zhang, J.; Manola, J.B.; Cella, D.; Ansari, B.; Fisch, M.J. Phase III randomized, placebo-controlled trial of l-carnitine supplementation for fatigue in patients with cancer. J. Clin. Oncol. 2009, 27, e20532. [Google Scholar]
- Harper, P.; Elwin, C.-E.; Cederblad, G. Pharmacokinetics of bolus intravenous and oral doses of l-carnitine in healthy subjects. Eur. J. Clin. Pharmacol. 1988, 35, 69–75. [Google Scholar] [CrossRef] [PubMed]
- Bain, M.A.; Milne, R.W.; Evans, A.M. Disposition and metabolite kinetics of oral l-carnitine in humans. J. Clin. Pharmacol. 2006, 46, 1163–1170. [Google Scholar] [CrossRef] [PubMed]
- Koeth, R.A.; Wang, Z.; Levison, B.S.; Buffa, J.A.; Org, E.; Sheehy, B.T.; Britt, E.B.; Fu, X.; Wu, Y.; Li, L.; et al. Intestinal microbiota metabolism of l-carnitine, a nutrient in red meat, promotes atherosclerosis. Nat. Med. 2013, 19, 576–585. [Google Scholar] [CrossRef] [PubMed]
- Heuberger, W.; Berardi, S.; Jacky, E.; Pey, P.; Krahenbuhl, S. Increased urinary excretion of carnitine in patients treated with cisplatin. Eur. J. Clin. Pharmacol. 1998, 54, 503–508. [Google Scholar] [CrossRef] [PubMed]
- Empl, M.T.; Kammeyer, P.; Ulrich, R.; Joseph, J.F.; Parr, M.K.; Willenberg, I.; Schebb, N.H.; Baumgartner, W.; Rohrdanz, E.; Steffen, C.; et al. The influence of chronic l-carnitine supplementation on the formation of preneoplastic and atherosclerotic lesions in the colon and aorta of male F344 rats. Arch. Toxicol. 2015, 89, 2079–2087. [Google Scholar] [CrossRef] [PubMed]


| Study & Design | Study Design and Quality | Population and Attrition | Sample Size and Attrition |
|---|---|---|---|
|
|
|
|
|
|
|
|
|
|
|
|
|
|
|
|
|
|
|
|
|
|
|
|
|
|
|
|
|
|
|
|
|
|
|
|
|
|
|
|
|
|
|
|
|
|
|
|
| Study & Design | Intervention | Results |
|---|---|---|
|
| Fatigue: At 3-weeks post-baseline: FACT-Fatigue (scored 0–65; lower scores indicate more severe symptoms)
|
|
| Fatigue: At 4-weeks post-baseline: MFSI-SF (scored 0–150; higher scores indicate more severe symptoms)
QoL-OS (scored 0–73; higher scores indicate more severe symptoms)
Lean body mass via BIA
Numerical scale (scored 0–10; lower scores indicate more severe symptoms)
Grip strength via dynamometer data not reported (P > 0.05 since baseline) Pathology: At 4-weeks post-baseline: ROS
|
|
| For all patients (n = 27): Fatigue: At 1-week post-baseline: Brief Fatigue Inventory (scored 0–90; higher scores indicate more severe symptoms)
Centre for Epidemiologic Studies Depression Scale (scored 0–60; higher scores indicate more severe symptoms)
Epworth Sleeplessness Scale (scored 0–24; higher scores indicate more severe symptoms)
Haemoglobin
|
|
| Fatigue: At end of treatment: FACT-Fatigue (scored 0–65; lower scores indicate more severe symptoms)
|
|
| Fatigue: At 3-weeks post-baseline: Brief Fatigue Inventory global fatigue score (scored 0–10; higher scores indicate more severe symptoms)
EORTC-QLQ-C30 global health status sub-group (scoring unclear; lower scores indicate more severe symptoms)
Hospital Anxiety and Depression Scale—Anxiety (scored 0–21; lower scores indicate more severe symptoms)
Most common severe adverse events were leukopenia and neutropenia. Detailed list of adverse events included in Iwase et al. |
|
| Fatigue: At 4-weeks post-baseline: FACT-Anaemia fatigue sub-scale (scoring unclear; lower scores indicate more severe symptoms)
FACT-Anaemia physical sub-scale (scoring unclear; lower scores indicate more severe symptoms)
KPS (scoring 0–100; lower scores indicate more severe symptoms)
|
|
| Fatigue: At 3-months post-baseline: Brief Fatigue Inventory (scored 0–90; higher scores indicate more severe symptoms)
Body mass index via BIA
EORTC-QLQ-C30 global health status sub-group (scoring unclear; lower scores indicate more severe symptoms)
EORTC-QLQ-C30 cognitive function sub-group (scoring unclear; lower scores indicate more severe symptoms)
|
|
| Fatigue: At 4-weeks post-baseline: Brief Fatigue Inventory (scored 0–90; higher scores indicate more severe symptoms)
Centre for Epidemiologic Studies Depression Scale (scored 0–60; higher scores indicate more severe symptoms)
ECOG PS (scoring 0–5; higher scores indicate more severe symptoms)
|
|
| Fatigue: At 6-months post-baseline: FACT-Fatigue (scored 0–65; lower scores indicate more severe symptoms)
FACT-Taxane Trial Outcome Index (scoring unclear; lower scores indicate more severe symptoms)
|
|
| Fatigue: At 4-months post-baseline: MFSI-SF (scored 0–150; higher scores indicate more severe symptoms)
EORTC-QLQ-C30 (scored 0–100; lower scores indicate more severe symptoms)
ECOG PS (scoring 0–5; higher scores indicate more severe symptoms)
Lean body mass via BIA
Grip strength via dynamometer
Visual analogue scale (scoring unclear; lower scores indicate more severe symptoms)
IL-6
|
|
| Fatigue: At 4-months post-baseline: MFSI-SF (scored 0–150; higher scores indicate more severe symptoms)
EORTC-QLQ-C30 (scored 0–100; lower scores indicate more severe symptoms)
Lean body mass via DEXA
Visual analogue scale (scoring unclear; lower scores indicate more severe symptoms)
Grip strength via dynamometer
ECOG PS (scoring 0–5; higher scores indicate more severe symptoms)
CRP
IG-a n = 2 diarrhoea and n = 1 epigastria; IG-b n = 1 epigastria |
|
| Fatigue: At 4-months post-baseline: MFSI-SF (scored 0–150; higher scores indicate more severe symptoms)
EORTC-QLQ-C30 (scored 0–100; lower scores indicate more severe symptoms)
Visual analogue scale (scoring unclear; lower scores indicate more severe symptoms)
Lean body mass via DEXA
Grip strength via dynamometer
6-min walk test
CRP
|
© 2017 by the authors. Licensee MDPI, Basel, Switzerland. This article is an open access article distributed under the terms and conditions of the Creative Commons Attribution (CC BY) license (http://creativecommons.org/licenses/by/4.0/).
Share and Cite
Marx, W.; Teleni, L.; Opie, R.S.; Kelly, J.; Marshall, S.; Itsiopoulos, C.; Isenring, E. Efficacy and Effectiveness of Carnitine Supplementation for Cancer-Related Fatigue: A Systematic Literature Review and Meta-Analysis. Nutrients 2017, 9, 1224. https://doi.org/10.3390/nu9111224
Marx W, Teleni L, Opie RS, Kelly J, Marshall S, Itsiopoulos C, Isenring E. Efficacy and Effectiveness of Carnitine Supplementation for Cancer-Related Fatigue: A Systematic Literature Review and Meta-Analysis. Nutrients. 2017; 9(11):1224. https://doi.org/10.3390/nu9111224
Chicago/Turabian StyleMarx, Wolfgang, Laisa Teleni, Rachelle S. Opie, Jaimon Kelly, Skye Marshall, Catherine Itsiopoulos, and Elizabeth Isenring. 2017. "Efficacy and Effectiveness of Carnitine Supplementation for Cancer-Related Fatigue: A Systematic Literature Review and Meta-Analysis" Nutrients 9, no. 11: 1224. https://doi.org/10.3390/nu9111224
APA StyleMarx, W., Teleni, L., Opie, R. S., Kelly, J., Marshall, S., Itsiopoulos, C., & Isenring, E. (2017). Efficacy and Effectiveness of Carnitine Supplementation for Cancer-Related Fatigue: A Systematic Literature Review and Meta-Analysis. Nutrients, 9(11), 1224. https://doi.org/10.3390/nu9111224