Dietary Pattern during 1991–2011 and Its Association with Cardio Metabolic Risks in Chinese Adults: The China Health and Nutrition Survey


Abstract
:1. Introduction
2. Materials and Methods
2.1. Study Population
2.2. Study Outcome
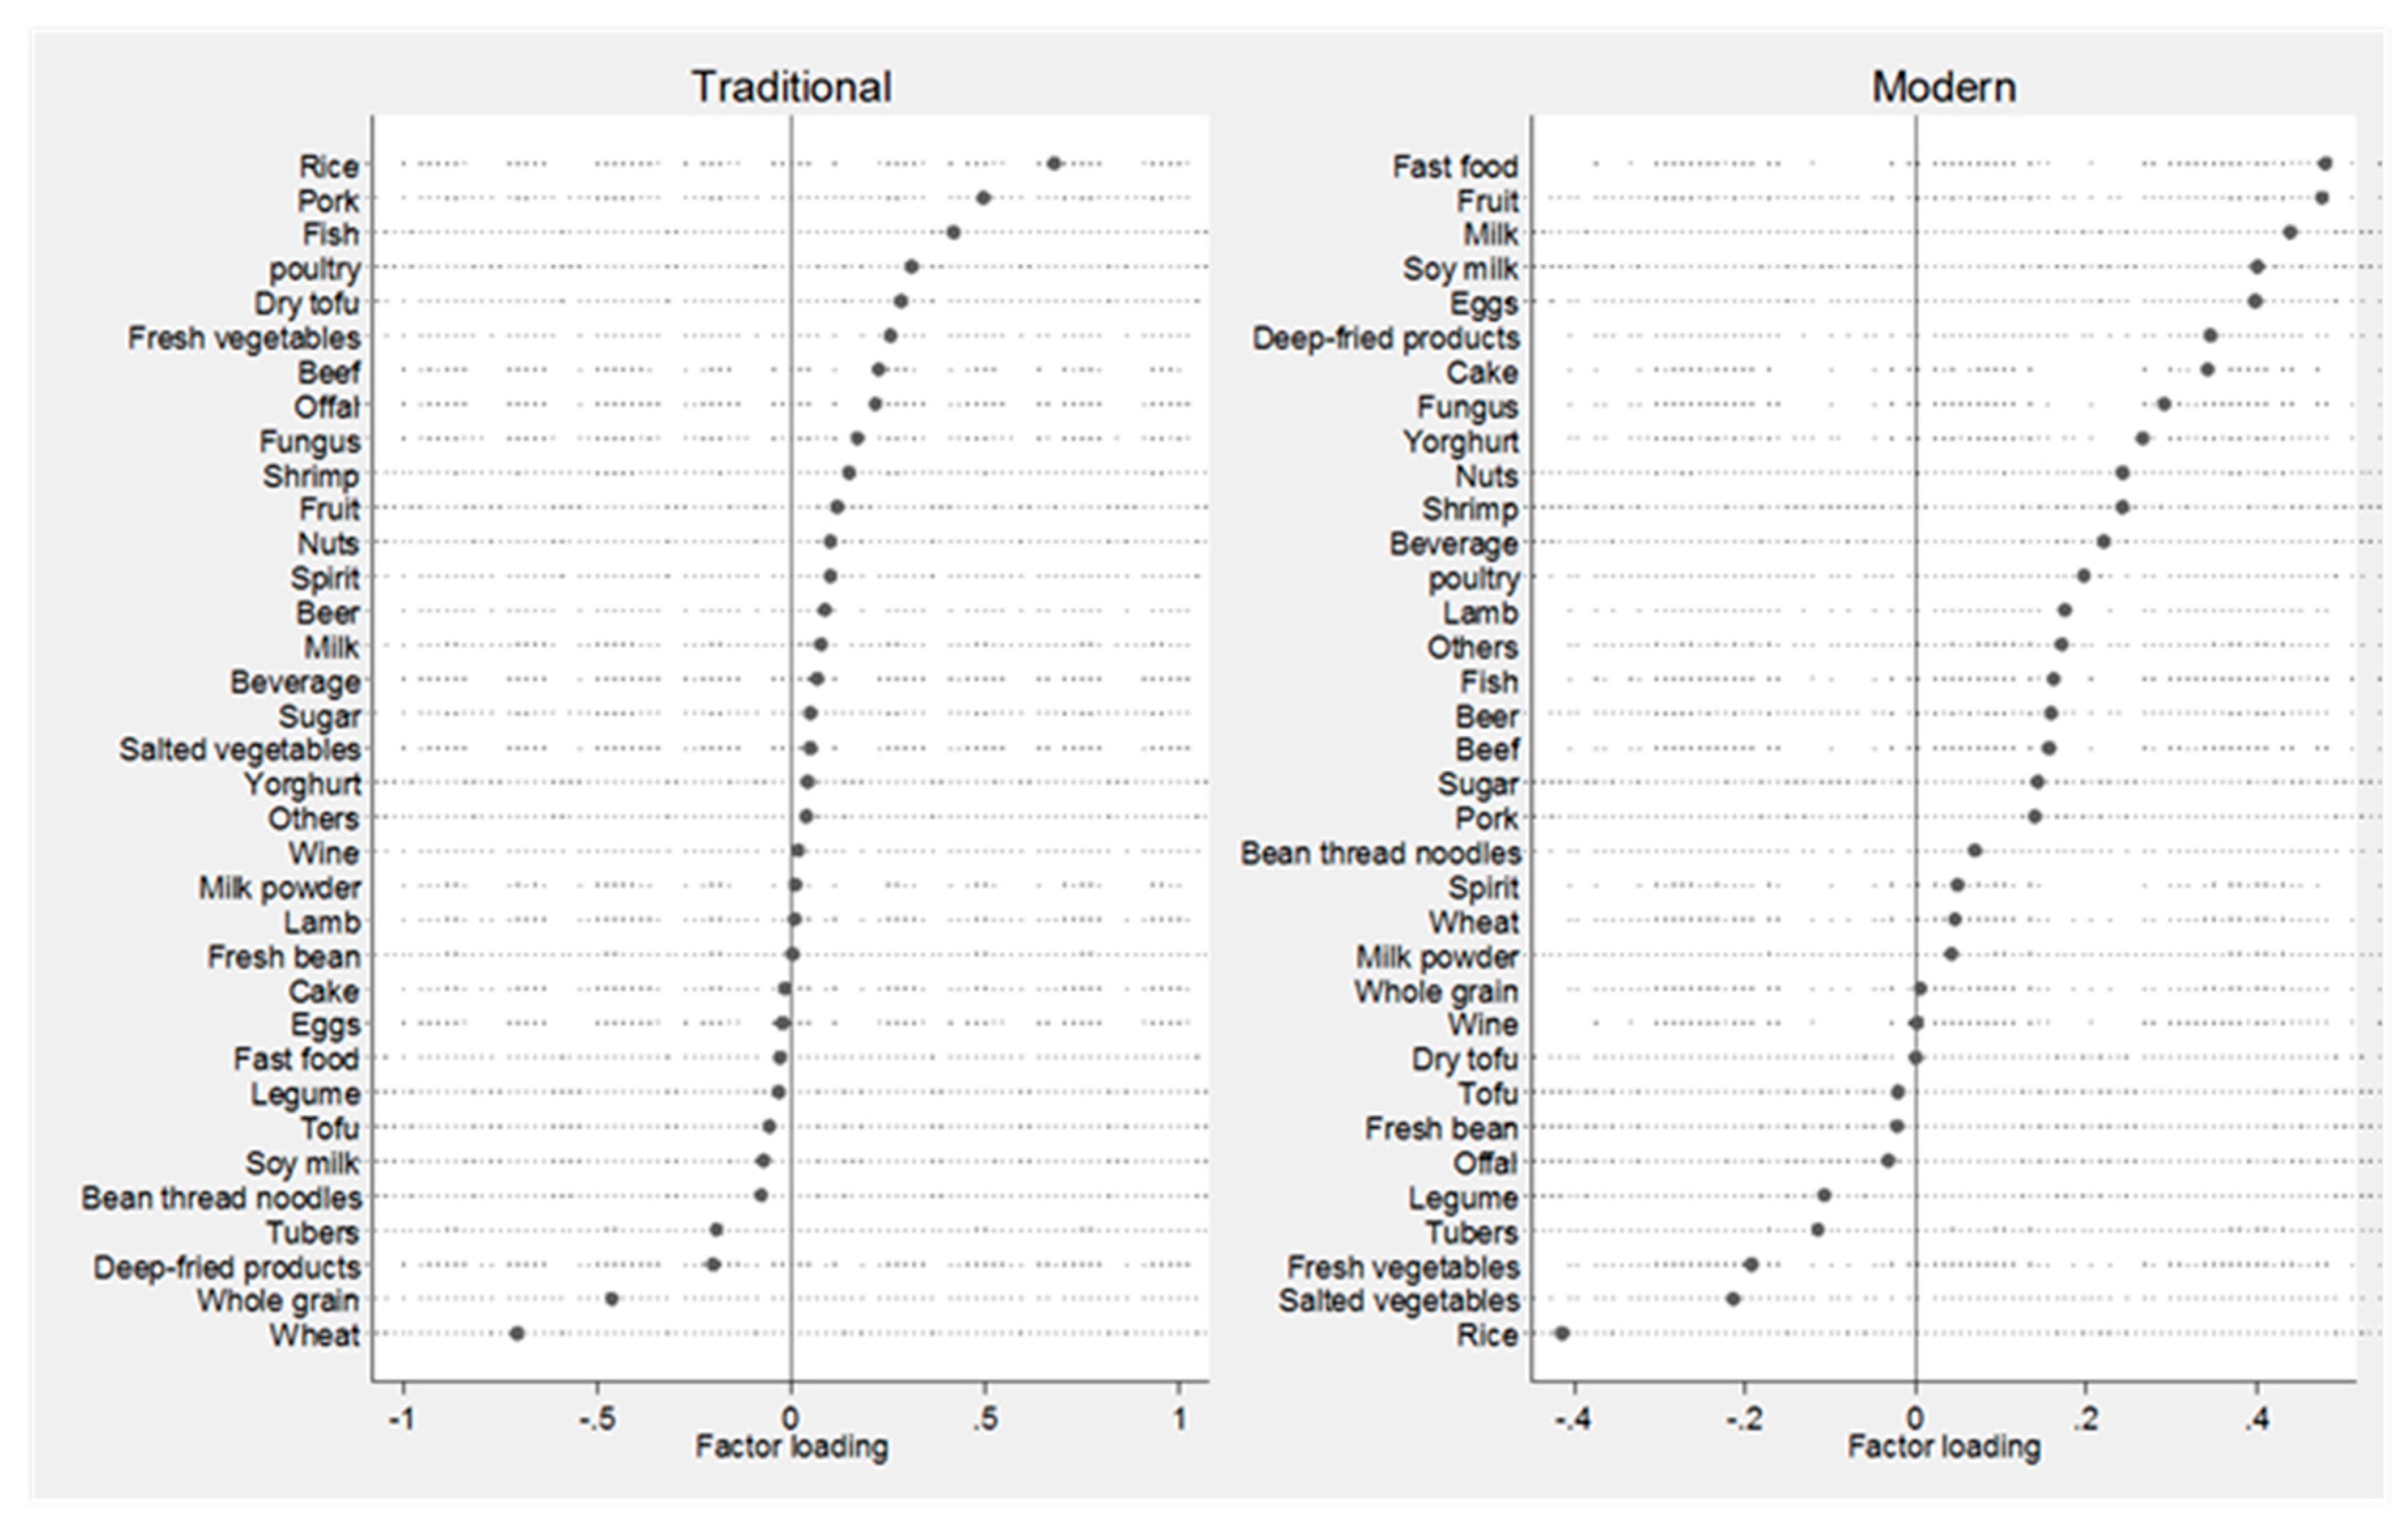
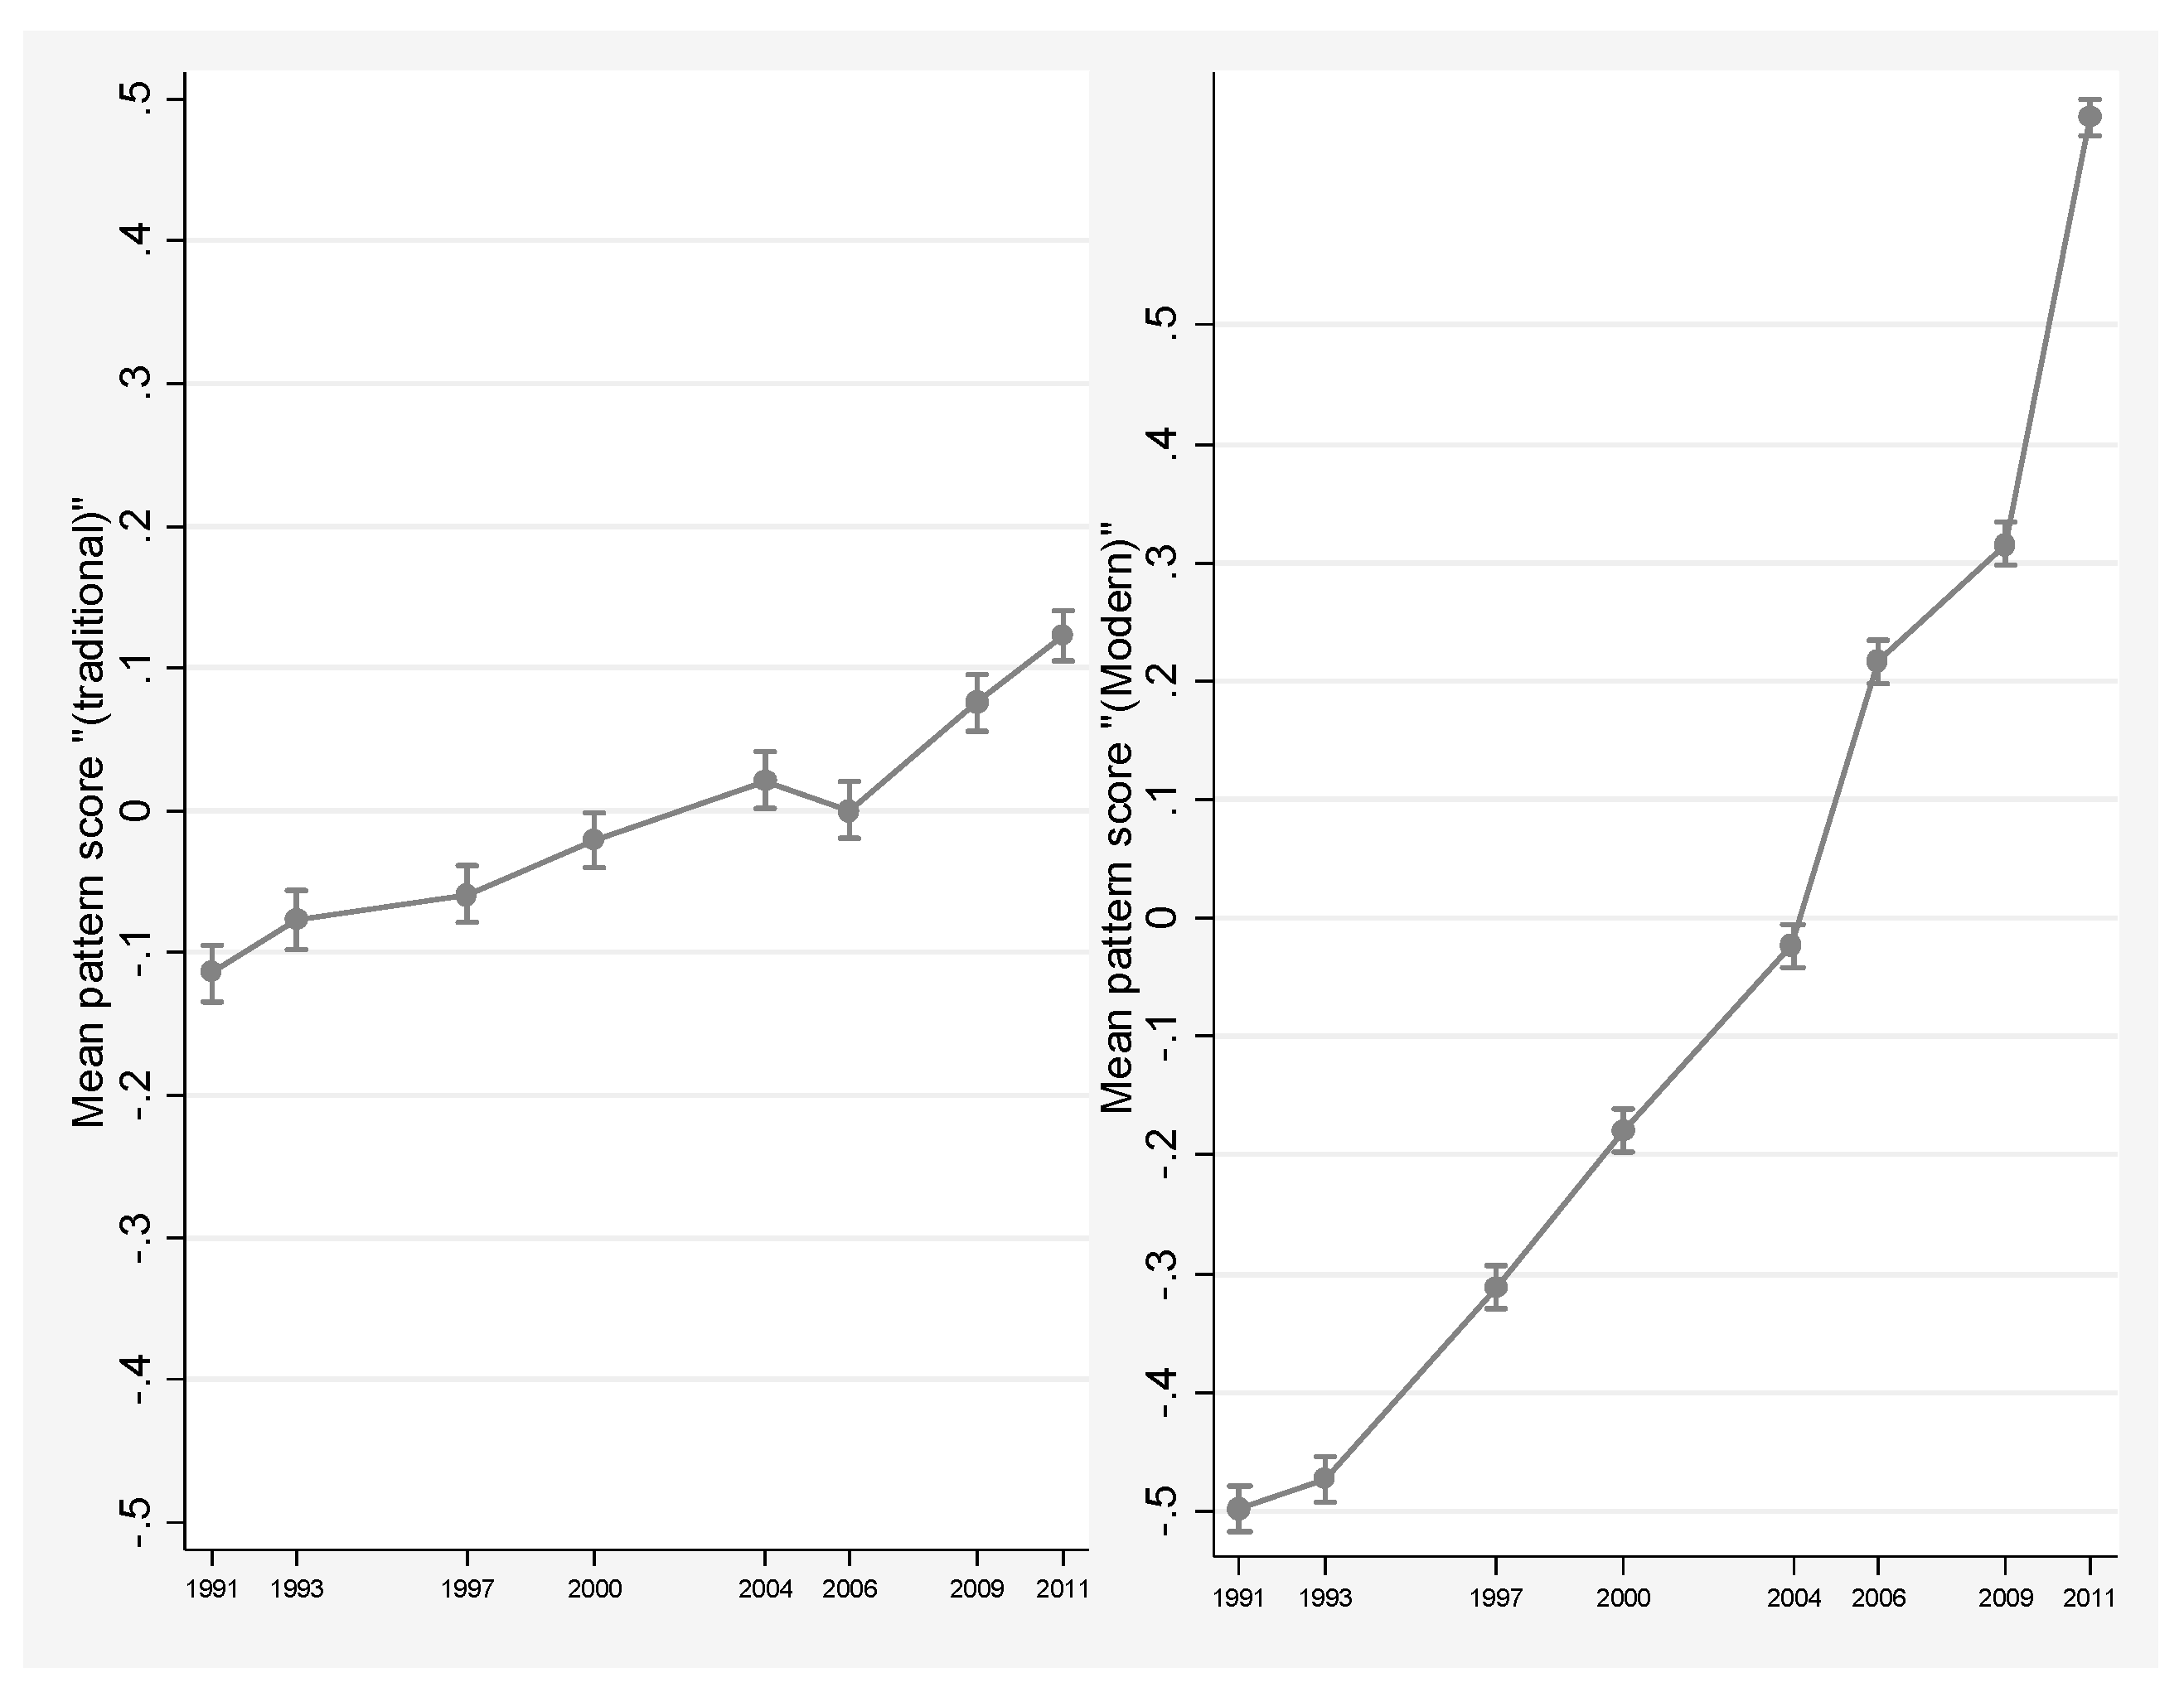
2.3. Dietary Assessment and Dietary Patterns
2.4. Covariates
2.5. Data Analysis
3. Results
4. Discussion
Supplementary Materials
Acknowledgments
Author Contributions
Conflicts of Interest
References
- Popkin, B.M.; Adair, L.S.; Ng, S.W. Now and then: The global nutrition transition: The pandemic of obesity in developing countries. Nutr. Rev. 2012, 70, 3–21. [Google Scholar] [CrossRef] [PubMed]
- Popkin, B.M. Synthesis and implications: China’s nutrition transition in the context of changes across other low and middle income countries. Obes. Rev. 2014, 15. [Google Scholar] [CrossRef] [PubMed]
- Zhai, F.; Wang, H.; Du, S.; He, Y.; Wang, Z.; Ge, K.; Popkin, B.M. Prospective study on nutrition transition in China. Nutr. Rev. 2009, 67, S56–S61. [Google Scholar] [CrossRef] [PubMed]
- Batis, C.; Sotres-Alvarez, D.; Gordon-Larsen, P.; Mendez, M.A.; Adair, L.; Popkin, B.M. Longitudinal analysis of dietary patterns in Chinese adults from 1991 to 2009. Br. J. Nutr. 2014, 111, 1441–1451. [Google Scholar] [CrossRef] [PubMed]
- Zhai, F.; Du, S.; Wang, Z.; Zhang, J.; Du, W.; Popkin, B.M. Dynamics of the Chinese diet and the role of urbanicity, 1991–2011. Obes. Rev. 2014, 15, 16–26. [Google Scholar] [CrossRef] [PubMed]
- Barlow, P.; McKee, M.; Basu, S.; Stuckler, D. The health impact of trade and investment agreements: A quantitative systematic review and network co-citation analysis. Glob. Health 2017, 13, 13. [Google Scholar] [CrossRef] [PubMed]
- Friel, S.; Hattersley, L.; Snowdon, W.; Thow, A.M.; Lobstein, L.; Sanders, D.; Barquera, S.; Mohan, S.; Hawkes, C.; Kelly, B.; et al. Monitoring the impacts of trade agreements on food environments. Obes. Rev. 2013, 14, 120–134. [Google Scholar] [CrossRef] [PubMed]
- Popkin, B.M. Global nutrition dynamics: The world is shifting rapidly toward a diet linked with non-communicable diseases. Am. J. Clin. Nutr. 2006, 84, 289–298. [Google Scholar] [PubMed]
- Yan, S.; Li, J.; Li, S.; Zhang, B.; Du, S.; Gordon-Larsen, P.; Adair, L.A.; Popkin, B.M. The expanding burden of cardio metabolic risk in China: the China Health and Nutrition Survey. Obes. Rev. 2012, 13, 810–821. [Google Scholar] [CrossRef] [PubMed]
- Adair, L.S.; Gordon-Larsen, P.; Du, S.F.; Zhang, B.; Popkin, B.M. The emergence of cardiometabolic disease risk in Chinese children and adults: Consequences of changes in diet, physical activity and obesity. Obes. Rev. 2014, 15, 49–59. [Google Scholar] [CrossRef] [PubMed]
- Shi, Z.; Taylor, A.W.; Riley, M.; Byles, J.; Liu, J.; Noakes, M. Association between dietary patterns, cadmium intake and chronic kidney disease among adults. Clin. Nutr. 2017. [Google Scholar] [CrossRef] [PubMed]
- Xu, X.; Byles, J.; Shi, Z.; McElduff, P.; Hall, J. Dietary pattern transitions, and the associations with BMI, waist circumference, weight and hypertension in a 7-year follow up among the older Chinese population: A longitudinal study. BMC Public Health 2016, 16, 743. [Google Scholar] [CrossRef] [PubMed]
- Xu, X.; Hall, J.J.; Byles, J.E.; Shi, Z. Dietary pattern is associated with obesity in older people in China: Data from China Health and Nutrition Survey (CHNS). Nutrients 2015. [Google Scholar] [CrossRef] [PubMed]
- Popkin, B.M.; Du, S.; Zhai, F.; Zhang, B. Cohort profile: The China Health and Nutrition Survey—Monitoring and understanding socio-economic and health change in China, 1989–2011. Int. J. Epidemiol. 2010, 39, 1435–1440. [Google Scholar] [CrossRef] [PubMed]
- China Health and Nutrition Survey. 2011. Available online: http://www.cpc.unc.edu/projects/china (accessed on 15 February 2017).
- Lin, J.J.; Fung, T.T.; Hu, F.B.; Curhan, G.C. Association of dietary patterns with albuminuria and kidney function decline in older white women: A subgroup analysis from the Nurses’ Health Study. Am. J. Kidney Dis. 2011, 57, 245–254. [Google Scholar] [CrossRef] [PubMed]
- Ainsworth, B.E.; Haskell, W.L.; Hermann, S.A.; Meckes, N.; Bassett, D.R., Jr.; Todor-Locke, C.; Greer, J.L.; Vezina, J.; Whitt-Glover, M.C.; Leon, A.S. 2011 Compendium of Physical Activities: A second update of codes and MET values. Med. Sci. Sports 2011, 43, 1575–1581. [Google Scholar] [CrossRef] [PubMed]
- Popkin, B.M. Nutrition transition and the global diabetes epidemic. Curr. Diabetes Rep. 2015, 15, 1–8. [Google Scholar] [CrossRef] [PubMed]
- Tian, X.; Zhong, L.; von Cramon-Taubadel, S.; Tu, H.; Wang, H. Restaurants in the neighbourhood, eating away from home and BMI in China. PLoS ONE 2016, 11, e0167721. [Google Scholar] [CrossRef] [PubMed]
- Hooper, L.; Abdelhamid, A.; Moore, H.J.; Douthwaite, W.; Skeaff, C.M.; Summerbell, C.D. Effect of reducing total fat intake on body weight: Systematic review and meta-analysis of randomised controlled trials and cohort studies. BMJ 2012, 345, e7666. [Google Scholar] [CrossRef] [PubMed]
- Doostvandi, T.; Mozaffari-Khosravi, H.; Mirmiran, P.; Bahadoran, Z. The association between dietary patterns and insulin resistance: A systematic review. Int. J. Food Sci. Nutr. 2016, 5, 14–18. [Google Scholar] [CrossRef]
- Ndanuko, R.N.; Tapsell, L.C.; Charlton, K.E.; Neale, E.P.; Batterham, M. Dietary patterns and blood pressure in adults: A systematic review and meta-analysis of randomized controlled trials. Adv. Nutr. 2016, 7, 76–89. [Google Scholar] [CrossRef] [PubMed]
- Lee, M.; Popkin, B.M.; Kim, S. The unique aspects of the nutrition transition in South Korea: The retention of healthful elements in their traditional diet. Public Health Nutr. 2002, 5, 197–203. [Google Scholar] [CrossRef] [PubMed]
- Park, H. Nutrition policy in South Korea. Asia Pac. J. Clin. Nutr. 2008, 17, 343–345. [Google Scholar] [PubMed]
- Shi, Z.; Taylor, A.W.; Hu, G.; Gill, T.; Witter, G.A. Rice intake, weight change and risk of the metabolic syndrome development among Chinese adults: The Jiangsu Nutrition Study (JIN). Asia Pac. J. Clin. Nutr. 2012, 21, 35–43. [Google Scholar] [PubMed]
- Kondo, I.; Funahashi, K.; Nakamura, M.; Ojima, T.; Yoshita, K.; Nakamura, Y. Association between food group intake and serum total cholesterol in the Japanese population: NIPPON DATA 80/90. J. Epidemiol. 2010, 20, S576–S581. [Google Scholar] [CrossRef] [PubMed]


| Cardio Metabolic Risks | Definition |
|---|---|
| Overweight/obesity | Body mass index (BMI) ≥ 25 kg/m2 |
| Abdominal overweight/obesity | Waist circumference (WC) ≥ 94 cm in males or ≥80 cm in females |
| Hypertension | Systolic blood pressure (SBP) ≥ 140 mmHg and/or diastolic blood pressure (DBP) ≥ 90 mmHg or have known hypertension |
| Diabetes | Fasting plasm glucose > 7.0 mmol/L, or having known diabetes |
| High cholesterol | Cholesterol ≥ 200 mg/dL |
| High triglycerides | Triglycerides ≥ 150 mg/dL |
| High LDL | low density lipoprotein (LDL) > 130 mg/dL |
| Low HDL | high density lipoprotein (HDL) < 49 mg/dL in males or <50 mg/dL in females |
| Impaired glucose control | HbA1C ≥ 5.7% |
| Metabolic syndrome | WC ≥ 90 cm in males or WC ≥ 80 cm in females plus two or more of the following: Raised triglycerides as triglycerides ≥ 150.6 mg/dL; reduced HDL as HDL < 39.8 mg/dL in males or <49.9 mg/dL in females; raised blood pressure as systolic ≥ 130 mmHg or diastolic ≥ 85 mmHg or treated of hypertension, raised plasma glucose as glucose ≥ 5.6 mmol/L |
| BMI ≥ 25 (kg/m2) | Abdominal Overweight/Obesity | Hypertension | Diabetes | High Triglycerides | Low HDL | High LDL | High Cholesterol | Metabolic Syndrome | Impaired Glucose Control | |
|---|---|---|---|---|---|---|---|---|---|---|
| n/N | 2788/9499 | 3523/9440 | 2576/9586 | 960/8658 | 2113/8625 | 2256/8656 | 2649/8654 | 2950/8625 | 1890/9465 | 3280/8611 |
| Age (years) | 51.9 (13.5) | 53.7 (14.1) | 60.0 (12.9) | 59.3 (12.8) | 51.9 (13.8) | 50.5 (14.6) | 54.9 (13.7) | 54.7 (13.6) | 56.3 (12.8) | 56.0 (13.9) |
| Male (%) | 1321 (47.4) | 825 (23.4) | 1288 (49.9) | 482 (50.0) | 1102 (52.0) | 716 (31.7) | 1127 (42.5) | 1289 (43.6) | 690 (36.5) | 1551 (47.3) |
| Urbanization | ||||||||||
| Low | 344 (12.3) | 495 (14.0) | 328 (12.7) | 119 (12.3) | 251 (11.8) | 322 (14.27) | 304 (11.5) | 342 (11.6) | 235 (12.4) | 585 (17.8) |
| Medium | 945 (33.9) | 1217 (34.5) | 869 (33.7) | 258 (26.8) | 698 (32.9) | 735 (32.6) | 837 (31.6) | 951 (32.2) | 596 (31.5) | 1018 (31.0) |
| High | 1499 (53.8) | 1821 (51.5) | 1382 (53.6) | 587 (60.9) | 1171 (55.2) | 1199 (53.2) | 1508 (56.9) | 1665 (56.3) | 1059 (56.0) | 1677 (51.1) |
| Income | ||||||||||
| Low | 700 (25.4) | 941 (27.0) | 711 (28.0) | 250 (26.4) | 548 (26.3) | 656 (29.6) | 742 (28.4) | 818 (28.0) | 480 (26.0) | 892 (27.6) |
| Medium | 854 (31.0) | 1083 (31.1) | 760 (29.9) | 268 (28.3) | 664 (31.9) | 683 (30.8) | 801 (30.7) | 926 (31.7) | 539 (29.1) | 969 (22.9) |
| High | 1199 (43.6) | 1460 (41.9) | 1068 (42.1) | 428 (45.2) | 872 (41.8) | 876 (39.6) | 1068 (40.9) | 1173 (40.2) | 831 (44.9) | 1376 (42.5) |
| Education | ||||||||||
| Low | 1143 (41.1) | 1744 (49.4) | 1384 (53.8) | 486 (50.6) | 862 (40.8) | 991 (44.0) | 1160 (43.9) | 1327 (45.0) | 949 (50.2) | 1557 (47.6) |
| Medium | 965 (34.7) | 1083 (30.7) | 699 (27.2) | 266 (27.7) | 694 (32.8) | 720 (32.0) | 833 (31.5) | 910 (30.9) | 569 (30.1) | 1004 (30.7) |
| High | 676 (24.3) | 704 (19.9) | 489 (19.0) | 209 (20.6) | 559 (26.4) | 539 (24.0) | 648 (64.5) | 710 (24.1) | 371 (19.6) | 712 (21.8) |
| BMI (Kg/m2) | 27.6 (2.2) | 25.7 (3.3) | 24.7 (3.7) | 25.3 (3.9) | 25.1 (3.5) | 24.7 (3.6) | 24.1 (3.4) | 24.1 (3.4) | 26.4 (3.3) | 24.4 (3.6) |
| SBP (mmHg) | 131.2 (19.4) | 130.1 (20.4) | 146.4 (18.2) | 134.8 (19.4) | 129.4 (19.6) | 126.4 (19.7) | 128.5 (19.1) | 128.8 (19.2) | 136.8 (20.0) | 129.8 (19.6) |
| DBP(mmHg) | 84.8 (11.3) | 80.7 (10.3) | 91.7 (11.6) | 84.5 (11.3) | 83.6 (11.3) | 81.7 (11.6) | 82.3 (11.2) | 82.6 (11.3) | 86.5 (11.4) | 82.8 (11.3) |
| Smoking | ||||||||||
| Never | 1988 (71.4) | 2952 (83.6) | 1734 (67.3) | 664 (69.0) | 1387 (65.6) | 1742(77.4) | 1882 (71.2) | 2085 (70.7) | 1416 (75.0) | 2221 (67.8) |
| Previous | 109 (3.9) | 74 (2.1) | 141 (5.5) | 45 (4.7) | 72 (3.4) | 60 (2.7) | 86 (3.3) | 90 (3.1) | 69 (3.7) | 129 (3.9) |
| Current | 689 (24.7) | 506 (14.3) | 703 (27.3) | 253 (26.3) | 657 (31.1) | 449 (20.0) | 675 (25.5) | 776 (26.3) | 403 (21.4) | 925 (28.2) |
| Drinking | ||||||||||
| Never | 1845 (66.5) | 2794 (79.4) | 1758 (68.4) | 658 (68.6) | 1340 (63.7) | 1744 (77.8) | 1827 (69.6) | 1991 (67.8) | 1389 (73.8) | 2218 (68.1) |
| <1/week | 313 (12.3) | 260 (7.4) | 228 (8.9) | 87 (9.1) | 242 (11.5) | 225 (10.0) | 257 (9.8) | 279 (9.5) | 162 (8.6) | 326 (10.0) |
| 1–2/week | 226 (8.1) | 168 (4.8) | 184 (7.2) | 73 (7.6) | 191 (9.1) | 115 (5.1) | 157 (7.5) | 231 (7.9) | 117 (6.2) | 245 (7.5) |
| 3–4/week | 129 (4.7) | 102 (2.9) | 82 (3.2) | 33 (3.4) | 107 (5.1) | 56 (2.5) | 89 (3.4) | 108 (3.7) | 60 (3.2) | 130 (4.0) |
| Daily | 263 (9.5) | 197 (5.6) | 318 (12.4) | 103(11.6) | 224 (10.7) | 102 (4.6) | 257 (9.8) | 327 (11.1) | 154 (8.2) | 339 (10.4) |
| Median METs (IQR) | 90.9 (30.0, 182.0) | 90.3 (31.5, 147.6) | 97.2 (33.0, 190.3) | 142.8 (31.0, 57.9) | 98.5 (36.9, 178.8) | 98.5 (36.9, 178.3) | 98.5 (36.9, 178.3) | 67.4 (33.5, 158.4) | 90.3 (31.5, 174.6) | 68.2 (33.0, 168.3) |
| Risk Categories | No. | Traditional (95% CI) | p | Modern (95% CI) | p |
|---|---|---|---|---|---|
| BMI ≥ 25 kg/m2 | <0.001 | <0.001 | |||
| No | 6693 | 0.05 (0.03, 0.07) | 0.03 (0.01, 0.05) | ||
| Yes | 2781 | −0.10 (−0.013, −0.07) | 0.16 (0.13, 0.19) | ||
| Abdominal overweight/obesity | <0.001 | <0.001 | |||
| No | 5917 | 0.09 (0.07, 0.11) | 0.03 (0.01, 0.05) | ||
| Yes | 3523 | −0.13 (−0.16, −0.10) | 0.12 (0.09, 0.15) | ||
| Hypertension | <0.001 | 0.47 | |||
| No | 7010 | 0.02 (0.001, 0.04) | 0.07 (0.05, 0.09) | ||
| Yes | 2576 | −0.05 (−0.08, −0.01) | 0.05 (0.02, 0.08) | ||
| Diabetes | <0.001 | <0.001 | |||
| No | 7698 | 0.03 (0.01, 0.05) | 0.04 (0.02, 0.06) | ||
| Yes | 960 | −0.13 (−0.19, −0.08) | 0.18 (0.13, 0.23) | ||
| High triglycerides | <0.001 | <0.001 | |||
| No | 6512 | −0.0001 (−0.02, 0.02) | 0.03 (0.01, 0.05) | ||
| Yes | 2113 | 0.06 (0.02, 0.10) | 0.12 (0.09, 0.16) | ||
| High cholesterol | 0.03 | <0.001 | |||
| No | 5675 | 0.001 (−0.02, 0.02) | 0.02 (0.001, 0.04) | ||
| Yes | 2950 | 0.04 (0.01, 0.07) | 0.11 (0.08, 0.14) | ||
| High LDL | 0.98 | <0.001 | |||
| No | 5978 | 0.01 (−0.01, 0.04) | 0.02 (0.001, 0.04) | ||
| Yes | 2644 | 0.01 (−0.02, 0.05) | 0.12 (0.09, 0.15) | ||
| Low HDL | 0.002 | 0.02 | |||
| No | 6378 | 0.03 (0.01, 0.05) | 0.04 (0.02, 0.06) | ||
| Yes | 2246 | −0.03 (−0.07, 0.003) | 0.09 (0.05, 0.12) | ||
| Metabolic syndrome | <0.001 | <0.001 | |||
| No | 7555 | 0.03 (0.01, 0.05) | 0.05 (0.03, 0.06) | ||
| Yes | 1855 | −0.09 (−0.13, −0.05) | 0.13 (0.10, 0.17) | ||
| Impaired glucose control | <0.001 | <0.001 | |||
| No | 5319 | 0.19 (0.17, 0.21) | −0.01 (−0.03, 0.01) | ||
| Yes | 3271 | −0.27 (−0.30, −0.24) | 0.15 (0.12, 0.18) |
| BMI ≥ 25 (kg/m2) | Abdominal Overweight/Obesity | Hypertension | Diabetes | High Triglycerides | Low HDL | High LDL | High Cholesterol | Metabolic Syndrome | Impaired Glucose Control | |
|---|---|---|---|---|---|---|---|---|---|---|
| Traditional pattern | ||||||||||
| Crude | −0.20 (−0.22, −0.18) | −0.29 (−0.34, −0.24) | −0.11 (−0.13, −0.09) | −0.21 (−0.28, −0.13) | 0.08 (0.02, 0.13) | −0.08 (−0.14, −0.03) | 0.001 (−0.05, 0.05) | 0.05 (−0.001, 0.10) | −0.15 (−0.21, −0.10) | −0.61 (−0.67, −0.056) |
| Model 1 | −0.18 (−0.21, −0.16) | −0.27 (−0.33, −0.22) | −0.06 (−0.08, −.003) | −0.20 (−0.27, −0.12) | 0.07 (0.01, 0.13) | −0.05 (−0.11, 0.01) | 0.04 (−0.02, 0.09) | 0.09 (0.03, 0.14) | −0.13 (−0.19, −0.07) | −0.64 (−0.69, −0.58) |
| Model 2 | −0.35 (−0.37, −0.33) | −0.32 (−0.38, −0.26) | −0.14 (−0.17, −0.11) | −0.29 (−0.37, −0.21) | 0.02 (−0.04, 0.08) | −0.07 (−0.13, −0.01) | −0.03 (−0.09, 0.02) | 0.02 (−0.03, 0.08) | −0.19 (−0.25, −0.12) | −0.68 (−0.74, −0.62) |
| Model 3 | −0.35 (−0.37, −0.32) | −0.33 (−0.39, −0.27) | −0.15 (−0.18, −0.12) | −0.24 (−0.33, −0.15) | 0.03 (−0.04, 0.09) | −0.04 (−0.11, 0.02) | −0.04 (−0.10, 0.02) | 0.01 (−0.05, 0.07) | −0.18 (−0.25, −0.12) | −0.67 (−0.73, −0.60) |
| Sensitivity analysis | −0.45 (−0.50, −0.40) | −0.35 (−0.46, −0.23) | −0.11 (−0.16, −0.05) | −0.21 (−0.36, −0.05) | 0.08 (−0.04, 0.20) | −0.05 (−0.18, 0.07) | −0.04 (−0.15, 0.06) | 0.04 (−0.06, 0.14) | −0.20 (−0.32, −0.07) | −0.73 (−0.84, −0.62) |
| Modern pattern | ||||||||||
| Crude | 0.19 (0.13, 0.24) | 0.13 (0.08, 0.18) | −0.02 (−0.08, 0.03) | 0.19 (0.11, 0.26) | 0.13 (0.07, 0.19) | 0.07 (0.01, 0.13) | 0.15 (0.09, 0.20) | 0.13 (0.08, 0.18) | 012 (0.06, 0.18) | 0.24 (0.18, 0.29) |
| Model 1 | 0.21 (0.16, 0.26) | 0.25 (0.19, 0.30) | 0.09 (0.03, 0.15) | 0.27 (0.19, 0.34) | 0.14 (0.09, 0.20) | 0.08 (0.02, 0.14) | 0.21 (0.16, 0.27) | 0.20 (0.14, 0.25) | 0.20 (0.14, 0.26) | 0.34 (0.29, 0.40) |
| Model 2 | 0.18 (0.12, 0.24) | 0.28 (0.21, 0.34) | 0.08 (0.001, 0.14) | 0.19 (0.10, 0.29) | 0.08 (0.01, 0.15) | 0.04 (−0.02, 0.11) | 0.13 (0.06, 0.19) | 0.12 (0.06, 0.19) | 0.17 (0.10, 0.25) | 0.40 (0.33, 0.46) |
| Model 3 | 0.18 (0.11, 0.24) | 0.26 (0.19, 0.33) | 0.07 (−0.01, 0.15) | 0.20 (0.10, 0.30) | 0.07 (−0.01, 0.14) | 0.04 (−0.03, 0.11) | 0.12 (0.05, 0.19) | 0.10 (0.04, 0.17) | 0.16 (0.08, 0.24) | 0.42 (0.35, 0.49) |
| Sensitivity analysis | 0.67 (0.58, 0.77) | 0.66 (0.42, 0.90) | 0.33 (0.21, 0.46) | 0.61 (0.30, 0.91) | −0.01 (−0.26, 0.24) | −0.07 (−0.32, 0.19) | 0.55 (0.33, 0.77) | 0.40 (0.19, 0.61) | 0.28 (0.04, 0.53) | 1.37 (1.13, 1.60) |
© 2017 by the authors. Licensee MDPI, Basel, Switzerland. This article is an open access article distributed under the terms and conditions of the Creative Commons Attribution (CC BY) license (http://creativecommons.org/licenses/by/4.0/).
Share and Cite
Li, M.; Shi, Z. Dietary Pattern during 1991–2011 and Its Association with Cardio Metabolic Risks in Chinese Adults: The China Health and Nutrition Survey. Nutrients 2017, 9, 1218. https://doi.org/10.3390/nu9111218
Li M, Shi Z. Dietary Pattern during 1991–2011 and Its Association with Cardio Metabolic Risks in Chinese Adults: The China Health and Nutrition Survey. Nutrients. 2017; 9(11):1218. https://doi.org/10.3390/nu9111218
Chicago/Turabian StyleLi, Ming, and Zumin Shi. 2017. "Dietary Pattern during 1991–2011 and Its Association with Cardio Metabolic Risks in Chinese Adults: The China Health and Nutrition Survey" Nutrients 9, no. 11: 1218. https://doi.org/10.3390/nu9111218
APA StyleLi, M., & Shi, Z. (2017). Dietary Pattern during 1991–2011 and Its Association with Cardio Metabolic Risks in Chinese Adults: The China Health and Nutrition Survey. Nutrients, 9(11), 1218. https://doi.org/10.3390/nu9111218