Determination of Free Radical Scavenging, Antioxidative DNA Damage Activities and Phytochemical Components of Active Fractions from Lansium domesticum Corr. Fruit

Abstract
:1. Introduction
2. Experimental Section
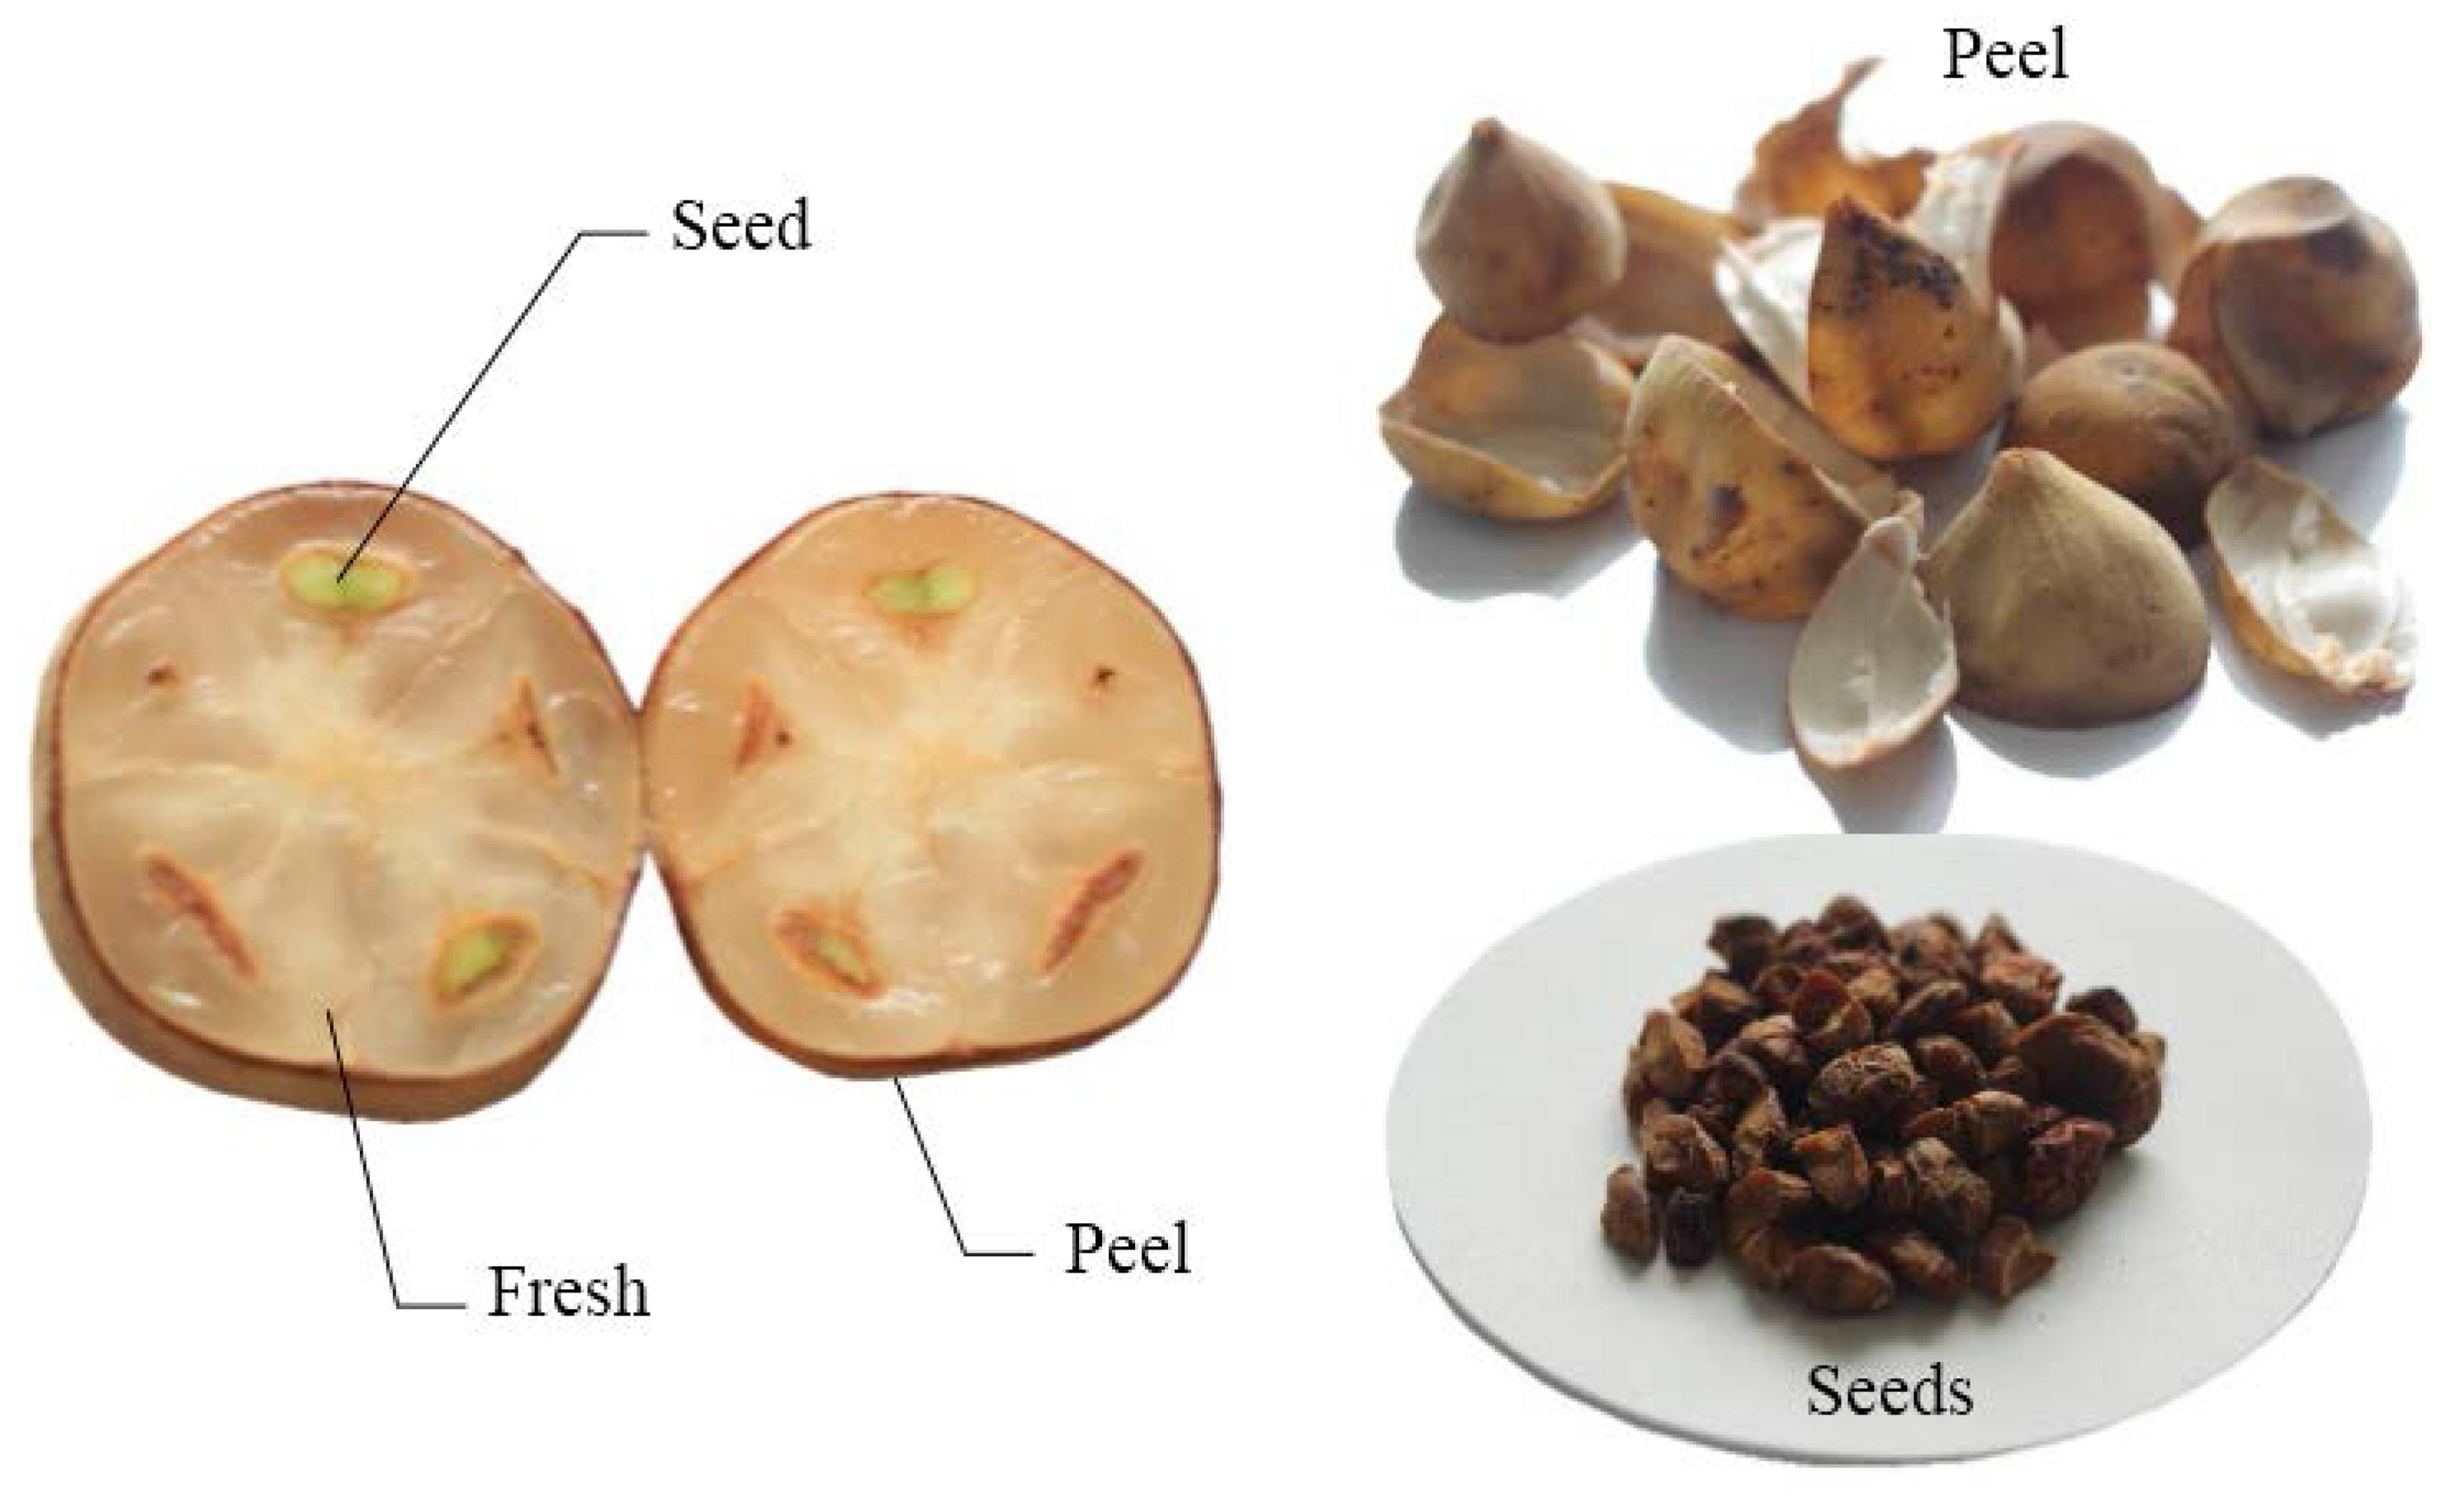
2.1. Sample Preparation and Extraction

| Maceration | Fractionation | Lansium domesticum Corr. | |
|---|---|---|---|
| Peel (SK) | Seed (SD) | ||
| Ethanol 50% (v/v) concentration | Dichloromethane (DCM) | LDSK50-DCM | LDSD50-DCM |
| Ethyl acetate (EA) | LDSK50-EA | LDSD50-EA | |
| Water (H2O) | LDSK50-H2O | LDSD50-H2O | |
| Ethanol 95% (v/v) concentration | Dichloromethane (DCM) | LDSK95-DCM | LDSD95-DCM |
| Ethyl acetate (EA) | LDSK95-EA | LDSD95-EA | |
| Water (H2O) | LDSK95-H2O | LDSD95-H2O | |
2.2. Determination of ROS Radicals Scavenging Capacity
2.2.1. Photochemiluminescence (PCL) Assay
2.2.2. Deoxyribose Assay
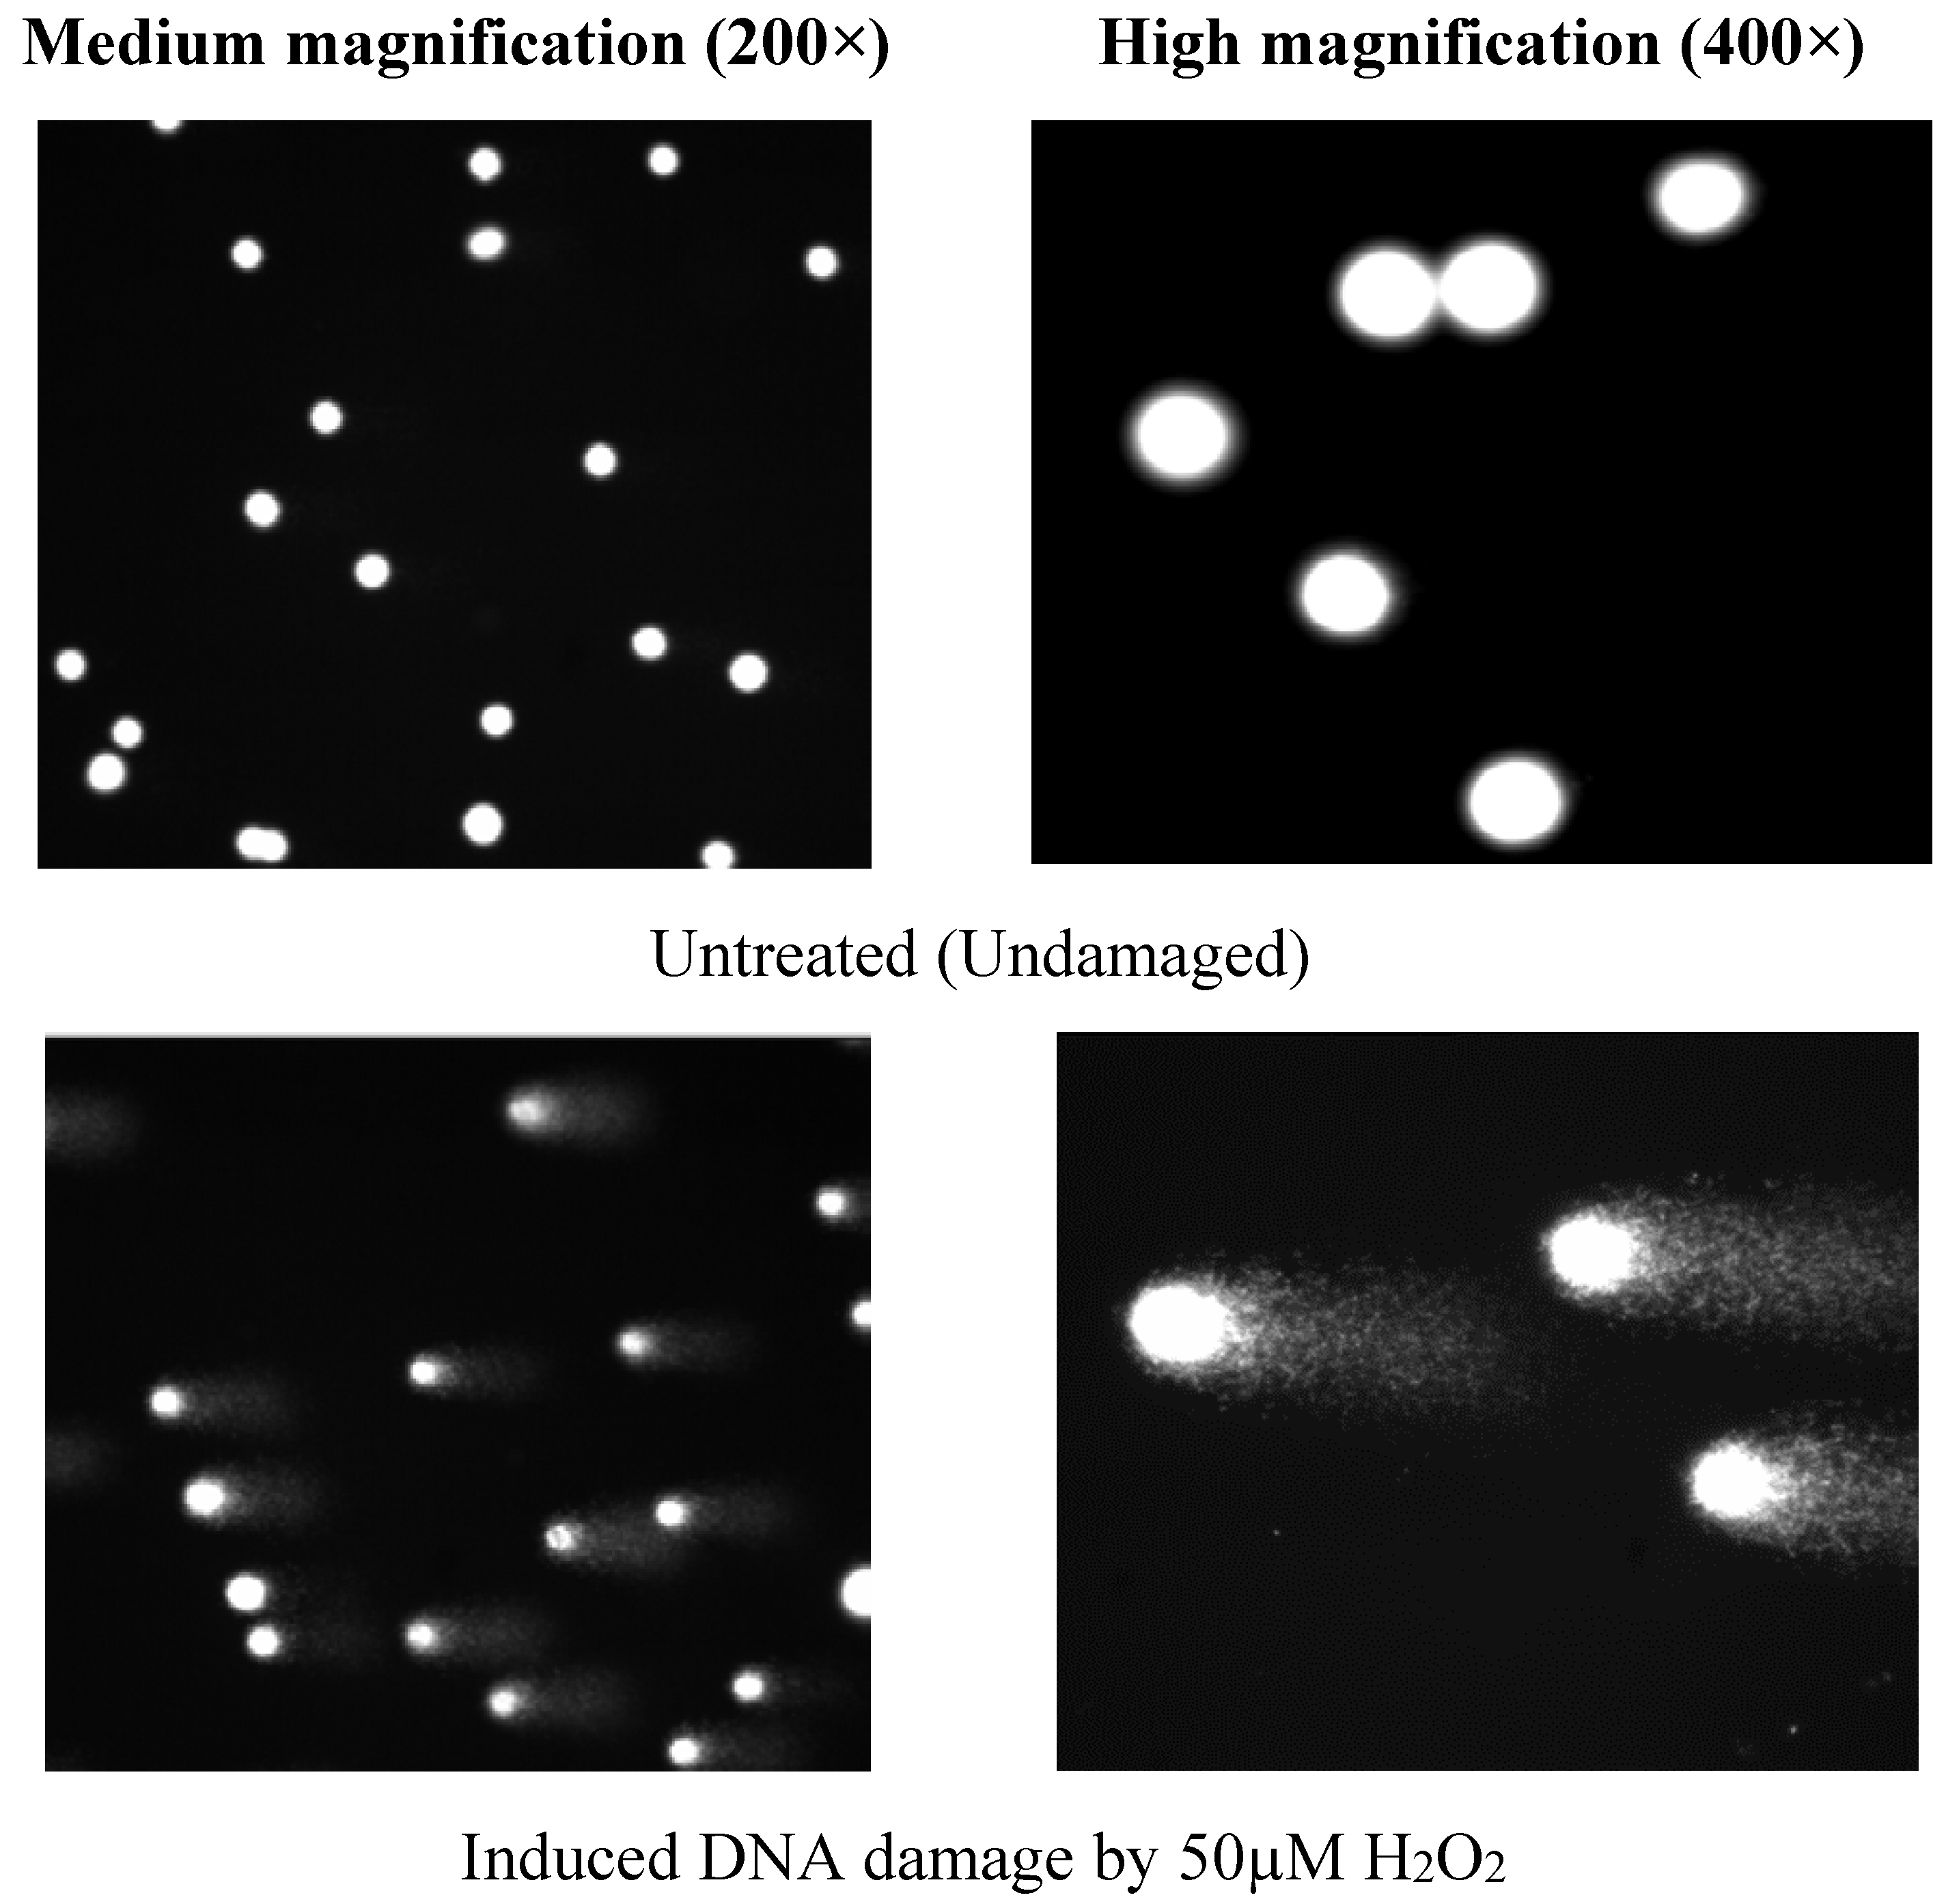
2.3. Determination of Antioxidative DNA Damage Activity by Comet Assay
2.3.1. Cell Culture and Preparation
2.3.2. Cell Treatment
2.3.3. Hydrogen Peroxide Treatment
2.3.4. The Comet Assay (Single Cell Gel Electrophoresis: SCGE)
Comet Slide Preparation
Lysing, Unwinding, and Electrophoresis
Neutralization and DNA Staining
Comet Cell Scoring
Statistical Analysis
2.4. Determination of Phytochemical Components
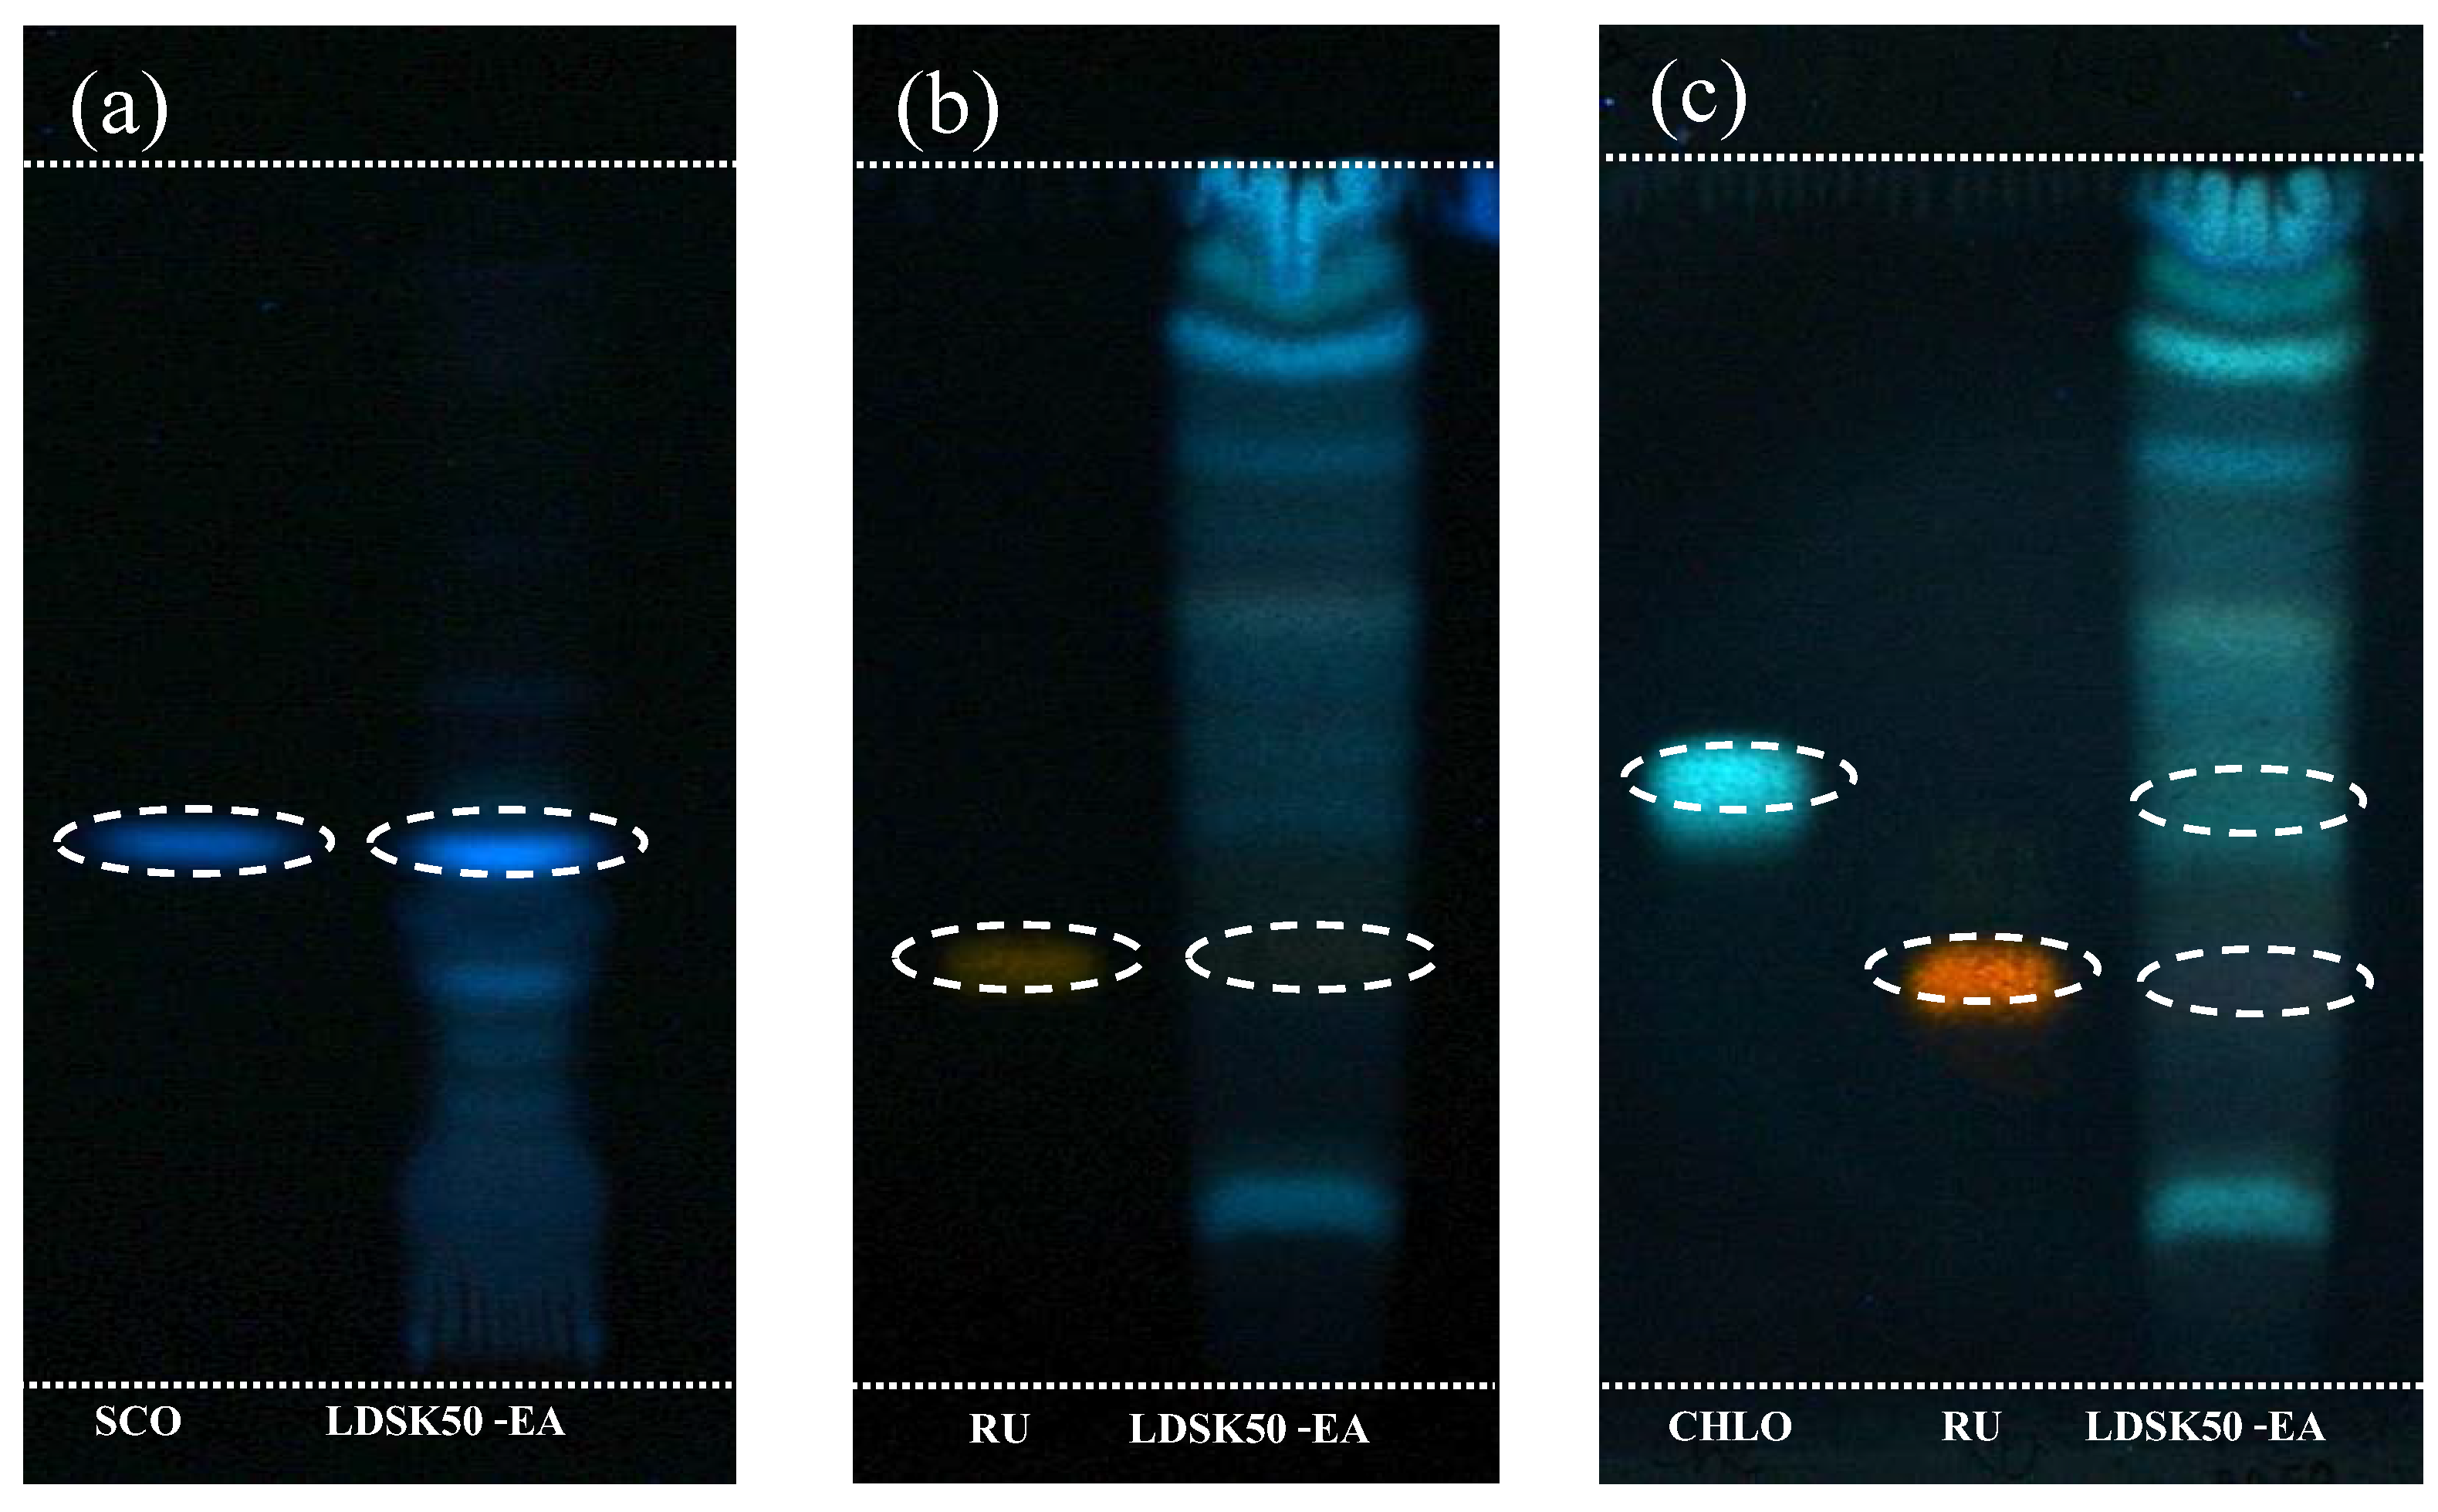
2.4.1. Thin Layer Chromatography (TLC)
- System 1: toluene:ethyl acetate:formic acid (5:4:1)
- System 2: ethyl acetate:formic acid:acetic acid:water (137:11:11:26)
- Spray reagent: natural product (diphenylboryloxyethylamine) polyethyleneglycol (PEG)
- UV Detection: 366 nm
- Standard: scopoletin, rutin, chlorogenic acid
2.4.2. Total Phenolic Content (TPC) Determination
2.4.3. Total Flavonoid Content (TFC) Determination
3. Results
3.1. Antioxidant Capacity of 12 Fractions of L. domesticum Extractions
3.1.1. Superoxide Anion Radical Scavenging Activity
3.1.2. Hydroxyl Radical Scavenging Activity
| Fractions | % Inhibition (Mean ± SD) | |||
|---|---|---|---|---|
| 0.5 mg/mL | 1.0 mg/mL | 2.0 mg/mL | ||
| LDSK50 | DCM | 20.79 ± 0.62 | 20.61 ± 0.87 * | 43.94 ± 1.03 |
| EA | 21.49 ± 1.28 | 31.24 ± 0.86 | 42.70 ± 0.86 | |
| H2O | 27.79 ± 0.54 * | 71.21 ± 0.73 * | 93.44 ± 0.84 * | |
| LDSK95 | DCM | 0.50 ± 0.12 * | 3.48 ± 0.28 * | 9.86 ± 0.89 * |
| EA | 8.69 ± 0.29 * | 12.31 ± 0.44 * | 20.47 ± 1.14 * | |
| H2O | 21.68 ± 0.91 | 23.30 ± 0.72 * | 42.03 ± 0.58 | |
| LDSD50 | DCM | 30.10 ± 0.79 * | 36.11 ± 1.06 * | 58.03 ± 1.37 * |
| EA | 22.55 ± 0.63 | 26.48 ± 0.64 | 48.00 ± 0.87 | |
| H2O | 23.23 ± 1.08 | 26.24 ± 0.81 | 47.24 ± 1.12 | |
| LDSD95 | DCM | 24.59 ± 0.76 | 26.49 ± 1.14 | 47.21 ± 1.06 |
| EA | 22.94 ± 0.65 | 28.02 ± 0.87 | 47.42 ± 1.09 | |
| H2O | 23.30 ± 0.47 | 32.95 ± 0.49 | 42.53 ± 1.11 | |
| Fractions | ACL | ACW | Deoxyribose | |
|---|---|---|---|---|
| Trolox eqv.(nmole) Mean ± SD | Ascorbic eqv.(nmole) Mean ± SD | Inhibition (%) Mean ± SD | ||
| LDSK50 | DCM | 1.030 ± 0.198 | 4.180 ± 0.211 | 43.94 ± 1.03 |
| EA | 6.625 ± 0.445 | 54.660 ± 1.413 | 42.70 ± 0.86 | |
| H2O | 1.845 ± 0.007 | 98.733 ± 2.516 | 93.44 ± 0.84 | |
| LDSK95 | DCM | 0.380 ± 0.057 | 0.345 ± 0.007 | 9.86 ± 0.89 |
| EA | 1.750 ± 0.057 | 8.350 ± 0.072 | 20.47 ± 1.14 | |
| H2O | 1.195 ± 0.120 | 9.910 ± 0.144 | 42.03 ± 0.58 | |
| LDSD50 | DCM | 0.795 ± 0.078 | −0.065 ± 0.120 | 58.03 ± 1.37 |
| EA | 1.257 ± 0.060 | 5.410 ± 0.240 | 48.00 ± 0.87 | |
| H2O | 0.525 ± 0.035 | 2.073 ± 0.101 | 47.24 ± 1.12 | |
| LDSD95 | DCM | 0.965 ± 0.050 | 1.513 ± 0.050 | 47.21 ± 1.06 |
| EA | 1.200 ± 0.085 | 6.880 ± 0.028 | 47.42 ± 1.09 | |
| H2O | 0.635 ± 0.050 | 1.105 ± 0.007 | 42.53 ± 1.11 | |
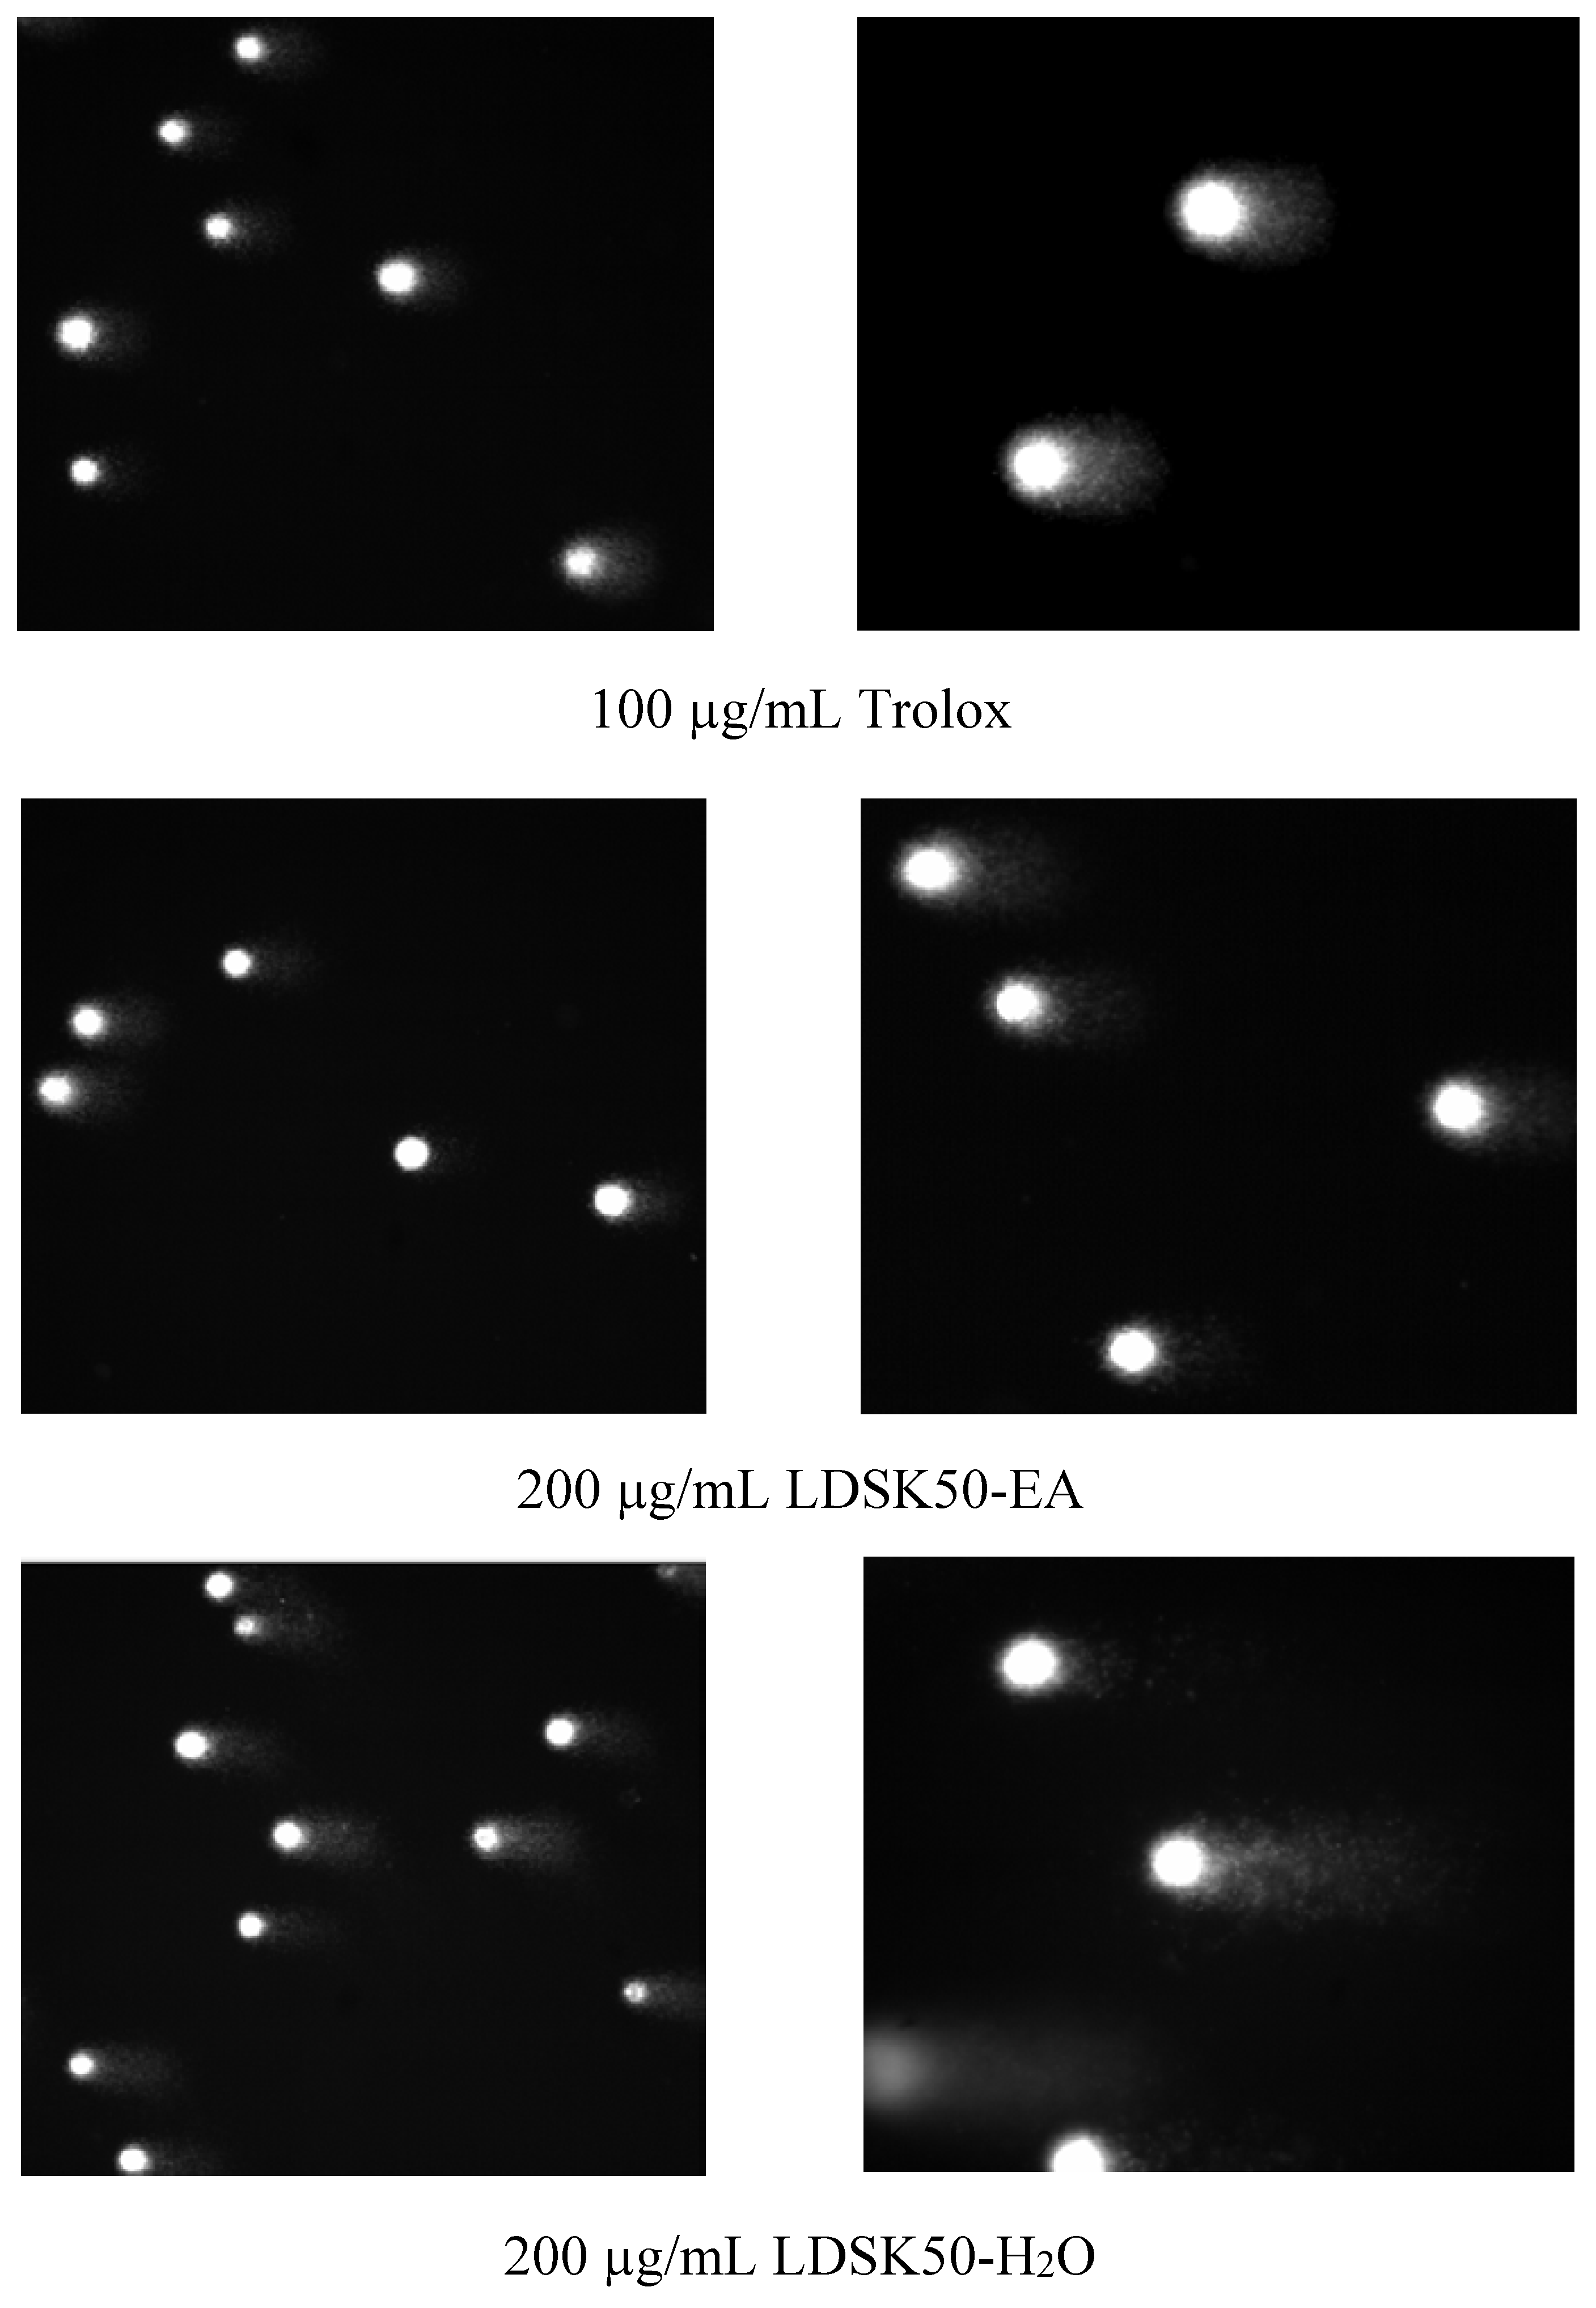
3.2. Antioxidative DNA Damage Activity of LDSK50-EA and LDSK50-H2O on TK6 Cells
| * LDSK50-EA | * LDSK50-H2O | ||||
|---|---|---|---|---|---|
| Concentration (µg/mL) | TK6 Viability (%) | Concentration (µg/mL) | TK6 Viability (%) | ||
| Pre-H2O2 | Post-H2O2 | Pre-H2O2 | Post-H2O2 | ||
| 0 | 97.52 ±2.50 | 95.02 ± 6.80 | 0 | 97.52 ± 2.50 | 95.02 ± 6.80 |
| 25 | 98.15 ± 3.21 | 92.95 ± 4.37 | 25 | 98.72 ± 2.22 | 93.50 ± 5.73 |
| 50 | 99.57 ± 0.75 | 96.38 ± 6.28 | 50 | 97.24 ± 2.45 | 93.53 ± 5.29 |
| 100 | 97.62 ± 2.86 | 98.24 ± 1.94 | 100 | 97.70 ± 3.98 | 95.98 ± 6.97 |
| 200 | 97.76 ± 2.72 | 94.33 ± 4.27 | 200 | 98.89 ± 1.92 | 92.47 ± 7.96 |

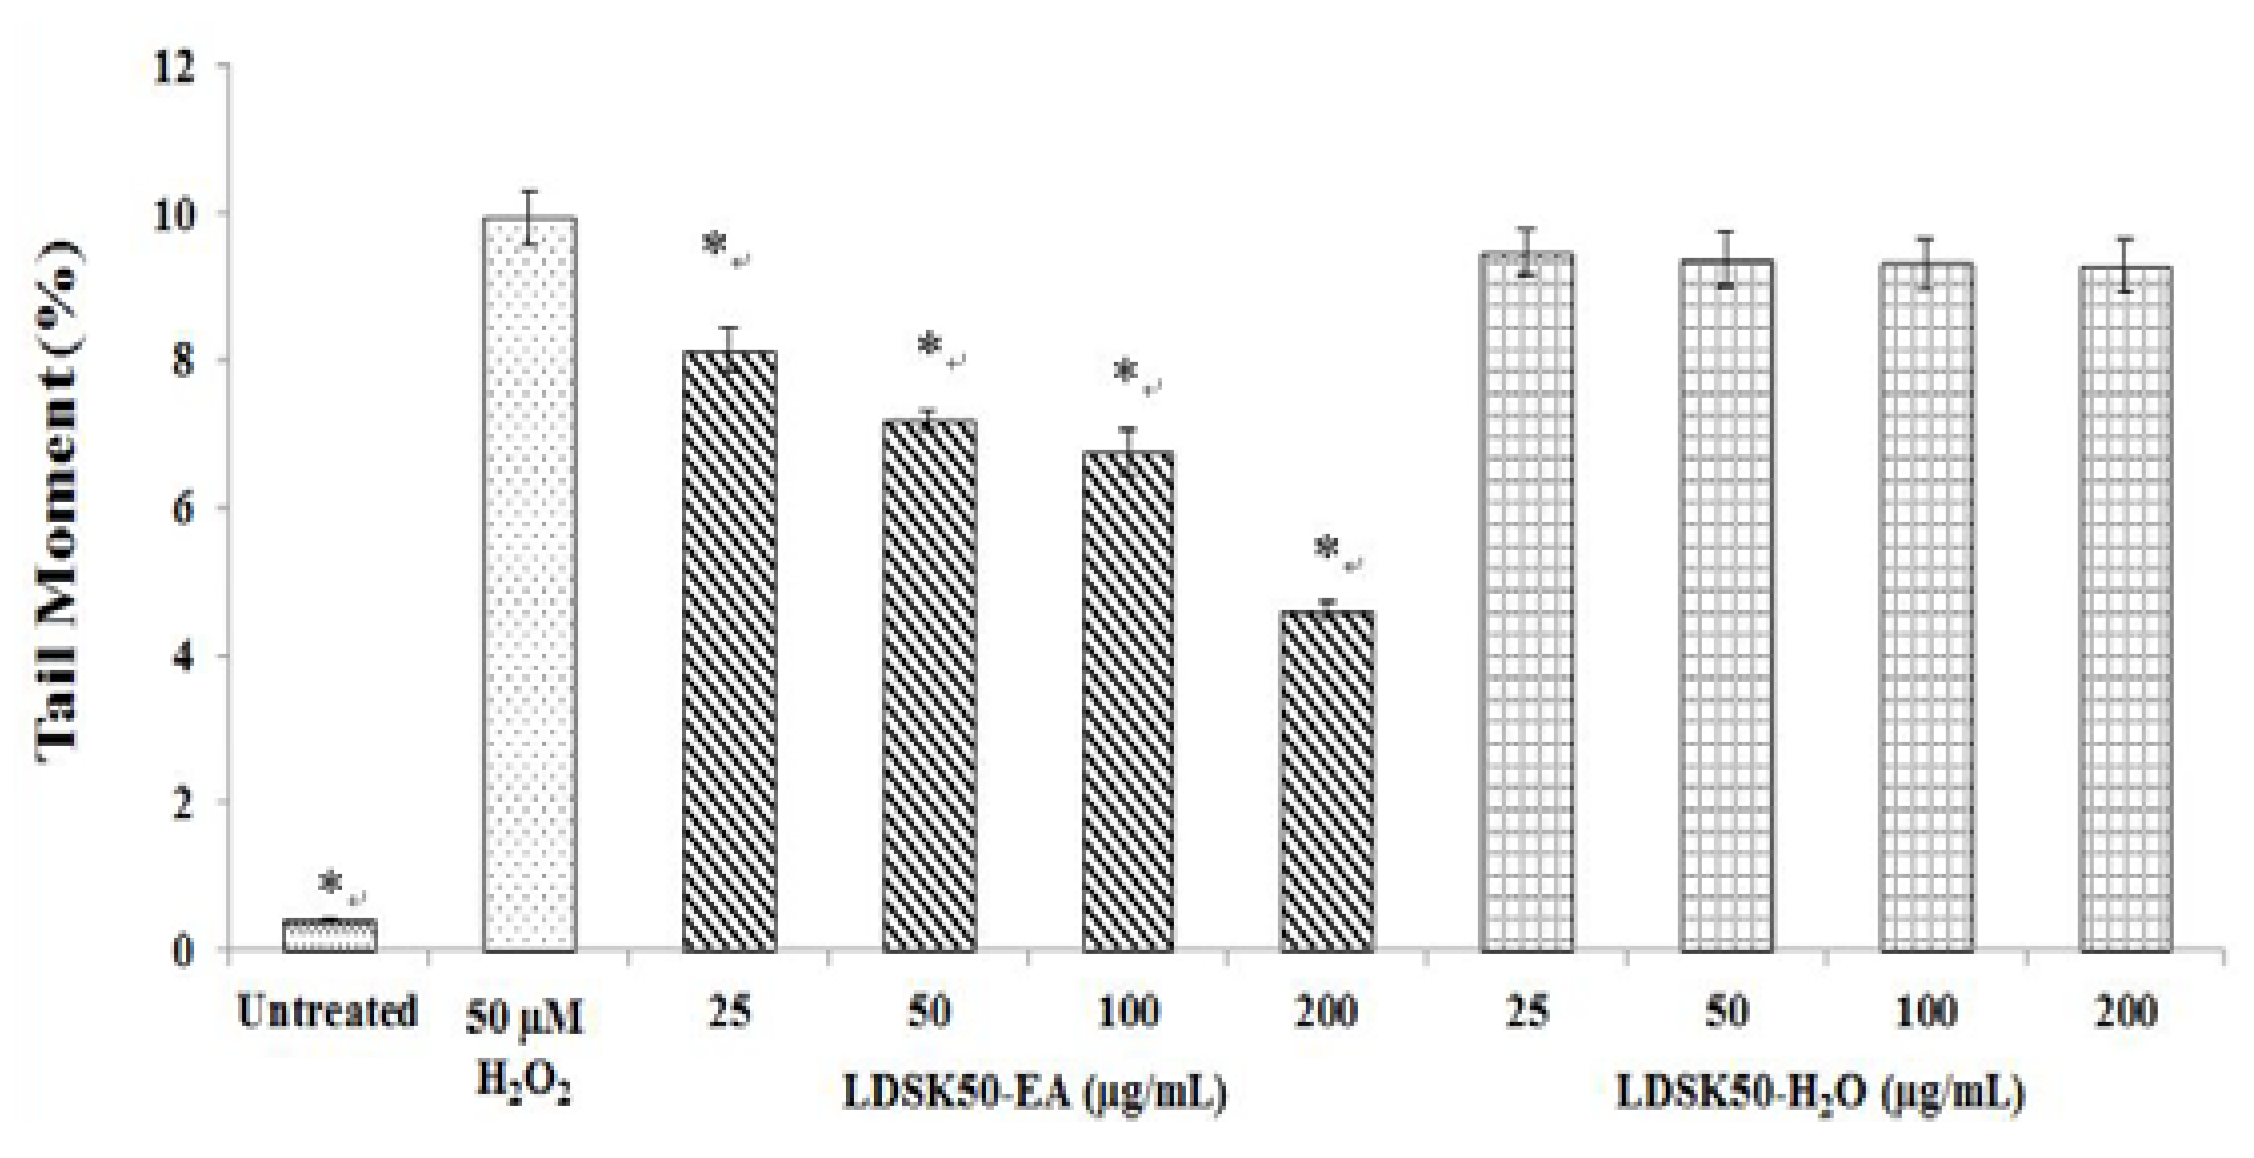

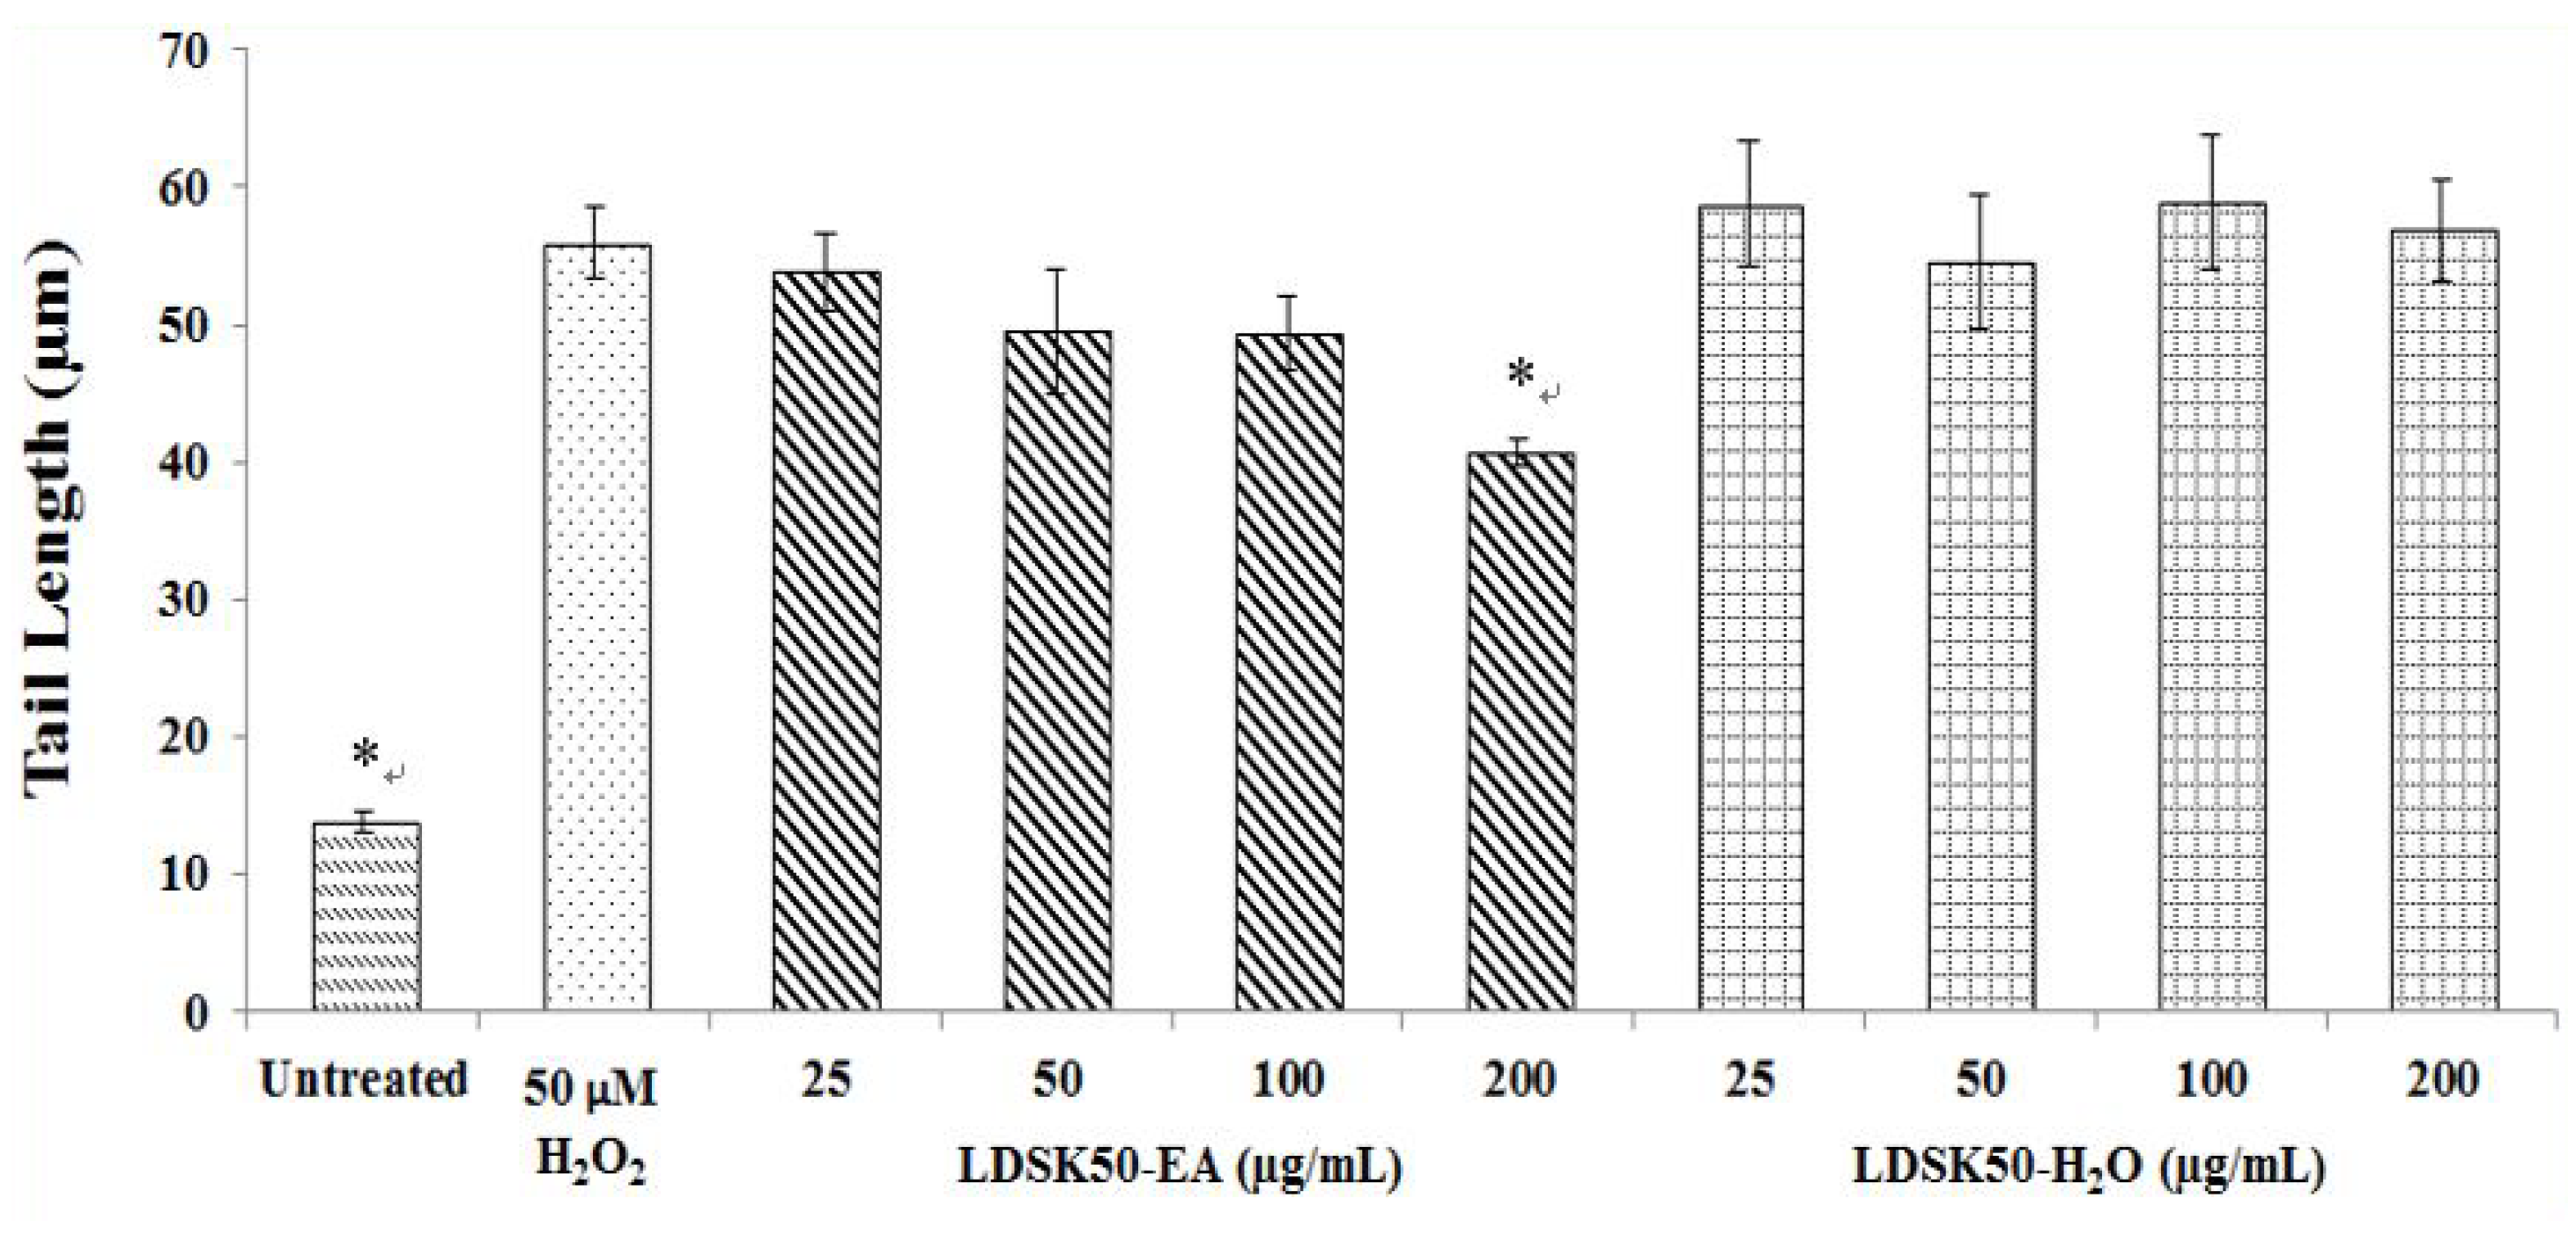
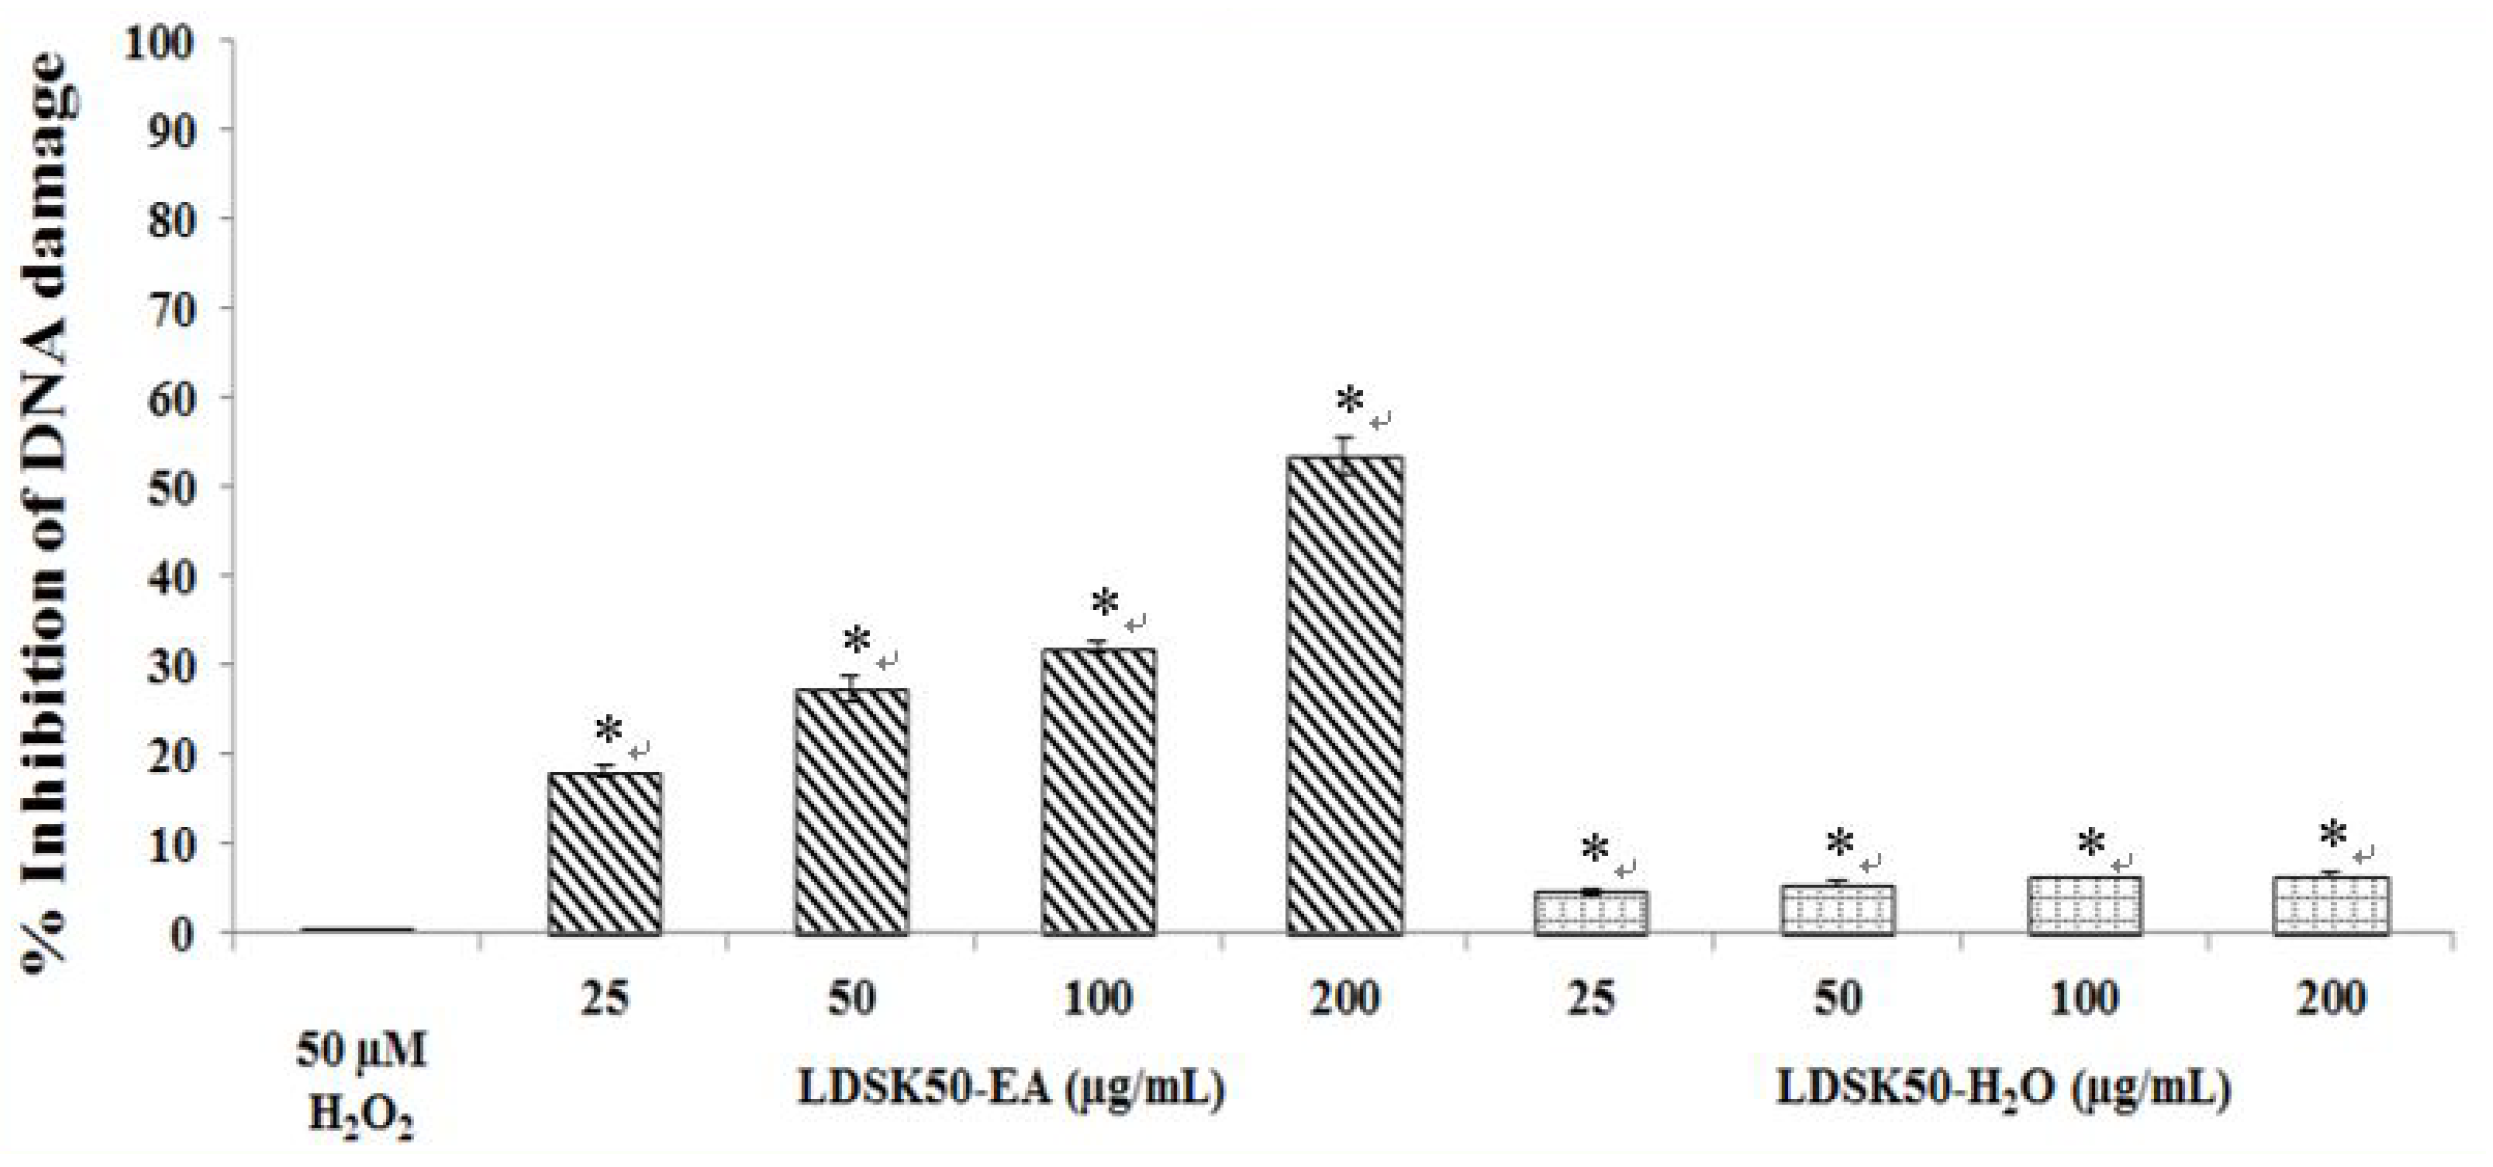
| Treatment | TL (µm) | TM (%) | DNA Damage Inhibition (%) |
|---|---|---|---|
| Untreated | 13.80 ± 0.73 * | 0.42 ± 0.02 * | NC |
| H2O2 50 μM | 55.97 ± 2.56 | 9.93 ± 0.37 | 0.00 ± 0.00 |
| LDSK50-EA 25 μg/mL | 53.82 ± 2.82 | 8.14 ± 0.30 * | 18.04 ± 0.66 * |
| LDSK50-EA 50 μg/mL | 49.50 ± 4.56 | 7.21 ± 0.13 * | 27.29 ± 1.37 * |
| LDSK50-EA 100 μg/mL | 49.37 ± 2.67 | 6.75 ± 0.30 * | 31.99 ± 0.68 * |
| LDSK50-EA 200 μg/mL | 40.75 ± 1.01 * | 4.61 ± 0.10 * | 53.47 ± 1.99 * |
| LDSK50-H2O 25 μg/mL | 58.72 ± 4.56 | 9.46 ± 0.33 | 4.66 ± 0.36 * |
| LDSK50-H2O 50 μg/mL | 54.60 ± 4.58 | 9.37 ± 0.37 | 5.59 ± 0.36 * |
| LDSK50-H2O 100 μg/mL | 58.94 ± 4.81 | 9.30 ± 0.35 | 6.28 ± 0.06 * |
| LDSK50-H2O 200 μg/mL | 56.89 ± 3.72 | 9.28 ± 0.35 | 6.54 ± 0.25 * |

3.3. Determination of Phytochemical Components in LDSK50-EA TLC
TPC Amount
TFC Amount
4. Discussions
4.1. PCL and Deoxyribose Assays of 12 Fractions of L. domesticum Extractions for Antioxidant Capacity against O2−• and OH• Radicals
4.2. Antioxidative DNA Damage Activity of Two Active Fractions, LDSK50-EA and LDSK50-H2O, on TK6 Cells by Comet Assay
4.3. Determination of Phytochemical Components in LDSK50-EA
5. Conclusions
Acknowledgments
Author Contributions
Conflicts of Interests
References
- Saewan, N.; Sutherland, J.D.; Chantrapromma, K. Antimalarial tetranortriterpenoids from the seeds of Lansium domesticum Corr. Phytochemistry 2006, 67, 2288–2293. [Google Scholar] [CrossRef] [PubMed]
- Tilaar, M.; Wih, W.L.; Ranti, A.S.; Wasitaatmadja, S.M.; Suryaningsih; Junardy, F.D. Review of Lansium domesticum Corrêa and its use in cosmetics. Bol. Latinoam. Caribe Plant. Med. Aromaticas 2008, 7, 183–189. [Google Scholar]
- Venkatachalam, K.; Meenune, M. Changes in physiochemical quality and browning related enzyme activity of longkong fruit during four different weeks of on-tree maturation. Food Chem. 2012, 131, 1437–1442. [Google Scholar] [CrossRef]
- Leaman, D.J.; Arnason, J.T.; Yusuf, R.; Sangat-Roemantyo, H.; Soedjito, H.; Angerhofer, C.K. Malaria remedies of the Kenyah of the Apo Kayan, East Kalimantan, Indonesian Borneo: A quantitative assessment of local consensus as an indicator of biological efficacy. J. Ethnopharmacol. 1995, 49, 1–16. [Google Scholar] [CrossRef]
- Monzon, R.B.; Alvior, J.P.; Luczon, L.L.; Morales, A.S.; Mutuc, F.E. Larvicidal potential of five Philippine plants against Aedes aegypti (Linnaeus) and Culex quinquefasciatus (Say). Southeast Asian J. Trop. Med. Public Health 1994, 25, 755–759. [Google Scholar] [PubMed]
- Nishizawa, M.; Nishide, H.; Hayashi, Y.; Kosela, S. The structure of Lansioside A: A novel triterpene glycoside with amino-sugar from lansium domesticum. Tetrahedron Lett. 1982, 23, 1349–1350. [Google Scholar] [CrossRef]
- Tanaka, T.; Ishibashi, M.; Fujimoto, H.; Okuyama, E.; Koyano, T.; Kowithayakorn, T. New onoceranoid triterpene constituents from Lansium domesticum. J. Nat. Prod. 2002, 65, 1709–1711. [Google Scholar] [CrossRef] [PubMed]
- Mayanti, T.; Tjokronegoro, R.; Supratman, U.; Mukhtar, M.R.; Awang, K.; Hadi, A.H. Antifeedant triterpenoids from the seeds and bark of Lansium domesticum cv Kokossan (Meliaceae). Molecules 2011, 16, 2785–2795. [Google Scholar] [CrossRef] [PubMed]
- Nakahara, K.; Trakoontivakorn, G.; Alzoreky, N.S.; Ono, H.; Onishi-Kameyama, M.; Yoshida, M. Antimutagenicity of Some Edible Thai Plants, and a Bioactive Carbazole Alkaloid, Mahanine, Isolated from Micromelum minutum. J. Agric. Food Chem. 2002, 50, 4796–4802. [Google Scholar] [CrossRef] [PubMed]
- Ray, P.D.; Huang, B.W.; Tsuji, Y. Reactive oxygen species (ROS) homeostasis and redox regulation in cellular signaling. Cell. Signal. 2012, 24, 981–990. [Google Scholar] [CrossRef] [PubMed]
- Valko, M.; Leibfritz, D.; Moncol, J.; Cronin, M.T.; Mazur, M.; Telser, J. Free radicals and antioxidants in normal physiological functions and human disease. Int. J. Biochem. Cell Biol. 2007, 39, 44–84. [Google Scholar] [CrossRef] [PubMed]
- Sen, S.; Chakraborty, R.; Sridhar, C.; Reddy, Y.S.R.; Biplab, De. Free radicals, antioxidants, diseases and phytomedicine: Current status and future prospect. Int. J. Pharmaceut. Sci. Rev. Res. 2010, 3, 91–100. [Google Scholar]
- Valko, M.; Rhodes, C.J.; Moncol, J.; Izakovic, M.; Mazur, M. Free radicals, metals and antioxidants in oxidative stress-induced cancer. Chem. Biol. Interact. 2006, 160, 1–40. [Google Scholar] [CrossRef] [PubMed]
- Willcox, J.K.; Ash, S.L.; Catignani, G.L. Antioxidants and prevention of chronic disease. Crit. Rev. Food Sci. Nutr. 2004, 44, 275–295. [Google Scholar] [CrossRef] [PubMed]
- Ďuračková, Z.; Gvozdjáková, A. Oxidants, antioxidants and oxidative stress. In Mitochondrial Medicine; Springer Netherlands Publishing: Houten, Netherland, 2008; pp. 19–54. [Google Scholar]
- Thomasset, S.C.; Berry, D.P.; Garcea, G.; Marczylo, T.; Steward, W.P.; Gescher, A.J. Dietary polyphenolic phytochemicals-promising cancer chemopreventive agents in humans. A review of their clinical properties. Int. J. Cancer 2007, 120, 451–458. [Google Scholar] [CrossRef] [PubMed]
- Henderson, L.; Wolfreys, A.; Fedyk, J.; Bourner, C.; Windebank, S. The ability of the Comet assay to discriminate between genotoxins and cytotoxins. Mutagenesis 1998, 13, 89–94. [Google Scholar] [CrossRef] [PubMed]
- Singh, N.P.; McCoy, M.T.; Tice, R.R.; Schneider, E.L. A simple technique for quantitation of low levels of DNA damage in individual cells. Exp. Cell Res. 1988, 175, 184–191. [Google Scholar] [CrossRef]
- Choi, Y.M.; Noh, D.O.; Cho, S.Y.; Suh, H.J.; Kim, K.M.; Kim, J.M. Antioxidant and antimicrobial activities of propolis from several regions of Korea. LWT Food Sci. Technol. 2006, 39, 756–761. [Google Scholar] [CrossRef]
- Yu, L.; Haley, S.; Perret, J.; Harris, M.; Wilson, J.; Qian, M. Free radical scavenging properties of wheat extracts. J. Agric. Food Chem. 2002, 50, 1619–1624. [Google Scholar] [CrossRef] [PubMed]
- Amensour, M.; Sendra, E.; Perez-Alvarez, J.A.; Skali-Senhaji, N.; Abrini, J.; Fernandez-Lopez, J. Antioxidant activity and chemical content of methanol and ethanol extracts from leaves of rockrose (Cistus ladaniferus). Plant Foods Hum. Nutr. 2010, 65, 170–178. [Google Scholar] [CrossRef] [PubMed]
- Kohen, R.; Nyska, A. Oxidation of Biological Systems: Oxidative Stress Phenomena, Antioxidants, Redox Reactions, and Methods for Their Quantification. Toxicol. Pathol. 2002, 30, 620–650. [Google Scholar] [CrossRef] [PubMed]
- Popov, I.; Lewin, G. Antioxidative homeostasis: Characterization by means of chemiluminescent technique. Methods Enzymol. 1999, 300, 437–456. [Google Scholar] [PubMed]
- Popov, I.; Lewin, G. Photochemiluminescent detection of antiradical activity; IV: Testing of lipid-soluble antioxidants. J. Biochem. Biophys. Methods 1996, 31, 1–8. [Google Scholar] [CrossRef]
- Besco, E.; Braccioli, E.; Vertuani, S.; Ziosi, P.; Brazzo, F.; Bruni, R. The use of photochemiluminescence for the measurement of the integral antioxidant capacity of baobab products. Food Chem. 2007, 102, 1352–1356. [Google Scholar] [CrossRef]
- Gutteridge, J.M.; Halliwell, B. The deoxyribose assay: An assay both for ‘free’ hydroxyl radical and for site-specific hydroxyl radical production. Biochem. J. 1988, 253, 932–933. [Google Scholar] [CrossRef] [PubMed]
- Okezie, A. Deoxyribose assay for detecting hydroxyl radicals. Methods Enzymol. 1994, 233, 57–66. [Google Scholar]
- Genaro-Mattos, T.C.; Dalvi, L.T.; Oliveira, R.G.; Ginani, J.S.; Hermes-Lima, M. Reevaluation of the 2-deoxyribose assay for determination of free radical formation. Biochim. Biophys. Acta 2009, 1790, 1636–1642. [Google Scholar] [CrossRef] [PubMed]
- Zou, Y.; Lu, Y.; Wei, D. Antioxidant Activity of a Flavonoid-Rich Extract of Hypericum perforatum L. in Vitro. J. Agric. Food Chem. 2004, 52, 5032–5039. [Google Scholar] [CrossRef] [PubMed]
- Collins, A.R. The comet assay for DNA damage and repair: Principles, applications, and limitations. Mol. Biotechnol. 2004, 26, 249–261. [Google Scholar] [CrossRef]
- Tice, R.R.; Agurell, E.; Anderson, D.; Burlinson, B.; Hartmann, A.; Kobayashi, H. Single cell gel/comet assay: Guidelines for in vitro and in vivo genetic toxicology testing. Environ. Mol. Mutagen. 2000, 35, 206–221. [Google Scholar] [CrossRef]
- Cemeli, E.; Baumgartner, A.; Anderson, D. Antioxidants and the Comet assay. Mutat. Res. 2009, 681, 51–67. [Google Scholar] [CrossRef] [PubMed]
- Moller, P. Genotoxicity of environmental agents assessed by the alkaline comet assay. Basic Clin. Pharmacol. Toxicol. 2005, 96, 1–42. [Google Scholar] [PubMed]
- Speit, G.; Hartmann, A. The comet assay: A sensitive genotoxicity test for the detection of DNA damage and repair. Methods Mol. Biol. 2006, 314, 275–286. [Google Scholar] [PubMed]
- Rojas, E.; Lopez, M.C.; Valverde, M. Single cell gel electrophoresis assay: Methodology and applications. J. Chromatogr. B Biomed. Sci. Appl. 1999, 722, 225–254. [Google Scholar] [CrossRef]
- Duarte, T.L.; Jones, G.D.D. Vitamin C modulation of H2O2-induced damage and iron homeostasis in human cells. Free Radic. Biol. Med. 2007, 43, 1165–1175. [Google Scholar] [CrossRef] [PubMed]
- Halliwell, B.; Clement, M.V.; Ramalingam, J.; Long, L.H. Hydrogen Peroxide. Ubiquitous in Cell Culture and In vivo? IUBMB Life 2000, 50, 251–257. [Google Scholar] [CrossRef] [PubMed]
- Burlinson, B.; Tice, R.R.; Speit, G.; Agurell, E.; Brendler-Schwaab, S.Y.; Collins, A.R. Fourth International Workgroup on Genotoxicity testing: Results of the in vivo Comet assay workgroup. Mutat. Res. 2007, 627, 31–35. [Google Scholar] [CrossRef] [PubMed]
- Kumaravel, T.S.; Vilhar, B.; Faux, S.P.; Jha, A.N. Comet Assay measurements: A perspective. Cell Biol. Toxicol. 2009, 25, 53–64. [Google Scholar] [CrossRef] [PubMed]
- Jork, H.; Funk, W.; Fischer, W.; Hans, W. Thin layer chromatography: Reagents and detection methods. In Physical and Chemical Detection Methods: Fundamentals, Reagents; VCH: Weinheim, Germany, 1990. [Google Scholar]
- Robbins, R.J. Phenolic Acids in Foods: An Overview of Analytical Methodology. J. Agric. Food Chem. 2003, 51, 2866–2887. [Google Scholar] [CrossRef] [PubMed]
- Vermerris, W.; Nicholson, R. Families of phenolic compound. In Biochemistry; Springer: Dordrecht, The Netherlands, 2006; pp. 1–34. [Google Scholar]
- Chang, C.C.; Yang, M.H.; Wen, H.M.; Chern, J.C. Estimation of Total Flavonoid Content in Propolis by Two Complementary Colorimetric Methods. J. Food Drug Anal. 2002, 10, 178–182. [Google Scholar]
- Huang, W.Y.; Cai, Y.Z.; Corke, H.; Sun, M. Survey of antioxidant capacity and nutritional quality of selected edible and medicinal fruit plants in Hong Kong. J. Food Compos. Anal. 2010, 23, 510–517. [Google Scholar] [CrossRef]
- Okonogi, S.; Duangrat, C.; Anuchpreeda, S.; Tachakittirungrod, S.; Chowwanapoonpohn, S. Comparison of antioxidant capacities and cytotoxicities of certain fruit peels. Food Chem. 2007, 103, 839–846. [Google Scholar] [CrossRef]
- Tachakittirungrod, S.; Okonogi, S.; Chowwanapoonpohn, S. Study on antioxidant activity of certain plants in Thailand: Mechanism of antioxidant action of guava leaf extract. Food Chem. 2007, 103, 381–388. [Google Scholar] [CrossRef]
- Vermerris, W.; Nicholson, R. Isolation and identification of phenolic compounds. In Biochemistry; Springer: Dordrecht, The Netherlands, 2006; pp. 151–196. [Google Scholar]
- Lin, J.K.; Weng, M.S. Flavonoids as nutraceuticals. In The Science of Flavonoids; Grotewold, E., Ed.; Springer: New York, NY, USA, 2006; pp. 213–238. [Google Scholar]
- Bent, H.H. The biochemistry and medical significance of the flavonoids. Pharmacol. Therap. 2002, 96, 67–202. [Google Scholar]
© 2015 by the authors; licensee MDPI, Basel, Switzerland. This article is an open access article distributed under the terms and conditions of the Creative Commons Attribution license (http://creativecommons.org/licenses/by/4.0/).
Share and Cite
Klungsupya, P.; Suthepakul, N.; Muangman, T.; Rerk-Am, U.; Thongdon-A, J. Determination of Free Radical Scavenging, Antioxidative DNA Damage Activities and Phytochemical Components of Active Fractions from Lansium domesticum Corr. Fruit. Nutrients 2015, 7, 6852-6873. https://doi.org/10.3390/nu7085312
Klungsupya P, Suthepakul N, Muangman T, Rerk-Am U, Thongdon-A J. Determination of Free Radical Scavenging, Antioxidative DNA Damage Activities and Phytochemical Components of Active Fractions from Lansium domesticum Corr. Fruit. Nutrients. 2015; 7(8):6852-6873. https://doi.org/10.3390/nu7085312
Chicago/Turabian StyleKlungsupya, Prapaipat, Nava Suthepakul, Thanchanok Muangman, Ubon Rerk-Am, and Jeerayu Thongdon-A. 2015. "Determination of Free Radical Scavenging, Antioxidative DNA Damage Activities and Phytochemical Components of Active Fractions from Lansium domesticum Corr. Fruit" Nutrients 7, no. 8: 6852-6873. https://doi.org/10.3390/nu7085312
APA StyleKlungsupya, P., Suthepakul, N., Muangman, T., Rerk-Am, U., & Thongdon-A, J. (2015). Determination of Free Radical Scavenging, Antioxidative DNA Damage Activities and Phytochemical Components of Active Fractions from Lansium domesticum Corr. Fruit. Nutrients, 7(8), 6852-6873. https://doi.org/10.3390/nu7085312