Biomarkers of Selenium Status

Abstract
:1. Introduction
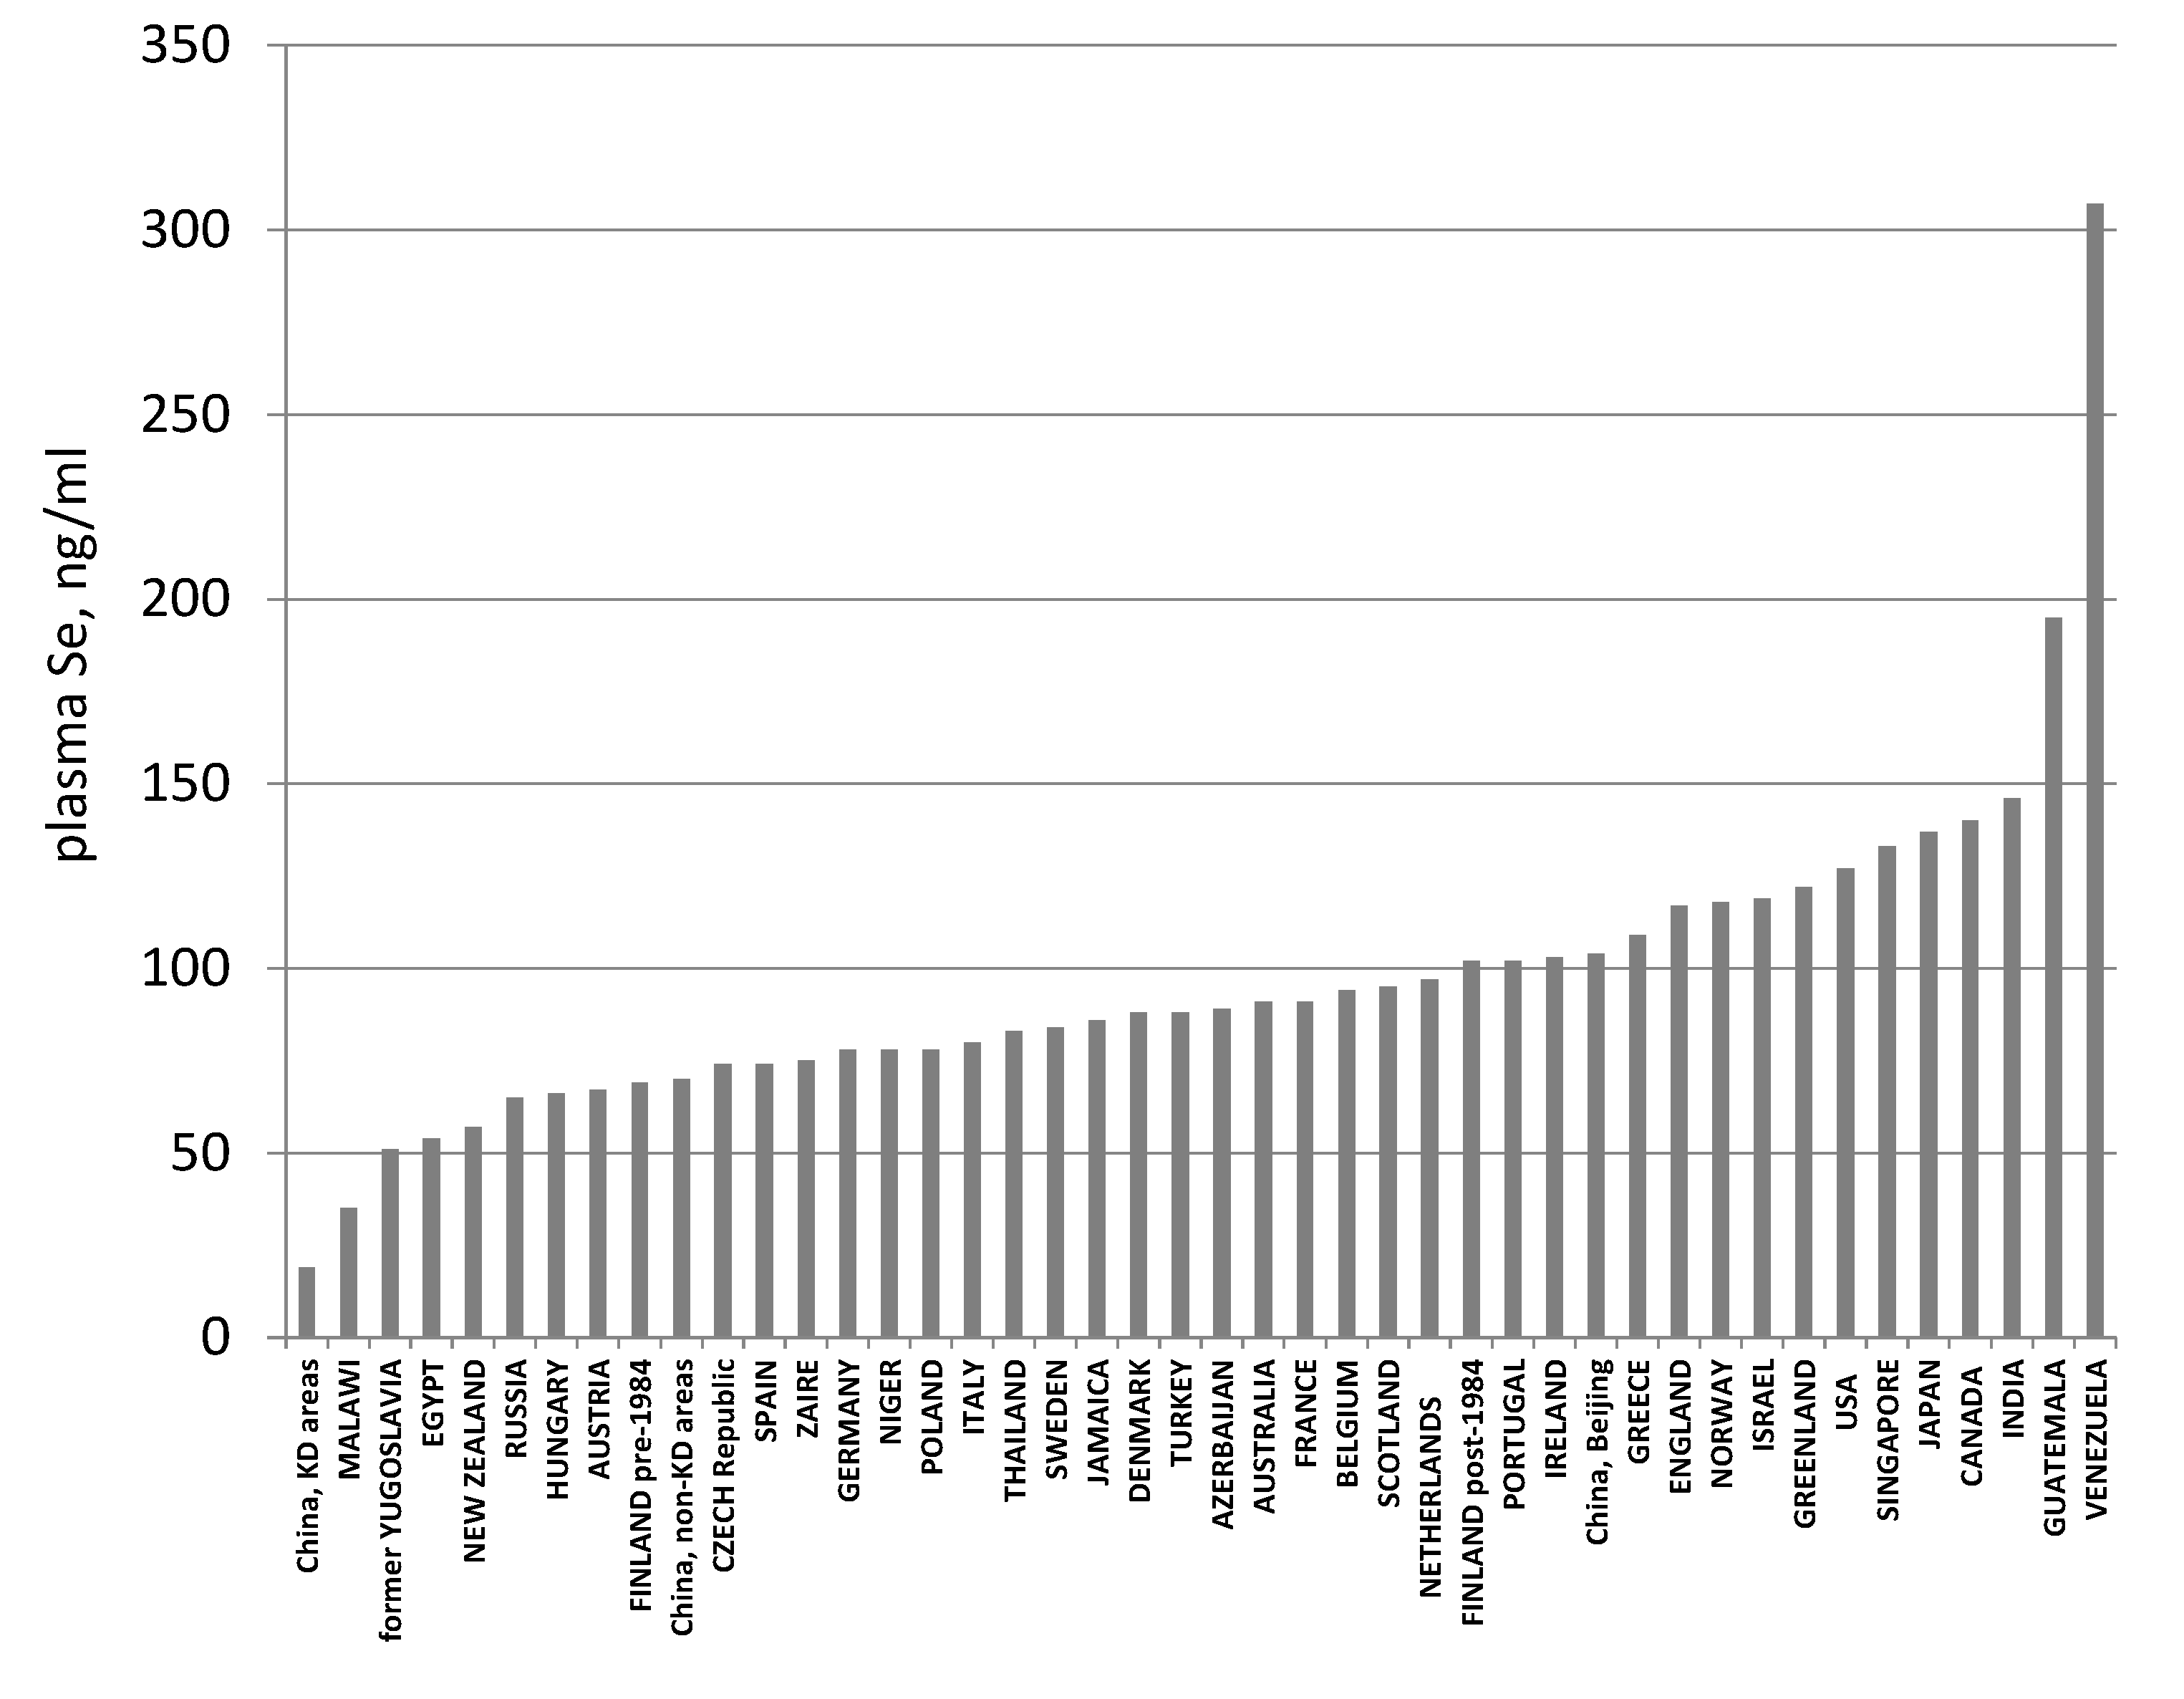
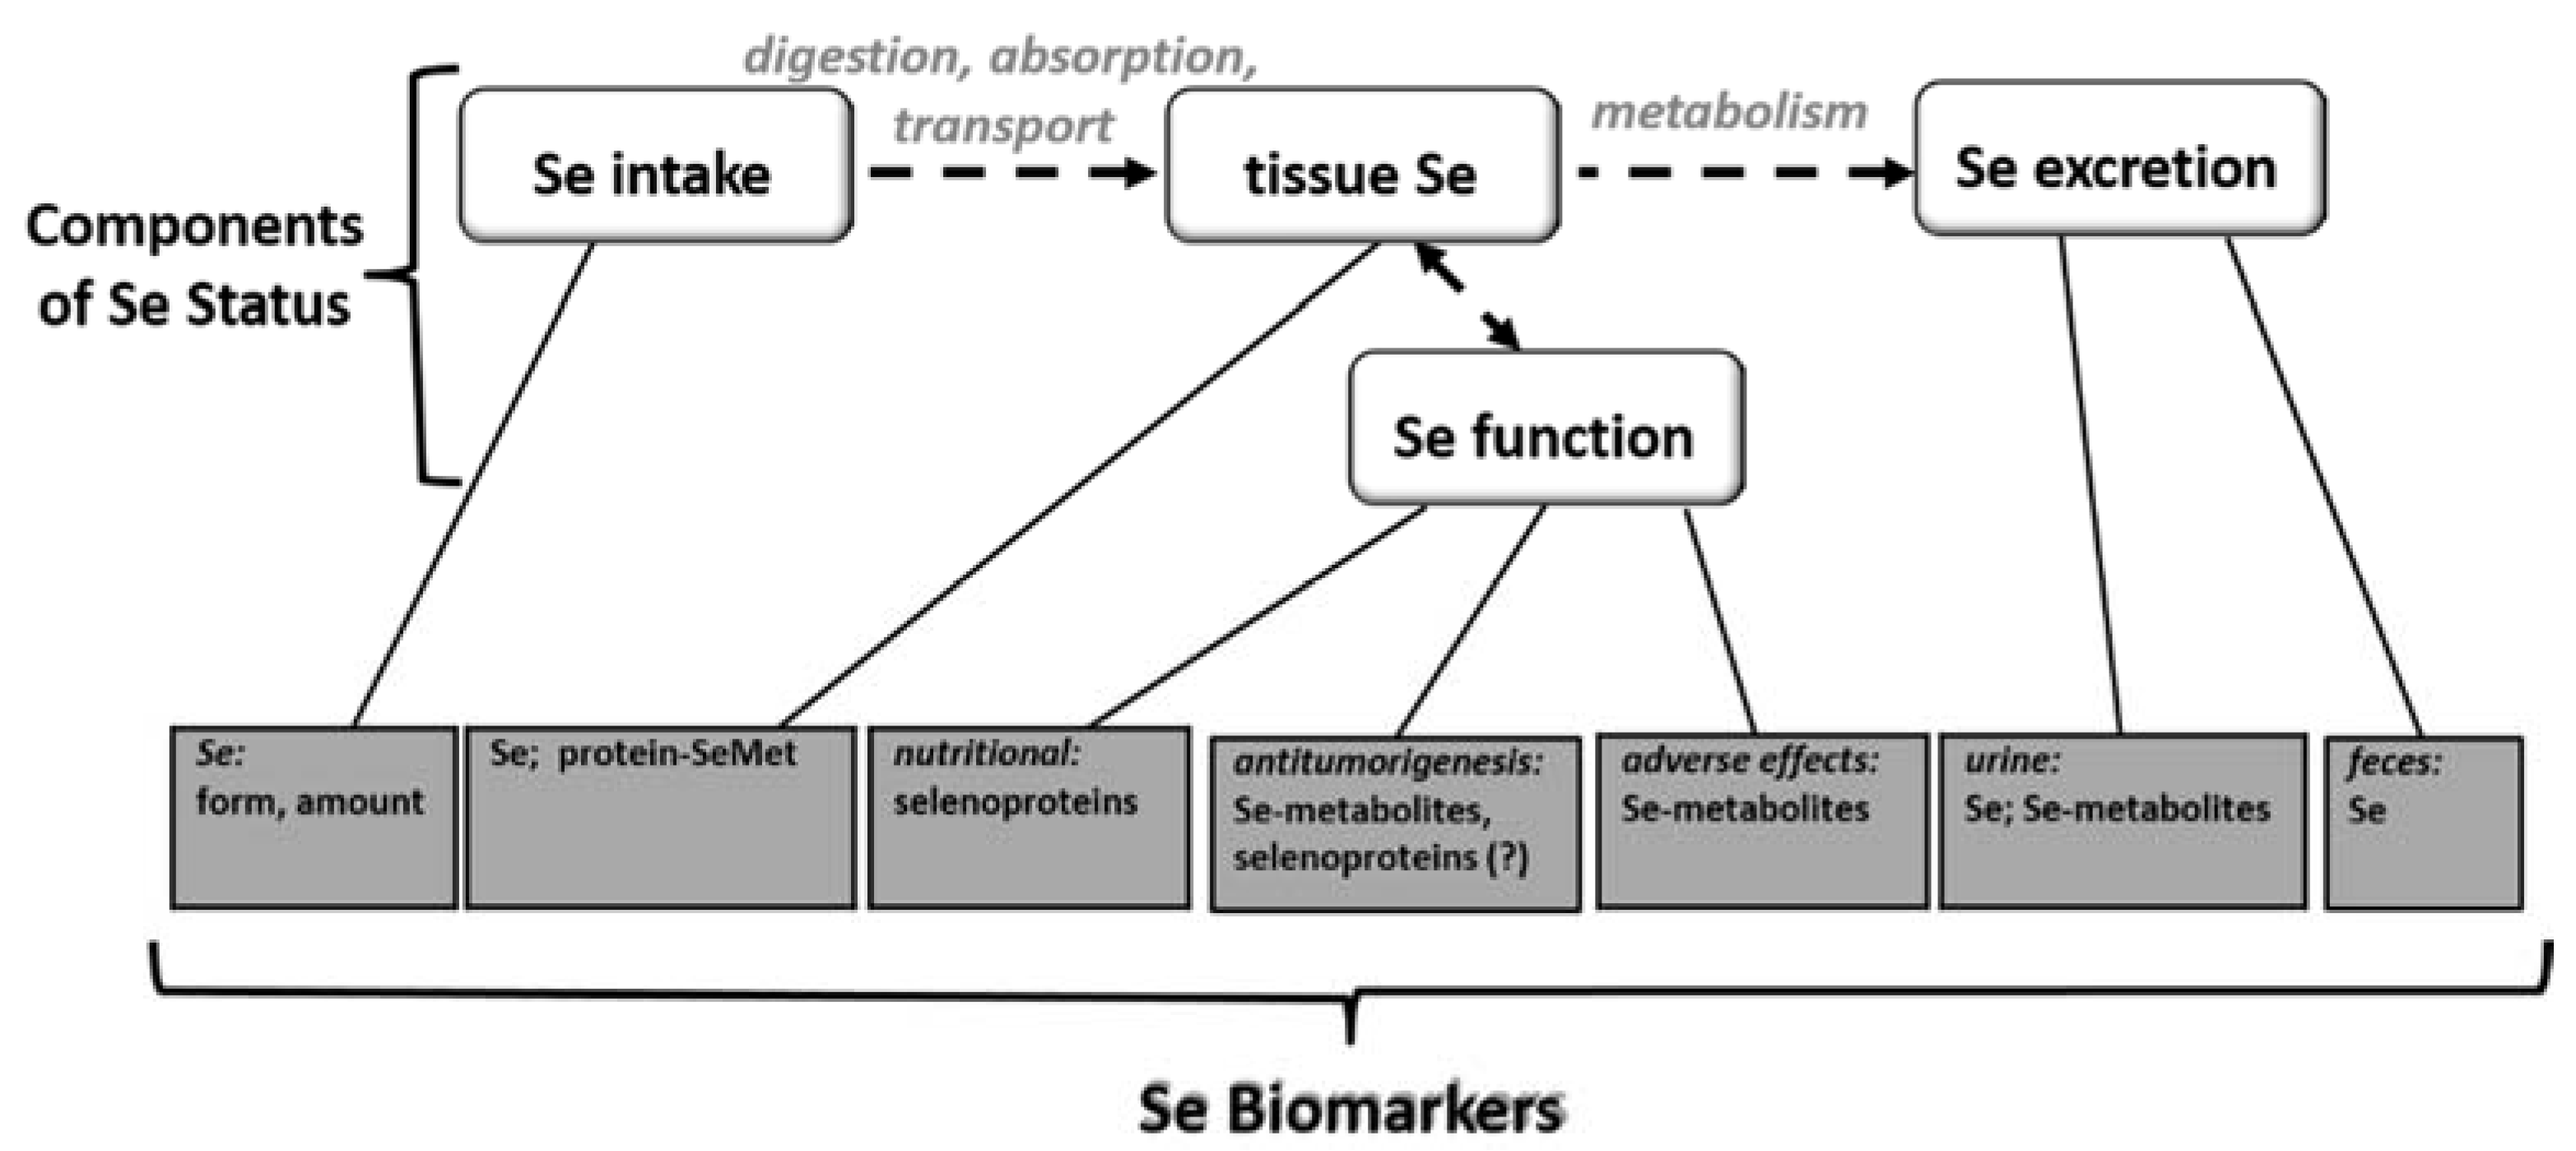
2. Selenium Status

3. Selenium Biomarkers
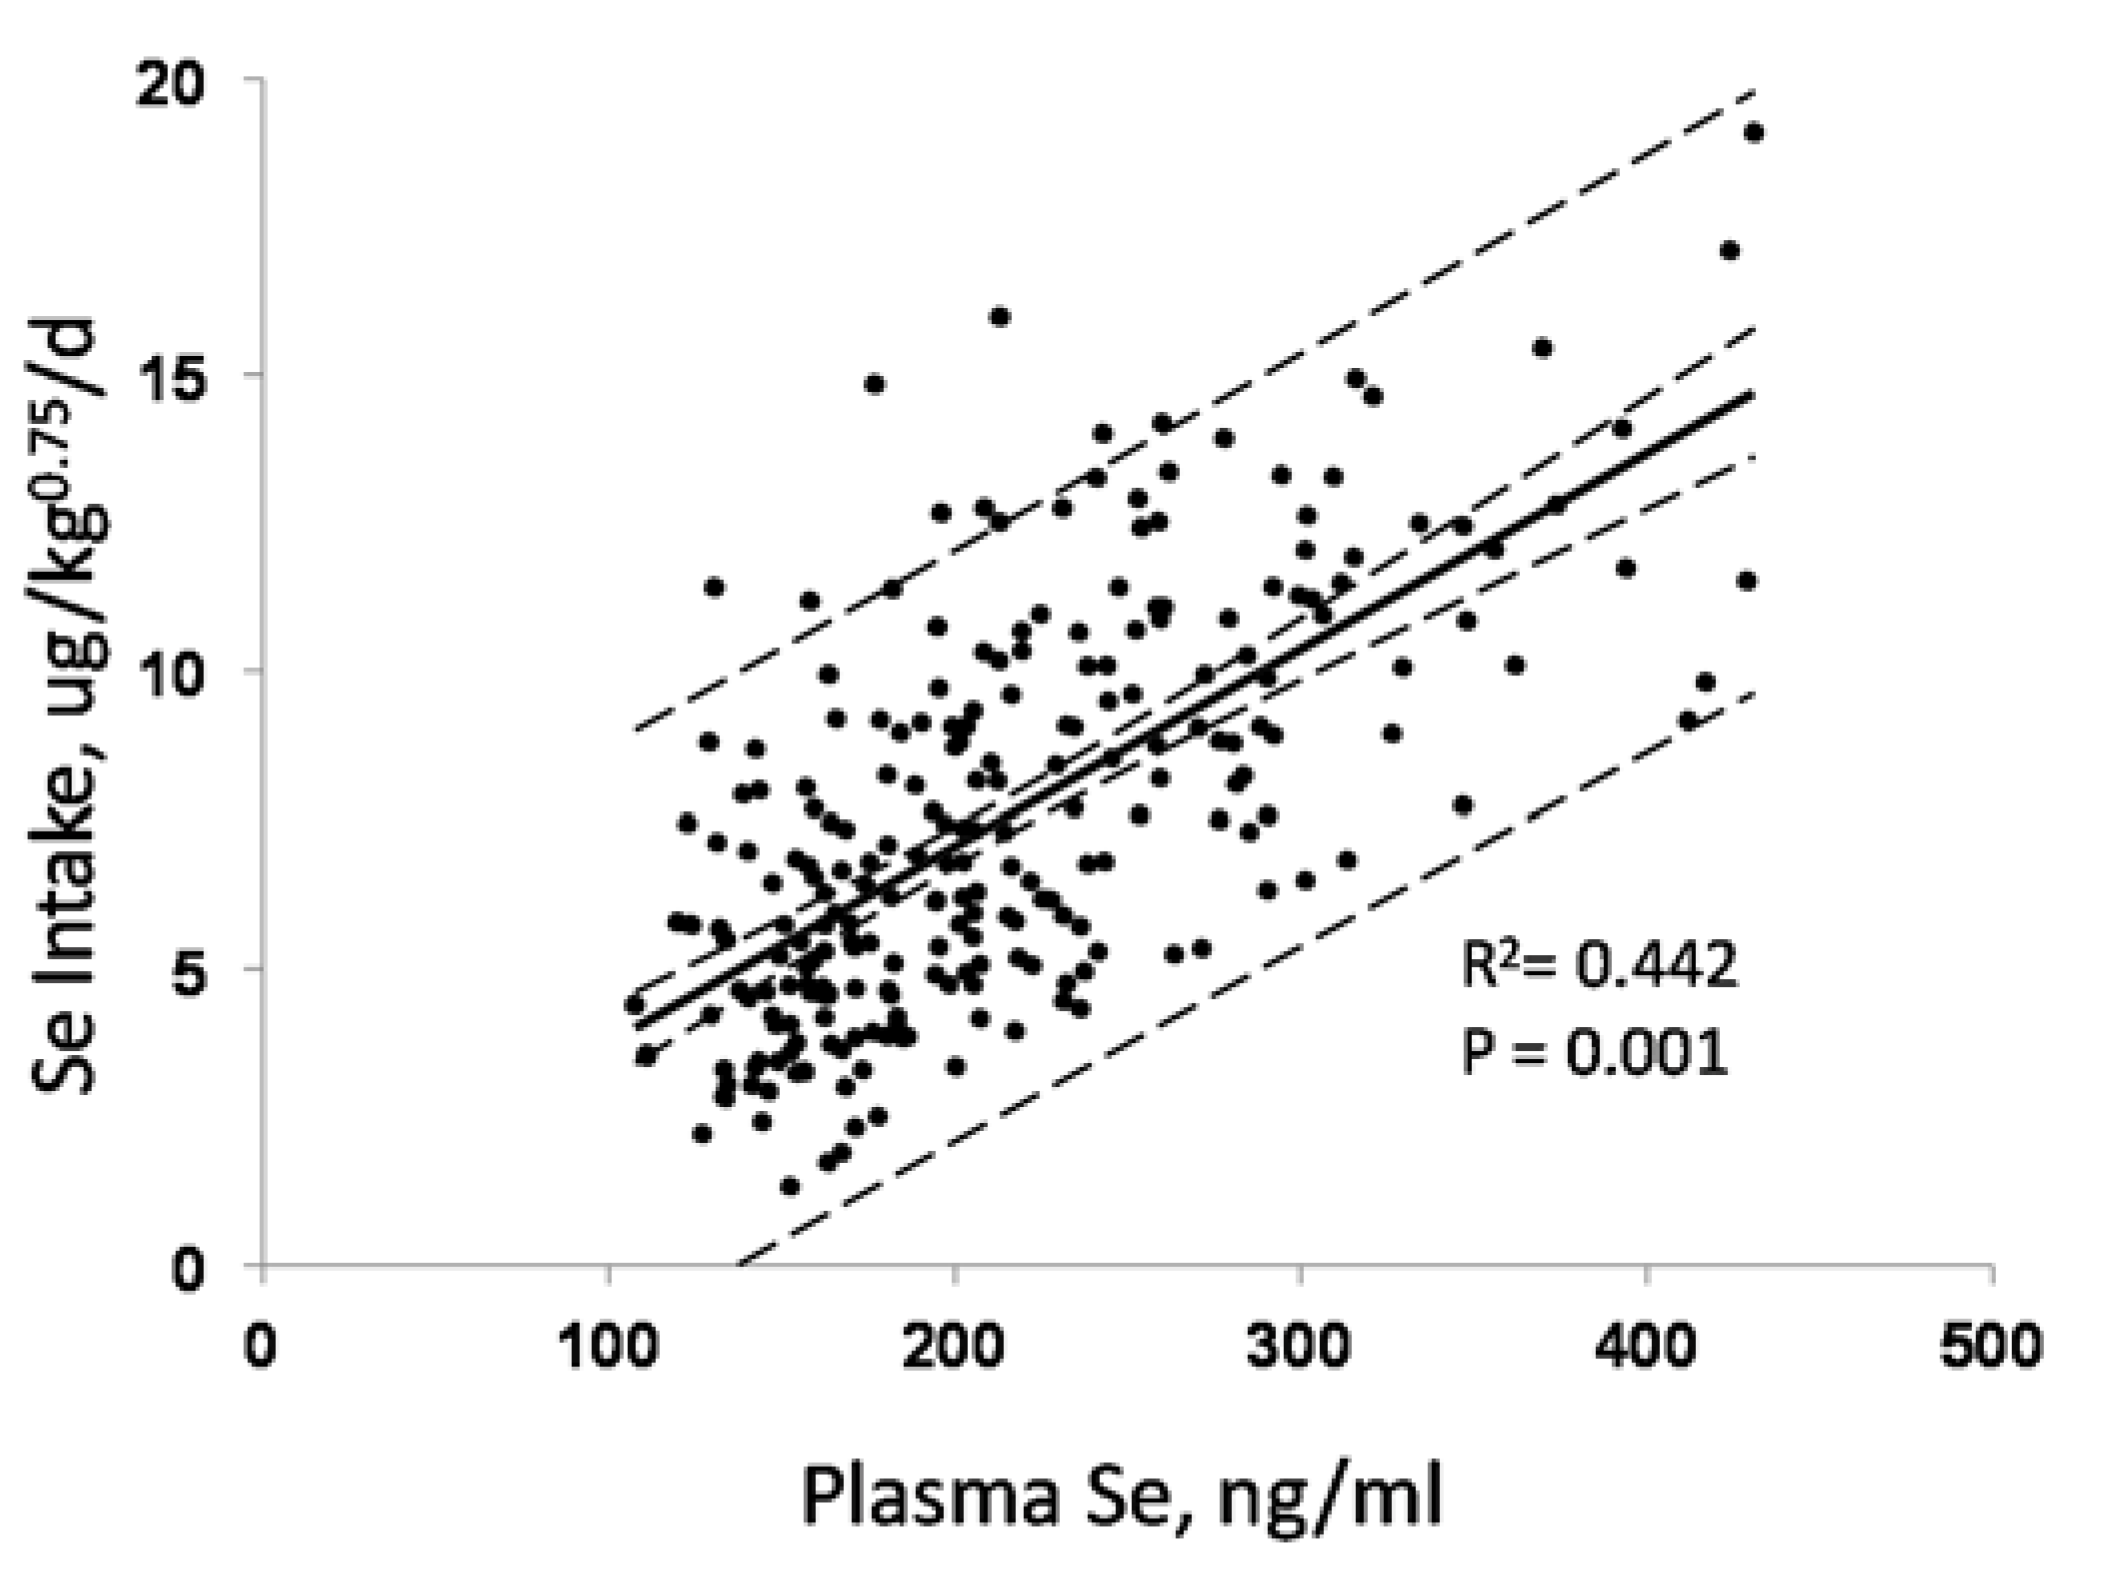
3.1. Biomarkers of Selenium Intake

3.2. Biomarkers of Selenium Retention

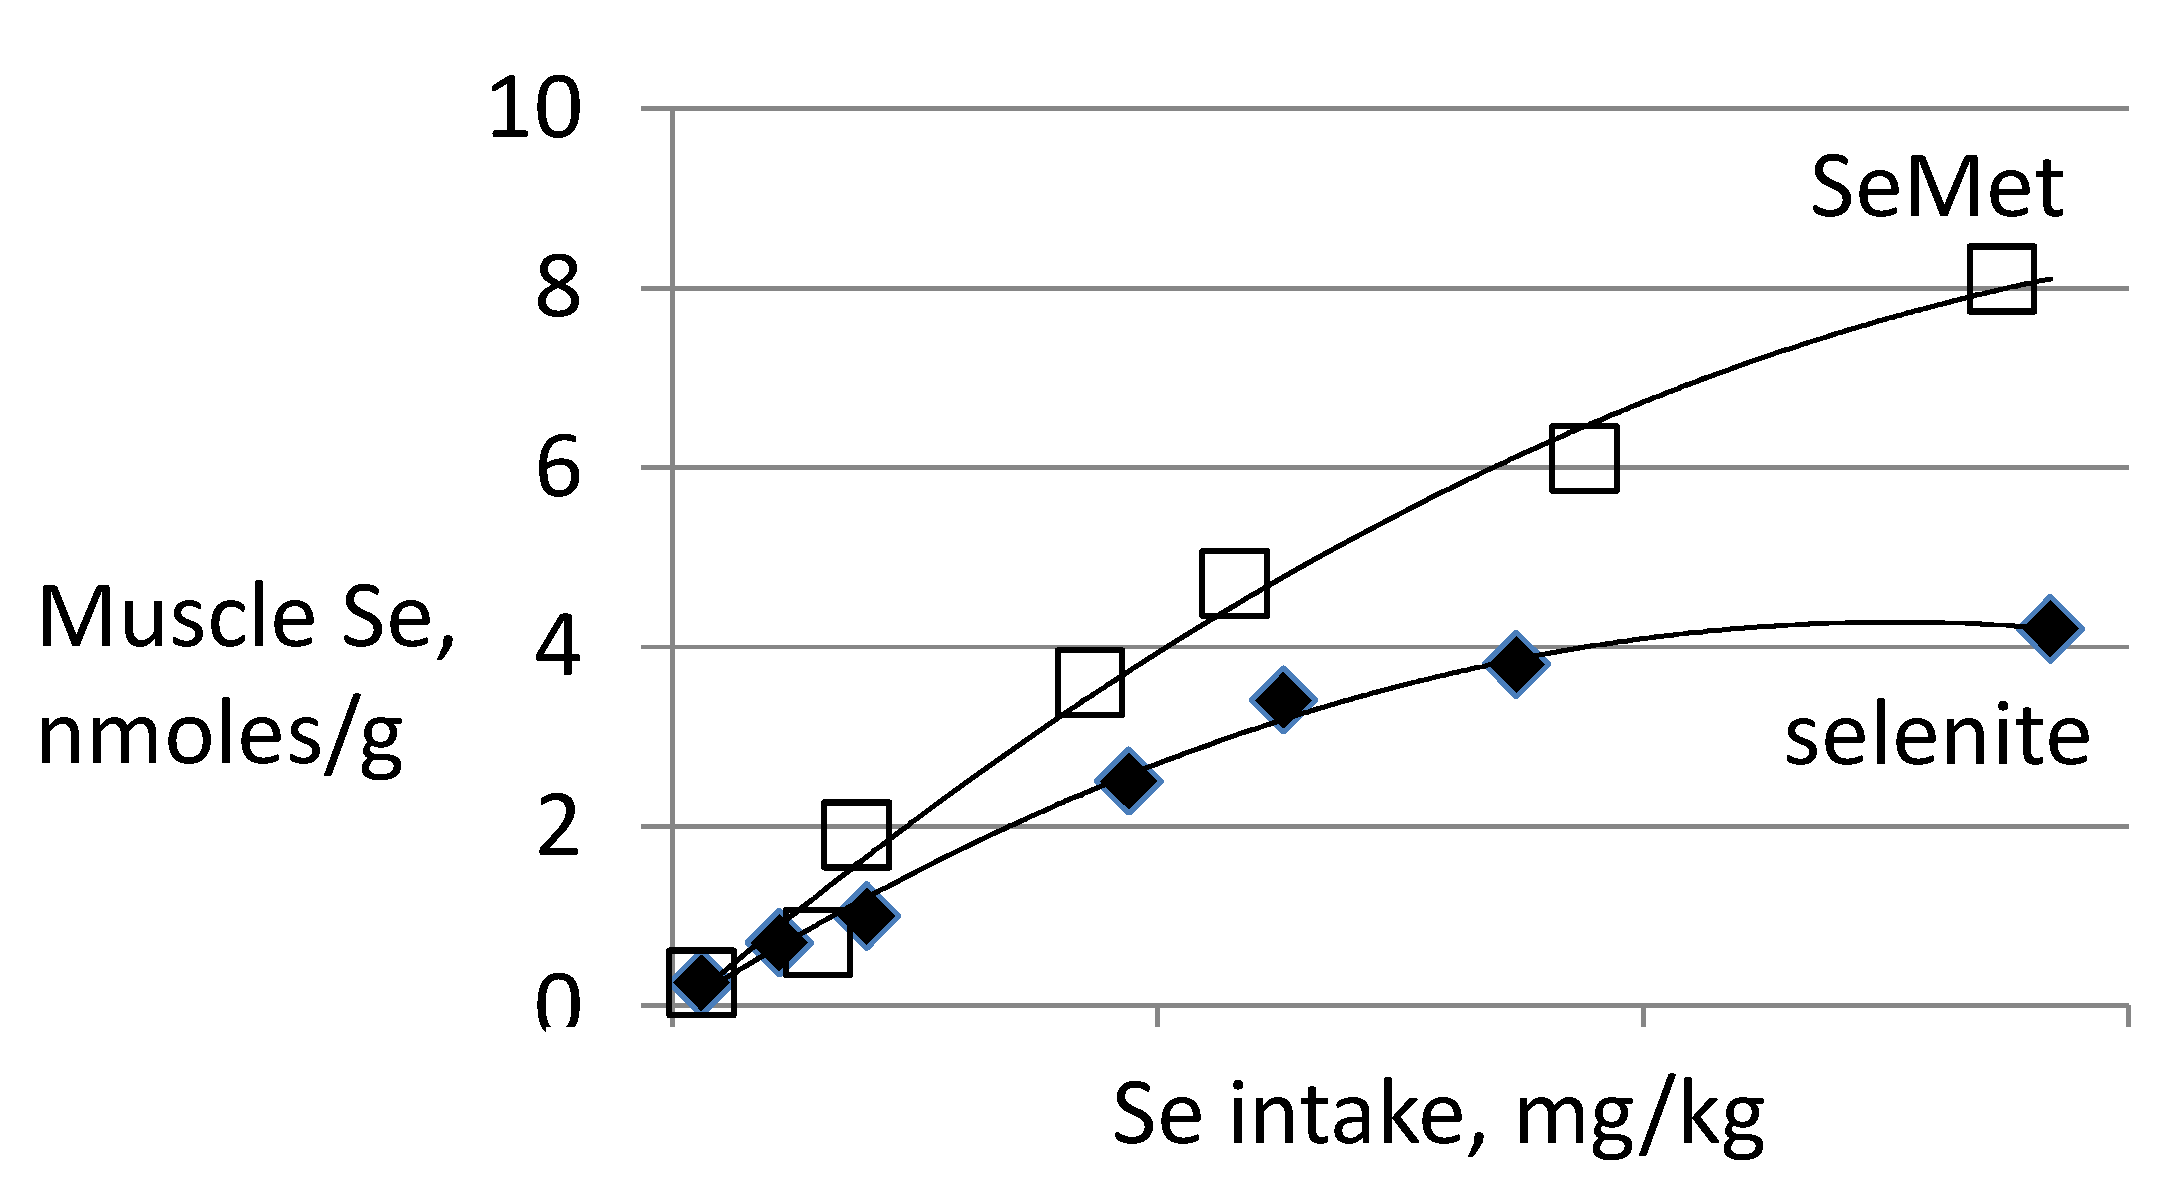
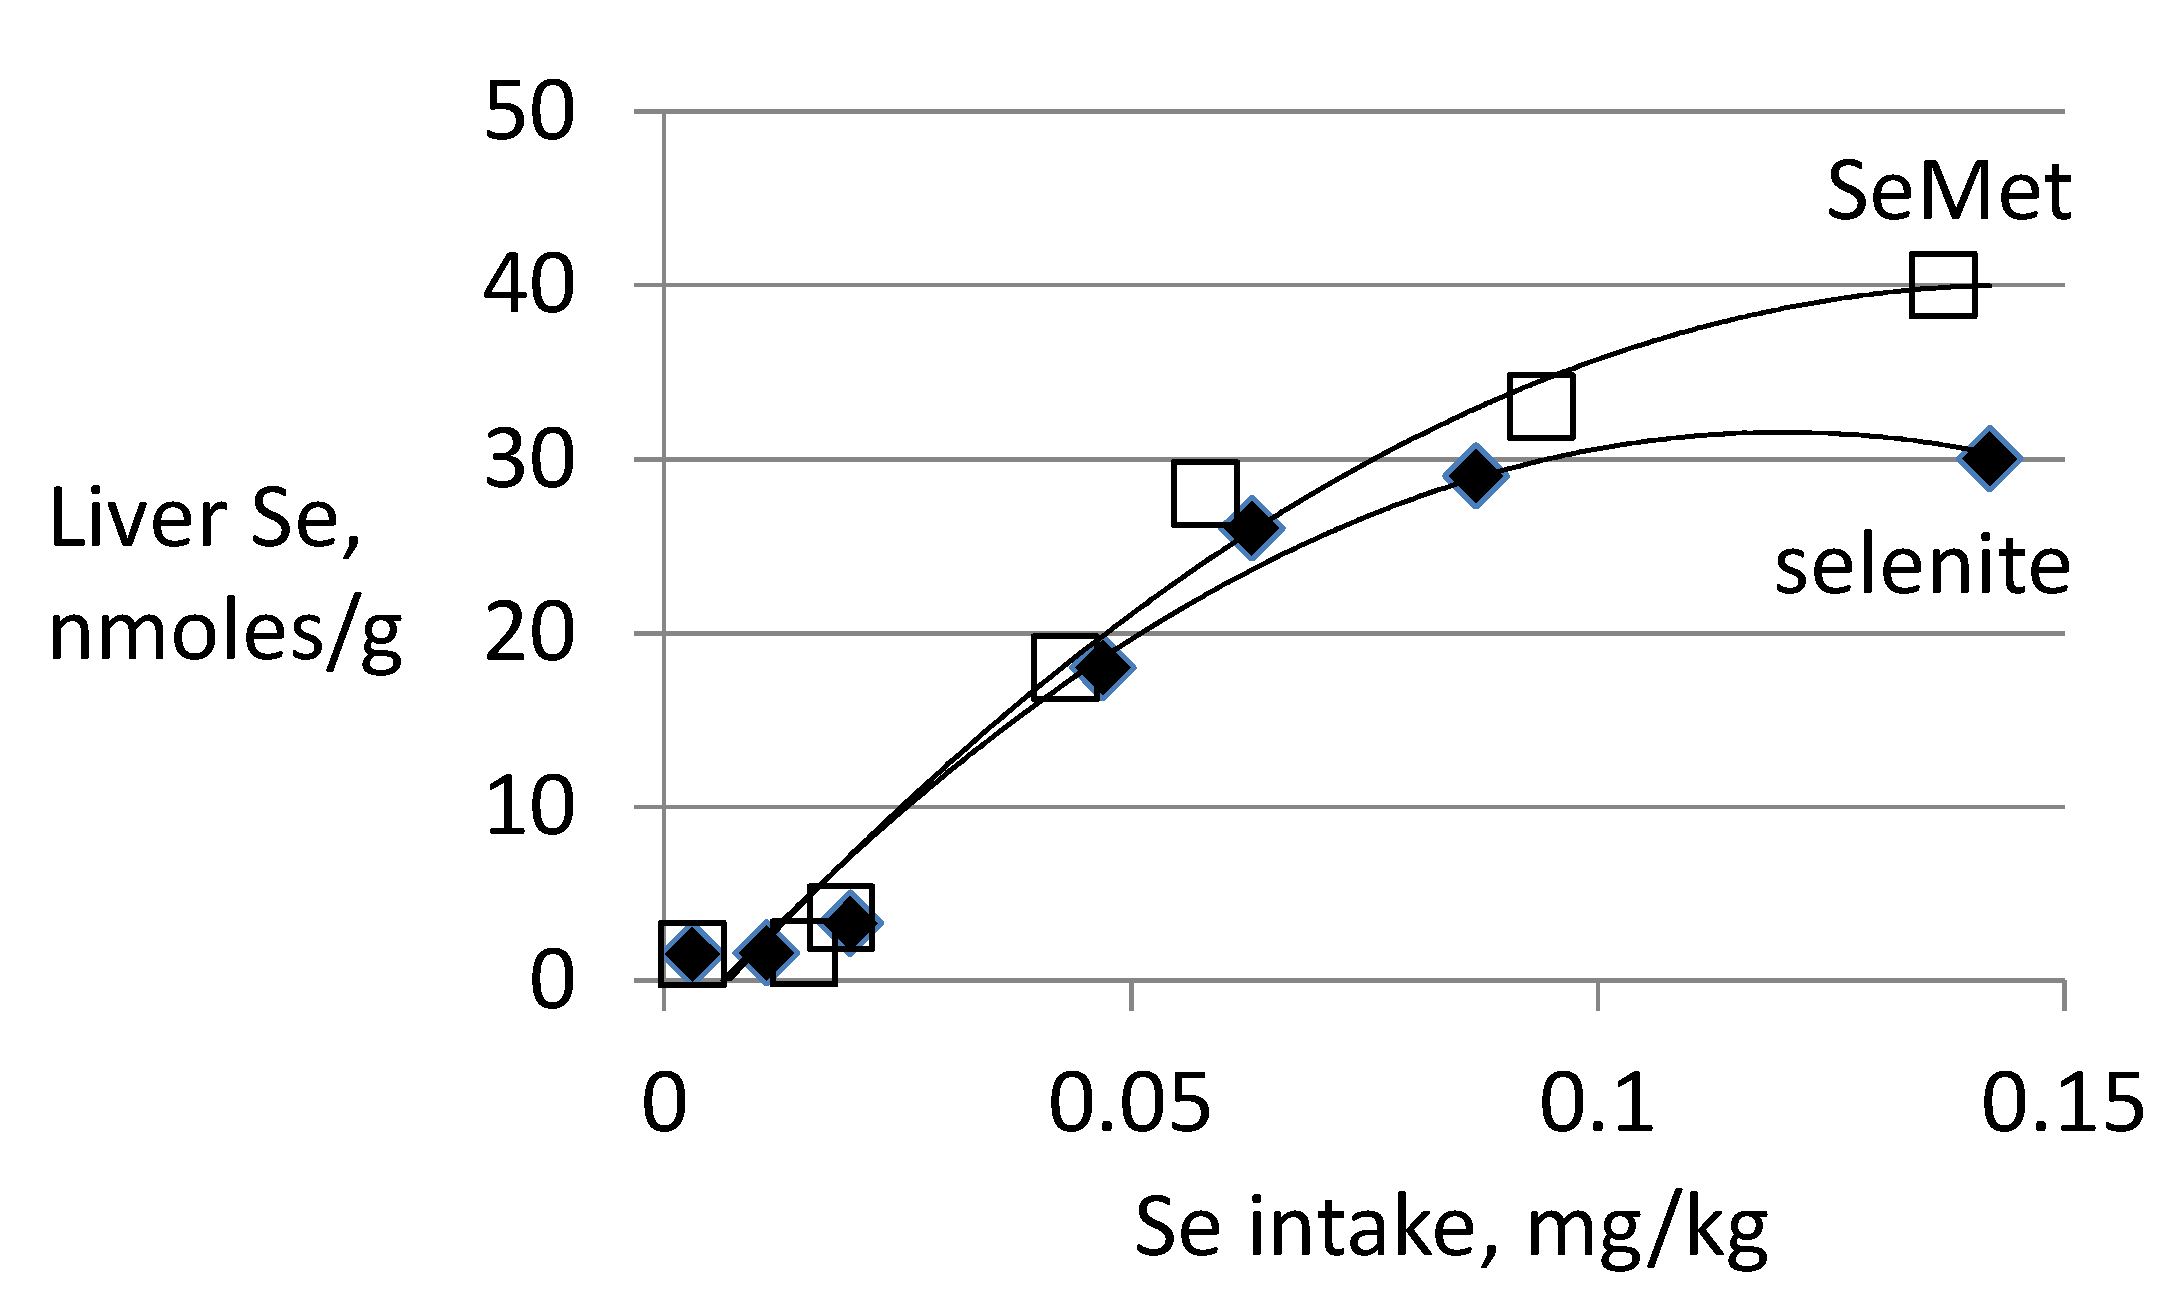
3.3. Biomarkers of Tissue Selenium Levels

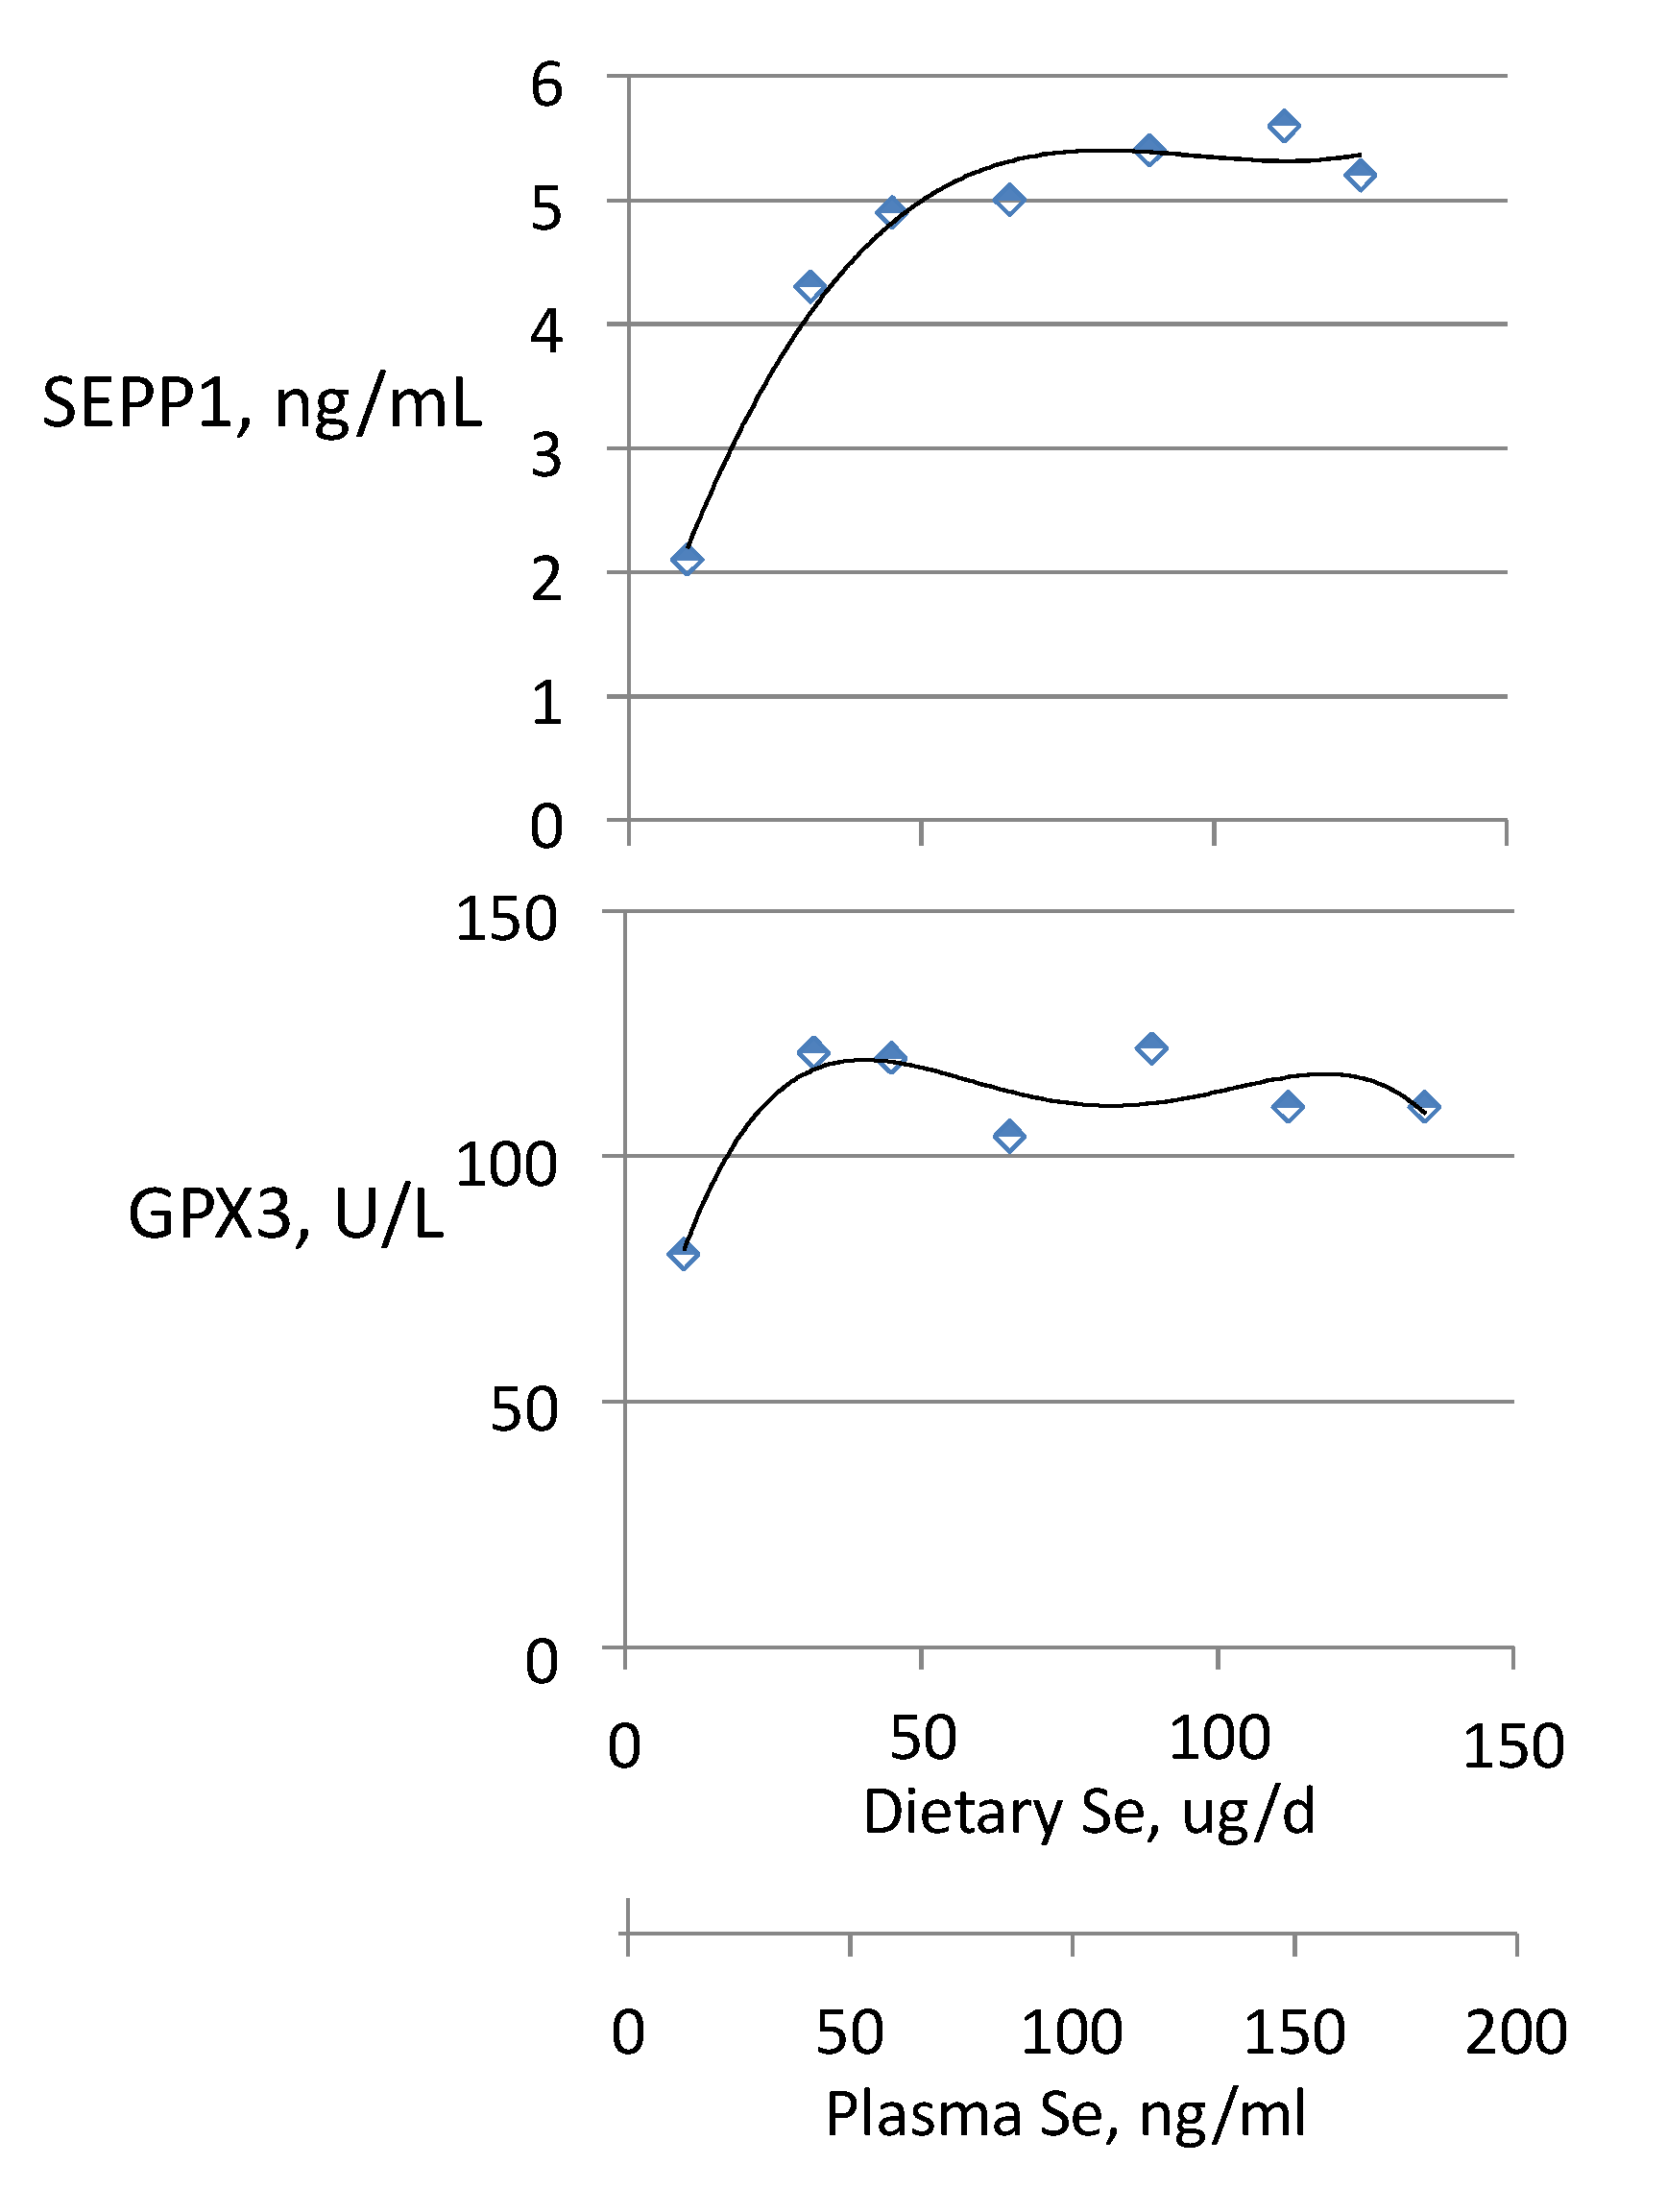
3.4. Biomarkers of Se Function
- Glutathione Peroxidases (GPXs), which reduce hydroperoxides using reducing equivalents from reduced glutathione [75];
- Thioredoxin Reductases (TXNRDs), NADPH-dependent flavoenzymes that function in intracellular redox regulation by reducing thioredoxin [76];
- Iodothyronine Deiodinases (DIOs), which remove iodine from the thyroid hormones (T4, T3) in the metabolism of the active hormone, T3 [77]; and
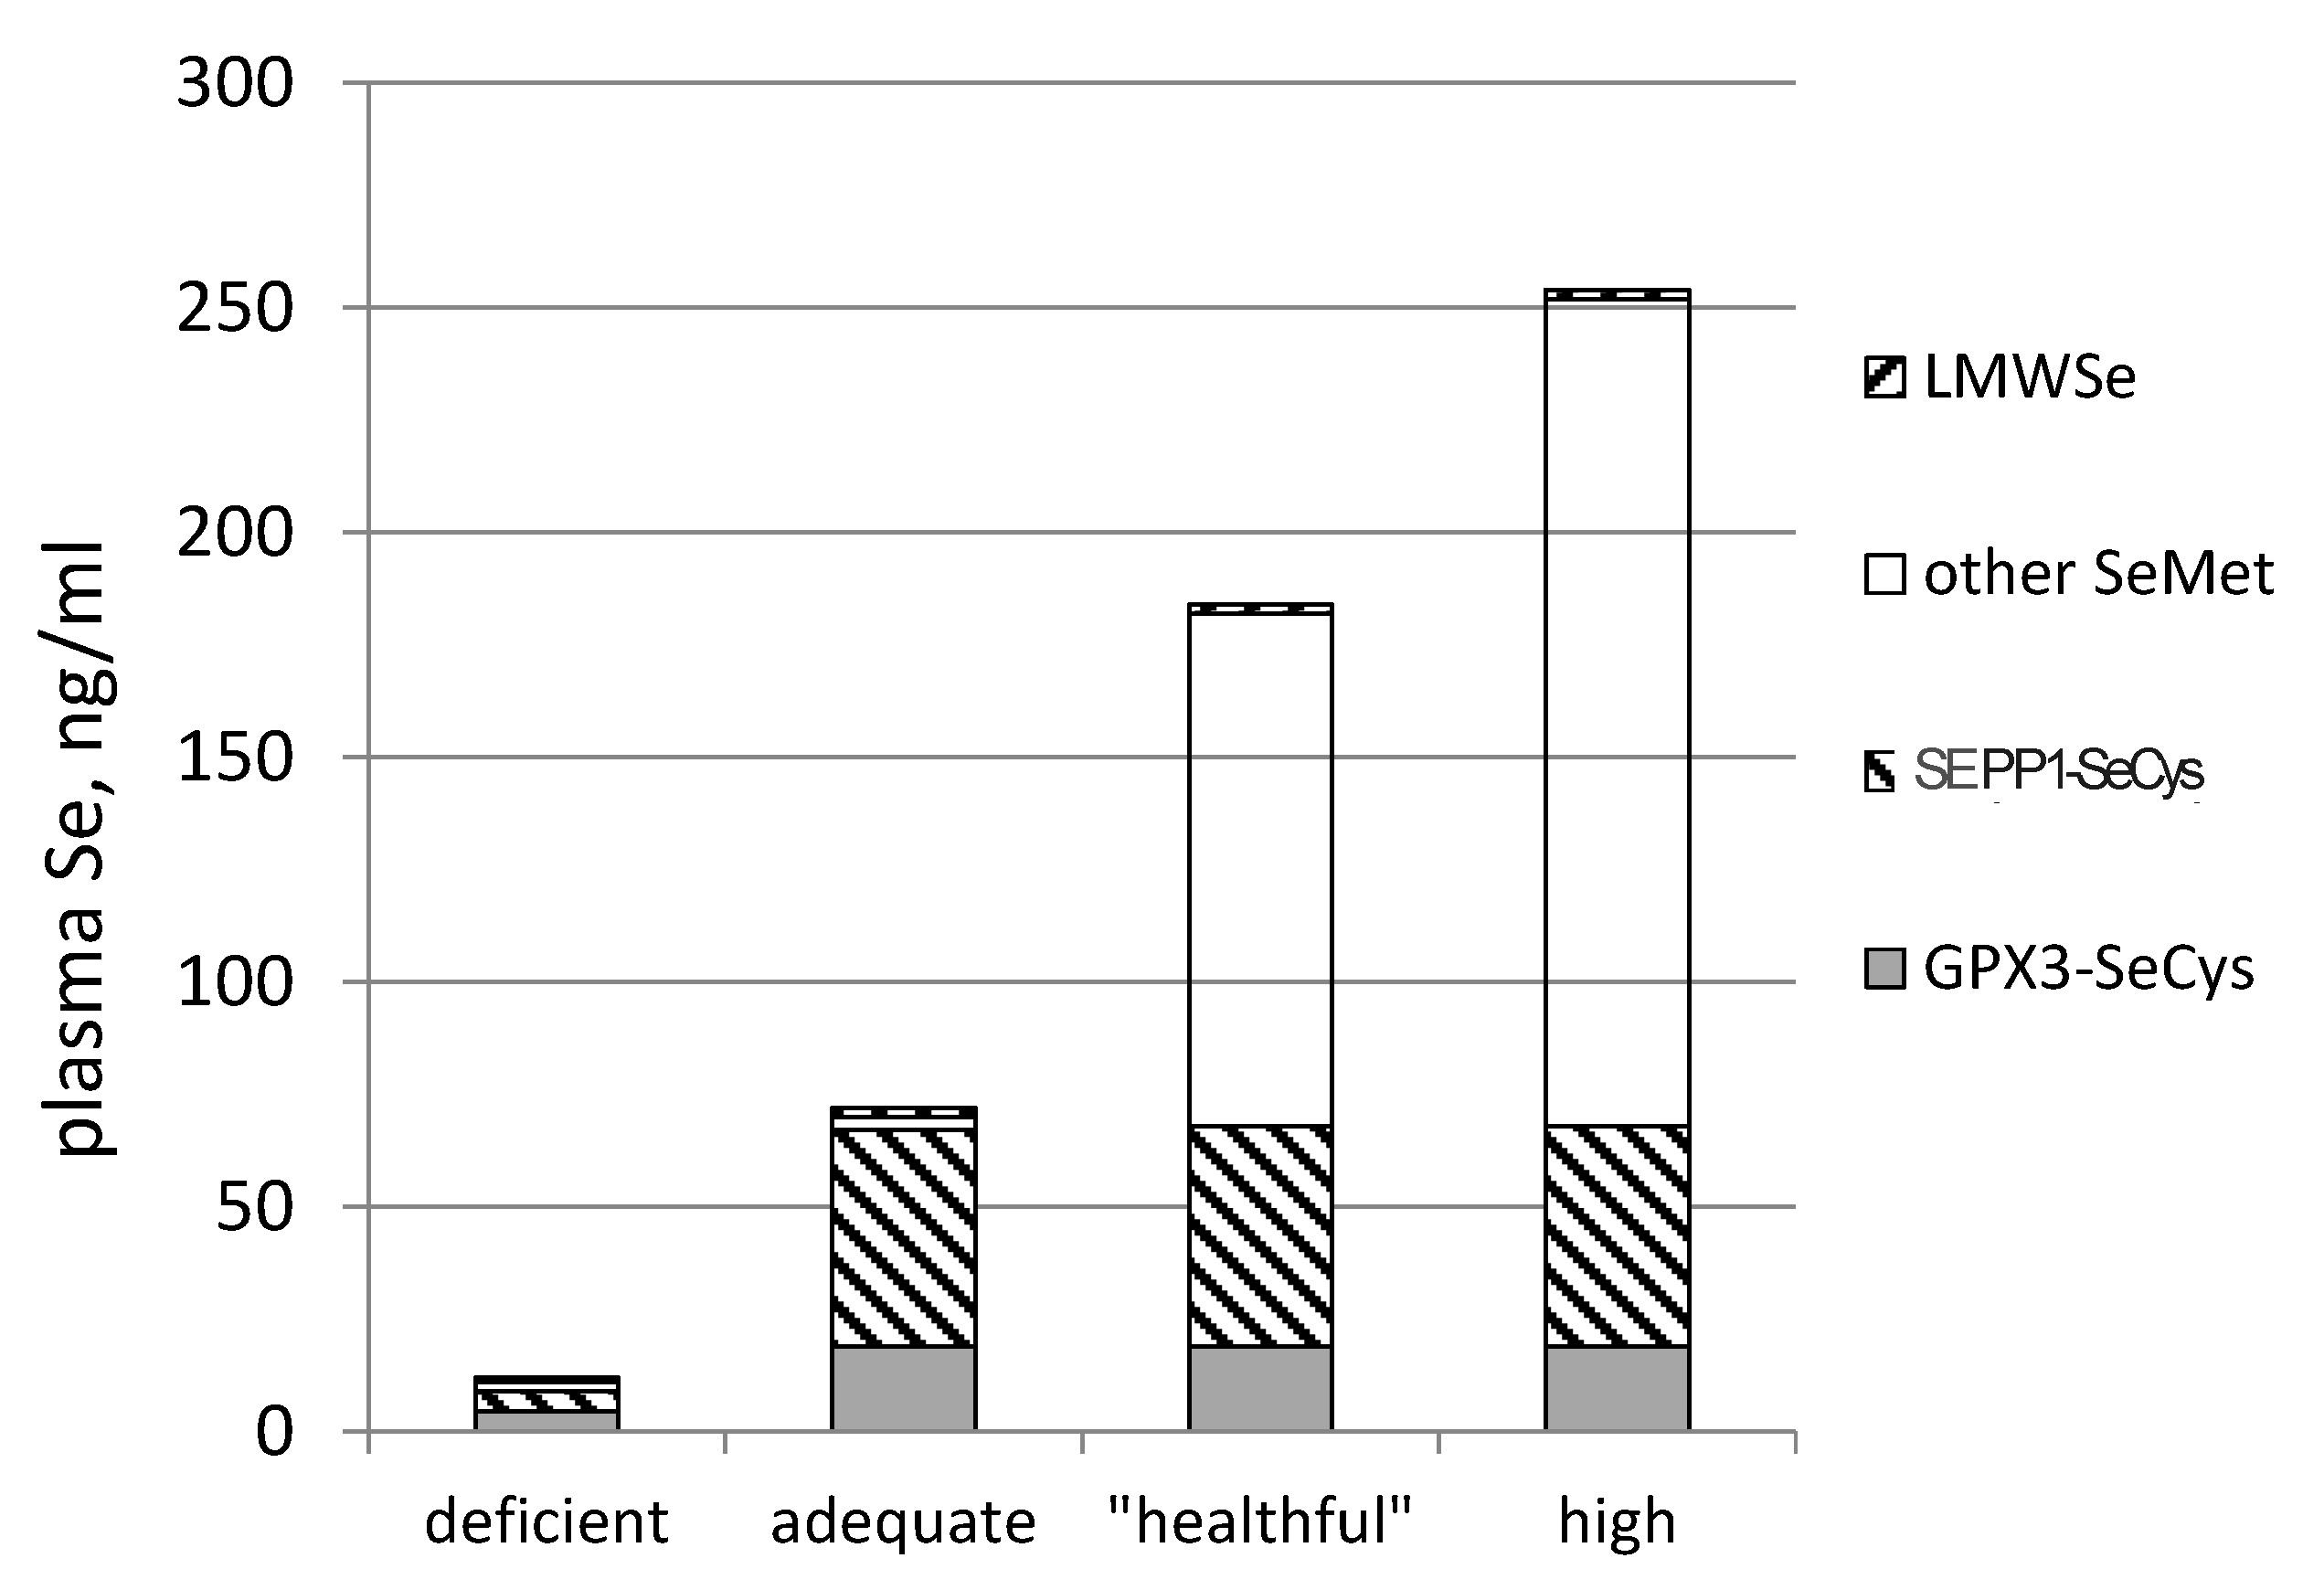
- SEPP1, produced and excreted by the liver, functioning as the primary transporter of Se to peripheral tissues, and comprising 40%–60% of total plasma Se [46].
3.5. Biomarkers Relevant to Antitumorigenesis
3.6. Biomarkers Relevant to Adverse Effects
3.6.1. Selenosis
3.6.2. Type 2 Diabetes Risk
4. Summary
- Se-biomarkers (e.g., GPX3, GPX1 and SEPP1) that provide information about function directly. They are useful under conditions of Se intake falling within the range of regulated selenoprotein expression, which for humans is less than about 55 μg/day (in parts of China, New Zealand and Europe), and for animals is less than about 0.1 mg/kg diet. Their values are in identifying nutritional Se deficiency and tracking responses of deficient individuals to Se-treatment.
- Se-biomarkers that provide information indirectly through inferences based on Se levels of foods, tissues, urine or feces. For example, SeMet in plasma and tissues can indicate amount of Se potentially available for functional use, the likelihood of Se-deficiency or the likelihood adverse effects of Se, but it provides no direct evidence of either of these states. The value of these biomarkers is in providing information about Se status over a wide range of Se intake, particularly from food forms, over which tissue retention of SeMet is unregulated.

| Component of Se Status | Specimen | Se Biomarker | Informative Value | Limitations |
|---|---|---|---|---|
| Se Intake | foods | Se form and amount; amount of food consumed | Approximates total Se consumed. | Use of food nutrient data bases do not address regional variation or digestibility. |
| Tissue Se | Humans: whole blood, plasma/serum; erythrocytes, buccal cells, lymphocytes, nails, hair; Animals: also liver, muscle, other tissues | total Se | Indicates portion of ingested Se absorbed and retained. Most useful in animal studies in which larger body Se pools (liver, muscle) can be sampled. | nail, hair: Samples represent past Se status; collection must be standardized; samples subject to contamination |
| non-specific protein-SeMet | Indicates portion of retained Se that may become available for functional purposes over medium-long term. | Must be imputed from Se and selenoprotein contents of tissues. Can be approximated by albumin-Se (few supporting data). | ||
| Se Function | Humans: whole blood, plasma/serum; erythrocytes, buccal cells, lymphocytes; Animals: also liver, muscle, other tissues | nutritional: selenoproteins | Indicates Se function, portion of retained Se in functional forms. In humans, GPX3, GPX1 and SEPP1 are most useful—can be measured in plasma, and blood/buccal cells. | Assays established for GPX’s, SEPP1, TXNRDs and DIOs. |
| antitumor: Se-metabolites, e.g., CH3SeH | (Would indicate amount of Se antitumorigenically active.) * | CH3SeH has not been detected in tissues. | ||
| adverse effects: Se-metabolites, e.g., (CH3)xSe | (Would indicate Se function and portion of retained Se in functional forms.) * | Methylated Se-metabolites have not been detected in tissues. | ||
| Se Excretion | urine | total Se | Indicates major portion of absorbed Se not retained. | |
| Se-sugar | Major form of excreted Se in humans. | Minor component of excreted Se in animals (rodents). | ||
| (CH3)3Se+ | Major form of excreted Se in animals (rodents). | Minor component of excreted Se in humans. | ||
| feces | total Se | Indicates amount of Se available to the hindgut microbiome. | Does not inform re functional effects on the microbiome. | |
| breath | (CH3)2Se | (Would indicate exposure to potentially intoxicating levels of Se.) * | Diagnostic criteria of selenosis not established. Confounders: low methyl status, folate, vit. B12; methylmercury exposure. |
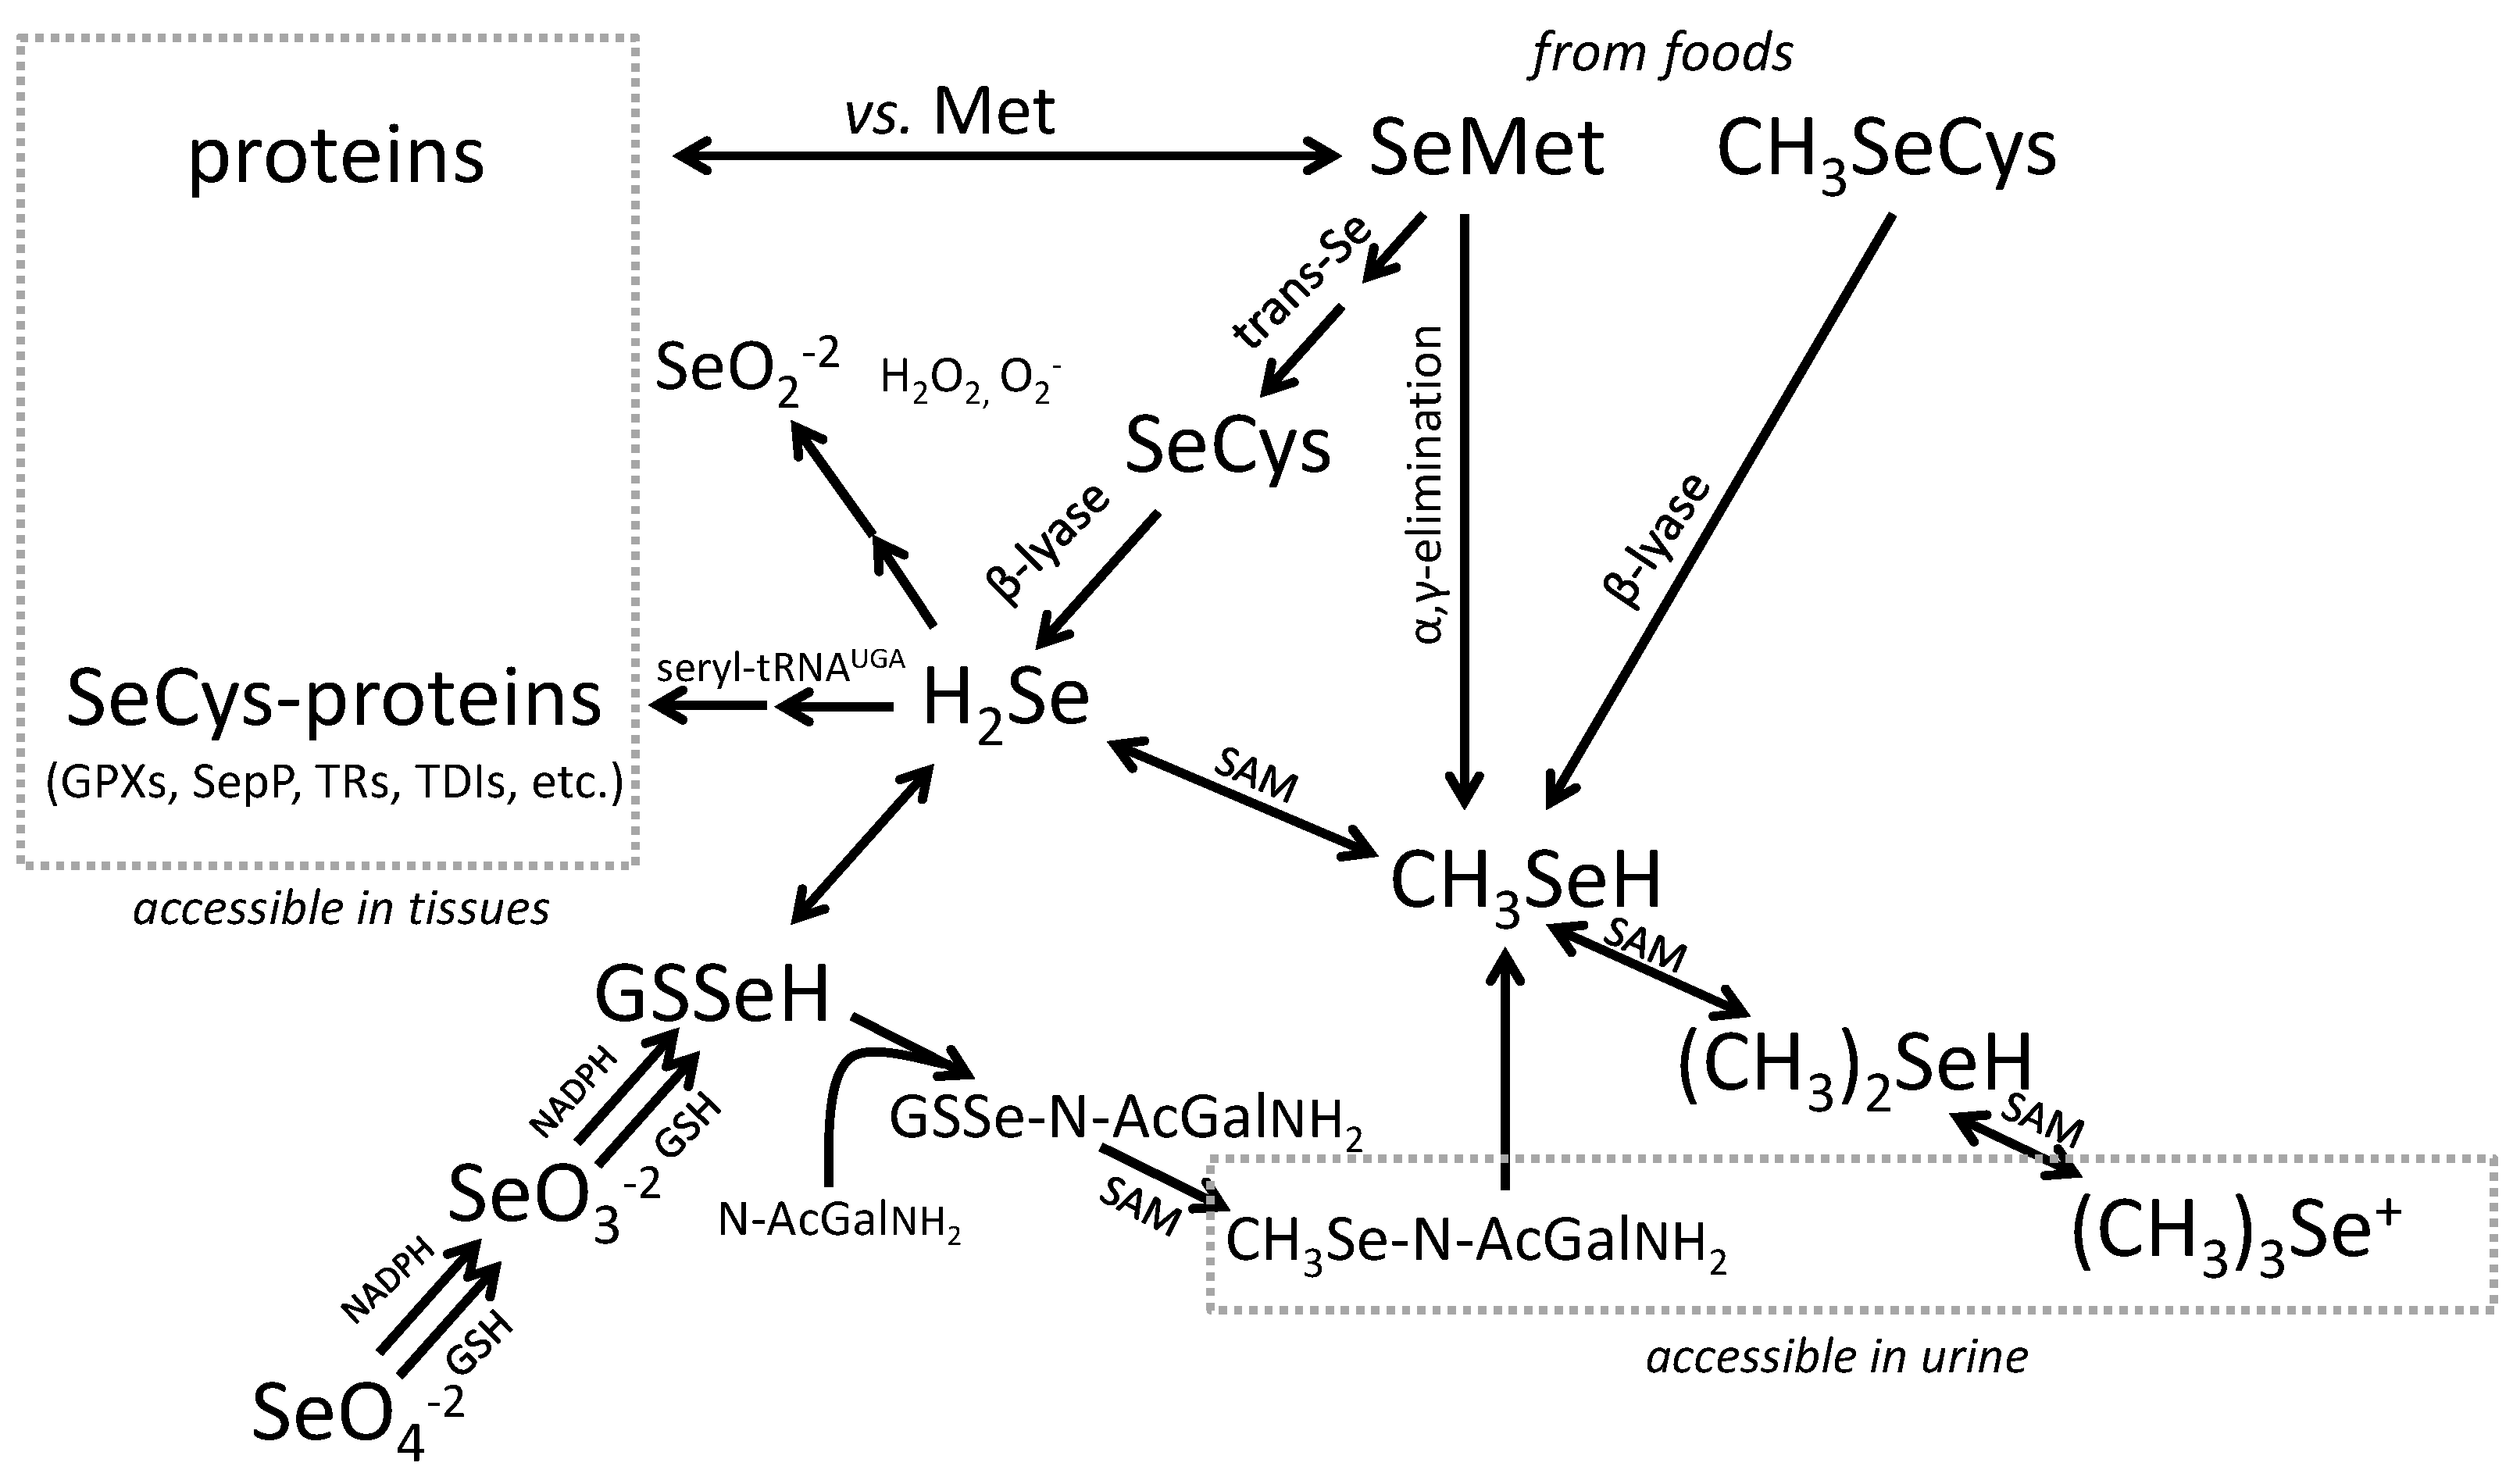
- selenoamino acids—The capability to determine SeCys and SeMet in the circulation would facilitate studies of factors affecting the absorption and utilization of Se in foods.
- methylated Se-metabolites—The capability to determine (CH3)2Se and derivatives in the circulation and/or tissues would facilitate the assessment of their roles as putative mediators of Se anti-turmorigenesis as well as of adverse effects of high-level Se exposure.
- breath (CH3)2Se—Methods are already available to determine (CH3)2Se in breath; however, they have yet to be employed to produce dose-response data over a range of human Se exposures that include selenosis. Such data are needed to facilitate use of this parameter as a biomarker of adverse effects risk. Research is also needed to assess potential confounding effects of factors that can enhance (e.g., methylmercury [128]) or impair (e.g., limited methylation capacity [131]) (CH3)2Se production.
Acknowledgments
Conflicts of Interest
References
- Painter, E.P. The chemistry and toxicity of selenium compounds, with special reference to the selenium problem. Chem. Rev. 1941, 28, 179–187. [Google Scholar]
- Schwarz, K.; Foltz, C.M. Selenium as an integral part of factor 3 against dietary necrotic liver degeneration. J. Am. Chem. Soc. 1957, 79, 3292–3293. [Google Scholar]
- Schwarz, K.; Bieri, J.G.; Briggs, G.M.; Scott, M.L. Prevention of exudative diathesis in chicks by factor 3 and selenium. Proc. Soc. Exp. Biol. Med. 1957, 95, 621–629. [Google Scholar] [CrossRef] [PubMed]
- Patterson, E.L.; Milstrey, R.; Stokstad, E.L.R. Effect of selenium in preventing exudative diathesis in chicks. Proc. Soc. Exp. Biol. Med. 1957, 95, 617–625. [Google Scholar] [CrossRef] [PubMed]
- Ge, K.; Xue, A.; Bai, J.; Wang, S. Keshan Disease—An endemic cardiomyopathy in China. Virchow Arch. 1983, 410, 1–12. [Google Scholar] [CrossRef]
- Keshan Disease Research Group. Observations of the effect of sodium selenite in prevention of Keshan Disease. Chin. Med. J. 1979, 1, 75–82. [Google Scholar]
- Combs, G.F., Jr.; Lu, J. Selenium as a cancer preventative agent, Chapter 22. In Selenium: Its Molecular Biology and Role in Human Health; Hatfield, D.L., Berry, M.J., Gladyshev, V.N., Eds.; Springer: New York, NY, USA, 2006; pp. 249–264. [Google Scholar]
- Yan, L.; DeMars, L.C. Dietary supplementation with methylseleninic acid, but not selenomethionine, reduces spontaneous metastasis of Lewis lung carcinoma in mice. Int. J. Cancer 2012, 131, 1260–1266. [Google Scholar] [CrossRef] [PubMed]
- Yan, L.; Combs, G.F., Jr. Consumption of a high-fat diet abrogates inhibitory effects of methylseleninic acid on spontaneous metastasis of Lewis lung carcinoma in mice. Carcinogenesis 2014, 35, 2308–2313. [Google Scholar] [CrossRef] [PubMed]
- Yu, S.Y.; Zhu, Y.J.; Li, W.G. Protective role of selenium against hepatitis B virus and primary liver cancer in Qidong. Biol. Trace Elem. Res. 1997, 56, 117–124. [Google Scholar] [CrossRef] [PubMed]
- Yu, S.Y.; Zhu, Y.J.; Huang, Q.S.; Wang, G.Z.; Zhang, Q.N. A preliminary report on the intervention trials of primary liver cancer in high-risk populations with nutritional supplementation of selenium in China. Biol. Trace Elem. Res. 1991, 29, 289–294. [Google Scholar] [CrossRef] [PubMed]
- Taylor, P.R.; Li, B.; Dawsey, S.M.; Li, J.Y.; Yang, C.S.; Guo, W.; Blot, W.J. Prevention of esophageal cancer: The nutrition intervention trials in Linxian, China. Linxian Nutrition Intervention Trials Study Group. Cancer Res. 1994, 54, 2029s–2031s. [Google Scholar] [PubMed]
- Blot, W.J.; Li, J.Y.; Taylor, P.R.; Guo, W.; Dawsey, S.M.; Li, B. The Linxian trials: Mortality rates by vitamin-mineral intervention group. Am. J. Clin. Nutr. 1995, 62, 1424S–1426S. [Google Scholar] [PubMed]
- Blot, W.J.; Li, J.Y.; Taylor, P.R.; Guo, W.; Dawsey, A.; Wang, G.Q.; Yang, C.S.; Zheng, S.F.; Gail, M.; Li, G.Y.; et al. Nutrition intervention trials in Linxian, China: Supplementation with specific vitamin/mineral combinations, cancer incidence, and disease-specific mortality in the general population. J. Nat. Cancer Inst. 1993, 85, 1483–1492. [Google Scholar] [CrossRef] [PubMed]
- Clark, L.C.; Combs, G.F., Jr.; Turnbull, B.W.; Slate, E.H.; Chalker, D.K.; Chow, J.; Davis, L.S.; Glover, R.A.; Graham, G.F. Effects of selenium supplementation for cancer prevention in patients with carcinoma of the skin: A randomized controlled trial. JAMA 1996, 276, 1957–1963. [Google Scholar] [CrossRef] [PubMed]
- Lippman, S.M.; Klein, E.A.; Goodman, P.J.; Lucia, M.S.; Thompson, I.M.; Ford, L.G.; Parnes, H.L.; Minasian, L.M.; Gaziano, J.M.; Hartline, J.A.; et al. Effect of selenium and vitamin E on risk of prostate cancer and other cancers: The Selenium and Vitamin E Cancer Prevention Trial (SELECT). JAMA 2009, 301, 39–51. [Google Scholar] [CrossRef] [PubMed]
- Combs, G.F., Jr.; Clark, L.C.; Turnbull, B.W. An analysis of cancer prevention by selenium. BioFactors 2001, 14, 153–159. [Google Scholar] [CrossRef] [PubMed]
- Duffield-Lillico, A.J.; Dalkin, B.L.; Reid, M.E.; Turnbull, B.W.; Slate, E.H.; Marshall, J.R.; Clark, L.C. Selenium supplementation, baseline plasma selenium status and incidence of prostate cancer: An analysis of the complete treatment period of the Nutritional Prevention of Cancer Trial. Br. J. Urol. 2003, 91, 608–612. [Google Scholar] [CrossRef]
- Combs, G.F., Jr.; Combs, S. The Role of Selenium in Nutrition; Academic Press: New York, NY, USA, 1986; p. 525. [Google Scholar]
- Ip, C.; Ganther, H.E. Activity of methylated forms of selenium in cancer prevention. Cancer Res. 1990, 50, 1206–1211. [Google Scholar] [PubMed]
- Ip, C. Lessons from basic research in selenium and cancer prevention. J. Nutr. 1998, 128, 1845–1854. [Google Scholar] [PubMed]
- Combs, G.F., Jr.; Combs, S. The Role of Selenium in Nutrition; Academic Press: New York, NY, USA, 1986; pp. 465–486. [Google Scholar]
- Combs, G.F., Jr. Selenium in global food systems. Br. J. Nutr. 2001, 85, 517–547. [Google Scholar] [CrossRef] [PubMed]
- Hurst, R.; Collings, R.; Harvey, L.J.; King, M.; Hooper, L.; Bouwman, J.; Gurinovic, M.; Fairweather-Taite, S.J. EURRECA—Estimatign selenium requirements for deriving dietary reference values. Crit. Rev. Food Sci. Nutr. 2013, 53, 1077–1096. [Google Scholar] [CrossRef] [PubMed]
- Schubert, A.; Holden, J.; Wolf, W.R. Selenium content of a core group of foods based on a critical evaluation of published analytical data. J. Am. Diet. Assoc. 1987, 87, 285–299. [Google Scholar] [PubMed]
- Wolfram, A.S.; Arduser, F.; Sharrer, E. In vivo intestinal absorption of selenate and selenite by rats. J. Nutr. 1985, 115, 454–459. [Google Scholar] [PubMed]
- Turner, J.C.; Osborn, P.J.; McVeagh, S.M. Studies on selenate and selenite absorption by sheep ileum using an everted sac method and an isolate, vascularly perfused system. Comp. Biochem. Physiol. A Comp. Physiol. 1990, 95, 297–301. [Google Scholar] [CrossRef] [PubMed]
- Van Dael, P.; Davidsson, L.; Ziegler, E.E.; Laurent, B.F.; Barclay, D. Comparison of selenite and selenate apparent absorption and retention in infants using stable isotope methodology. Pediat. Res. 2002, 1, 71–75. [Google Scholar] [CrossRef]
- Wastney, M.E.; Combs, G.F., Jr.; Canfield, W.K.; Taylor, P.R.; Patterson, K.Y.; Hill, A.D.; Moler, J.E.; Patterson, B.H. A human model of selenium that integrates metabolism from selenite and selenomethionine. J. Nutr. 2011, 141, 708–717. [Google Scholar] [CrossRef] [PubMed]
- Thomson, C.D.; Robinson, M.F. Urinary and fecal excretions and absorption of a large supplement of selenium: Superiority of selenate over selenite. Am J. Clin. Nutr. 1986, 445, 659–663. [Google Scholar]
- Thavarajah, D.; Vandenberg, A.; George, G.N.; Pickering, I.J. Chemical form of selenium in naturally selenium-rich lentils (Lens culinaris L.) from Saskatchewan. J. Agr. Food Chem. 2007, 55, 7337–7341. [Google Scholar] [CrossRef]
- Xia, Y.; Hill, K.E.; Byrne, D.W.; Xu, J.; Burk, R.F. Effectiveness of selenium supplements in a low-selenium area of China. Am. J. Clin. Nutr. 2005, 81, 829–834. [Google Scholar] [PubMed]
- Duffield, A.J.; Thomson, C.D.; Hill, C.E.; Williams, S. An estimation of selenium requirements for New Zealanders. Am. J. Clin. Nutr. 1999, 70, 896–903. [Google Scholar] [PubMed]
- Broome, C.S.; McArdle, F.; Kyle, J.A.; Andrews, F.; Lowe, N.M.; Hart, C.A.; Arthur, J.R.; Jackson, M.J. An increase in selenium intake improves immune function and poliovirus handling in adults with marginal selenium status. Am. J. Clin. Nutr. 2004, 80, 154–162. [Google Scholar] [PubMed]
- Burk, R.F.; Norsworthy, B.K.; Hill, K.E.; Motley, A.K.; Byrne, D.W. Effects of chemical form of selenium on plasma biomarkers in a high-dose human supplementation trial. Cancer Epidemiol. Biomark. Prev. 2006, 15, 804–810. [Google Scholar] [CrossRef]
- Ravn-Haren, G.; Krath, B.N.; Overvad, K.; Cold, S.; Moesgaard, S.; Larsen, E.H.; Dragsted, L.O. Effect of long-term selenium yeast intervention on activity and gene expression of antioxidant and xenobiotic metabolizing enzymes in healthy volunteers from the Danish Prevention of Cancer by Intervention by Selenium (PRECISE) pilot study. Br. J. Nutr. 2008, 99, 1190–1198. [Google Scholar] [PubMed]
- Wu, J.; Salisbury, C.; Graham, R.; Lyons, G.; Fenech, M. Increased consumption of wheat biofortified with selenium does not modify biomarkers of cancer risk, oxidative stress, or immune function in healthy Australian males. Environ. Molec. Mutagen. 2009, 50, 489–501. [Google Scholar] [CrossRef]
- Hurst, R.; Armah, C.N.; Daintry, J.R.; Hart, D.J.; Teucher, B.; Goldson, A.J.; Broadley, M.R.; Motley, A.K.; Fairweather-Tait, S.J. Establishing optimal selenium status: Results of a randomized, double-blind, placebo-controlled trial. Am. J. Clin. Nutr. 2010, 91, 923–931. [Google Scholar] [CrossRef] [PubMed]
- Combs, G.F., Jr.; Jackson, M.; Watts, J.C.; Johnson, L.K.; Zeng, H.; Idso, J.; Schomburg, L.; Hoeg, A.; Chiang, E.; Waters, D.J.; et al. Differential responses to selenomethionine supplementation by sex and genotype in healthy adults. Br. J. Nutr. 2011, 107, 1514–1525. [Google Scholar] [CrossRef] [PubMed]
- Thomson, C.D.; Robinson, M.F.; Campbell, D.R.; Rea, H.M. Effect of prolonged supplementation with daily supplements of selenomethionine and sodium selenite on glutathione peroxidase activity in blood of New Zealand residents. Am. J. Clin. Nutr. 1982, 36, 24–31. [Google Scholar] [PubMed]
- Levander, O.A.; Alfthan, G.; Arvilommi, H.; Gref, C.G.; Huttunen, J.K.; Kataja, M.; Koivistoinen, P.; Pikkarainen, J. Bioavailability of selenium to Finnish men as assessed by platelet glutathione peroxidase activity and other blood parameters. Am. J. Clin. Nutr. 1983, 37, 887–897. [Google Scholar] [PubMed]
- Thomson, C.D.; Robinson, M.F.; Bulter, J.A.; Whanger, P.D. Loing-term supplementation with selenate and selenomethionine: Selenium and glutathione peroxidase (EC 1.11.1.9) in blood components of New Zealand women. Br. J. Nutr. 1993, 69, 577–588. [Google Scholar] [CrossRef] [PubMed]
- Robinson, M.F.; Thomson, C.D.; Jenkinson, C.P.; Luzhen, G.; Whanger, P.D. Long-term supplementation with selenate and selenomethionine: Urinary excretion by New Zealand women. Br. J. Nutr. 1997, 77, 551–563. [Google Scholar] [CrossRef] [PubMed]
- Alfthan, G.; Xu, G.L.; Tan, W.H.; Aro, A.; Wu, J.; Yang, Y.X.; Liang, W.S.; Xue, W.L.; Kong, L.H. Selenium supplementation of children in a selenium-deficient area in China: Blood selenium levels and glutathione peroxidase activities. Biol. Trace Elem. Res. 2000, 73, 113–125. [Google Scholar] [CrossRef] [PubMed]
- Burk, R.F.; Hill, K.E. Selenoprotein P—Expression, functions and roles in mammals. Biochem. Biophys. Acta 2009, 1790, 1441–1447. [Google Scholar] [CrossRef] [PubMed]
- Pedrosa, L.F.C.; Motley, A.K.; Stevenson, T.D.; Hill, K.E.; Burk, R.F. Fecal selenium excretion is regulated by dietary selenium intake 1. Biol. Trace Elem. Res. 2012, 149, 377–381. [Google Scholar] [CrossRef] [PubMed]
- Gammelgaard, B.; Madsen, K.B.; Bjerrum, J.; Bendahl, L.; Jøns, O.; Olsen, J.; Sidenius, U. Separation, purification and identification of the major selenium metabolite from human urine by multi-dimensional HPLC-ICP-MS and APCI-MS. J. Anal. Atom. Spectrom. 2003, 1, 65–70. [Google Scholar] [CrossRef]
- Ogra, Y.; Ishiwata, K.; Takayama, H.; Aimi, N.; Suzuki, K.T. Identification of a novel selenium metabolite, Se-methyl-N-acetylselenohexosamine, in rat urine by high-performance liquid chromatography—Inductively coupled plasma mass spectrometry and—Electrospray ionization tandem mass spectrometry. J. Chromatogr. B Analyt. Technol. Biomed. Life Sci. 2002, 767, 301–312. [Google Scholar] [CrossRef] [PubMed]
- Kobayashi, Y.; Ogra, Y.; Ishiwata, K.; Takayama, H.; Aimi, N.; Suzuki, T. Selenosugars are key and urinary metabolites for selenium excretion with the required to low-toxic range. Proc. Nat. Acad. Sci. USA 2002, 99, 15932–15936. [Google Scholar] [CrossRef] [PubMed]
- Combs, G.F., Jr.; Watts, J.C.; Jackson, M.; Johnson, L.K.; Zeng, H.; Scheet, A.J.; Uthus, E.J.; Schomburg, L.; Hoeg, A.; Hoefig, C.A.; et al. Determinants of selenium status in healthy adults. Nutr. J. 2011, 10, 75–82. [Google Scholar] [CrossRef] [PubMed]
- Jackson, M.I.; Lunoe, K.; Gabel-Jensen, C.; Gammelgaard, B.; Combs, G.F., Jr. Metabolism of selenite to selenosugar and trimethylselenonium in vivo: Tissue dependency and requirement for S-adenosylmethioine-dependent methylation. J. Nutr. Biochem. 2013, 24, 2023–2030. [Google Scholar] [CrossRef]
- Stoeder, M.; Renko, K.; Hög, A.; Schomburg, L. Selenium controls the sex-specific immune response and selenoprotein expression during the acute-phase response in mice. Biochem. J. 2010, 429, 43–51. [Google Scholar] [CrossRef] [PubMed]
- Combs, G.F., Jr.; Hyun, T.; Gray, W.P. Nonprotein bound selenium in plasma: Relevance in assessing selenium status. In Metal Ions in Biology and Medicine; Centeno, J., Collery, P., Vernet, G., Finkelman, R., Gibb, H., Eteinne, J., Eds.; John Libbey Eurotext: Paris, France, 2000; Volume 6, pp. 237–240. [Google Scholar]
- Yang, G.; Zhou, R.; Yin, S.; Gu, L.; Yan, B.; Liu, Y.; Li, X. Studies of safe maximal daily dietary selenium intake in a seleniferous area in China. I. Selenium intake and tissue selenium levels of the inhabitants. J. Trace Elem. Electrolytes Health Dis. 1989, 3, 77–87. [Google Scholar] [PubMed]
- Longnecker, M.P.; Stram, D.O.; Taylor, P.R.; Levander, O.A.; Howe, M.; Veillon, C.; McAdam, P.A.; Patterson, K.Y.; Holden, J.M.; Morris, J.S.; et al. Use of selenium concentration in whole blood, serum, toenails, or urine as a surrogate of selenium intake. Epidemiology 1996, 7, 384–390. [Google Scholar] [CrossRef] [PubMed]
- Combs, G.F., Jr.; Combs, S.B. The Role of Selenium in Nutrition; Academic Press: Boca Raton, Florida, 1986; pp. 145–148, 196–199. [Google Scholar]
- Clausen, J.; Nielsen, S.A. Comparison of whole blood selenium values and erythrocyte glutathione peroxidase activities of normal individuals on supplementation with selenite, selenite, l-selenomethionine, and high selenium yeast. Biol. Trace Elem. Res. 1998, 15, 125–138. [Google Scholar] [CrossRef]
- Czuban, M.; Blasig, S.; Schomburg, L. Analysis of selenium status from dried blood spots by total-reflection X-ray fluorescence analysis. Perspect. Sci. 2014. Available online: http://dx.doi.org/10.1016/j.pisc.2014.11.021 (accessed on 15 March 2015).
- Carlson, B.A.; Xu, X.M.; Shrimali, R.; Sengupta, A.; Yoo, M.H.; Irons, R.; Zhong, N.; Hatfield, D.L.; Lee, B.J.; Lobanov, A.V.; et al. Mammallian and othe eurkaryotic selenocysteine tRNAs, Chapter 3. In Selenium: Its Molecular Biology and Role in Human Health; Hatfield, D.L., Berry, M.J., Gladyshev, V.N., Eds.; Springer Science+Business Media: New York, NY, USA, 2006; pp. 29–38. [Google Scholar]
- Yang, J.G.; Morrison-Plummer, J.; Burk, R.F. Purification and quantitation of a rat plasma selenoprotein distinct from glutathione peroxidase using monoclonal antibodies. J. Biol. Chem. 1987, 262, 13372–13375. [Google Scholar] [PubMed]
- Hollenbach, B.; Morgenthaler, N.G.; Struck, J.; Alonso, C.; Bergmann, A.; Köhrle, J.; Schomburg, L. New assay for the measurement of selenoprotein P as a sepsis biomarker from serum. J. Trace Elem. Med. Biol. 2008, 22, 24–32. [Google Scholar] [CrossRef] [PubMed]
- Tanaka, M.; Saito, Y.; Misu, H.; Kato, S.; Kita, Y.; Takeshita, Y.; Kanamori, T.; Nagano, T.; Nakagen, M.; Urabe, T.; et al. Development of a Sol particle homogeneous immunoassay for measuring full-length selenoprotein P in human serum. J. Clin. Lab. Anal. 2014. [Google Scholar] [CrossRef]
- Lawrence, R.A.; Burk, R.F. Glutathione peroxidase activity in selenium-deficient rat liver. Biochem. Biophys. Res. Commun. 1976, 71, 952–958. [Google Scholar] [CrossRef] [PubMed]
- Broderick, D.J.; Deagen, J.T.; Whanger, P.D. Properties of glutathione peroxidase isolated from human plasma. J. Inorg. Biochem. 1987, 30, 299–308. [Google Scholar] [CrossRef] [PubMed]
- Reeves, P.G.; Gregoire, B.R.; Garvin, D.F.; Hareland, G.A.; Lindlauf, J.E.; Johnson, L.K.; Finley, J.F. Determination of selenium bioavailability from wheat mill fractions in rats by using the slope-ratio assay and a modified Torula yeast-based diet. J. Agri. Food Chem. 2007, 55, 516–522. [Google Scholar] [CrossRef]
- Lloyd, B.; Lloyd, R.S.; Clayton, B.E. Effect of smoking, alcohol and other factors on the selenium status of a healthy population. J. Epidemiol. Commun. Health 1983, 37, 213–217. [Google Scholar] [CrossRef]
- Mathias, P.M.; Jackson, A.A. Selenium deficiency in kwashiorkor. Lancet 1982, 1, 1312–1313. [Google Scholar] [CrossRef] [PubMed]
- Maehira, F.; Luyo, G.A.; Miyagi, I.; Oshiro, M.; Yamane, N.; Kuba, M.; Nakazato, Y. Alterations of serum selenium concentrations in the acute phase of pathological conditions. Clin. Chim. Acta 2002, 316, 137–146. [Google Scholar] [CrossRef] [PubMed]
- Huang, Z.; Rose, A.H.; Hoffmann, P.R. The role of selenium in inflammation and immunity: From molecular mechanisms to therapeutic opportunities. Antioxid. Redox Signal. 2012, 16, 705–743. [Google Scholar] [CrossRef] [PubMed]
- Hargreaves, M.K.; Liu, J.; Buchowski, M.S.; Patel, K.A.; Larason, C.O.; Schlundt, D.G.; Kenerson, D.M.; Hill, K.E.; Burk, R.F.; Blot, W.J. Plasma selenium biomarkers in low income black and white Americans from the southeastern United States. PLoS ONE 2014, 9, 1–9. [Google Scholar]
- U.S. Department of Agriculture; Agricultural Research Service. USDA National Nutrient Database for Standard Reference, Release 27. Nutrient Data Laboratory Home Page. 2014. Available online: http:www.ars.usda.gov/ba/bhnrc/ndl (accessed on 15 March 2015). [Google Scholar]
- O’Callaghan, N.; Bull, C.; Palmer, L.; Lyons, G.; Graham, R.; Fenech, M. Buccal cells: A non-invasive measurement of selenium, zinc and magnesium status, and telomere length. Asia Pac. J. Clin. Nutr. 2008, 17, S19. [Google Scholar]
- Kryukov, G.V.; Castellano, S.; Novoselov, S.V.; Lobanov, A.V.; Zehtab, O.; Guigo, R.; Gladyshev, V.N. Characterization of mammalian selenoproteins. Science 2013, 300, 1439–1443. [Google Scholar] [CrossRef]
- Hawkes, W.C.; Alkan, Z. Regulation of redox signaling by selenoproteins. Biol. Trace Elem. Res. 2010, 134, 235–251. [Google Scholar] [CrossRef] [PubMed]
- Flohé, L.; Brigelius-Flohé, R. Selenoproteins of the glutathione system, Chapter 15. In Selenium: Its Molecular Biology and Role in Human Health; Hatfield, D.L., Berry, M.J., Gladyshev, V.N., Eds.; Springer: New York, NY, USA, 2006; pp. 161–172. [Google Scholar]
- Tamura, T.; Stadtman, T.C. A new selenoprotein from human lung adenocarcinoma cells: Purification, properties and thioredoxin reductase activity. Proc. Nat. Acad. Sci. USA 1996, 93, 1006–1011. [Google Scholar] [CrossRef] [PubMed]
- Köhrle, J. Selenium and the thyroid. Curr. Opin. Endocrinol. Diabetes Obes. 2013, 20, 441–448. [Google Scholar] [CrossRef] [PubMed]
- Sunde, R.A. Molecular biology of selenoproteins. Ann. Rev. Nutr. 1990, 10, 451–474. [Google Scholar] [CrossRef]
- Sunde, R.A.; Raines, A.M. Selenium regulation of the selenoprotein and nonselenoprotein transcriptomes in rodents. Adv Nutr. 2011, 2, 138–150. [Google Scholar] [CrossRef] [PubMed]
- Yang, J.G.; Hill, K.E.; Burk, R.F. Dietary selenium intake controls rat plasma selenoprotein P concentration. J. Nutr. 1989, 119, 1010–1012. [Google Scholar] [PubMed]
- Hawkes, W.C.; Wang, T.T.Y.; Alkan, Z.; Richter, B.D.; Dawson, K. Selenoprotein W modulates control of cell cycle entry. Biol. Trace Elem. Res. 2009, 131, 229–244. [Google Scholar] [CrossRef] [PubMed]
- Rotruck, J.T.; Pope, A.L.; Ganther, H.E.; Swanson, A.B.; Hafeman, D.G.; Hoekstra, W.G. Selenium: Biochemical role as a component of glutathione peroxidase. Science 1973, 179, 588–590. [Google Scholar] [CrossRef] [PubMed]
- Steinbrenner, H.; Alili, L.; Stuhlmann, D.; Sies, H.; Brenneisen, P. Post-translational processing of selenoprotein P: Implications of glycosylation for its utilisation by target cells. Biol. Chem. 2007, 388, 1043–1051. [Google Scholar] [CrossRef] [PubMed]
- Méplan, C.; Nicol, F.; Burtle, B.; Crosley, L.; Arthur, J.; Mathers, J.; Hesketh, J. Relative abundance of selenoprotein P isoforms in human plasma depends on genotype, Se intake, and cancer status. Antioxid. Redox Signal. 2009, 11, 2631–2640. [Google Scholar] [CrossRef] [PubMed]
- Chittum, H.S.; Himeno, S.; Hill., K.E.; Burk, R.F. Multiple forms of selenoprotein P in rat plasma. Arch. Biochem. Biophys. 1996, 325, 124–128. [Google Scholar] [CrossRef]
- Hill, K.E.; Lloyd, R.S.; Burk, R.F. Conserved nucleotide sequences in the open reading frame and 3’ untranslated region of selenoprotein P mRNA. Proc. Natl. Acad. Sci. USA 1993, 90, 537–541. [Google Scholar] [CrossRef]
- Saito, Y.; Sato, N.; Hirashima, M.; Takebe, G.; Nagasawa, S.; Takahshi, K. Domain structure of bifunctional seleoprotein P. Biochem. J. 2014, 381, 841–846. [Google Scholar] [CrossRef]
- Yang, G.Q.; Zhu, L.Z.; Liu, S.J.; Gu, L.Z.; Qian, P.C.; Huang, J.H.; Lu, M.D. Human selenium requirements in China. In Selenium in Biology and Medicine; Combs, G.F., Jr., Levander, O.A., Spallholz, J.E., Oldfield, J.E., Eds.; AVI Publishing Co.: Eastport, CO, USA, 1987; pp. 589–607. [Google Scholar]
- Xia, Y.; Hill, K.E.; Burk, R.F. Biochemical studies of a selenium-deficient population in China: Measurement of selenium, glutathione peroxidase and other oxidant defense indices in blood. J. Nutr. 1989, 119, 1318–1326. [Google Scholar] [PubMed]
- Xia, Y.; Hill, K.E.; Li, P.; Xu, J.; Zhou, D.; Motley, A.K.; Wang, L.; Byrne, D.W.; Burk, R.F. Optimization of selenoprotein P and other plasma selenium biomarkers for the assessment of the selenium nutritional requirement: A placebo-controlled, double-blind study of selenomethionine supplementation in selenium-deficient Chinese subjects. Am. J. Clin. Nutr. 2010, 92, 525–531. [Google Scholar] [CrossRef]
- Hill, K.E.; Xia, Y.; Akesson, B.; Boeglin, M.E.; Burk, R. Selenoprotein P concentration in plasma as an index of selenium status in selenium-deficient and selenium-supplemented Chinese subjects. J. Nutr. 1996, 126, 138–145. [Google Scholar] [PubMed]
- Nève, J. Human selenium supplementation as assessed by changes in plasma selenium concentration and glutathione peroxidase activity. J. Trace Elem. Med. Biol. 1995, 9, 65–73. [Google Scholar] [CrossRef] [PubMed]
- Meplan, C.; Crosley, L.K.; Nicol, F.; Beckett, G.J.; Howie, A.F.; Kill, K.E.; Horgan, G.; Mathers, J.C.; Arthur, J.R.; Hesketh, J.E. Genetic polymorphisms in the human selenoprotein P gene determine the response of selenoprotein biomarkers to selenium supplementation in a gende3r-specific manner (the SELGEN study). FASEB J. 2007, 21, 3063–3074. [Google Scholar] [CrossRef] [PubMed]
- Dreher, I.; Jakobs, T.C.; Korhle, J. Cloning and characterization of the human selenoprotein P promoter. Response of selenoprotein P expression to cytokines in liver cells. J. Biol. Chem. 1997, 272, 29364–29371. [Google Scholar] [CrossRef] [PubMed]
- Speckmann, B.; Walter, P.L.; Alili, L.; Reinehr, R.; Sies, H.; Klotz, L.O.; Steinbrenner, H. Selenoprotein P expression is controlled through interaction of the coactivator PGC-1alpha with FoxO1a and hepatocyte nuclear factor 4alpha transcription factors. Hepatology 2008, 48, 1998–2006. [Google Scholar] [CrossRef] [PubMed]
- Speckmann, B.; Sies, H.; Steinbrenner, H. Attenuation of hepatic expression and secretion of selenoprotein P by metformin. Biochem. Biophys. Res. Commun. 2009, 387, 158–163. [Google Scholar] [CrossRef] [PubMed]
- Vanderpas, J.; Contempré, B.; Duale, N.L.; Goossens, W.; Bebe, N.; Thorpe, R.; Ntambue, K.; Dumont, J.; Thilly, C.H.; Diplock, A.T. Iodine and selenium deficiency associated with cretinism in Northern Zaire. Am. J. Clin. Nutr. 1990, 52, 1087–1093. [Google Scholar] [PubMed]
- Vanderpas, J.; Contempre, B.; Duale, M.; Deckx, H.; Beebe, N.; Longombe, A.O.; Thilly, C.H.; Diplock, A.T.; Dumont, J.E. Selenium deficiency mitigates hypothyroxinemia in iodine-deficient subjects. Am. J. Clin. Nutr. 1993, 57, 271S–275S. [Google Scholar] [PubMed]
- Ratnasinghe, D.; Tangrea, J.A.; Andersen, M.R.; Barrett, M.J.; Virtamo, J.; Taylor, P.R.; Albanes, D. Glutathione peroxidase codon 198 polymorphism variant increases lung cancer risk. Cancer Res. 2000, 60, 6381–6383. [Google Scholar]
- Hu, Y.J.; Diamond, A.M. Role of glutathione peroxidase 1 in breast cancer: Loss of heterozygosity and allelic differences in the response to selenium. Cancer Res. 2003, 63, 3347–3351. [Google Scholar] [PubMed]
- Kasaikina, M.V.; Kravtsova, M.A.; Lee, B.C.; Seravalli, J.; Peterson, D.A.; Walter, J.; Legge, R.; Benson, A.K.; Hatfield, D.L.; Gladyshev, V.N. Dietary selenium affects host proteome expression by influencing the gut microbiota. FASEB J. 2011, 25, 2492–2499. [Google Scholar] [CrossRef] [PubMed]
- Krittapol, W.; McDowell, A.; Thomson, C.D.; Mikov, M.; Fawcett, J.P. Biotranformation of l-selenomethionine and selenite in rat gut contents. Biol. Trace Elem. Res. 2011, 139, 188–196. [Google Scholar] [CrossRef] [PubMed]
- Taussig, D.; Combs, G.F., Jr.; USDA-ARS, ND, USA. Unpublished work. 2015.
- Kryukov, G.V.; Gladyshev, V.N. The prokaryotic selenoproteome. EMBO Rep. 2004, 5, 538–543. [Google Scholar] [CrossRef] [PubMed]
- Foster, C.B. Selenoproteins and the metabolic features of the archaeal ancestor of eukaryotes. Mol. Biol. Evol. 2005, 22, 383–386. [Google Scholar] [CrossRef] [PubMed]
- Zhang, Y.; Romero, H.; Salinas, G.; Gladyshev, V.N. Dynamic evolution of selenocysteine utilization in bacteria: A balance between selenoprotein loss and evolution of selenocysteine from redox active cysteine residues. Genome Biol. 2006, 7, R94. [Google Scholar] [CrossRef] [PubMed]
- Stock, T.; Selzer, M.; Rother, M. In vivo requirement of selenophosphate for selenoprotein synthesis in archaea. Mol. Microbiol. 2010, 75, 149–160. [Google Scholar] [CrossRef] [PubMed]
- Stock, T.; Rother, M. Selenoproteins in Archaea and Gram-positive bacteria. Biochim. Biophys. Acta 2009, 1790, 1520–1532. [Google Scholar] [CrossRef] [PubMed]
- Kim, J.; Combs, G.F., Jr. Effects of selenium on colonic fermentation in the rat. Biol. Trace Elem. Res. 1997, 55, 203–214. [Google Scholar] [CrossRef]
- Kim, J.; Combs G.F., Jr. Studies on the effects of selenium on rumen microbial fermentation in vitro. Biol. Trace Elem. Res. 1997, 55, 215–224. [Google Scholar] [CrossRef]
- Combs, G.F., Jr.; Gray, W.P. Chemopreventive agents: Selenium. Pharmacol. Exp. Ther. 1998, 79, 179–196. [Google Scholar] [CrossRef]
- Hawkes, W.C.; Printsev, I.; Alkan, Z. Selenoprotein W depletion induces a p53- and -21-dependenet delay in cell cycle progression in RWPE-1 prostate epithelial cells. J. Cell. Biol. 2013, 113, 61–69. [Google Scholar]
- Ip, C.; Hayes, C.; Budnick, R.M.; Ganther, H.E. Chemical form of selenium, critical metabolites, and cancer prevention. Cancer Res. 1991, 51, 595–600. [Google Scholar]
- Suzuki, K.T.; Kuraski, K.; Suzuki, N. Selenocysteine β-lyase and methylselenol demthylase in the metabolism of Se-methylated selenocompounds into selenide. Biochim. Biophys. Acta 2007, 1770, 1053–1061. [Google Scholar] [CrossRef] [PubMed]
- Zeng, H.; Cheng, W.H.; Johnson, L.K. Methylselenol, a selenium metabolite, modulates p53 pathway and inhibits the growth of colon cancer xenografts in Balb/c mice. J. Nutr. Biochem. 2013, 24, 776–780. [Google Scholar] [CrossRef] [PubMed]
- Hagemann-Jensen, M.; Uhlenbrock, F.; Kehlet, S.; Andresen, L.; Gabel-Jensen, C.; Ellgaard, L.; Gammelgaard, B.; Skov, S. The selenium metabolite methylselenol regulates the expression of ligands that trigger immune activation through the lymphocyte receptor NKG2D. J. Biol. Chem. 2014, 289, 31576–31590. [Google Scholar] [CrossRef] [PubMed]
- Li, G.X.; Lee, H.J.; Wang, Z.; Hu, H.; Liao, J.D.; Watts, J.C.; Combs, G.F.; Lu, J. Superior in vivo inhibitory efficacy of methylseleninic acid against human prostate cancer over selenomethionine or selenite. Carcinogenesis 2008, 29, 1005–1012. [Google Scholar] [CrossRef] [PubMed]
- Jackson, M.I.; Combs, G.F., Jr. Selenium and anticarcinogenesis: Underlying mechanisms. Curr. Opin. Clin. Nutr Metab. Care 2008, 11, 718–726. [Google Scholar] [CrossRef] [PubMed]
- Food and Nutrition Board. Dietary Reference Intakes for Vitamin C, Vitamin E, Selenium and Carotenoids; National Academy Press: Washington, DC, USA, 2000; pp. 311–316. [Google Scholar]
- Skornjakova, L.V. Al Buchanov and MI Salechov, On the acute manifestations of selenium poisoning. Gig. Truda I. Prof. Sabol. 1969, 11, 45–53. [Google Scholar]
- Buchan, R.F. Industrial selenosis. Occup. Med. 1947, 11, 45–53. [Google Scholar]
- Carter, F.R. Acute selenium poisoning. Med J. Austral. 1966, 1, 525–533. [Google Scholar] [PubMed]
- Franke, K.W.; Moxon, A.L. A comparison of the minimum fatal doses of selenium oxychloride. US Pub. Health Rep. 1938, 53, 94–102. [Google Scholar] [CrossRef]
- Jiang, S.; Robberecht, H.; van den Berghe, D. Elimination of selenium compounds by mice through formation of different volatile selenides. Experientia 1983, 39, 293–294. [Google Scholar] [CrossRef] [PubMed]
- Tiwary, A.K.; Painter, K.E.; Stegelmeier, B.L.; James, L.F.; Hall, J.O. Evaluation of the respiratory elimination kinetics of selenium after oral administration in sheep. Am. J. Vet. Res. 2005, 66, 2142–2148. [Google Scholar] [CrossRef] [PubMed]
- Tandon, S.K.; Magos, L.; Webb, M. The stimulation and inhibition of the exhalation of volatile selenium. Biochem. Pharmacol. 1986, 35, 2763–2766. [Google Scholar] [CrossRef] [PubMed]
- Yonemoto, J.; Webb, M.; Magos, L. Methylmercury status stimulates the exhalation of volative selenium and potentiates the toxicity of selenite. Toxicol. Lett. 1985, 24, 7–14. [Google Scholar] [CrossRef]
- Magos, L.; Tandon, S.K.; Webb, M.; Snowden, R. The effects of treatment with selenite before and after the administration of [75Se] on the exhalation of [75Se] dimethylselenide. Toxicol. Lett. 1987, 36, 167–172. [Google Scholar] [CrossRef] [PubMed]
- Vandhanavikit, S.; Kraus, R.J.; Ganther, H.G. Metabolism of selenocyanate in the rat. Arch. Biochem. Biophys. 1987, 258, 1–6. [Google Scholar] [CrossRef] [PubMed]
- Chen, C.L.; Whanger, P.D. Effect of vitamin B12 status on selenium methylation and toxicity in rats: In vivo and in vitro studies. Toxicol. Appl. Pharmacol. 1993, 118, 65–72. [Google Scholar] [CrossRef] [PubMed]
- Ohta, Y.; Koyabashi, Y.; Konishi, S.; Hirano, S. Speciation analysis of selenium metabolites in urine and breath by HPLC- and GC-inductively coupled plasma-MS after adminstratin of selenomethionine and methylselenocysteine to rats. Chem. Res. Toxicol. 2009, 22, 1795–1801. [Google Scholar] [CrossRef] [PubMed]
- Kremer, D.; Ilgen, G.; Feldmann, J. GC-ICP-MS determination of dimethylselenide in human breath after ingestion of 77-Se-enriched selenite: Monitoring of in vitro methylation of selenium. Ann. Bioanal. Chem. 2005, 383, 509–515. [Google Scholar] [CrossRef]
- Yang, G.Q.; Wang, S.Z.; Zhou, R.H.; Sun, S.Z. Endemic selenium intoxication of humans in China. Am. J. Clin. Nutr. 1983, 37, 872–881. [Google Scholar] [PubMed]
- Yang, G.; Yin, S.; Zhou, R.; Gu, L.; Yan, B.; Liu, Y.; Liu, Y. Studies of safe maximal daily dietary Se-intake in a seleniferous area in China. Part II: Relation between Se-intake and the manifestation of clinical signs and certain biochemical alterations in blood and urine. J. Trace Elem. Electrolytes Health Dis. 1989, 3, 123–130. [Google Scholar] [PubMed]
- Poirier, K.A. Summary of the derivation of the reference dose for selenium. In Risk Assessment of Essential Elements; Mertz, W., Abernathy, C.O., Olin, S.S., Eds.; ILSI Press: Washington, DC, USA, 1994; pp. 157–166. [Google Scholar]
- Bleys, J.; Navas-Acien, A.; Guallar, E. Serum selenium and diabetes in U.S. adults. Diabetes Care 2007, 30, 829–834. [Google Scholar] [CrossRef] [PubMed]
- Stranges, S.; Marshall, J.R.; Natarajan, R.; Donahue, R.P.; Trevisan, M.; Combs, G.F.; Cappuccio, F.P.; Ceriello, A.; Reid, M.E. Effects of long-term selenium supplementation on the incidence of type 2 diabetes: A randomized trial. Ann. Intern. Med. 2007, 147, 217–223. [Google Scholar] [CrossRef] [PubMed]
- Rayman, M.R.; Stranges, S. Epidemiology of selenium and type 2 diabetes: Can we make sense of it? Free Rad. Biol. Med. 2013, 65, 1557–1564. [Google Scholar] [CrossRef] [PubMed]
- Algotar, A.M.; Stratton, M.S.; Stratton, S.P.; Hsu, C.H.; Ahmann, F.R. No effect of selenium supplementation on serum glucose levels in men with prostate cancer. Am. J. Med. 2010, 123, 765–768. [Google Scholar] [CrossRef] [PubMed]
- Alizadeh, M.; Safaeiyan, A.; Ostradrhimi, A.; Estakhri, R.; Daneghian, S.; Ghaffari, A.; Gargari, B.P. Effect of l-arginine and selenium added to a hypocaloric diet enriched with legumes on cardiovascular disease risk factors in women with central obesity: A randomized, double-blind, placebo-controlled trial. Ann. Nutr. Metab. 2012, 60, 157–168. [Google Scholar] [CrossRef] [PubMed]
- Zeng, M.S.; Li, X.; Kiu, Y.; Zhao, H.; Zhou, J.C.; Li, K.; Huang, J.Q.; Sun, L.H.; Tang, J.Y.; Xia, X.J.; et al. A high-selenium diet induced insulin resistance in gestating rats and their offspring. Free Rad. Biol. Med. 2012, 52, 1335–1342. [Google Scholar] [CrossRef]
- Liu, Y.; Zhao, H.; Zhang, Q.; Tang, J.; Xia, X.J.; Wang, K.N.; Li, K.; Lei, X.G. Prolonged dietary selenium deficiency or excess does not globally affect selenoprotein gene expression and/or protein production in various tissues of pigs. J. Nutr. 2012, 142, 1410–1416. [Google Scholar] [PubMed]
- Mueller, A.S.; Pallauf, J.; Rafael, J. The chemical form of selenium affects insulinomimetic properties of the trace element: Investigations of type II diabetic dbdb mice. J. Nutr. Biochem. 2003, 14, 637–647. [Google Scholar] [CrossRef] [PubMed]
- Wang, X.; Zhang, W.; Chen, H.; Liao, N.; Wang, Z.; Zhang, X.; Hai, C. High selenium impairs hepatic insulin sensitivity through opposite regulation of ROS. Toxicol. Letts. 2014, 224, 16–23. [Google Scholar] [CrossRef]
- Labunskyy, V.M.; Lee, B.C.; Handy, D.E.; Loscalzo, J.; Hatfield, D.L.; Gladyshev, V.N. Both maximal expression of selenoproteins and selenium deficiency can promote development of type-2 diabetes-like phenotype in mice. Antioxid. Redox Signal. 2011, 14, 2327–2336. [Google Scholar] [CrossRef] [PubMed]
- McClung, J.P.; Roneker, C.A.; Mu, W.; Lisk, D.J.; Langlais, P.; Liu, F.; Lei, X.G. Development of insulin resistance and obesity in mice overexpressing cellular glutathione peroxidase. Proc. Nat. Acad. Sci. USA 2004, 101, 8852–8857. [Google Scholar] [CrossRef] [PubMed]
- Steinbrenner, H. Interference of selenium and selenoproteins with the insulin-regulated carbohydrate and lipid metabolism. Free Rad. Biol. Med. 2013, 65, 1538–1547. [Google Scholar] [CrossRef] [PubMed]
© 2015 by the authors; licensee MDPI, Basel, Switzerland. This article is an open access article distributed under the terms and conditions of the Creative Commons Attribution license (http://creativecommons.org/licenses/by/4.0/).
Share and Cite
F. Combs, Jr., G. Biomarkers of Selenium Status. Nutrients 2015, 7, 2209-2236. https://doi.org/10.3390/nu7042209
F. Combs, Jr. G. Biomarkers of Selenium Status. Nutrients. 2015; 7(4):2209-2236. https://doi.org/10.3390/nu7042209
Chicago/Turabian StyleF. Combs, Jr., Gerald. 2015. "Biomarkers of Selenium Status" Nutrients 7, no. 4: 2209-2236. https://doi.org/10.3390/nu7042209
APA StyleF. Combs, Jr., G. (2015). Biomarkers of Selenium Status. Nutrients, 7(4), 2209-2236. https://doi.org/10.3390/nu7042209