Improvements in Iron Status and Cognitive Function in Young Women Consuming Beef or Non-Beef Lunches


Abstract
:1. Introduction
2. Experimental Section
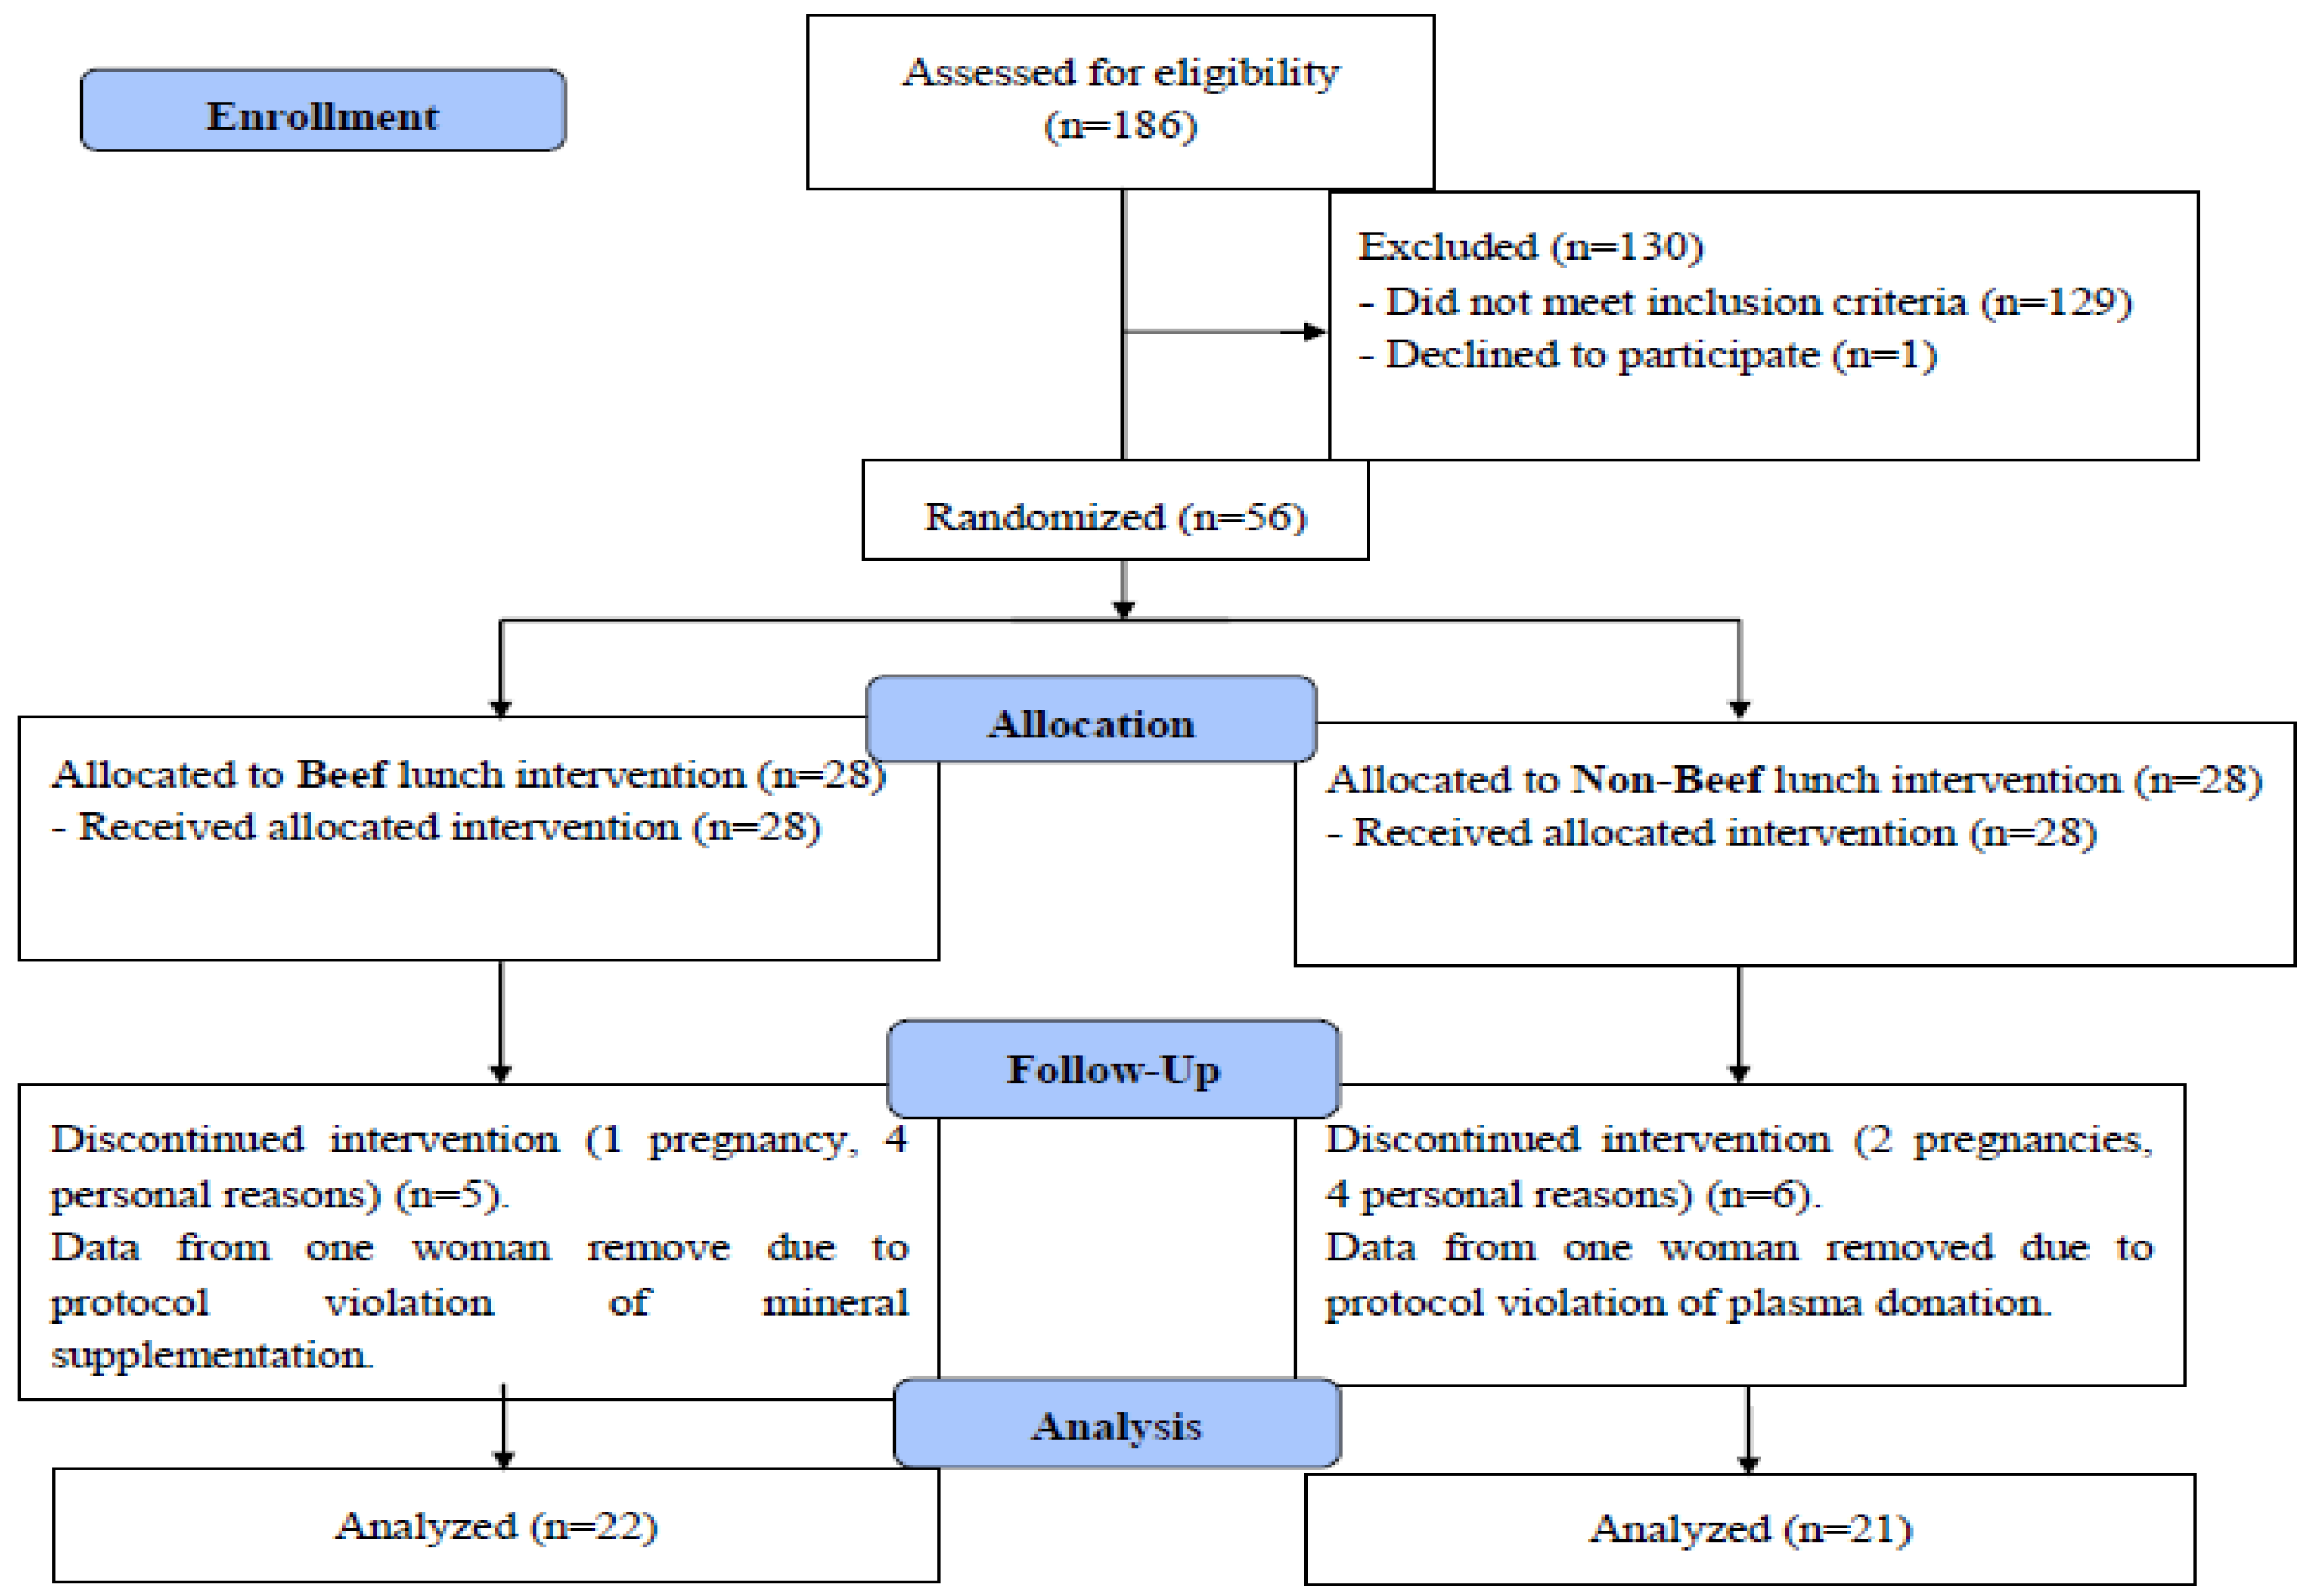
2.1. Study Design
2.2. Participants
2.1.1. Data Collection
2.1.1.1. Anthropometrics
2.1.1.2. Blood Analyses (Iron Assessment, Lipids, C-Reactive Protein)
2.1.1.3. Assessment of Cognitive Performance
2.1.1.4. Dietary Intervention

| Lunch type | |||
|---|---|---|---|
| Beef, 3 oz/85 g | Kcal | Fe (mg) | Protein (g) |
| eye round roast | 138 | 2.17 | 24.40 |
| top sirloin | 160 | 1.76 | 25.75 |
| roast beef sliced | 162 | 2.14 | 22.45 |
| ground beef 90% lean | 173 | 2.35 | 21.43 |
| pot roast | 173 | 3.00 | 26.38 |
| beef short loin | 163 | 1.65 | 24.57 |
| Non-Beef, 3 oz/85 g | |||
| egg substitute | 40 | 1.66 | 8.40 |
| marinated chicken breast | 142 | 0.89 | 26.68 |
| sliced turkey breast | 88 | 1.22 | 14.50 |
| cheddar cheese, low fat | 343 | 0.58 | 28.14 |
| ground turkey 93% lean | 181 | 1.33 | 23.04 |
| pork tenderloin | 151 | 0.98 | 22.24 |
| Ham | 91 | 0.48 | 14.10 |
| Turkey tenderloin, Foster Farms | 90 | 1.40 | 21.00 |
| Swiss cheese | 323 | 0.17 | 22.90 |
| Starch, 2 oz/56 g | |||
| pasta | 88 | 0.72 | 3.25 |
| roll | 174 | 2.08 | 6.08 |
| white bread sandwich | 148 | 2.01 | 5.12 |
| small red potatoes | 50 | 0.39 | 1.29 |
| rice white, instant | 66 | 0.99 | 1.22 |
| hamburger bun | 158 | 1.94 | 5.60 |
| flour tortilla | 161 | 1.12 | 4.88 |
| Average per lunch | |||
| Beef | 282 | 3.50 | 28.08 |
| Non-Beef | 282 | 2.29 | 24.03 |
2.1.1.5. Assessment of Dietary Intake
2.1.1.6. Assessment of Covariates
2.1.2. Statistical Analyses
3. Results
3.1. Demographics and Baseline Measurements
| Variable | All Women (n = 43) | Beef (n = 22) | Non-beef (n = 21) |
|---|---|---|---|
| Age (years) | 21.14 ± 0.38 | 21.70 ± 0.62 | 20.56 ± 0.43 |
| Body weight (kg) | 64.80 ± 1.52 | 64.43 ± 2.36 | 65.18 ± 1.98 |
| BMI (kg/m2) | 23.27 ± 0.51 | 23.76 ± 0.77 | 22.76 ± 0.67 |
| Variable * | Baseline | Midpoint (week 8) | Endpoint (week 16) | Absolute change (endpoint-baseline) | P value Main effect time | P value Main effect baseline measure | P value time × baseline measure | ||||
|---|---|---|---|---|---|---|---|---|---|---|---|
| Beef | Non-beef | Beef | Non-beef | Beef | Non-beef | Beef | Non-beef | ||||
| Hb (g/L) † | 143.4 ± 2.4 | 138.5 ± 0.3 | 145.6 ± 0.2 | 141.5 ± 0.2 | 146.2 ± 0.2 | 140.7 ± 0.2 | 2.8 ± 1.8 | 2.1 ± 1.9 | <0.0001 | <0.0001 | <0.0001 |
| Hct (%) | 41.6 ± 0.7 | 40.2 ± 0.7 | 42.5 ± 0.6 | 40.8 ± 0.5 | 42.4 ± 0.5 | 40.9 ± 0.5 | 0.8 ± 0.5 | 0.8 ± 0.7 | <0.0001 | <0.0001 | <0.0001 |
| RBC (millions/mm3) | 4.7 ± 0.1 | 4.7 ± 0.1 | 4.8 ± 0.1 | 4.7 ± 0.1 | 4.8 ± 0.1 | 4.7 ± 0.1 | 0.1 ± 0.1 | 0.0 ± 0.1 | <0.0001 | <0.0001 | <0.0001 |
| MCV (µm3) | 88.2 ± 0.7 | 87.1 ± 1.1 | 88.2 ± 0.8 | 86.9 ± 1.0 | 88.1 ± 0.8 | 87.3 ± 1.0 | −0.1 ± 0.3 | 0.2 ± 0.6 | <0.05 | <0.0001 | <0.05 |
| MCH (pg) | 30.4 ± 0.3 | 30.0 ± 0.5 | 30.3 ± 0.4 | 30.1 ± 0.5 | 30.4 ± 0.4 | 30.1 ± 0.5 | 0.0 ± 0.2 | 0.0 ± 0.3 | NS | <0.0001 | NS |
| MCHC (%) | 34.5 ± 0.2 | 34.4 ± 0.2 | 34.3 ± 0.3 | 34.6 ± 0.2 | 34.5 ± 0.2 | 34.4 ± 0.3 | 0.0 ± 0.2 | 0.0 ± 0.3 | <0.05 | <0.0001 | <0.05 |
| Body iron (mg/kg) †† | 6.5 ± 0.6 | 5.2 ± 0.8 | 6.5 ± 0.7 | 5.0 ± 3.8 | 7.0 ± 0.6 | 6.0 ± 0.5 | 0.5 ± 0.4 | 0.9 ± 0.5 | <0.001 | <0.0001 | <0.0001 |
| Serum ferritin (ng/mL) | 33.6 ± 4.8 | 28.3 ± 4.2 | 34.0 ± 4.8 | 28.5 ± 4.6 | 41.6 ± 6.8 | 29.2 ± 3.0 | 8.0 ± 3.9 | 0.9 ± 2.7 | <0.0001 | <0.0001 | <0.0001 |
| TfR (mg/L) † †† | 3.1 ± 0.2 | 3.8 ± 0.4 | 3.1 ± 0.2 | 3.8 ± 0.3 | 3.2 ± 0.2 | 3.4 ± 0.2 | 0.1 ± 0.1 | −0.4 ± 0.2 | <0.0001 | <0.0001 | <0.0001 |
| Serum iron (µg/L) | 1027.8 ± 89.1 | 1034.7 ± 115.8 | 921.8 ± 57.6 | 915.2 ± 94.0 | 955.5 ± 66.2 | 1064.8 ± 73.6 | −72.0 ± 97.5 | 30.0 ± 112.9 | <0.0001 | <0.0001 | <0.0001 |
| Tf (mg/dL) | 285.2 ± 9.0 | 290.0 ± 9.5 | 285.5 ± 9.6 | 297.4 ± 9.8 | 285.5 ± 10.5 | 288.3± 10.8 | 0.3 ± 6.2 | −15.5 ± 16.7 | NS | NS | NS |
| Tf saturation (%) | 31.4 ± 3.3 | 31.5 ± 3.9 | 27.6 ± 2.4 | 26.7 ± 3.3 | 28.8 ± 2.5 | 31.1 ± 2.8 | −2.6 ± 2.9 | −0.4 ± 3.2 | <0.0001 | <0.0001 | <0.0001 |
3.2. Effects of Intervention and Baseline Iron Status on Change in Iron Status
| Variable * | Ferritin Responder (n = 17) | Ferritin Non-responder (n = 26) | p value |
|---|---|---|---|
| Ferritin, percent change | 100.75 ± 17.51 | −12.74 ± 4.08 | p < 0.0001 |
| TfR, percent change | −8.23 ± 3.69 | 5.90 ± 3.16 | p = 0.006 |
| Body iron, absolute change (mg/kg) | 2.67 ± 0.36 | −0.65 ± 0.24 | p < 0.0001 |
| Hb, percent change | 5.23 ± 1.76 | 0.11 ± 0.98 | p = 0.009 |
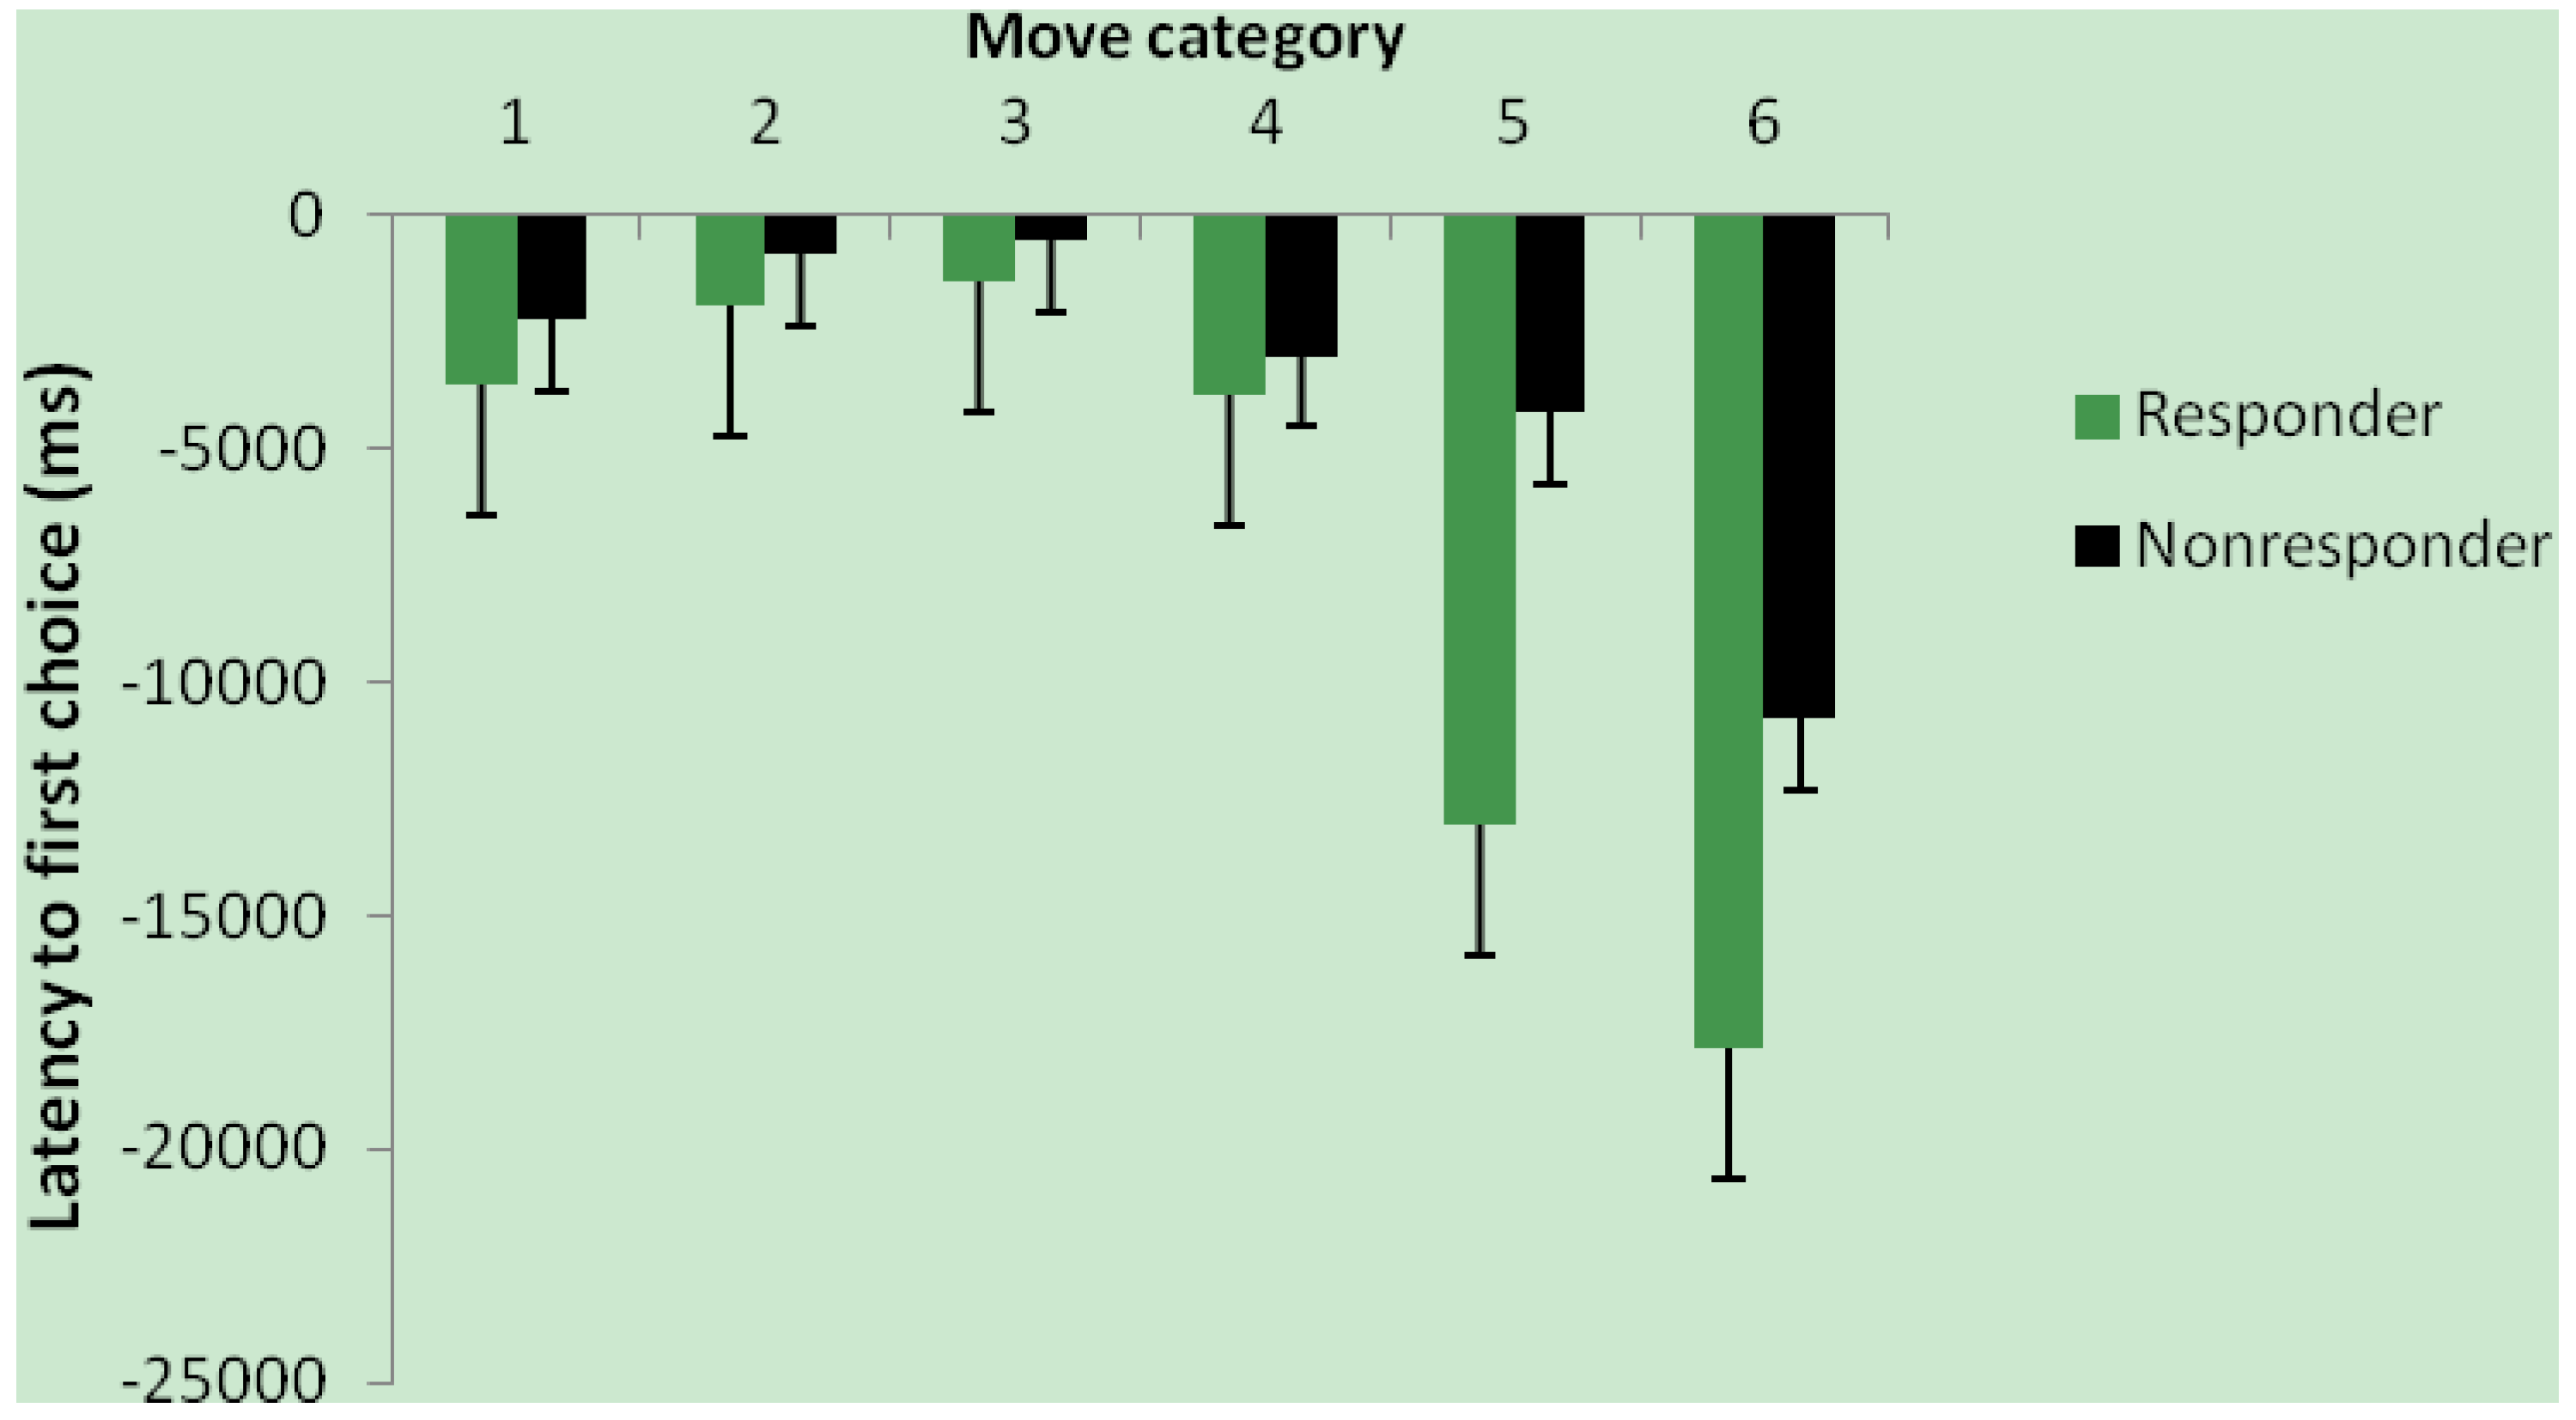
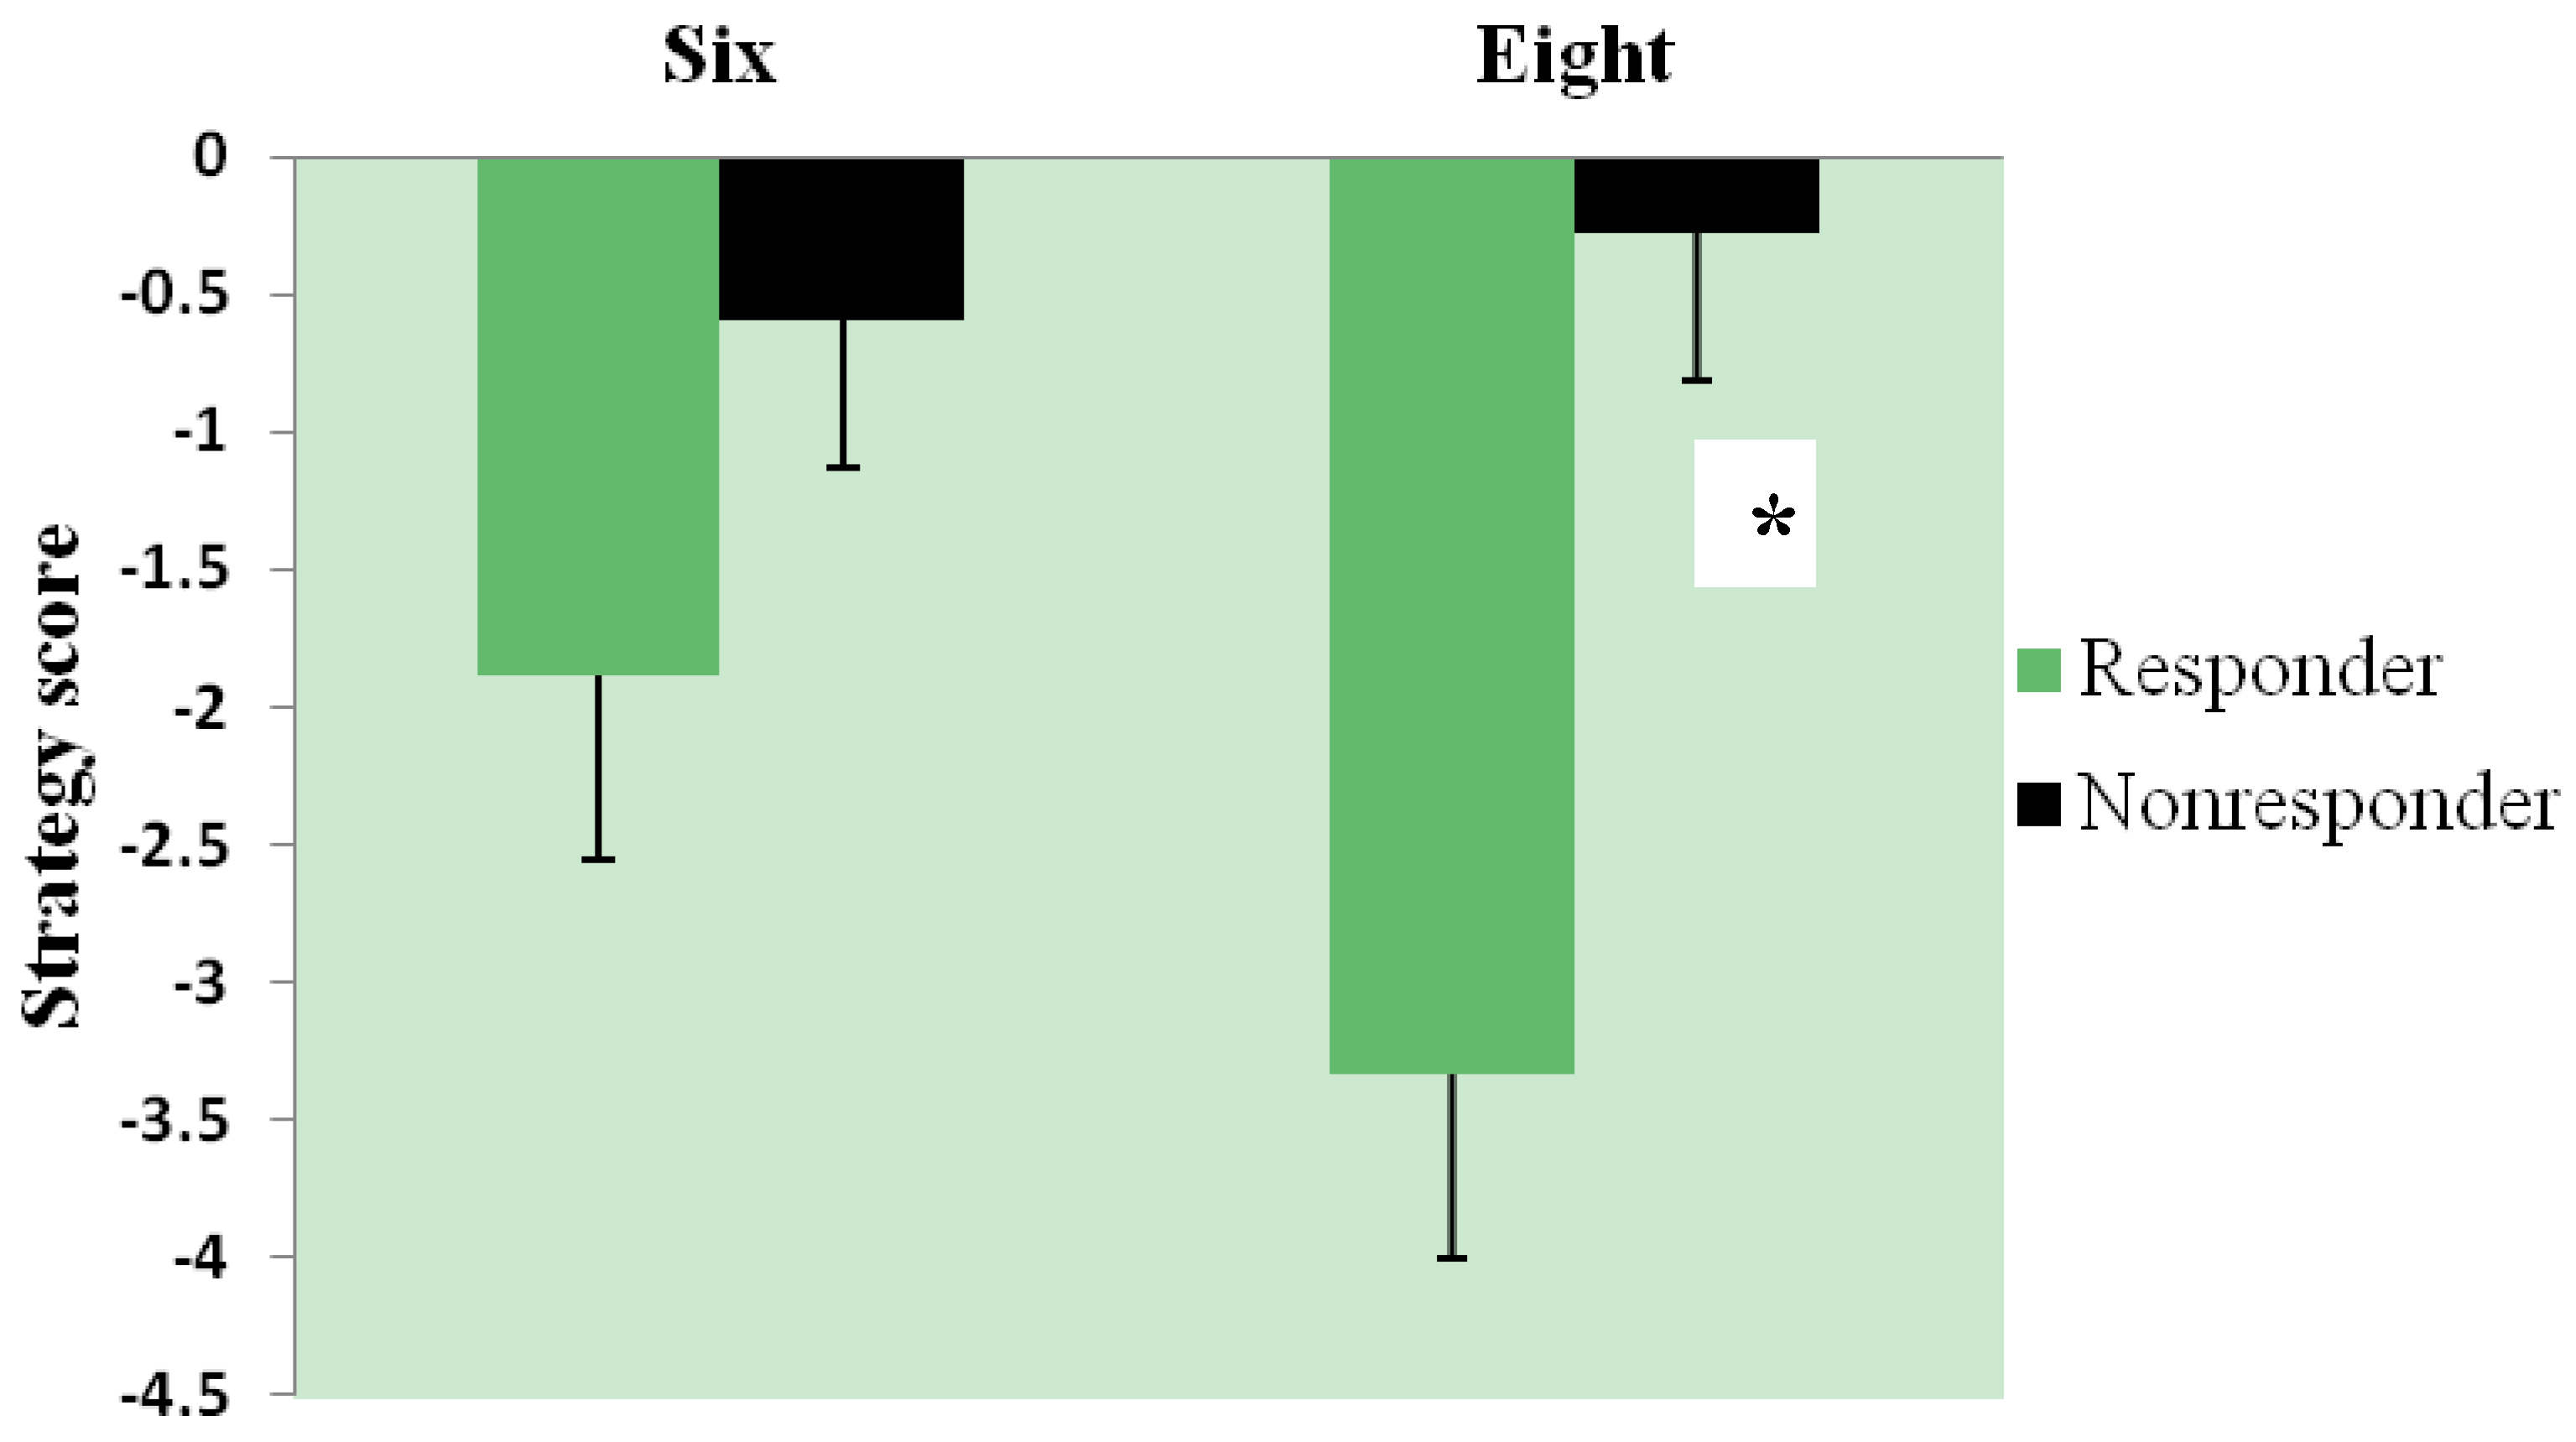
3.3. Effect of Intervention and Iron Status on Cognitive Test Performance

3.4. Relationship of Iron Status and Cognitive Function in All Women (n = 54) with Baseline Measures
| Variable | Women (n = 54) |
|---|---|
| Age (years) | 21.70 ± 0.41 |
| Body weight (kg) | 64.99 ± 1.30 |
| BMI (kg/m2) | 23.47 ± 0.44 |
| Body iron (mg/kg) | 6.20 ± 0.46 |
| Ferritin (ng/mL) | 32.93 ± 2.88 |
| TfR (mg/L) | 3.30 ± 0.17 |
| Hb (g/L) | 140.94 ± 1.49 |
3.5. Effect of Intervention on Blood Lipids (n = 43)
3.6. Dietary Assessment
| Lunch Group | Baseline | Intervention | ||||||
|---|---|---|---|---|---|---|---|---|
| Adj protein (g) | Adj iron (mg) | Adj heme iron (mg) | Adj meat iron (mg) | Adj protein (g) | Adj iron (mg) | Adj heme iron (mg) | Adj meat iron (mg) | |
| Beef | 44 ± 2.1 | 7.3 ± 0.3 | 0.5 ± 0.1 | 1.0 ± 0.2 | 41 ± 1 * | 7.3 ± 0.2 | 0.6 ± 0.0 † | 1.2 ± 0.1 † |
| Non-Beef | 45 ± 1.8 | 7.5 ± 0.4 | 0.5 ± 0.1 | 1.1 ± 0.1 | 40 ± 1 * | 7.7 ± 0.2 | 0.3 ± 0.0 | 0.4 ± 0.0 |
4. Discussion
5. Conclusions
Acknowledgments
Conflicts of Interest
References
- Cogswell, M.E.; Looker, A.C.; Pfeiffer, C.M.; Cook, J.D.; Lacher, D.A.; Beard, J.L.; Lynch, S.R.; Grummer-Strawn, L.M. Assessment of iron deficiency in US preschool children and nonpregnant females of childbearing age: National health and nutrition examination survey 2003–2006. Am. J. Clin. Nutr. 2009, 89, 1334–1342. [Google Scholar] [CrossRef]
- Mejia-Rodriguez, F.; Shamah-Levy, T.; Villalpando, S.; Garcia-Guerra, A.; Mendez-Gomez, I. Humaran, Iron, zinc, copper and magnesium deficiencies in Mexican adults from the National Health and Nutrition Survey 2006. Salud Publ. Mex. 2013, 55, 275–284. [Google Scholar]
- Cooper, M.; Greene-Finestone, L.; Lowell, H.; Levesque, J.; Robinson, S. Iron sufficiency of Canadians. Health Rep. 2012, 23, 41–48. [Google Scholar]
- Hawk, S.; Englehardt, K.G.; Small, C. Risks of iron deficiency among vegetarian college women. Health 2012, 4, 113–119. [Google Scholar] [CrossRef]
- Houston, M.S. Lifestyle and dietary practices influencing iron status in university women. Nutr. Res. 1997, 17, 9–22. [Google Scholar] [CrossRef]
- Wilcock, C.; Wengreen, H.; Schvaneveldt, N.B. Iron deficiency in young-adult women attending Utah State University. J. Am. Diet. Assoc. 2004, 104, 27. [Google Scholar]
- Worthington-Roberts, B.S.; Breskin, M.W.; Monsen, E.R. Iron status of premenopausal women in a university community and its relationship to habitual dietary sources of protein. Am. J. Clin. Nutr. 1988, 47, 275–279. [Google Scholar]
- Blanton, C.A.; Green, M.W.; Kretsch, M.J. Body iron is associated with cognitive executive planning function in college women. Br. J. Nutr. 2013, 109, 906–913. [Google Scholar] [CrossRef]
- Beard, J.L.; Hendricks, M.K.; Perez, E.M.; Murray-Kolb, L.E.; Berg, A.; Vernon-Feagans, L.; Irlam, J.; Isaacs, W.; Sive, A.; Tomlinson, M. Maternal iron deficiency anemia affects postpartum emotions and cognition. J. Nutr. 2005, 135, 267–272. [Google Scholar]
- Fordy, J.; Benton, D. Does low iron status influence psychological functioning? J. Hum. Nutr. Diet. 1994, 7, 127–133. [Google Scholar] [CrossRef]
- Groner, J.A.; Holtzman, N.A.; Charney, E.; Mellits, E.D. A randomized trial of oral iron on tests of short-term memory and attention span in young pregnant women. J. Adolesc. Health Care 1986, 7, 44–48. [Google Scholar] [CrossRef]
- Khedr, E.; Hamed, S.A.; Elbeih, E.; El-Shereef, H.; Ahmad, Y.; Ahmed, S. Iron states and cognitive abilities in young adults: Neuropsychological and neurophysiological assessment. Eur. Arch. Psychiatry Clin. Neurosci. 2008, 258, 489–496. [Google Scholar] [CrossRef]
- Kretsch, M.J.; Fong, A.K.; Green, M.W.; Johnson, H.L. Cognitive function, iron status, and hemoglobin concentration in obese dieting women. Eur. J. Clin. Nutr. 1998, 52, 512–518. [Google Scholar]
- Murray-Kolb, L.E.; Beard, J.L. Iron treatment normalizes cognitive functioning in young women. Am. J. Clin. Nutr. 2007, 85, 778–787. [Google Scholar]
- Foley, D.; Hay, D.A.; Mitchell, R.J. Specific cognitive effects of mild iron deficiency and associations with blood polymorphisms in young adults. Ann. Hum. Biol. 1986, 13, 417–425. [Google Scholar] [CrossRef]
- Beard, J.L. Effectiveness and strategies of iron supplementation during pregnancy. Am. J. Clin. Nutr. 2000, 71, 1288S–1294S. [Google Scholar]
- Fisher, A.E.; Naughton, D.P. Iron supplements: The quick fix with long-term consequences. Nutr. J. 2004, 3, 2. [Google Scholar] [CrossRef]
- Galloway, R.; McGuire, J. Determinants of compliance with iron supplementation: Supplies, side effects, or psychology? So. Sci. Med. 1994, 39, 381–390. [Google Scholar] [CrossRef]
- Heath, A.L.; Skeaff, C.M.; Williams, S.; Gibson, R.S. The role of blood loss and diet in the aetiology of mild iron deficiency in premenopausal adult New Zealand women. Public Health Nutr. 2001, 4, 197–206. [Google Scholar]
- Patterson, A.J.; Brown, W.J.; Roberts, D.C. Dietary and supplement treatment of iron deficiency results in improvements in general health and fatigue in Australian women of childbearing age. J. Am. Coll. Nutr. 2001, 20, 337–342. [Google Scholar] [CrossRef]
- McClung, J.P.; Karl, J.P. Iron deficiency and obesity: The contribution of inflammation and diminished iron absorption. Nutr. Rev. 2009, 67, 100–104. [Google Scholar] [CrossRef]
- Sherwin, B.B. Estrogen and cognitive functioning in women. Endocr. Rev. 2003, 24, 133–151. [Google Scholar] [CrossRef]
- Kim, I.; Yetley, E.A.; Calvo, M.S. Variations in iron-status measures during the menstrual cycle. Am. J. Clin. Nutr. 1993, 58, 705–709. [Google Scholar]
- Cook, J.D.; Flowers, C.H.; Skikne, B.S. The quantitative assessment of body iron. Blood 2003, 101, 3359–3364. [Google Scholar] [CrossRef]
- Friedewald, W.T.; Levy, R.I.; Fredrickson, D.S. Estimation of the concentration of low-density lipoprotein cholesterol in plasma, without use of the preparative ultracentrifuge. Clin. Chem. 1972, 18, 499–502. [Google Scholar]
- Konijn, A.M. Iron metabolism in inflammation. Baillieres Clin. Haematol. 1994, 7, 829–849. [Google Scholar] [CrossRef]
- Ford, E.S.; Giles, W.H.; Mokdad, A.H.; Myers, G.L. Distribution and correlates of C-reactive protein concentrations among adult US women. Clin. Chem. 2004, 50, 574–581. [Google Scholar] [CrossRef]
- Doniger, G.M.; Simon, E.S.; Zivotofsky, A.Z. Comprehensive computerized assessment of cognitive sequelae of a complete 12–16 h fast. Behav. Neurosci. 2006, 120, 804–816. [Google Scholar] [CrossRef]
- Youdim, M.B.; Ben-Shachar, D.; Yehuda, S. Putative biological mechanisms of the effect of iron deficiency on brain biochemistry and behavior. Am. J. Clin. Nutr. 1989, 50, 607–615. [Google Scholar]
- U.S. Department of Agriculture, Agricultural Research Service, 2013. USDA National Nutrient Database for Standard Reference, Release 26. Nutrient Data Laboratory Homepage. Available online: http://www.ars.usda.gov/ba/bhnrc/ndl (accessed on 29 September 2013).
- U.S. Department of Agriculture, Agricultural Research Service. USDA Food and Nutrient Database for Dietary Studies, version 1.0; Agricultural Research Service, Food Surveys Research Group: Beltsville, MD, USA, 2004.
- Administering SAS® Enterprise Guide® 4.3. SAS Institute Inc.: Cary, NC, USA, 2010.
- Brownlie, T.; Utermohlen, V.; Hinton, P.S.; Giordano, C.; Haas, J.D. Marginal iron deficiency without anemia impairs aerobic adaptation among previously untrained women. Am. J. Clin. Nutr. 2002, 75, 734–742. [Google Scholar]
- Bregman, D.B.; Morris, D.; Koch, T.A.; He, A.; Goodnough, L.T. Hepcidin levels predict nonresponsiveness to oral iron therapy in patients with iron deficiency anemia. Am. J. Hematol. 2013, 88, 97–101. [Google Scholar] [CrossRef]
- Cooper, M.J.; Zlotkin, S.H. Day-to-day variation of transferrin receptor and ferritin in healthy men and women. Am. J. Clin. Nutr. 1996, 64, 738–742. [Google Scholar]
- Stupnicki, R.; Malczewska, J.; Milde, K.; Hackney, A.C. Day to day variability in the transferrin receptor/ferritin index in female athletes. Br. J. Sports Med. 2003, 37, 267–269. [Google Scholar] [CrossRef]
- Borel, M.J.; Smith, S.M.; Derr, J.; Beard, J.L. Day-to-day variation in iron-status indices in healthy men and women. Am. J. Clin. Nutr. 1991, 54, 729–735. [Google Scholar]
- Sauberlich, H.E. Assessment of Nutritional Status, 2nd ed.; Wolinsky, I., Hickson, J., Eds.; CRC Press: Boca Raton, FL, USA, 1999. [Google Scholar]
- Mifflin, M.D.; Jeor, S.T.S.; Hill, L.A.; Scott, B.J.; Daugherty, S.A.; Koh, Y.O. A new predictive equation for resting energy expenditure in healthy individuals. Am. J. Clin. Nutr. 1990, 51, 241–247. [Google Scholar]
- Goldberg, G.R.; Black, A.E.; Jebb, S.A.; Cole, T.J.; Murgatroyd, P.R.; Coward, W.A.; Prentice, A.M. Critical evaluation of energy intake data using fundamental principles of energy physiology: 1. Derivation of cut-off limits to identify under-recording. Eur. J. Clin. Nutr. 1991, 45, 569–581. [Google Scholar]
- Lukowski, A.F.; Koss, M.; Burden, M.J.; Jonides, J.; Nelson, C.A.; Kaciroti, N.; Jimenez, E.; Lozoff, B. Iron deficiency in infancy and neurocognitive functioning at 19 years: Evidence of long-term deficits in executive function and recognition memory. Nutr. Neurosci. 2010, 13, 54–70. [Google Scholar] [CrossRef]
- Murray-Kolb, L.E. Iron status and neuropsychological consequences in women of reproductive age: What do we know and where are we headed? J. Nutr. 2011, 141, 747S–755S. [Google Scholar] [CrossRef]
- Bruner, A.B.; Joffe, A.; Duggan, A.K.; Casella, J.F.; Brandt, J. Randomised study of cognitive effects of iron supplementation in non-anaemic iron-deficient adolescent girls. Lancet 1996, 348, 992–996. [Google Scholar] [CrossRef]
- Hoppe, M.; Brun, B.; Larsson, M.P.; Moraeus, L.; Hulthen, L. Heme iron-based dietary intervention for improvement of iron status in young women. Nutrition 2013, 29, 89–95. [Google Scholar] [CrossRef]
- Karl, J.P.; Lieberman, H.R.; Cable, S.J.; Williams, K.W.; Young, A.J.; McClung, J.P. Randomized, double-blind, placebo-controlled trial of an iron-fortified food product in female soldiers during military training: Relations between iron status, serum hepcidin, and inflammation. Am. J. Clin. Nutr. 2010, 92, 93–100. [Google Scholar] [CrossRef]
- Haas, J.D.; Beard, J.L.; Murray-Kolb, L.E.; del Mundo, A.M.; Felix, A.; Gregorio, G.B. Iron-biofortified rice improves the iron stores of nonanemic Filipino women. J. Nutr. 2005, 135, 2823–2830. [Google Scholar]
- Lyle, R.M.; Weaver, C.M.; Sedlock, D.A.; Rajaram, S.; Martin, B.; Melby, C.L. Iron status in exercising women: The effect of oral iron therapy vs increased consumption of muscle foods. Am. J. Clin. Nutr. 1992, 56, 1049–1055. [Google Scholar]
- Snetselaar, L.; Stumbo, P.; Chenard, C.; Ahrens, L.; Smith, K.; Zimmerman, B. Adolescents eating diets rich in either lean beef or lean poultry and fish reduced fat and saturated fat intake and those eating beef maintained serum ferritin status. J. Am. Diet. Assoc. 2004, 104, 424–428. [Google Scholar] [CrossRef]
- Navas-Carretero, S.; Perez-Granados, A.M.; Schoppen, S.; Sarria, B.; Carbajal, A.; Vaquero, M.P. Iron status biomarkers in iron deficient women consuming oily fish vs. red meat diet. J. Physiol. Biochem. 2009, 65, 165–174. [Google Scholar] [CrossRef]
- Casgrain, A.; Collings, R.; Harvey, L.J.; Hooper, L.; Fairweather-Tait, S.J. Effect of iron intake on iron status: A systematic review and meta-analysis of randomized controlled trials. Am. J. Clin. Nutr. 2012, 96, 768–780. [Google Scholar] [CrossRef]
- Wenger, M.J.; Murray-Kolb, L.E.; Haas, J.D. Variations in body iron status determine variations in body energy expenditure and brain dynamics as a function of perceptual and cognitive workload. FASEB J. 2013, 27, 840. [Google Scholar]
- Wenger, M.J.; Scott, S.P.; Murray-Kolb, L.E.; Ghugre, P.; Udipi, S.; Haas, J.D. Brain dynamics as a function of iron status: Relating electroencephalographic (EEG) patterns and body iron measures in Indian adolescents. FASEB J. 2013, 27, 845. [Google Scholar] [CrossRef]
- Kececi, H.; Degirmenci, Y. Quantitative EEG and cognitive evoked potentials in anemia. Neurophysiol. Clin. 2008, 38, 137–143. [Google Scholar] [CrossRef]
- Tucker, D.; Sandstead, H.H.; Penland, J.; Dawson, S.; Milne, D. Iron status and brain function: Serum ferritin levels associated with asymmetries of cortical electrophysiology and cognitive performance. Am. J. Clin. Nutr. 1984, 39, 105–113. [Google Scholar]
- Tucker, D.M.; Sandstead, H.H.; Swenson, R.A.; Sawler, B.G.; Penland, J.G. Longitudinal study of brain function and depletion of iron stores in individual subjects. Physiol. Behav. 1982, 29, 737–740. [Google Scholar] [CrossRef]
- Beard, J.L.; Durward, C. Nutrition and Health, A. Bendich. In Iron Physiology and Pathophysiology in Humans; Anderson, G.J., McLaren, G.D., Eds.; Humana Press: New York, NY, USA, 2012. [Google Scholar]
- Beard, J.L.; Connor, J.R. Iron status and neural functioning. Annu. Rev. Nutr. 2003, 23, 41–58. [Google Scholar] [CrossRef]
- Anding, J.D.; Suminski, R.R.; Boss, L. Dietary intake, body mass index, exercise, and alcohol: Are college women following the dietary guidelines for Americans? J. Am. Coll. Health 2001, 49, 167–171. [Google Scholar] [CrossRef]
- Huang, T.T.; Harris, K.J.; Lee, R.E.; Nazir, N.; Born, W.; Kaur, H. Assessing overweight, obesity, diet, and physical activity in college students. J. Am. Coll. Health 2003, 52, 83–86. [Google Scholar] [CrossRef]
- Larson, N.I.; Perry, C.L.; Story, M.; Neumark-Sztainer, D. Food preparation by young adults is associated with better diet quality. J. Am. Diet. Assoc. 2006, 106, 2001–2007. [Google Scholar] [CrossRef]
- Gibson, S.; Ashwell, M. The association between red and processed meat consumption and iron intakes and status among British adults. Public Health Nutr. 2003, 6, 341–350. [Google Scholar]
- Anguera, J.A.; Boccanfuso, J.; Rintoul, J.L.; Al-Hashimi, O.; Faraji, F.; Janowich, J.; Kong, E.; Larraburo, Y.; Rolle, C.; Johnston, E.; et al. Video game training enhances cognitive control in older adults. Nature 2013, 501, 97–101. [Google Scholar] [CrossRef]
© 2013 by the authors; licensee MDPI, Basel, Switzerland. This article is an open access article distributed under the terms and conditions of the Creative Commons Attribution license (http://creativecommons.org/licenses/by/3.0/).
Share and Cite
Blanton, C. Improvements in Iron Status and Cognitive Function in Young Women Consuming Beef or Non-Beef Lunches. Nutrients 2014, 6, 90-110. https://doi.org/10.3390/nu6010090
Blanton C. Improvements in Iron Status and Cognitive Function in Young Women Consuming Beef or Non-Beef Lunches. Nutrients. 2014; 6(1):90-110. https://doi.org/10.3390/nu6010090
Chicago/Turabian StyleBlanton, Cynthia. 2014. "Improvements in Iron Status and Cognitive Function in Young Women Consuming Beef or Non-Beef Lunches" Nutrients 6, no. 1: 90-110. https://doi.org/10.3390/nu6010090
APA StyleBlanton, C. (2014). Improvements in Iron Status and Cognitive Function in Young Women Consuming Beef or Non-Beef Lunches. Nutrients, 6(1), 90-110. https://doi.org/10.3390/nu6010090