Plasma and Tissue Concentrations of α-Tocopherol and δ-Tocopherol Following High Dose Dietary Supplementation in Mice

Abstract
:1. Introduction
2. Experimental Section
2.1. α-Toc, δ-Toc, Sesamin, and Mouse Diet
2.2. Mice, α-Toc and δ-Toc Administration, and Tissue Collection
2.3. Liquid Chromatography-Mass Spectrometry
2.4. Data Analysis
3. Results
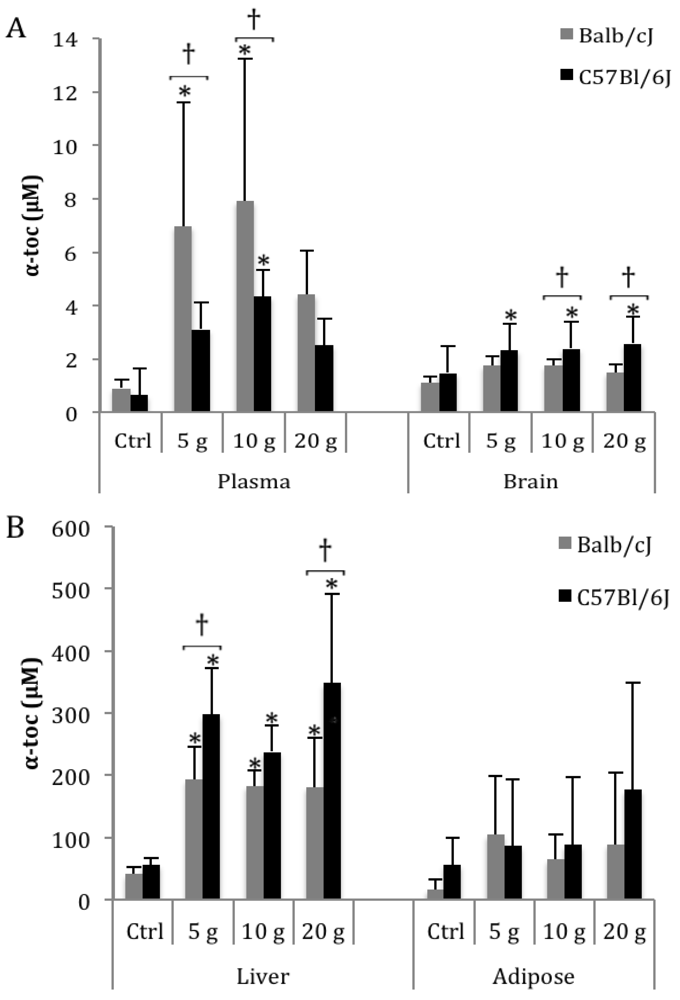
3.1. α-Toc

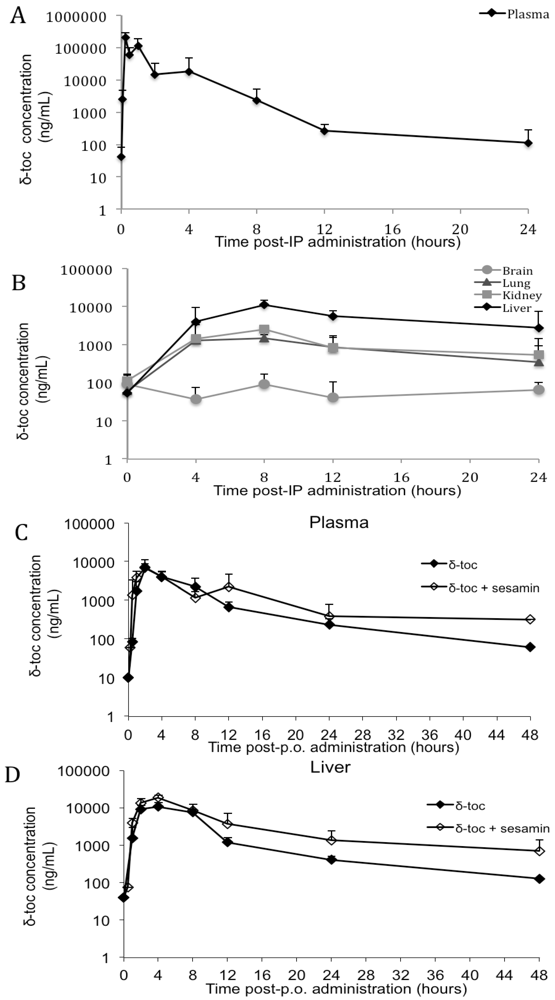
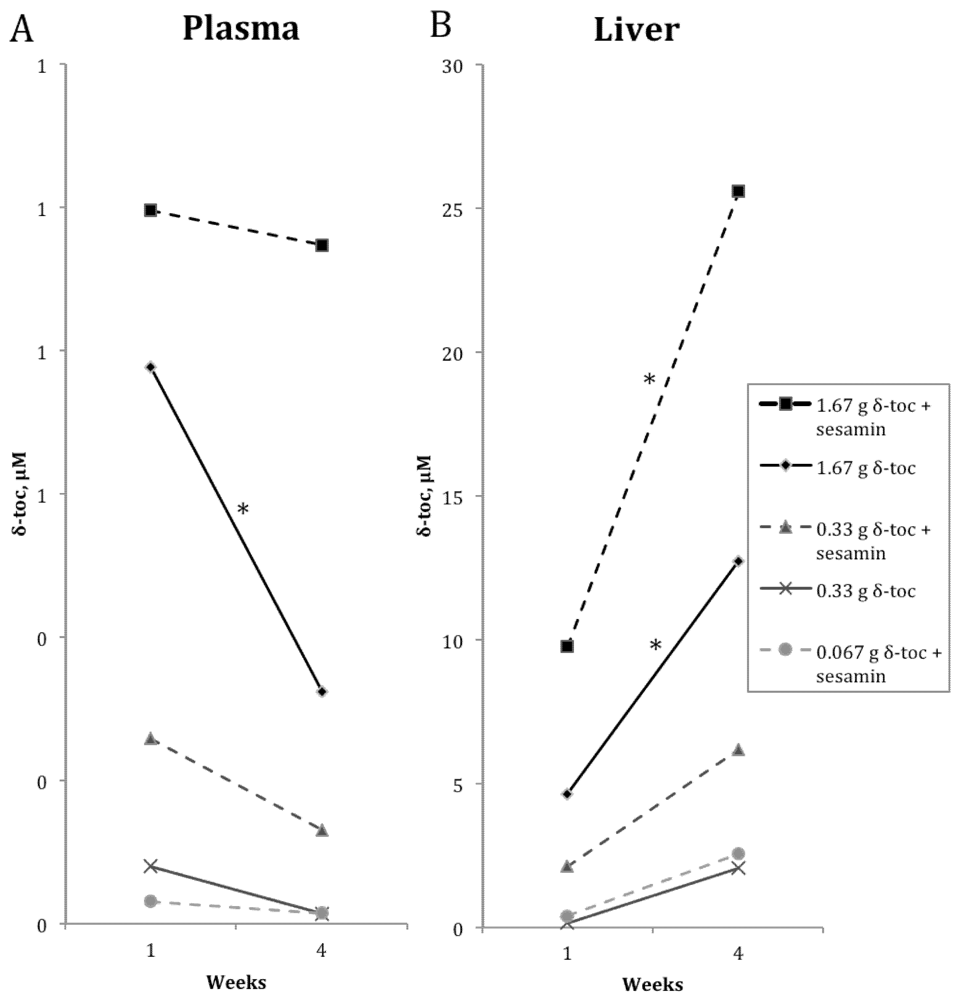
3.2. δ-Toc

| Diet (g/kg diet) | 1 week | ||
|---|---|---|---|
| Plasma 2 | Brain | Liver | |
| Control | <LLOQ | 0.030 (0.017) a | <LLOQ |
| 0.33 δ-toc | 0.080 (0.053) a | 0.036 (0.023) a | 0.150 (0.114) a |
| 1.67 δ-toc | 0.777 (0.300) b | 0.053 (0.013) a | 4.618 (2.163) b |
| 0.067 δ-toc + 2 sesamin | 0.032 (0.019) a | 0.032 (0.016) a | 0.394 (0.736) a |
| 0.33 δ-toc + 2 sesamin | 0.258 (0.150) a | 0.039 (0.023) a | 2.130 (1.443) a,b |
| 1.67 δ-toc + 2 sesamin | 0.995 (0.388) b | 0.135 (0.055) b | 9.753 (2.627) c |
| Diet (g/kg diet) | 4 weeks | ||
|---|---|---|---|
| Plasma 2 | Brain | Liver | |
| Control | <LLOQ | <LLOQ | 1.330 (1.078) a |
| 0.33 δ-toc | 0.0132 (0.006) a | <LLOQ | 2.064 (0.254) a |
| 1.67 δ-toc | 0.324 (0.232) a | <LLOQ | 12.71 (6.571) a |
| 0.067 δ-toc + 2 sesamin | 0.015 (0.009) a | <LLOQ | 2.547 (1.022) a |
| 0.33 δ-toc + 2 sesamin | 0.130 (0.116) a | <LLOQ | 6.189 (5.114) a |
| 1.67 δ-toc + 2 sesamin | 0.947 (0.411) b | 0.259 (0.039) | 25.60 (12.40) b |

4. Discussion
4.1. α-Toc
4.2. δ-Toc
4.3. Toc Levels and Strain-Specific Variation
5. Conclusions
Supplementary Files
Acknowledgments
Conflict of Interest
References
- Aggarwal, B.B.; Sundaram, C.; Prasad, S.; Kannappan, R. Tocotrienols, the vitamin E of the 21st century: Its potential against cancer and other chronic diseases. Biochem. Pharmacol. 2010, 80, 1613–1631. [Google Scholar] [CrossRef]
- Cooney, R.V.; Franke, A.A.; Wilkens, L.R.; Gill, J.; Kolonel, L.N. Elevated plasma gamma-tocopherol and decreased alpha-tocopherol in men are associated with inflammatory markers and decreased plasma 25-OH vitamin D. Nutr. Cancer 2008, 60 Suppl. 1, 21–29. [Google Scholar] [CrossRef]
- Chiu, Y.-W.; Chuang, H.-Y.; Huang, M.-C.; Wu, M.-T.; Liu, H.-W.; Huang, C.-T. Comparison of plasma antioxidant levels and related metabolic parameters between smokers and non-smokers. Kaohsiung J. Med. Sci. 2009, 25, 423–430. [Google Scholar] [CrossRef]
- Facchini, F.S.; Humphreys, M.H.; DoNascimento, C.A.; Abbasi, F.; Reaven, G.M. Relation between insulin resistance and plasma concentrations of lipid hydroperoxides, carotenoids, and tocopherols. Am. J. Clin. Nutr. 2000, 72, 776–779. [Google Scholar]
- Huang, H.-Y.; Appel, L.J. Supplementation of diets with alpha-tocopherol reduces serum concentrations of gamma- and delta-tocopherol in humans. J. Nutr. 2003, 133, 3137–3140. [Google Scholar]
- Jordan, J.M.; de Roos, A.J.; Renner, J.B.; Luta, G.; Cohen, A.; Craft, N.; Helmick, C.G.; Hochberg, M.C.; Arab, L. A case-control study of serum tocopherol levels and the alpha- to gamma-tocopherol ratio in radiographic knee osteoarthritis: The Johnston County Osteoarthritis Project. Am. J. Epidemiol. 2004, 159, 968–977. [Google Scholar] [CrossRef]
- Lecompte, S.; Szabo de Edelenyi, F.; Goumidi, L.; Maiani, G.; Moschonis, G.; Widhalm, K.; Molnár, D.; Kafatos, A.; Spinneker, A.; Breidenassel, C.; et al. Polymorphisms in the CD36/FAT gene are associated with plasma vitamin E concentrations in humans. Am. J. Clin. Nutr. 2011, 93, 644–651. [Google Scholar] [CrossRef]
- Mangialasche, F.; Kivipelto, M.; Mecocci, P.; Rizzuto, D.; Palmer, K.; Winblad, B.; Fratiglioni, L. High plasma levels of vitamin E forms and reduced alzheimer’s disease risk in advanced age. J. Alzheimers Dis. 2010, 20, 1029–1037. [Google Scholar]
- Talegawkar, S.A.; Johnson, E.J.; Carithers, T.; Taylor, H.A.; Bogle, M.L.; Tucker, K.L. Total alpha-tocopherol intakes are associated with serum alpha-tocopherol concentrations in African American adults. J. Nutr. 2007, 137, 2297–2303. [Google Scholar]
- Evans, H.M.; Bishop, K.S. On the existence of a hitherto unrecognized dietary factor essential for reproduction. Science 1922, 56, 650–651. [Google Scholar]
- Chardon, L.; Sassolas, A.; Dingeon, B.; Michel-Calemard, L.; Bovier-Lapierre, M.; Moulin, P.; Lachaux, A. Identification of two novel mutations and long-term follow-up in abetalipoproteinemia: A report of four cases. Eur. J. Pediatr. 2009, 168, 983–989. [Google Scholar] [CrossRef]
- Di Donato, I.; Bianchi, S.; Federico, A. Ataxia with vitamin E deficiency: Update of molecular diagnosis. Neurol. Sci. 2010, 31, 511–515. [Google Scholar]
- Granot, E.; Kohen, R. Oxidative stress in abetalipoproteinemia patients receiving long-term vitamin E and vitamin A supplementation. Am. J. Clin. Nutr. 2004, 79, 226–230. [Google Scholar]
- Zamel, R.; Khan, R.; Pollex, R.L.; Hegele, R.A. Abetalipoproteinemia: Two case reports and literature review. Orphanet J. Rare Dis. 2008, 3. [Google Scholar]
- Brigelius-Flohé, R. Vitamin E: The shrew waiting to be tamed. Free Radic. Biol. Med. 2009, 46, 543–554. [Google Scholar] [CrossRef]
- Brigelius-Flohe, R.; Kelly, F.J.; Salonen, J.T.; Neuzil, J.; Zingg, J.M.; Azzi, A. The European perspective on vitamin E: Current knowledge and future research. Am. J. Clin. Nutr. 2002, 76, 703–716. [Google Scholar]
- Ingold, K.U.; Bowry, V.W.; Stocker, R.; Walling, C. Autoxidation of lipids and antioxidation by alpha-tocopherol and ubiquinol in homogeneous solution and in aqueous dispersions of lipids: Unrecognized consequences of lipid particle size as exemplified by oxidation of human low density lipoprotein. Proc. Natl. Acad. Sci. USA 1993, 90, 45–49. [Google Scholar] [CrossRef]
- Niki, E. Lipid antioxidants: How they may act in biological systems. Br. J. Cancer Suppl. 1987, 8, 153–157. [Google Scholar]
- Smith, D.; O’Leary, V.J.; Darley-Usmar, V.M. The role of alpha-tocopherol as a peroxyl radical scavenger in human low density lipoprotein. Biochem. Pharmacol. 1993, 45, 2195–2201. [Google Scholar] [CrossRef]
- Zingg, J.-M.; Azzi, A. Non-antioxidant activities of vitamin E. Curr. Med. Chem. 2004, 11, 1113–1133. [Google Scholar]
- Bartusik, D.; Tomanek, B.; Siluk, D.; Kaliszan, R.; Fallone, G. The application of 19F magnetic resonance ex vivo imaging of three-dimensional cultured breast cancer cells to study the effect of delta-tocopherol. Anal. Biochem. 2009, 387, 315–317. [Google Scholar]
- Constantinou, C.; Hyatt, J.A.; Vraka, P.S.; Papas, A.; Papas, K.A.; Neophytou, C.; Hadjivassiliou, V.; Constantinou, A.I. Induction of caspase-independent programmed cell death by vitamin E natural homologs and synthetic derivatives. Nutr. Cancer 2009, 61, 864–874. [Google Scholar] [CrossRef]
- Cornwell, D.G.; Jones, K.H.; Jiang, Z.; Lantry, L.E.; Southwell-Keely, P.; Kohar, I.; Thornton, D.E. Cytotoxicity of tocopherols and their quinones in drug-sensitive and multidrug-resistant leukemia cells. Lipids 1998, 33, 295–301. [Google Scholar] [CrossRef]
- Jiang, Q.; Wong, J.; Fyrst, H.; Saba, J.D.; Ames, B.N. gamma-Tocopherol or combinations of vitamin E forms induce cell death in human prostate cancer cells by interrupting sphingolipid synthesis. Proc. Natl. Acad. Sci. USA 2004, 101, 17825–17830. [Google Scholar]
- Kempná, P.; Reiter, E.; Arock, M.; Azzi, A.; Zingg, J.-M. Inhibition of HMC-1 mast cell proliferation by vitamin E: Involvement of the protein kinase B pathway. J. Biol. Chem. 2004, 279, 50700–50709. [Google Scholar]
- McIntyre, B.S.; Briski, K.P.; Gapor, A.; Sylvester, P.W. Antiproliferative and apoptotic effects of tocopherols and tocotrienols on preneoplastic and neoplastic mouse mammary epithelial cells. Proc. Soc. Exp. Biol. Med. 2000, 224, 292–301. [Google Scholar] [CrossRef]
- McIntyre, B.S.; Briski, K.P.; Tirmenstein, M.A.; Fariss, M.W.; Gapor, A.; Sylvester, P.W. Antiproliferative and apoptotic effects of tocopherols and tocotrienols on normal mouse mammary epithelial cells. Lipids 2000, 35, 171–180. [Google Scholar] [CrossRef]
- Reiter, E.; Azzi, A.; Zingg, J.-M. Enhanced anti-proliferative effects of combinatorial treatment of delta-tocopherol and resveratrol in human HMC-1 cells. Biofactors 2007, 30, 67–77. [Google Scholar] [CrossRef]
- Sacha, B.; Zierler, S.; Lehnardt, S.; Weber, J.R.; Kerschbaum, H.H. Heterogeneous effects of distinct tocopherol analogues on NO release, cell volume, and cell death in microglial cells. J. Neurosci. Res. 2008, 86, 3526–3535. [Google Scholar] [CrossRef]
- Yu, W.; Simmons-Menchaca, M.; Gapor, A.; Sanders, B.G.; Kline, K. Induction of apoptosis in human breast cancer cells by tocopherols and tocotrienols. Nutr. Cancer 1999, 33, 26–32. [Google Scholar] [CrossRef]
- Bartusik, D.; Tomanek, B.; Siluk, D.; Kaliszan, R. 19F MRI of 3D CEM cells to study the effects of tocopherols and tocotrienols. J. Pharm. Biomed. Anal. 2010, 53, 599–602. [Google Scholar] [CrossRef]
- Ravaglia, G.; Forti, P.; Lucicesare, A.; Pisacane, N.; Rietti, E.; Mangialasche, F.; Cecchetti, R.; Patterson, C.; Mecocci, P. Plasma tocopherols and risk of cognitive impairment in an elderly Italian cohort. Am. J. Clin. Nutr. 2008, 87, 1306–1313. [Google Scholar]
- Graf, M.; Ecker, D.; Horowski, R.; Kramer, B.; Riederer, P.; Gerlach, M.; Hager, C.; Ludolph, A.C.; Becker, G.; Osterhage, J.; et al. High dose vitamin E therapy in amyotrophic lateral sclerosis as add-on therapy to riluzole: Results of a placebo-controlled double-blind study. J. Neural Transm. 2005, 112, 649–660. [Google Scholar] [CrossRef]
- Zandi, P.P.; Anthony, J.C.; Khachaturian, A.S.; Stone, S.V.; Gustafson, D.; Tschanz, J.T.; Norton, M.C.; Welsh-Bohmer, K.A.; Breitner, J.C. Reduced risk of Alzheimer disease in users of antioxidant vitamin supplements: The Cache County Study. Arch. Neurol. 2004, 61, 82–88. [Google Scholar] [CrossRef]
- Ju, J.; Picinich, S.C.; Yang, Z.; Zhao, Y.; Suh, N.; Kong, A.-N.; Yang, C.S. Cancer-preventive activities of tocopherols and tocotrienols. Carcinogenesis 2010, 31, 533–542. [Google Scholar]
- Vatassery, G.T.; Fahn, S.; Kuskowski, M.A. Alpha tocopherol in CSF of subjects taking high-dose vitamin E in the DATATOP study. Parkinson Study Group. Neurology 1998, 50, 1900–1902. [Google Scholar] [CrossRef]
- Chan, A.S.; Cheung, M.C.; Law, S.C.; Chan, J.H. Phase II study of alpha-tocopherol in improving the cognitive function of patients with temporal lobe radionecrosis. Cancer 2004, 100, 398–404. [Google Scholar] [CrossRef]
- Masaki, K.H.; Losonczy, K.G.; Izmirlian, G.; Foley, D.J.; Ross, G.W.; Petrovitch, H.; Havlik, R.; White, L.R. Association of vitamin E and C supplement use with cognitive function and dementia in elderly men. Neurology 2000, 54, 1265–1272. [Google Scholar] [CrossRef]
- Morris, M.C.; Evans, D.A.; Tangney, C.C.; Bienias, J.L.; Wilson, R.S.; Aggarwal, N.T.; Scherr, P.A. Relation of the tocopherol forms to incident Alzheimer disease and to cognitive change. Am. J. Clin. Nutr. 2005, 81, 508–514. [Google Scholar]
- Winklhofer-Roob, B.M.; Rock, E.; Ribalta, J.; Shmerling, D.H.; Roob, J.M. Effects of vitamin E and carotenoid status on oxidative stress in health and disease. Evidence obtained from human intervention studies. Mol. Aspects Med. 2003, 24, 391–402. [Google Scholar] [CrossRef]
- ClinicalTrials.gov. Available online: http://clinicaltrials.gov (accessed on 27 January 2012).
- Ikeda, S.; Toyoshima, K.; Yamashita, K. Dietary sesame seeds elevate alpha- and gamma-tocotrienol concentrations in skin and adipose tissue of rats fed the tocotrienol-rich fraction extracted from palm oil. J. Nutr. 2001, 131, 2892–2897. [Google Scholar]
- Rogi, T.; Tomimori, N.; Ono, Y.; Kiso, Y. The mechanism underlying the synergetic hypocholesterolemic effect of sesamin and α-tocopherol in rats fed a high-cholesterol diet. J. Pharmacol. Sci. 2011, 115, 408–416. [Google Scholar] [CrossRef]
- Yamashita, K.; Iizuka, Y.; Imai, T.; Namiki, M. Sesame seed and its lignans produce marked enhancement of vitamin E activity in rats fed a low alpha-tocopherol diet. Lipids 1995, 30, 1019–1028. [Google Scholar] [CrossRef]
- Yamashita, K.; Nohara, Y.; Katayama, K.; Namiki, M. Sesame seed lignans and gamma-tocopherol act synergistically to produce vitamin E activity in rats. J. Nutr. 1992, 122, 2440–2446. [Google Scholar]
- Cooney, R.V.; Custer, L.J.; Okinaka, L.; Franke, A.A. Effects of dietary sesame seeds on plasma tocopherol levels. Nutr. Cancer 2001, 39, 66–71. [Google Scholar] [CrossRef]
- Wu, W.-H.; Kang, Y.-P.; Wang, N.-H.; Jou, H.-J.; Wang, T.-A. Sesame ingestion affects sex hormones, antioxidant status, and blood lipids in postmenopausal women. J. Nutr. 2006, 136, 1270–1275. [Google Scholar]
- Reeves, P.G.; Nielsen, F.H.; Fahey, G.C., Jr. AIN-93 purified diets for laboratory rodents: Final report of the American Institute of Nutrition ad hoc writing committee on the reformulation of the AIN-76A rodent diet. J. Nutr. 1993, 123, 1939–1951. [Google Scholar]
- Radcliffe, J.; Czajka-Narins, D. Lipids and tocopherols in serum and liver of female rats fed diets containing corn oil or cottonseed oil. Plant Foods Hum. Nutr. 2006, 61, 35–38. [Google Scholar]
- Beal, S.L. Ways to fit a PK model with some data below the quantification limit. J. Pharmacokinet. Pharmacodyn. 2001, 28, 481–504. [Google Scholar] [CrossRef]
- Lemcke-Norojärvi, M.; Kamal-Eldin, A.; Appelqvist, L.A.; Dimberg, L.H.; Ohrvall, M.; Vessby, B. Corn and sesame oils increase serum gamma-tocopherol concentrations in healthy Swedish women. J. Nutr. 2001, 131, 1195–1201. [Google Scholar]
- Ikeda, S.; Tohyama, T.; Yamashita, K. Dietary sesame seed and its lignans inhibit 2,7,8-trimethyl-2(2′-carboxyethyl)-6-hydroxychroman excretion into urine of rats fed γ-tocopherol. J. Nutr. 2002, 132, 961–966. [Google Scholar]
- Booth, S.L.; Golly, I.; Sacheck, J.M.; Roubenoff, R.; Dallal, G.E.; Hamada, K.; Blumberg, J.B. Effect of vitamin E supplementation on vitamin K status in adults with normal coagulation status. Am. J. Clin. Nutr. 2004, 80, 143–148. [Google Scholar]
- Li, G.-X.; Lee, M.-J.; Liu, A.B.; Yang, Z.; Lin, Y.; Shih, W.J.; Yang, C.S. Delta-tocopherol is more active than alpha- or gamma-tocopherol in inhibiting lung tumorigenesis in vivo. Cancer Prev. Res. 2011, 4, 404–413. [Google Scholar] [CrossRef]
- Navarro, A.; Gómez, C.; Sánchez-Pino, M.-J.; González, H.; Bández, M.J.; Boveris, A.D.; Boveris, A. Vitamin E at high doses improves survival, neurological performance, and brain mitochondrial function in aging male mic. Am. J. Physiol. Regul. Integr. Comp. Physiol. 2005, 289, R1392–R1399. [Google Scholar] [CrossRef]
- Robinson, C.; Woo, S.; Walsh, A.; Nowak, A.K.; Lake, R.A. The antioxidants vitamins A and E and selenium do not reduce the incidence of asbestos-induced disease in a mouse model of mesothelioma. Nutr. Cancer 2012, 64, 315–322. [Google Scholar] [CrossRef]
- Shichiri, M.; Yoshida, Y.; Ishida, N.; Hagihara, Y.; Iwahashi, H.; Tamai, H.; Niki, E. Alpha-tocopherol suppresses lipid peroxidation and behavioral and cognitive impairments in the Ts65Dn mouse model of Down syndrome. Free Radic. Biol. Med. 2011, 50, 1801–1811. [Google Scholar] [CrossRef]
- Iuliano, L.; Micheletta, F.; Natoli, S.; Ginanni Corradini, S.; Iappelli, M.; Elisei, W.; Giovannelli, L.; Violi, F.; Diczfalusy, U. Measurement of oxysterols and alpha-tocopherol in plasma and tissue samples as indices of oxidant stress status. Anal. Biochem. 2003, 312, 217–223. [Google Scholar]
- Bjorneboe, A.; Bjorneboe, G.E.; Bodd, E.; Hagen, B.F.; Kveseth, N.; Drevon, C.A. Transport and distribution of alpha-tocopherol in lymph, serum and liver cells in rats. Biochim. Biophys. Acta 1986, 889, 310–315. [Google Scholar] [CrossRef]
- Podda, M.; Weber, C.; Traber, M.G.; Packer, L. Simultaneous determination of tissue tocopherols, tocotrienols, ubiquinols, and ubiquinones. J. Lipid Res. 1996, 37, 893–901. [Google Scholar]
- Traber, M.G.; Kayden, H.J.; Green, J.B.; Green, M.H. Absorption of water-miscible forms of vitamin E in a patient with cholestasis and in thoracic duct-cannulated rats. Am. J. Clin. Nutr. 1986, 44, 914–923. [Google Scholar]
- Mustacich, D.J.; Leonard, S.W.; Devereaux, M.W.; Sokol, R.J.; Traber, M.G. Alpha-tocopherol regulation of hepatic cytochrome P450s and ABC transporters in rats. Free Radic. Biol. Med. 2006, 41, 1069–1078. [Google Scholar] [CrossRef]
- Kluth, D.; Landes, N.; Pfluger, P.; Muller-Schmehl, K.; Weiss, K.; Bumke-Vogt, C.; Ristow, M.; Brigelius-Flohe, R. Modulation of Cyp3a11 mRNA expression by alpha-tocopherol but not gamma-tocotrienol in mice. Free Radic. Biol. Med. 2005, 38, 507–514. [Google Scholar]
- Muller, D.P.; Lloyd, J.K.; Wolff, O.H. The role of vitamin E in the treatment of the neurological features of abetalipoproteinaemia and other disorders of fat absorption. J. Inherit. Metab. Dis. 1985, 8 Suppl. 1, 88–92. [Google Scholar] [CrossRef]
- Peretti, N.; Sassolas, A.; Roy, C.C.; Deslandres, C.; Charcosset, M.; Castagnetti, J.; Pugnet-Chardon, L.; Moulin, P.; Labarge, S.; Bouthillier, L.; et al. Guidelines for the diagnosis and management of chylomicron retention disease based on a review of the literature and the experience of two centers. Orphanet J. Rare Dis. 2010, 5. [Google Scholar]
- Abdo, K.M.; Rao, G.; Montgomery, C.A.; Dinowitz, M.; Kanagalingam, K. Thirteen-week toxicity study of d-alpha-tocopheryl acetate (vitamin E) in Fischer 344 rats. Food Chem. Toxicol. 1986, 24, 1043–1050. [Google Scholar] [CrossRef]
- March, B.E.; Wong, E.; Seier, L.; Sim, J.; Biely, J. Hypervitaminosis E in the chick. J. Nutr. 1973, 103, 371–377. [Google Scholar]
- Engelhart, M.J.; Geerlings, M.I.; Ruitenberg, A.; van Swieten, J.C.; Hofman, A.; Witteman, J.C.M.; Breteler, M.M.B. Dietary intake of antioxidants and risk of Alzheimer disease. J. Am. Med. Assoc. 2002, 287, 3223–3229. [Google Scholar]
- Grodstein, F.; Chen, J.; Willett, W.C. High-dose antioxidant supplements and cognitive function in community-dwelling elderly women. Am. J. Clin. Nutr. 2003, 77, 975–984. [Google Scholar]
- Helmer, C.; Peuchant, E.; Letenneur, L.; Bourdel-Marchasson, I.; Larrieu, S.; Dartigues, J.F.; Dubourg, L.; Thomas, M.-J.; Barberger-Gateau, P. Association between antioxidant nutritional indicators and the incidence of dementia: Results from the PAQUID prospective cohort study. Eur. J. Clin. Nutr. 2003, 57, 1555–1561. [Google Scholar] [CrossRef]
- Lockrow, J.; Prakasam, A.; Huang, P.; Bimonte-Nelson, H.; Sambamurti, K.; Granholm, A.-C. Cholinergic degeneration and memory loss delayed by vitamin E in a Down syndrome mouse model. Exp. Neurol. 2009, 216, 278–289. [Google Scholar] [CrossRef]
- Miyake, Y.; Fukushima, W.; Tanaka, K.; Sasaki, S.; Kiyohara, C.; Tsuboi, Y.; Yamada, T.; Oeda, T.; Miki, T.; Kawamura, N.; et al. Dietary intake of antioxidant vitamins and risk of Parkinson’s disease: A case-control study in Japan. Eur. J. Neurol. 2011, 18, 106–113. [Google Scholar]
- Sano, M.; Ernesto, C.; Thomas, R.G.; Klauber, M.R.; Schafer, K.; Grundman, M.; Woodbury, P.; Growdon, J.; Cotman, C.W.; Pfeiffer, E.; et al. A controlled trial of selegiline, alpha-tocopherol, or both as treatment for Alzheimer’s disease. The Alzheimer’s Disease Cooperative Study. N. Engl. J. Med. 1997, 336, 1216–1222. [Google Scholar] [CrossRef]
- Group, T.P.S. Effects of tocopherol and deprenyl on the progression of disability in early Parkinson’s disease. N. Engl. J. Med. 1993, 328, 176–183. [Google Scholar] [CrossRef]
- Isaac, M.G.E.K.N.; Quinn, R.; Tabet, N. Vitamin E for Alzheimer’s disease and mild cognitive impairment. Cochrane Database Syst. Rev. 2008. [Google Scholar]
- Lott, I.T.; Doran, E.; Nguyen, V.Q.; Tournay, A.; Head, E.; Gillen, D.L. Down syndrome and dementia: A randomized, controlled trial of antioxidant supplementation. Am. J. Med. Genet. A 2011, 155, 1939–1948. [Google Scholar] [CrossRef]
- Petersen, R.C.; Thomas, R.G.; Grundman, M.; Bennett, D.; Doody, R.; Ferris, S.; Galasko, D.; Jin, S.; Kaye, J.; Levey, A.; et al. Vitamin E and donepezil for the treatment of mild cognitive impairment. N. Engl. J. Med. 2005, 352, 2379–2388. [Google Scholar] [CrossRef]
- Miller, E.R.; Pastor-Barriuso, R.; Dalal, D.; Riemersma, R.A.; Appel, L.J.; Guallar, E. Meta-analysis: High-dosage vitamin E supplementation may increase all-cause mortality. Ann. Int. Med. 2005, 142, 37–46. [Google Scholar]
- Sesso, H.D.; Buring, J.E.; Christen, W.G.; Kurth, T.; Belanger, C.; MacFadyen, J.; Bubes, V.; Manson, J.E.; Glynn, R.J.; Gaziano, J.M. Vitamins E and C in the prevention of cardiovascular disease in men: The Physicians’ Health Study II randomized controlled trial. J. Am. Med. Assoc. 2008, 300, 2123–2133. [Google Scholar]
- Schürks, M.; Glynn, R.J.; Rist, P.M.; Tzourio, C.; Kurth, T. Effects of vitamin E on stroke subtypes: Meta-analysis of randomised controlled trials. BMJ 2010, 341. [Google Scholar]
- Ikeda, S.; Kagaya, M.; Kobayashi, K.; Tohyama, T.; Kiso, Y.; Higuchi, N.; Yamashita, K. Dietary sesame lignans decrease lipid peroxidation in rats fed docosahexaenoic acid. J. Nutr. Sci. Vitaminol. 2003, 49, 270–276. [Google Scholar] [CrossRef]
- Harikumar, K.B.; Sung, B.; Tharakan, S.T.; Pandey, M.K.; Joy, B.; Guha, S.; Krishnan, S.; Aggarwal, B.B. Sesamin manifests chemopreventive effects through the suppression of NF-kappa B-regulated cell survival, proliferation, invasion, and angiogenic gene products. Mol. Cancer Res. 2010, 8, 751–761. [Google Scholar] [CrossRef]
- Hirose, N.; Doi, F.; Ueki, T.; Akazawa, K.; Chijiiwa, K.; Sugano, M.; Akimoto, K.; Shimizu, S.; Yamada, H. Suppressive effect of sesamin against 7,12-dimethylbenz[a]-anthracene induced rat mammary carcinogenesis. Anticancer Res. 1992, 12, 1259–1265. [Google Scholar]
- Yokota, T.; Matsuzaki, Y.; Koyama, M.; Hitomi, T.; Kawanaka, M.; Enoki-Konishi, M.; Okuyama, Y.; Takayasu, J.; Nishino, H.; Nishikawa, A.; et al. Sesamin, a lignan of sesame, down-regulates cyclin D1 protein expression in human tumor cells. Cancer Sci. 2007, 98, 1447–1453. [Google Scholar] [CrossRef]
- Kita, S.; Matsumura, Y.; Morimoto, S.; Akimoto, K.; Furuya, M.; Oka, N.; Tanaka, T. Antihypertensive effect of sesamin. II. Protection against two-kidney, one-clip renal hypertension and cardiovascular hypertrophy. Biol. Pharm. Bull. 1995, 18, 1283–1285. [Google Scholar] [CrossRef]
- Matsumura, Y.; Kita, S.; Morimoto, S.; Akimoto, K.; Furuya, M.; Oka, N.; Tanaka, T. Antihypertensive effect of sesamin. I. Protection against deoxycorticosterone acetate-salt-induced hypertension and cardiovascular hypertrophy. Biol. Pharm. Bull. 1995, 18, 1016–1019. [Google Scholar] [CrossRef]
- Matsumura, Y.; Kita, S.; Tanida, Y.; Taguchi, Y.; Morimoto, S.; Akimoto, K.; Tanaka, T. Antihypertensive effect of sesamin. III. Protection against development and maintenance of hypertension in stroke-prone spontaneously hypertensive rats. Biol. Pharm. Bull. 1998, 21, 469–473. [Google Scholar] [CrossRef]
- Miyawaki, T.; Aono, H.; Toyoda-Ono, Y.; Maeda, H.; Kiso, Y.; Moriyama, K. Antihypertensive effects of sesamin in humans. J. Nutr. Sci. Vitaminol. 2009, 55, 87–91. [Google Scholar] [CrossRef]
- Nakano, D.; Itoh, C.; Ishii, F.; Kawanishi, H.; Takaoka, M.; Kiso, Y.; Tsuruoka, N.; Tanaka, T.; Matsumura, Y. Effects of sesamin on aortic oxidative stress and endothelial dysfunction in deoxycorticosterone acetate-salt hypertensive rats. Biol. Pharm. Bull. 2003, 26, 1701–1705. [Google Scholar] [CrossRef]
- Nakano, D.; Itoh, C.; Takaoka, M.; Kiso, Y.; Tanaka, T.; Matsumura, Y. Antihypertensive effect of sesamin. IV. Inhibition of vascular superoxide production by sesamin. Biol. Pharm. Bull. 2002, 25, 1247–1249. [Google Scholar] [CrossRef]
- Peterson, J.; Dwyer, J.; Adlercreutz, H.; Scalbert, A.; Jacques, P.; McCullough, M.L. Dietary lignans: Physiology and potential for cardiovascular disease risk reduction. Nutr. Rev. 2010, 68, 571–603. [Google Scholar] [CrossRef]
- Ashakumary, L.; Rouyer, I.; Takahashi, Y.; Ide, T.; Fukuda, N.; Aoyama, T.; Hashimoto, T.; Mizugaki, M.; Sugano, M. Sesamin, a sesame lignan, is a potent inducer of hepatic fatty acid oxidation in the rat. Metabolism 1999, 48, 1303–1313. [Google Scholar] [CrossRef]
- Hirata, F.; Fujita, K.; Ishikura, Y.; Hosoda, K.; Ishikawa, T.; Nakamura, H. Hypocholesterolemic effect of sesame lignan in humans. Atherosclerosis 1996, 122, 135–136. [Google Scholar] [CrossRef]
- Hirose, N.; Inoue, T.; Nishihara, K.; Sugano, M.; Akimoto, K.; Shimizu, S.; Yamada, H. Inhibition of cholesterol absorption and synthesis in rats by sesamin. J. Lipid Res. 1991, 32, 629–638. [Google Scholar]
- Kamal-Eldin, A.; Moazzami, A.; Washi, S. Sesame seed lignans: Potent physiological modulators and possible ingredients in functional foods & nutraceuticals. Recent Pat. Food Nutr. Agric. 2011, 3, 17–29. [Google Scholar]
- Nakabayashi, A.; Kitagawa, Y.; Suwa, Y.; Akimoto, K.; Asami, S.; Shimizu, S.; Hirose, N.; Sugano, M.; Yamada, H. Alpha-tocopherol enhances the hypocholesterolemic action of sesamin in rats. Int. J. Vitam. Nutr. Res. 1995, 65, 162–168. [Google Scholar]
- Sontag, T.J.; Parker, R.S. Cytochrome P450 omega-hydroxylase pathway of tocopherol catabolism. Novel mechanism of regulation of vitamin E status. J. Biol. Chem. 2002, 277, 25290–25296. [Google Scholar]
- You, C.-S.; Sontag, T.J.; Swanson, J.E.; Parker, R.S. Long-chain carboxychromanols are the major metabolites of tocopherols and tocotrienols in A549 lung epithelial cells but not HepG2 cells. J. Nutr. 2005, 135, 227–232. [Google Scholar]
- Smolarek, A.K.; Suh, N. Chemopreventive activity of vitamin E in breast cancer: A focus on γ- and δ-Tocopherol. Nutrients 2011, 3, 962–986. [Google Scholar] [CrossRef]
- Abe, C.; Uchida, T.; Ohta, M.; Ichikawa, T.; Yamashita, K.; Ikeda, S. Cytochrome P450-dependent metabolism of vitamin E isoforms is a critical determinant of their tissue concentrations in rats. Lipids 2007, 42, 637–645. [Google Scholar] [CrossRef]
- Birringer, M.; Pfluger, P.; Kluth, D.; Landes, N.; Brigelius-Flohe, R. Identities and differences in the metabolism of tocotrienols and tocopherols in HepG2 cells. J. Nutr. 2002, 132, 3113–3118. [Google Scholar]
- Traber, M.G.; Kayden, H.J. Preferential incorporation of alpha-tocopherol vs gamma-tocopherol in human lipoproteins. Am. J. Clin. Nutr. 1989, 49, 517–526. [Google Scholar]
- Traber, M.G.; Burton, G.W.; Hughes, L.; Ingold, K.U.; Hidaka, H.; Malloy, M.; Kane, J.; Hyams, J.; Kayden, H.J. Discrimination between forms of vitamin E by humans with and without genetic abnormalities of lipoprotein metabolism. J. Lipid Res. 1992, 33, 1171–1182. [Google Scholar]
- Parker, R.S.; McCormick, C.C. Selective accumulation of alpha-tocopherol in Drosophila is associated with cytochrome P450 tocopherol-omega-hydroxylase activity but not alpha-tocopherol transfer protein. Biochem. Biophys. Res. Commun. 2005, 338, 1537–1541. [Google Scholar] [CrossRef]
- Hayes, K.C.; Pronczuk, A.; Liang, J.S. Differences in the plasma transport and tissue concentrations of tocopherols and tocotrienols: Observations in humans and hamsters. Proc. Soc. Exp. Biol. Med. 1993, 202, 353–359. [Google Scholar]
- Ju, J.; Hao, X.; Lee, M.-J.; Lambert, J.D.; Lu, G.; Xiao, H.; Newmark, H.L.; Yang, C.S. A gamma-tocopherol-rich mixture of tocopherols inhibits colon inflammation and carcinogenesis in azoxymethane and dextran sulfate sodium-treated mice. Cancer Prev. Res. 2009, 2, 143–152. [Google Scholar] [CrossRef]
- Kelly, F.J.; Sutton, G.L. Plasma and red blood cell vitamin E status of patients on total parenteral nutrition. JPEN J. Parenter. Enteral. Nutr. 1989, 13, 510–515. [Google Scholar]
- Lambert, J.D.; Lu, G.; Lee, M.-J.; Hu, J.; Ju, J.; Yang, C.S. Inhibition of lung cancer growth in mice by dietary mixed tocopherols. Mol. Nutr. Food Res. 2009, 53, 1030–1035. [Google Scholar] [CrossRef]
- Wiser, J.; Alexis, N.E.; Jiang, Q.; Wu, W.; Robinette, C.; Roubey, R.; Peden, D.B. In vivo gamma-tocopherol supplementation decreases systemic oxidative stress and cytokine responses of human monocytes in normal and asthmatic subjects. Free Radic. Biol. Med. 2008, 45, 40–49. [Google Scholar] [CrossRef]
- Yoshikawa, S.; Morinobu, T.; Hamamura, K.; Hirahara, F.; Iwamoto, T.; Tamai, H. The effect of gamma-tocopherol administration on alpha-tocopherol levels and metabolism in humans. Eur. J. Clin. Nutr. 2005, 59, 900–905. [Google Scholar] [CrossRef]
- Yu, W.; Jia, L.; Park, S.K.; Li, J.; Gopalan, A.; Simmons-Menchaca, M.; Sanders, B.G.; Kline, K. Anticancer actions of natural and synthetic vitamin E forms: RRR-alpha-tocopherol blocks the anticancer actions of gamma-tocopherol. Mol. Nutr. Food Res. 2009, 53, 1573–1581. [Google Scholar] [CrossRef]
- Wolf, G. How an increased intake of alpha-tocopherol can suppress the bioavailability of gamma-tocopherol. Nutr. Rev. 2006, 64, 295–299. [Google Scholar] [CrossRef]
- Traber, M.G.; Siddens, L.K.; Leonard, S.W.; Schock, B.; Gohil, K.; Krueger, S.K.; Cross, C.E.; Williams, D.E. Alpha-tocopherol modulates Cyp3a expression, increases gamma-CEHC production, and limits tissue gamma-tocopherol accumulation in mice fed high gamma-tocopherol diets. Free Radic. Biol. Med. 2005, 38, 773–785. [Google Scholar] [CrossRef]
- Handelman, G.J.; Epstein, W.L.; Peerson, J.; Spiegelman, D.; Machlin, L.J.; Dratz, E.A. Human adipose alpha-tocopherol and gamma-tocopherol kinetics during and after 1 y of alpha-tocopherol supplementation. Am. J. Clin. Nutr. 1994, 59, 1025–1032. [Google Scholar]
- Handelman, G.J.; Machlin, L.J.; Fitch, K.; Weiter, J.J.; Dratz, E.A. Oral alpha-tocopherol supplements decrease plasma gamma-tocopherol levels in humans. J. Nutr. 1985, 115, 807–813. [Google Scholar]
- Sattler, W.; Levak-Frank, S.; Radner, H.; Kostner, G.M.; Zechner, R. Muscle-specific overexpression of lipoprotein lipase in transgenic mice results in increased alpha-tocopherol levels in skeletal muscle. Biochem. J. 1996, 318, 15–19. [Google Scholar]
- Bardowell, S.A.; Stec, D.E.; Parker, R.S. Common variants of cytochrome P450 4F2 exhibit altered vitamin E-(omega)-hydroxylase specific activity. J. Nutr. 2010, 140, 1901–1906. [Google Scholar] [CrossRef]
- Borel, P.; Moussa, M.; Reboul, E.; Lyan, B.; Defoort, C.; Vincent-Baudry, S.; Maillot, M.; Gastaldi, M.; Darmon, M.; Portugal, H.; et al. Human fasting plasma concentrations of vitamin E and carotenoids, and their association with genetic variants in apo C-III, cholesteryl ester transfer protein, hepatic lipase, intestinal fatty acid binding protein and microsomal triacylglycerol transfer protein. Br. J. Nutr. 2009, 101, 680–687. [Google Scholar] [CrossRef]
- Borel, P.; Moussa, M.; Reboul, E.; Lyan, B.; Defoort, C.; Vincent-Baudry, S.; Maillot, M.; Gastaldi, M.; Darmon, M.; Portugal, H.; et al. Human plasma levels of vitamin E and carotenoids are associated with genetic polymorphisms in genes involved in lipid metabolism. J. Nutr. 2007, 137, 2653–2659. [Google Scholar]
- Ferrucci, L.; Perry, J.R.; Matteini, A.; Perola, M.; Tanaka, T.; Silander, K.; Rice, N.; Melzer, D.; Murray, A.; Cluett, C.; et al. Common variation in the beta-carotene 15,15′-monooxygenase 1 gene affects circulating levels of carotenoids: A genome-wide association study. Am. J. Hum. Genet. 2009, 84, 123–133. [Google Scholar] [CrossRef]
- Girona, J.; Guardiola, M.; Cabre, A.; Manzanares, J.M.; Heras, M.; Ribalta, J.; Masana, L. The apolipoprotein A5 gene—1131T→C polymorphism affects vitamin E plasma concentrations in type 2 diabetic patients. Clin. Chem. Lab. Med. 2008, 46, 453–457. [Google Scholar] [CrossRef]
- Gomez-Coronado, D.; Entrala, A.; Alvarez, J.J.; Ortega, H.; Olmos, J.M.; Castro, M.; Sastre, A.; Herrera, E.; Lasuncion, M.A. Influence of apolipoprotein E polymorphism on plasma vitamin A and vitamin E levels. Eur. J. Clin. Invest. 2002, 32, 251–258. [Google Scholar] [CrossRef]
- Wright, M.E.; Peters, U.; Gunter, M.J.; Moore, S.C.; Lawson, K.A.; Yeager, M.; Weinstein, S.J.; Snyder, K.; Virtamo, J.; Albanes, D. Association of variants in two vitamin E transport genes with circulating vitamin e concentrations and prostate cancer risk. Cancer Res. 2009, 69, 1429–1438. [Google Scholar]
- Huebbe, P.; Lodge, J.K.; Rimbach, G. Implications of apolipoprotein E genotype on inflammation and vitamin E status. Mol. Nutr. Food Res. 2010, 54, 623–630. [Google Scholar] [CrossRef]
© 2012 by the authors; licensee MDPI, Basel, Switzerland. This article is an open-access article distributed under the terms and conditions of the Creative Commons Attribution license (http://creativecommons.org/licenses/by/3.0/).
Share and Cite
Baxter, L.L.; Marugan, J.J.; Xiao, J.; Incao, A.; McKew, J.C.; Zheng, W.; Pavan, W.J. Plasma and Tissue Concentrations of α-Tocopherol and δ-Tocopherol Following High Dose Dietary Supplementation in Mice. Nutrients 2012, 4, 467-490. https://doi.org/10.3390/nu4060467
Baxter LL, Marugan JJ, Xiao J, Incao A, McKew JC, Zheng W, Pavan WJ. Plasma and Tissue Concentrations of α-Tocopherol and δ-Tocopherol Following High Dose Dietary Supplementation in Mice. Nutrients. 2012; 4(6):467-490. https://doi.org/10.3390/nu4060467
Chicago/Turabian StyleBaxter, Laura L., Juan J. Marugan, Jingbo Xiao, Art Incao, John C. McKew, Wei Zheng, and William J. Pavan. 2012. "Plasma and Tissue Concentrations of α-Tocopherol and δ-Tocopherol Following High Dose Dietary Supplementation in Mice" Nutrients 4, no. 6: 467-490. https://doi.org/10.3390/nu4060467
APA StyleBaxter, L. L., Marugan, J. J., Xiao, J., Incao, A., McKew, J. C., Zheng, W., & Pavan, W. J. (2012). Plasma and Tissue Concentrations of α-Tocopherol and δ-Tocopherol Following High Dose Dietary Supplementation in Mice. Nutrients, 4(6), 467-490. https://doi.org/10.3390/nu4060467