Vaccenic and Elaidic Acid Modify Plasma and Splenocyte Membrane Phospholipids and Mitogen-Stimulated Cytokine Production in Obese Insulin Resistant JCR: LA-cp Rats


Abstract
:1. Introduction
2. Results and Discussion
2.1. Body weight and Spleen Characteristics
2.2. Fatty Acid Composition of Plasma PL

| Lean Ctl | Obese Ctl | VA | EA | |
|---|---|---|---|---|
| % of fatty acids | ||||
| 12:0 | 2.3 ± 0.2ab | 2.7 ± 0.5a | 1.0 ± 0.3b | 1.8 ± 0.9ab |
| 16:0 | 21 ± 1b | 26 ± 1a | 25 ± 1a | 28 ± 3.1a |
| 18:0 | 34 ± 1a | 27 ± 0b | 26 ± 1b | 28 ± 3b |
| 18:1trans9 | 0b | 0b | 0b | 1.6 ± 0.2a |
| 18:1trans11 | 0b | 0b | 1.5 ± 0.1a | 0b |
| 18:1(n-9) | 3.9 ± 0.1c | 5.4 ± 0.1b | 5.9 ± 0.1a | 5.2 ± 0.1b |
| 18:1(n-7) | 0.7 ± 0.0c | 1.4 ± 0.0b | 1.6 ± 0.1a | 1.3 ± 0.1b |
| 18:2(n-6) | 15 ± 1b | 18 ± 0.9b | 22 ± 1a | 15 ± 2b |
| c9t11CLA | 0 | 0 | 0.06 ± 0.05 | 0 |
| 20:3(n-6) | 0c | 1.8 ± 0.3b | 2.4 ± 0.1a | 2.0 ± 0.3ab |
| 20:4(n-6) | 18 ± 1a | 14 ± 1b | 11 ± 1b | 10 ± 1b |
| 22:5(n-3) | 0.05 ± 0.05a | 0.24 ± 0.01a | 0.31 ± 0.05a | 0.18 ± 0.06a |
| 22:6(n-3) | 1.3 ± 0.1a | 1.5 ± 0.1a | 1.1 ± 0.1a | 1.3 ± 0.2a |
| MUFA | 4.3 ± 0.2c | 6.7 ± 0.1ab | 7.5 ± 0.1a | 6.4 ± 0.1b |
| SFA | 56 ± 1a | 55 ± 1ab | 52 ± 0b | 57 ± 1a |
| PUFA | 34 ± 2ab | 35 ± 1ab | 36 ± 0a | 32 ± 1b |
| PUFA:SFA | 0.61 ± 0.20ab | 0.64 ± 0.03ab | 0.69 ± 0.01a | 0.56 ± 0.02b |
| n-6 PUFA | 33 ± 1a | 33 ± 1a | 35 ± 0a | 30 ± 1b |
| n-3 PUFA | 1.4 ± 0.1a | 1.7 ± 0.1a | 1.4 ± 0.1a | 1.7 ± 0.2a |
| n-6:n-3 PUFA | 26 ± 2.7a | 20 ± 1.1ab | 26 ± 2.9a | 19 ± 2.5b |
2.3. Fatty Acid Composition of Splenocyte PL
| Lean Ctl | Obese Ctl | VA | EA | |
|---|---|---|---|---|
| g/100g lipid | ||||
| C16:0 | 3.4 ± 0.1c | 5.0 ± 0.1a | 5.2 ± 0.2a | 4.2 ± 0.1b |
| C18:0 | 25 ± 0a | 22 ± 0b | 22 ± 0b | 23 ± 0b |
| C18:1trans9 | 0 | 0 | 0 | 1.4 ± 0.1 |
| 18:1trans11 | 0.38 ± 0.08b | 0.34 ± 0.02b | 1.1 ± 0.1a | 0.30 ± 0.00b |
| C18:1cis9 | 5.0 ± 0.1a | 5.2 ± 0.1a | 5.2 ± 0.1a | 5.1 ± 0.1a |
| C18:1cis11 | 0.58 ± 0.03d | 1.0 ± 0.0b | 1.2 ± 0.0a | 0.91 ± 0.03c |
| C18:2 (n-6) | 4.3 ± 0.4a | 3.6 ± 0.1b | 4.1 ± 0.1a | 3.5 ± 0.1b |
| C18:3 (n-3) | 0.30 ± 0.02a | 0.29 ± 0.03a | 0.35 ± 0.01a | 0.31 ± 0.01a |
| C20:3 (n-6) | 1.0 ± 0.1c | 1.5 ± 0.1b | 1.5 ± 0.0b | 1.7 ± 0.1a |
| C20:4 (n-6) | 40 ± 1a | 40 ± 0a | 38 ± 1b | 40 ± 0a |
| C20:5 (n-3) | 0.76 ± 0.46a | 0.40 ± 0.12a | 1.4 ± 0.7a | 0.68 ± 0.15a |
| C22:4 (n-6) | 0.65 ± 0.06a | 0.70 ± 0.05a | 0.62 ± 0.07a | 0.55 ± 0.03a |
| C22:5 (n-3) | 2.7 ± 0.1b | 4.4 ± 0.1a | 4.1 ± 0.1a | 4.3 ± 0.2a |
| C22:6 (n-3) | 2.1 ± 0.1c | 3.9 ± 0.2a | 2.8 ± 0.1b | 3.6 ± 0.1a |
| MUFA | 5.7 ± 0.3b | 6.5 ± 0.1a | 7.5 ± 0.1a | 6.4 ± 0.1a |
| SFA | 33 ± 1a | 31± 0a | 31 ± 1a | 29 ± 0b |
| PUFA | 60 ± 1ab | 61 ± 0a | 58 ± 1b | 61 ± 0a |
| PUFA:SFA | 1.8 ± 0.1b | 2.0 ± 0.0ab | 1.9 ± 0.1b | 2.1 ± 0.0a |
| (n-6) PUFA | 46 ± 1a | 44 ± 0.2bc | 43 ± 1c | 45 ± 0ab |
| (n-3) PUFA | 14 ± 0c | 16 ± 0a | 15 ± 1b | 16 ± 0ab |
| (n-6):(n-3) PUFA | 3.3 ± 0.1a | 2.7 ± 0.0b | 2.9 ± 0.1b | 2.8 ± 0.1b |
| Lean Ctl | Obese Ctl | VA | EA | |
|---|---|---|---|---|
| g/100g lipid | ||||
| C16:0 | 31 ± 0a | 36 ± 0b | 37± 0b | 36 ± 0b |
| C18:0 | 17 ± 0a | 13 ± 0b | 12 ± 0bc | 12 ± 0c |
| C18:1trans9 | 0 | 0 | 0 | 2.1 ± 0.0 |
| 18:1trans11 | 0.60 ± 0.07b | 0.71 ± 0.04b | 1.5 ± 0.1a | 0 |
| C18:1cis9 | 9.0 ± 0.1b | 9.4 ± 0.1a | 9.0 ± 0.1b | 9.6 ± 0.1a |
| C18:1cis11 | 2.0 ± 0.1c | 3.4 ± 0.1ab | 3.6 ± 0.1a | 3.4 ± 0.0b |
| C18:2 (n-6) | 12 ± 0a | 10 ± 0c | 11 ± 0b | 11 ± 0b |
| C18:3 (n-3) | 0.95 ± 0.02a | 0.79 ± 0.03b | 0.82 ± 0.02b | 0.86 ± 0.02b |
| C20:3 (n-6) | 1.0 ± 0.0c | 1.7 ± 0.1b | 1.7 ± 0.0b | 2.0 ± 0.1a |
| C20:4 (n-6) | 17 ± 1a | 16 ± 0a | 14 ± 0b | 14 ± 0b |
| C20:5 (n-3) | 0.07 ± 0.00a | 0.05 ± 0.00b | 0.07 ± 0.02ab | 0.05 ± 0.00ab |
| C22:4 (n-6) | 0.10 ± 0.00a | 0.10 ± 0.00b | 0.08 ± 0.02b | 0.10 ± 0.00b |
| C22:5 (n-3) | 0.38 ± 0.01b | 0.66 ± 0.01b | 0.60 ± 0.02b | 0.73 ± 0.03a |
| C22:6 (n-3) | 0.39 ± 0.01c | 0.74 ± 0.03a | 0.54 ± 0.02b | 0.74 ± 0.03a |
| MUFA | 12 ± 0b | 14 ± 0a | 14 ± 1a | 14 ± 0a |
| SFA | 51 ± 1a | 50 ± 0a | 51 ± 1a | 49 ± 0b |
| PUFA | 35 ± 1a | 32 ± 0b | 31 ± 3b | 32 ± 0b |
| PUFA:SFA | 0.68 ± 0.03a | 0.64 ± 0.01ab | 0.60 ± 0.93b | 0.66 ± 0.01a |
| (n-6) PUFA | 31 ± 1a | 27 ± 0b | 26 ± 2b | 27 ± 0b |
| (n-3) PUFA | 3.6 ± 0.1c | 4.7 ± 0.1a | 4.2 ± 0.3b | 5.1 ± 0.1a |
| (n-6):(n-3) PUFA | 8.6 ± 0.1a | 5.8 ± 0.1c | 6.4 ± 0.32b | 5.3 ± 0.1c |
2.4. Splenocyte Phenotypes
| Lean Ctl | Obese Ctl | VA | EA | |
|---|---|---|---|---|
| % of gated cells | ||||
| CD3+ | 48 ± 1a | 45 ± 1b | 43 ± 1b | 44 ± 1b |
| CD3+CD4+ | 38 ± 1a | 34 ± 1b | 33 ± 1b | 33 ± 1b |
| CD3+CD8+ | 8.9 ± 0.3a | 4.8 ± 1.0b | 8.2 ± 0.3a | 9.7 ± 0.3a |
| CD4+CD25+ | 5.6 ± 0.5b | 7.5 ± 0.3a | 8.0 ± 0.3a | 4.6 ± 0.1c |
| CD4+CD28+ | 36 ± 1a | 30 ± 1b | 32 ± 1b | NM |
| CD4+CD45RC+ | 3.9 ± 0.57c | 6.8 ± 0.42a | 5.6 ± 0.25b | 3.4 ± 0.20c |
| CD4+CD45RC- | 40 ± 1a | 37 ± 1b | 36 ± 0b | 35 ± 1b |
| CD8+CD25+ | 1.3 ± 0.1b | 1.1 ± 0.1b | 3.1 ± 0.1a | 1.0 ± 0.0b |
| CD8+CD28+ | 7.6 ± 0.1a | 3.5 ± 0.7b | 7.6 ± 0.3a | NM |
| CD8+CD45RC+ | 7.0 ± 1.4ab | 6.2 ± 1.0ab | 7.7 ± 0.1a | 4.5 ± 0.2b |
| CD8+CD45RC- | 11 ± 0.4a | 9.4 ± 0.3b | 11 ± 0.3a | 10 ± 0.4a |
| CD11b/c+OX6+ | 9.9 ± 0.6a | 10 ± 1a | 9.3 ± 0.5a | 4.0 ± 0.2b |
| OX62+OX6+ | 1.4 ± 0.03b | 1.2 ± 0.07c | 1.5 ± 0.09b | 1.7 ± 0.06a |
| CD45RA+OX6+ | 22 ± 1a | 19 ± 1b | 15 ± 1c | 19 ± 1b |
| OX6+ | 30 ± 1a | 28 ± 1b | 27 ± 1b | 26 ± 1b |
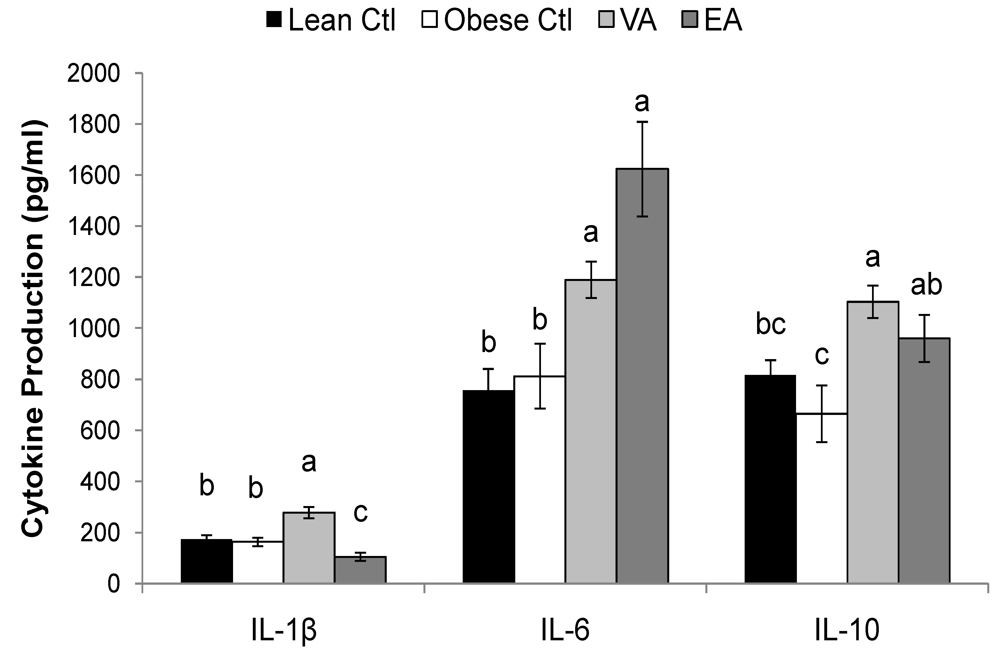
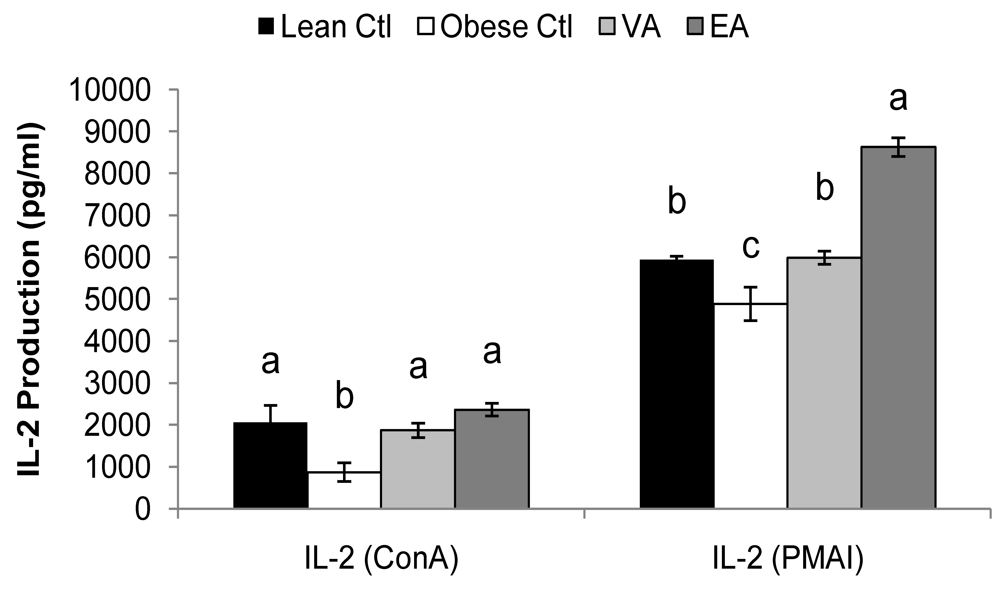
2.5. Cytokines
| Lean Ctl | Obese Ctl | VA | EA | ||
|---|---|---|---|---|---|
| (pg/ml) | |||||
| ConA | IL-1β | 73 ± 5a | 32 ± 6.0b | 59 ± 4.3a | 26 ± 7.2b |
| IL-4 | 30 ± 6.4ab | 16 ± 3.2b | 40 ± 4.2a | 17 ± 2.5b | |
| IL-6 | 50 ± 7.7c | 100 ± 15b | 118 ± 16b | 283 ± 47a | |
| IL-10 | 489 ± 62a | 348± 65a | 510 ± 40a | 499 ± 50a | |
| TNF-α | 130 ± 24a | 40 ± 9.0b | 92 ± 11a | 83 ± 11a | |
| IFN-γ | 670 ± 228a | 310 ± 82a | 416 ± 35a | 341 ± 45a | |
| PMAI | IL-1β | 91 ± 7.3a | 86 ± 9.9a | 99 ± 10a | 70 ± 11a |
| IL-6 | 250 ± 22ab | 227 ± 33b | 218 ± 25b | 398 ± 71a | |
| IL-10 | 2559 ± 540ab | 1414 ± 310b | 3599 ± 523a | 2239 ± 391ab | |
| TNF-α | 829 ± 107a | 620 ± 89a | 812 ± 76a | 912 ± 175a | |
| IFN-γ | 7876 ± 1002a | 4601 ± 1032b | 6393 ± 762ab | 4779 ± 745b | |

2.6. Serum Haptoglobin
2.7. Discussion
3. Experimental Section
| Control | VA | EA | |
|---|---|---|---|
| % fatty acids | |||
| 16:0 | 9.1 | 8.9 | 9.2 |
| 18:0 | 47 | 47 | 35 |
| 18:1 trans9 | 0 | 0 | 6.7 |
| 18:1 trans11 | 0 | 6 | 0 |
| 18:1 cis9 | 17 | 9 | 16 |
| 18:2 (n-6) | 23 | 25 | 24 |
| 18:3 (n-3) | 1.6 | 1.9 | 1.9 |
| PUFA | 25 | 27 | 26 |
| SFA | 57 | 57 | 45 |
| PUFA:SFA | 0.4 | 0.5 | 0.6 |
| (n-6) PUFA | 23 | 25 | 24 |
| (n-3) PUFA | 1.6 | 1.9 | 1.9 |
| (n-6):(n-3) PUFA | 15 | 13 | 14 |
3.1. Isolation of Splenocytes and Primary Culture Conditions
3.2. Phenotype Analysis
3.3. Cytokine Production and Serum Haptoglobin
3.4. Plasma and Splenocyte PL Fatty Acid Composition
3.5. Statistics
4. Conclusions
Acknowledgements
References
- Yaqoob, P. Lipids and the immune response: from molecular mechanisms to clinical applications. Curr. Opin. Clin. Nutr. Metab. Care 2003, 6, 133–150. [Google Scholar]
- Willett, W.C.; Stampfer, M.J.; Manson, J.E.; Colditz, G.A.; Speizer, F.E.; Rosner, B.A.; Sampson, L.A.; Hennekens, C.H. Intake of trans fatty acids and risk of coronary heart disease among women. Lancet 1993, 341, 581–585. [Google Scholar]
- Ascherio, A.; Hennekens, C.H.; Buring, J.E.; Master, C.; Stampfer, M.J.; Willett, W.C. Trans-fatty acids intake and risk of myocardial infarction. Circulation 1994, 89, 94–101. [Google Scholar] [PubMed]
- van de Vijver, L.P.; Kardinaal, A.F.; Couet, C.; Aro, A.; Kafatos, A.; Steingrimsdottir, L.; Amorim Cruz, J.A.; Moreiras, O.; Becker, W.; van Amelsvoort, J.M.; Vidal-Jessel, S.; Salminen, I.; Moschandreas, J.; Sigfusson, N.; Martins, I.; Carbajal, A.; Ytterfors, A.; Poppel, G. Association between trans fatty acid intake and cardiovascular risk factors in Europe: the TRANSFAIR study. Eur. J. Clin Nutr. 2000, 54, 126–135. [Google Scholar] [CrossRef] [PubMed]
- Micha, R.; Mozaffarian, D. Trans fatty acids: effects on cardiometabolic health and implications for policy. Prostaglandins Leukot. Essent. Fatty Acids 2008, 79, 147–152. [Google Scholar]
- Mozaffarian, D.; Rimm, E.B.; King, I.B.; Lawler, R.L.; McDonald, G.B.; Levy, W.C. trans fatty acids and systemic inflammation in heart failure. Am. J. Clin. Nutr. 2004, 80, 1521–1525. [Google Scholar]
- Lopez-Garcia, E.; Schulze, M.B.; Meigs, J.B.; Manson, J.E.; Rifai, N.; Stampfer, M.J.; Willett, W.C.; Hu, F.B. Consumption of trans fatty acids is related to plasma biomarkers of inflammation and endothelial dysfunction. J. Nutr. 2005, 135, 562–566. [Google Scholar]
- Baer, D.J.; Judd, J.T.; Clevidence, B.A.; Tracy, R.P. Dietary fatty acids affect plasma markers of inflammation in healthy men fed controlled diets: a randomized crossover study. Am. J. Clin. Nutr. 2004, 79, 969–973. [Google Scholar]
- Han, S.N.; Leka, L.S.; Lichtenstein, A.H.; Ausman, L.M.; Schaefer, E.J.; Meydani, S.N. Effect of hydrogenated and saturated, relative to polyunsaturated, fat on immune and inflammatory responses of adults with moderate hypercholesterolemia. J. Lipid Res. 2002, 43, 445–452. [Google Scholar] [PubMed]
- Pickup, J.C. Inflammation and activated innate immunity in the pathogenesis of type 2 diabetes. Diabetes Care 2004, 27, 813–823. [Google Scholar]
- Ridker, P.M.; Hennekens, C.H.; Buring, J.E.; Rifai, N. C-reactive protein and other markers of inflammation in the prediction of cardiovascular disease in women. N. Engl. J. Med. 2000, 342, 836–843. [Google Scholar]
- Calle, E.E.; Kaaks, R. Overweight, obesity and cancer: epidemiological evidence and proposed mechanisms. Nat. Rev. Cancer 2004, 4, 579–591. [Google Scholar]
- Renehan, A.G.; Roberts, D.L.; Dive, C. Obesity and cancer: pathophysiological and biological mechanisms. Arch. Physiol. Biochem. 2008, 114, 71–83. [Google Scholar]
- Tanaka, S.; Isoda, F.; Ishihara, Y.; Kimura, M.; Yamakawa, T. T lymphopaenia in relation to body mass index and TNF-alpha in human obesity: adequate weight reduction can be corrective. Clin. Endocrinol. 2001, 54, 347–354. [Google Scholar]
- Ghanim, H.; Aljada, A.; Hofmeyer, D.; Syed, T.; Mohanty, P.; Dandona, P. Circulating mononuclear cells in the obese are in a proinflammatory state. Circulation 2004, 110, 1564–1571. [Google Scholar]
- Tanaka, S.; Inoue, S.; Isoda, F.; Waseda, M.; Ishihara, M.; Yamakawa, T.; Sugiyama, A.; Takamura, Y.; Okuda, K. Impaired immunity in obesity: suppressed but reversible lymphocyte responsiveness. Int. J. Obes. Relat. Metab. Disord. 1993, 17, 631–636. [Google Scholar]
- Nieman, D.C.; Henson, D.A.; Nehlsen-Cannarella, S.L.; Ekkens, M.; Utter, A.C.; Butterworth, D.E.; Fagoaga, O.R. Influence of obesity on immune function. J. Am. Diet. Assoc. 1999, 99, 294–299. [Google Scholar]
- Ruth, M.R.; Taylor, C.G.; Zahradka, P.; Field, C.J. Abnormal Immune Responses in fa/fa Zucker Rats and Effects of Feeding Conjugated Linoleic Acid. Obesity (Silver.Spring) 2008, 16, 1770–1779. [Google Scholar] [CrossRef] [PubMed]
- Ruth, M.R.; Proctor, S.D.; Field, C.J. Feeding long-chain n-3 polyunsaturated fatty acids to obese leptin receptor-deficient JCR:LA- cp rats modifies immune function and lipid-raft fatty acid composition. Br. J. Nutr. 2009, 101, 1341–1350. [Google Scholar] [CrossRef] [PubMed]
- Russell, J.C.; Koeslag, D.G.; Amy, R.M.; Dolphin, P.J. Plasma lipid secretion and clearance in hyperlipidemic JCR:LA-corpulent rats. Arteriosclerosis 1989, 9, 869–876. [Google Scholar]
- Russell, J.C.; Graham, S.; Hameed, M. Abnormal insulin and glucose metabolism in the JCR:LA-corpulent rat. Metabolism 1994, 43, 538–543. [Google Scholar]
- Dolphin, P.J.; Stewart, B.; Amy, R.M.; Russell, J.C. Serum lipids and lipoproteins in the atherosclerosis prone LA/N corpulent rat. Biochim. Biophys. Acta 1987, 919, 140–148. [Google Scholar]
- Proctor, S.D.; Kelly, S.E.; Stanhope, K.L.; Havel, P.J.; Russell, J.C. Synergistic effects of conjugated linoleic acid and chromium picolinate improve vascular function and renal pathophysiology in the insulin-resistant JCR:LA-cp rat. Diabetes Obes. Metab. 2007, 9, 87–95. [Google Scholar] [CrossRef] [PubMed]
- Vine, D.F.; Takechi, R.; Russell, J.C.; Proctor, S.D. Impaired postprandial apolipoprotein-B48 metabolism in the obese, insulin-resistant JCR:LA-cp rat: increased atherogenicity for the metabolic syndrome. Atherosclerosis 2007, 190, 282–290. [Google Scholar] [CrossRef] [PubMed]
- Blewett, H.J.; Gerdung, C.A.; Ruth, M.R.; Proctor, S.D.; Field, C.J. Vaccenic acid favourably alters immune function in obese JCR:LA-cp rats. Br. J. Nutr. 2009, 102, 526–536. [Google Scholar]
- Ruth, M.R.; Proctor, S.D.; Field, C.J. Effects of feeding fish oil on mesenteric lymph node cytokine responses in obese leptin receptor-deficient JCR:LA-cp rats. Int. J. Obes. 2009, 33, 96–103. [Google Scholar] [CrossRef]
- Wang, Y.; Lu, J.; Ruth, M.R.; Goruk, S.D.; Reaney, M.J.; Glimm, D.R.; Vine, D.F.; Field, C.J.; Proctor, S.D. Trans-11 vaccenic acid dietary supplementation induces hypolipidemic effects in JCR:LA-cp rats. J. Nutr. 2008, 138, 2117–2122. [Google Scholar] [CrossRef] [PubMed]
- Wang, Y.; Jacome-Sosa, M.M.; Ruth, M.R.; Goruk, S.D.; Reaney, M.J.; Glimm, D.R.; Wright, D.C.; Vine, D.F.; Field, C.J.; Proctor, S.D. Trans-11 vaccenic acid reduces hepatic lipogenesis and chylomicron secretion in JCR:LA-cp rats. J. Nutr. 2009, 139, 2049–2054. [Google Scholar] [CrossRef] [PubMed]
- Tyburczy, C.; Major, C.; Lock, A.L.; Destaillats, F.; Lawrence, P.; Brenna, J.T.; Salter, A.M.; Bauman, D.E. Individual trans octadecenoic acids and partially hydrogenated vegetable oil differentially affect hepatic lipid and lipoprotein metabolism in golden Syrian hamsters. J. Nutr. 2009, 139, 257–263. [Google Scholar]
- Calder, P.C.; Grimble, R.F. Polyunsaturated fatty acids, inflammation and immunity. Eur. J. Clin. Nutr. 2002, 56, S14–S19. [Google Scholar]
- Hotamisligil, G.S. Inflammation and metabolic disorders. Nature 2006, 444, 860–867. [Google Scholar]
- Tanaka, S.; Isoda, F.; Yamakawa, T.; Ishihara, M.; Sekihara, H. T lymphopenia in genetically obese rats. Clin. Immunol. Immunopathol. 1998, 86, 219–225. [Google Scholar]
- Moriguchi, S.; Kato, M.; Sakai, K.; Yamamoto, S.; Shimizu, E. Exercise training restores decreased cellular immune functions in obese Zucker rats. J. Appl. Physiol. 1998, 84, 311–317. [Google Scholar]
- Mito, N.; Hosoda, T.; Kato, C.; Sato, K. Change of cytokine balance in diet-induced obese mice. Metabolism 2000, 49, 1295–1300. [Google Scholar]
- Lamas, O.; Martinez, J.A.; Marti, A. Effects of a beta3-adrenergic agonist on the immune response in diet-induced (cafeteria) obese animals. J. Physiol. Biochem. 2003, 59, 183–191. [Google Scholar]
- Lamas, O.; Martinez, J.A.; Marti, A. T-helper lymphopenia and decreased mitogenic response in cafeteria diet-induced obese rats. Nutr. Res. 2002, 22, 497–506. [Google Scholar]
- Cope, A.P. Studies of T-cell activation in chronic inflammation. Arthritis Res. 2002, 4, S197–S211. [Google Scholar]
- Arrington, J.L.; McMurray, D.N.; Switzer, K.C.; Fan, Y.Y.; Chapkin, R.S. Docosahexaenoic acid suppresses function of the CD28 costimulatory membrane receptor in primary murine and Jurkat T cells. J. Nutr. 2001, 131, 1147–1153. [Google Scholar]
- Duque-Guimaraes, D.E.; de, Castro J.; Martinez-Botas, J.; Sardinha, F.L.; Ramos, M.P.; Herrera, E.; do Carmo, M.G. Early and prolonged intake of partially hydrogenated fat alters the expression of genes in rat adipose tissue. Nutrition 2009, 25, 782–789. [Google Scholar] [CrossRef] [PubMed]
- Chatila, T.; Silverman, L.; Miller, R.; Geha, R. Mechanisms of T cell activation by the calcium ionophore ionomycin. J. Immunol. 1989, 143, 1283–1289. [Google Scholar]
- Krakauer, T.; Oppenheim, J.J. Interleukin 1 and Its Receptors. In Encyclopedia of Immunology, 2nd ed; Elsevier Science & Technology:: Oxford, UK., 1998; pp. 1429–1435. [Google Scholar]
- Field, C.J.; Wu, G.; Metroz-Dayer, M.D.; Montambault, M.; Marliss, E.B. Lactate production is the major metabolic fate of glucose in splenocytes and is altered in spontaneously diabetic BB rats. Biochem. J. 1990, 272, 445–452. [Google Scholar]
- Field, C.J.; Thomson, C.A.; Van Aerde, J.E.; Parrott, A.; Euler, A.; Lien, E.; Clandinin, M.T. Lower proportion of CD45R0+ cells and deficient interleukin-10 production by formula-fed infants, compared with human-fed, is corrected with supplementation of long-chain polyunsaturated fatty acids. J. Pediatr. Gastroenterol. Nutr. 2000, 31, 291–299. [Google Scholar] [CrossRef] [PubMed]
- Field, C.J.; Ryan, E.A.; Thomson, A.B.; Clandinin, M.T. Dietary fat and the diabetic state alter insulin binding and the fatty acyl composition of the adipocyte plasma membrane. Biochem. J. 1988, 253, 417–424. [Google Scholar]
- Layne, K.S.; Goh, Y.K.; Jumpsen, J.A.; Ryan, E.A.; Chow, P.; Clandinin, M.T. Normal subjects consuming physiological levels of 18:3(n-3) and 20:5(n-3) from flaxseed or fish oils have characteristic differences in plasma lipid and lipoprotein fatty acid levels. J. Nutr. 1996, 126, 2130–2140. [Google Scholar]
- Cruz-Hernandez, C.; Deng, Z.; Zhou, J.; Hill, A.R.; Yurawecz, M.P.; Delmonte, P.; Mossoba, M.M.; Dugan, M.E.; Kramer, J.K. Methods for analysis of conjugated linoleic acids and trans-18:1 isomers in dairy fats by using a combination of gas chromatography, silver-ion thin-layer chromatography/gas chromatography, and silver-ion liquid chromatography. J. AOAC Int. 2004, 87, 545–562. [Google Scholar] [PubMed]
© 2010 by the authors; licensee Molecular Diversity Preservation International, Basel, Switzerland. This article is an open-access article distributed under the terms and conditions of the Creative Commons Attribution license (http://creativecommons.org/licenses/by/3.0/).
Share and Cite
Ruth, M.R.; Wang, Y.; Yu, H.-M.; Goruk, S.; Reaney, M.J.; Proctor, S.D.; Vine, D.F.; Field, C.J. Vaccenic and Elaidic Acid Modify Plasma and Splenocyte Membrane Phospholipids and Mitogen-Stimulated Cytokine Production in Obese Insulin Resistant JCR: LA-cp Rats. Nutrients 2010, 2, 181-197. https://doi.org/10.3390/nu2020181
Ruth MR, Wang Y, Yu H-M, Goruk S, Reaney MJ, Proctor SD, Vine DF, Field CJ. Vaccenic and Elaidic Acid Modify Plasma and Splenocyte Membrane Phospholipids and Mitogen-Stimulated Cytokine Production in Obese Insulin Resistant JCR: LA-cp Rats. Nutrients. 2010; 2(2):181-197. https://doi.org/10.3390/nu2020181
Chicago/Turabian StyleRuth, Megan R., Ye Wang, Howe-Ming Yu, Susan Goruk, Martin J. Reaney, Spencer D. Proctor, Donna F. Vine, and Catherine J. Field. 2010. "Vaccenic and Elaidic Acid Modify Plasma and Splenocyte Membrane Phospholipids and Mitogen-Stimulated Cytokine Production in Obese Insulin Resistant JCR: LA-cp Rats" Nutrients 2, no. 2: 181-197. https://doi.org/10.3390/nu2020181
APA StyleRuth, M. R., Wang, Y., Yu, H.-M., Goruk, S., Reaney, M. J., Proctor, S. D., Vine, D. F., & Field, C. J. (2010). Vaccenic and Elaidic Acid Modify Plasma and Splenocyte Membrane Phospholipids and Mitogen-Stimulated Cytokine Production in Obese Insulin Resistant JCR: LA-cp Rats. Nutrients, 2(2), 181-197. https://doi.org/10.3390/nu2020181