Effects of Dietary Fruit and Vegetable Consumption on Prediabetes: A Systematic Review and Meta-Analysis

Abstract
1. Introduction
2. Materials and Methods
2.1. Search Strategy
2.2. Eligibility Criteria and Study Selection
2.3. Data Extraction
2.4. Main and Subgroup Analyses
2.5. Quality Assessment Using Risk of Bias
2.6. Statistical Analysis
3. Results
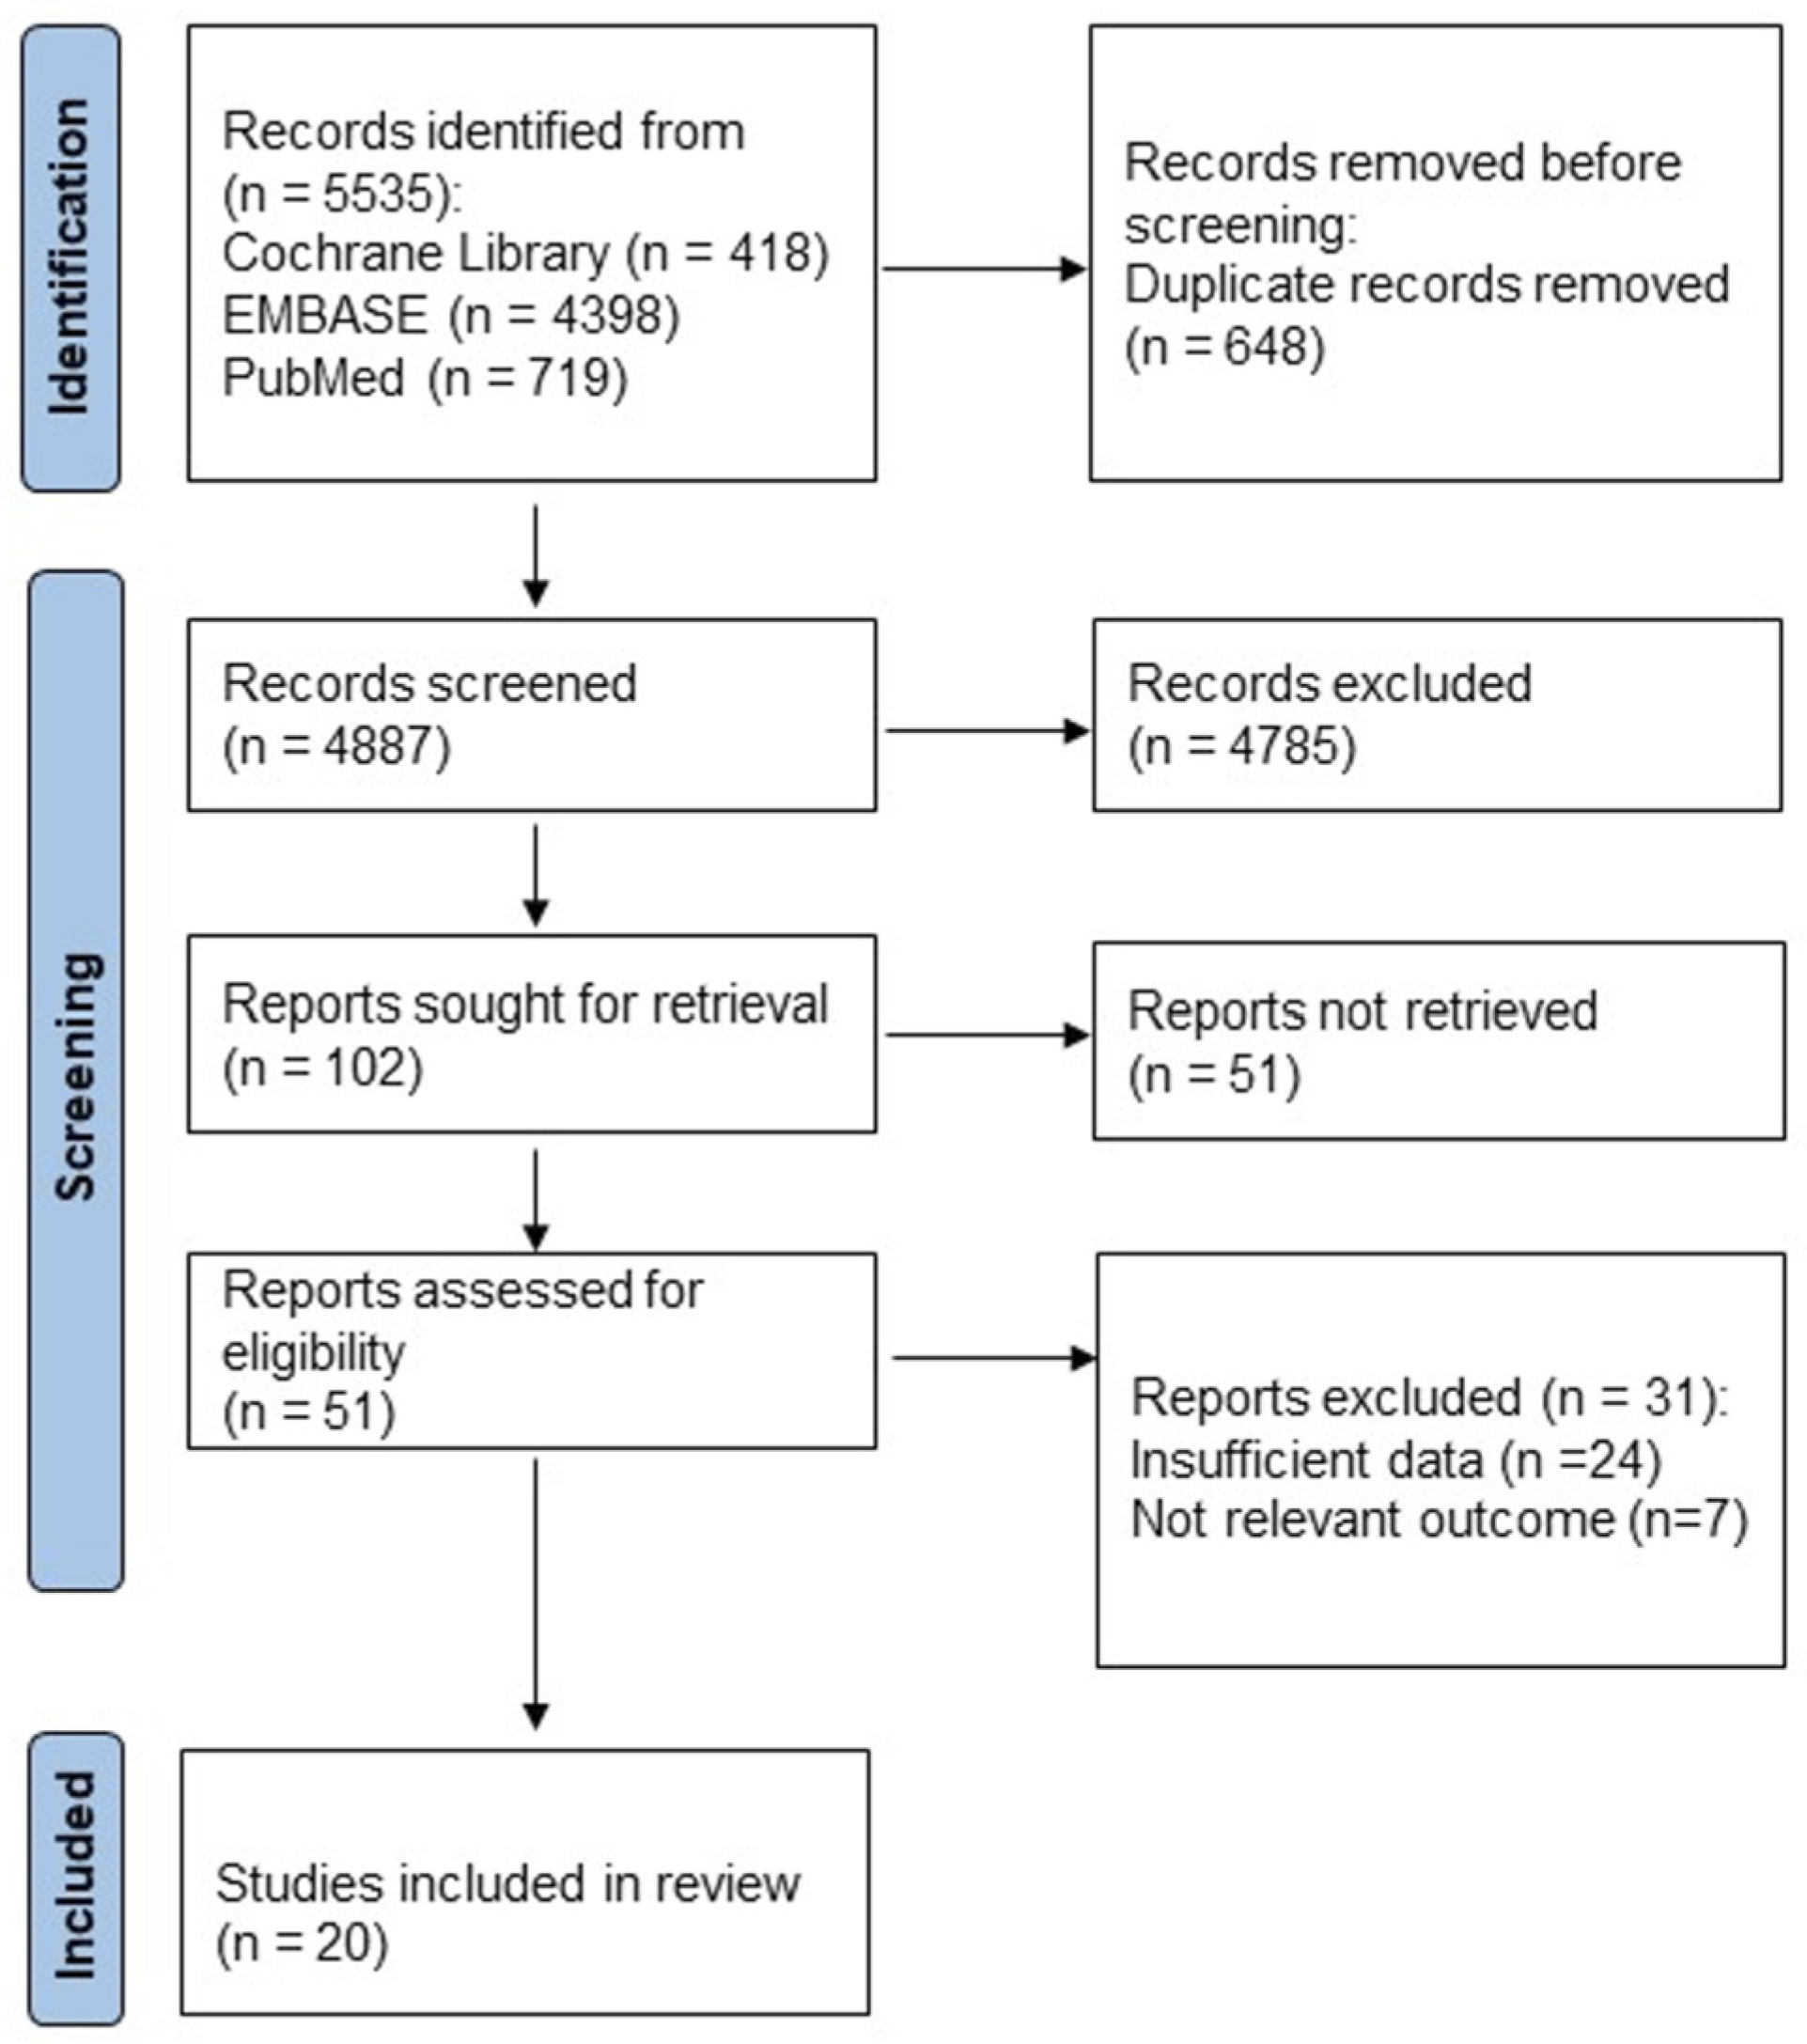
3.1. Selection of Relevant Studies
3.2. Characteristics of Included Studies
3.3. Methodological Quality
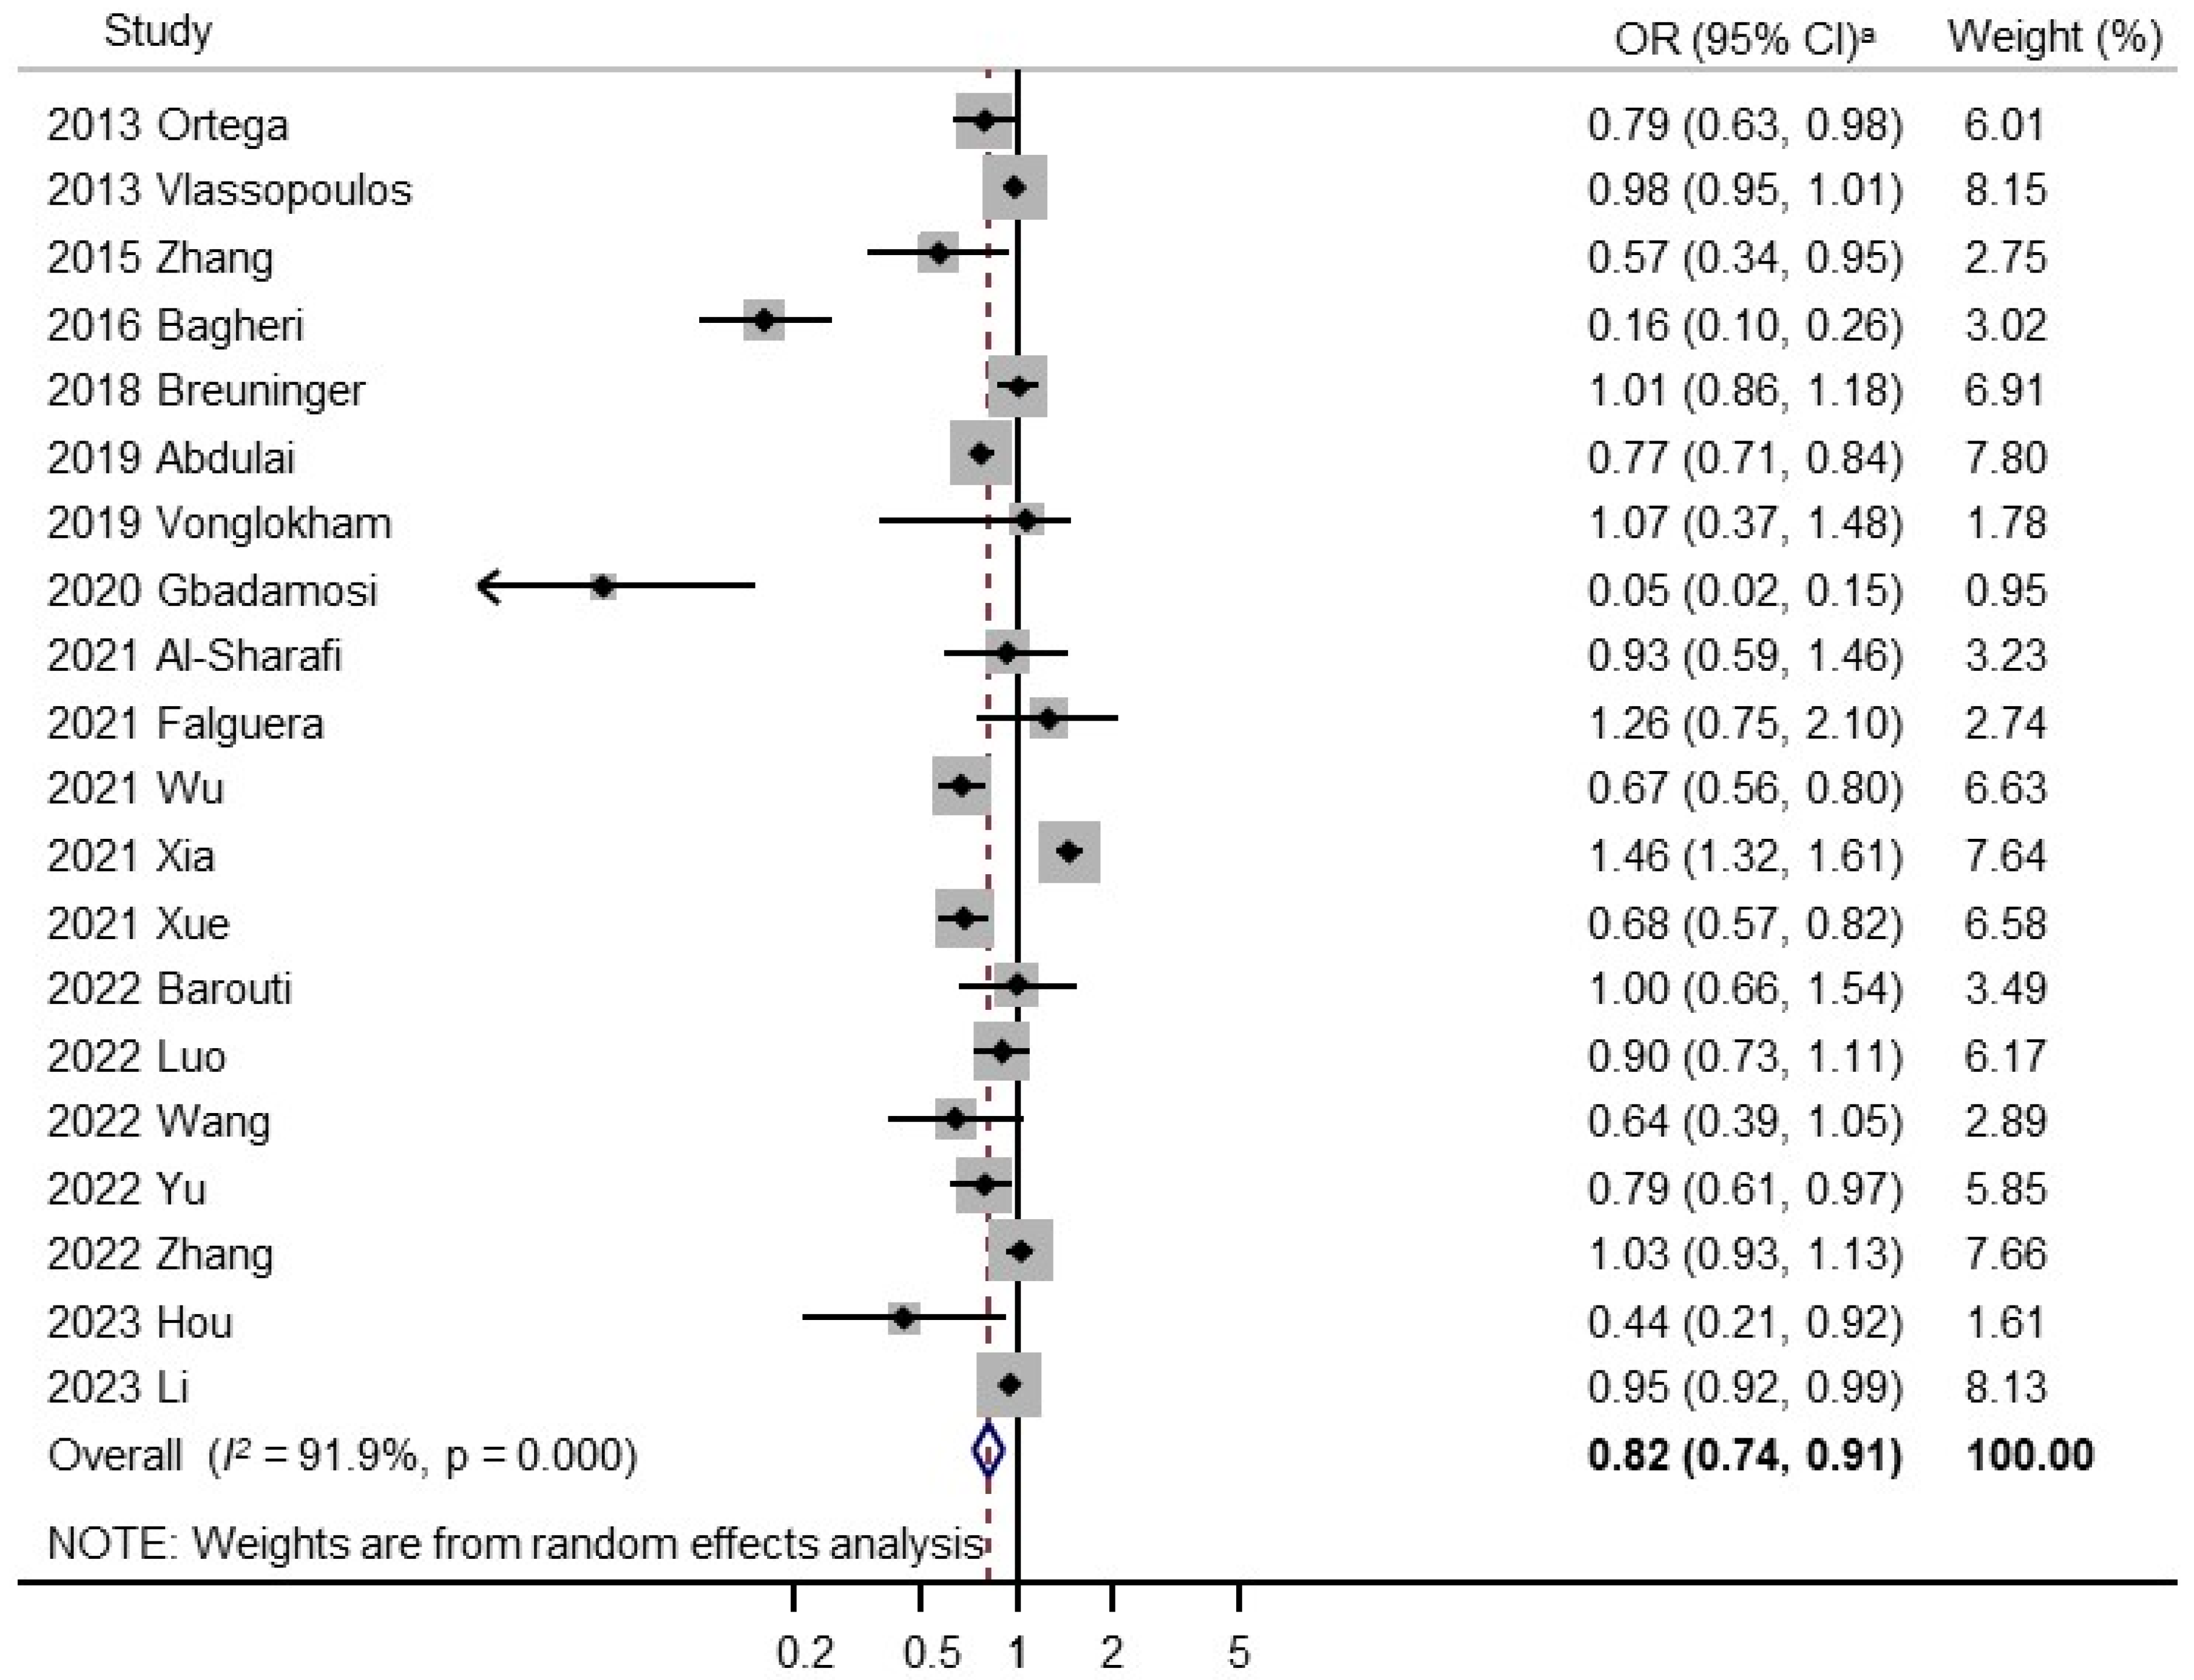
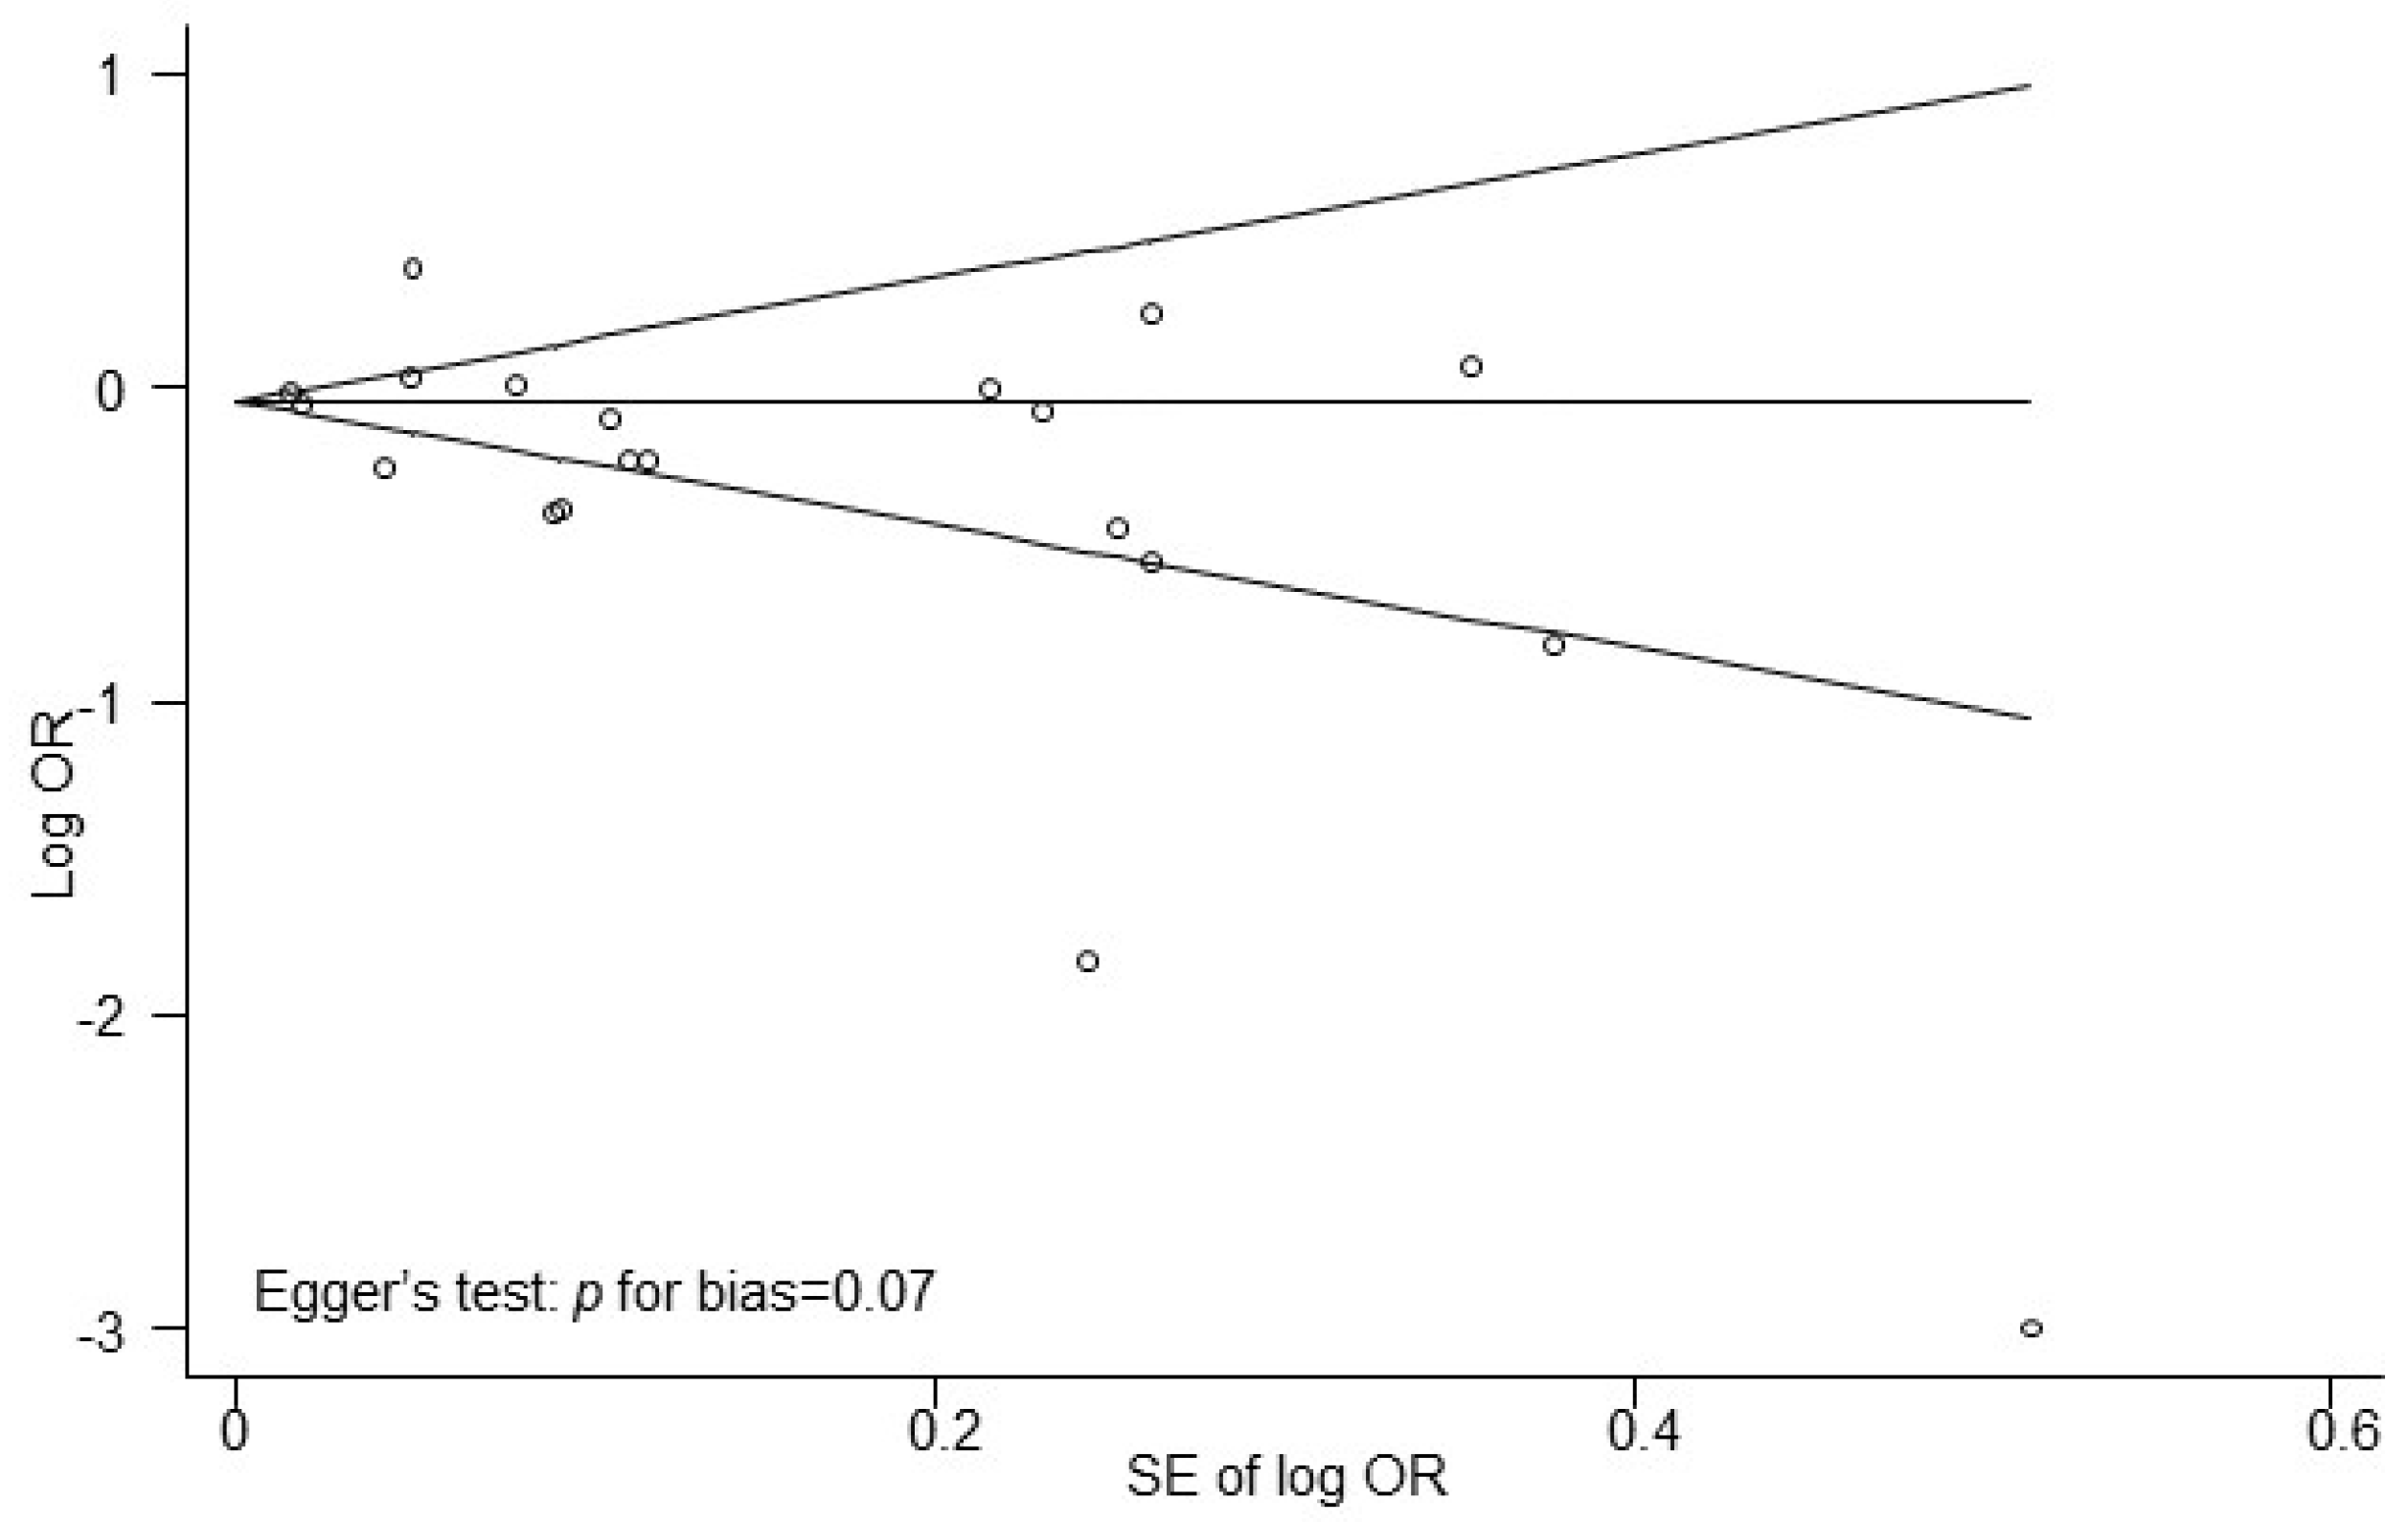
3.4. Result of the Meta-Analysis
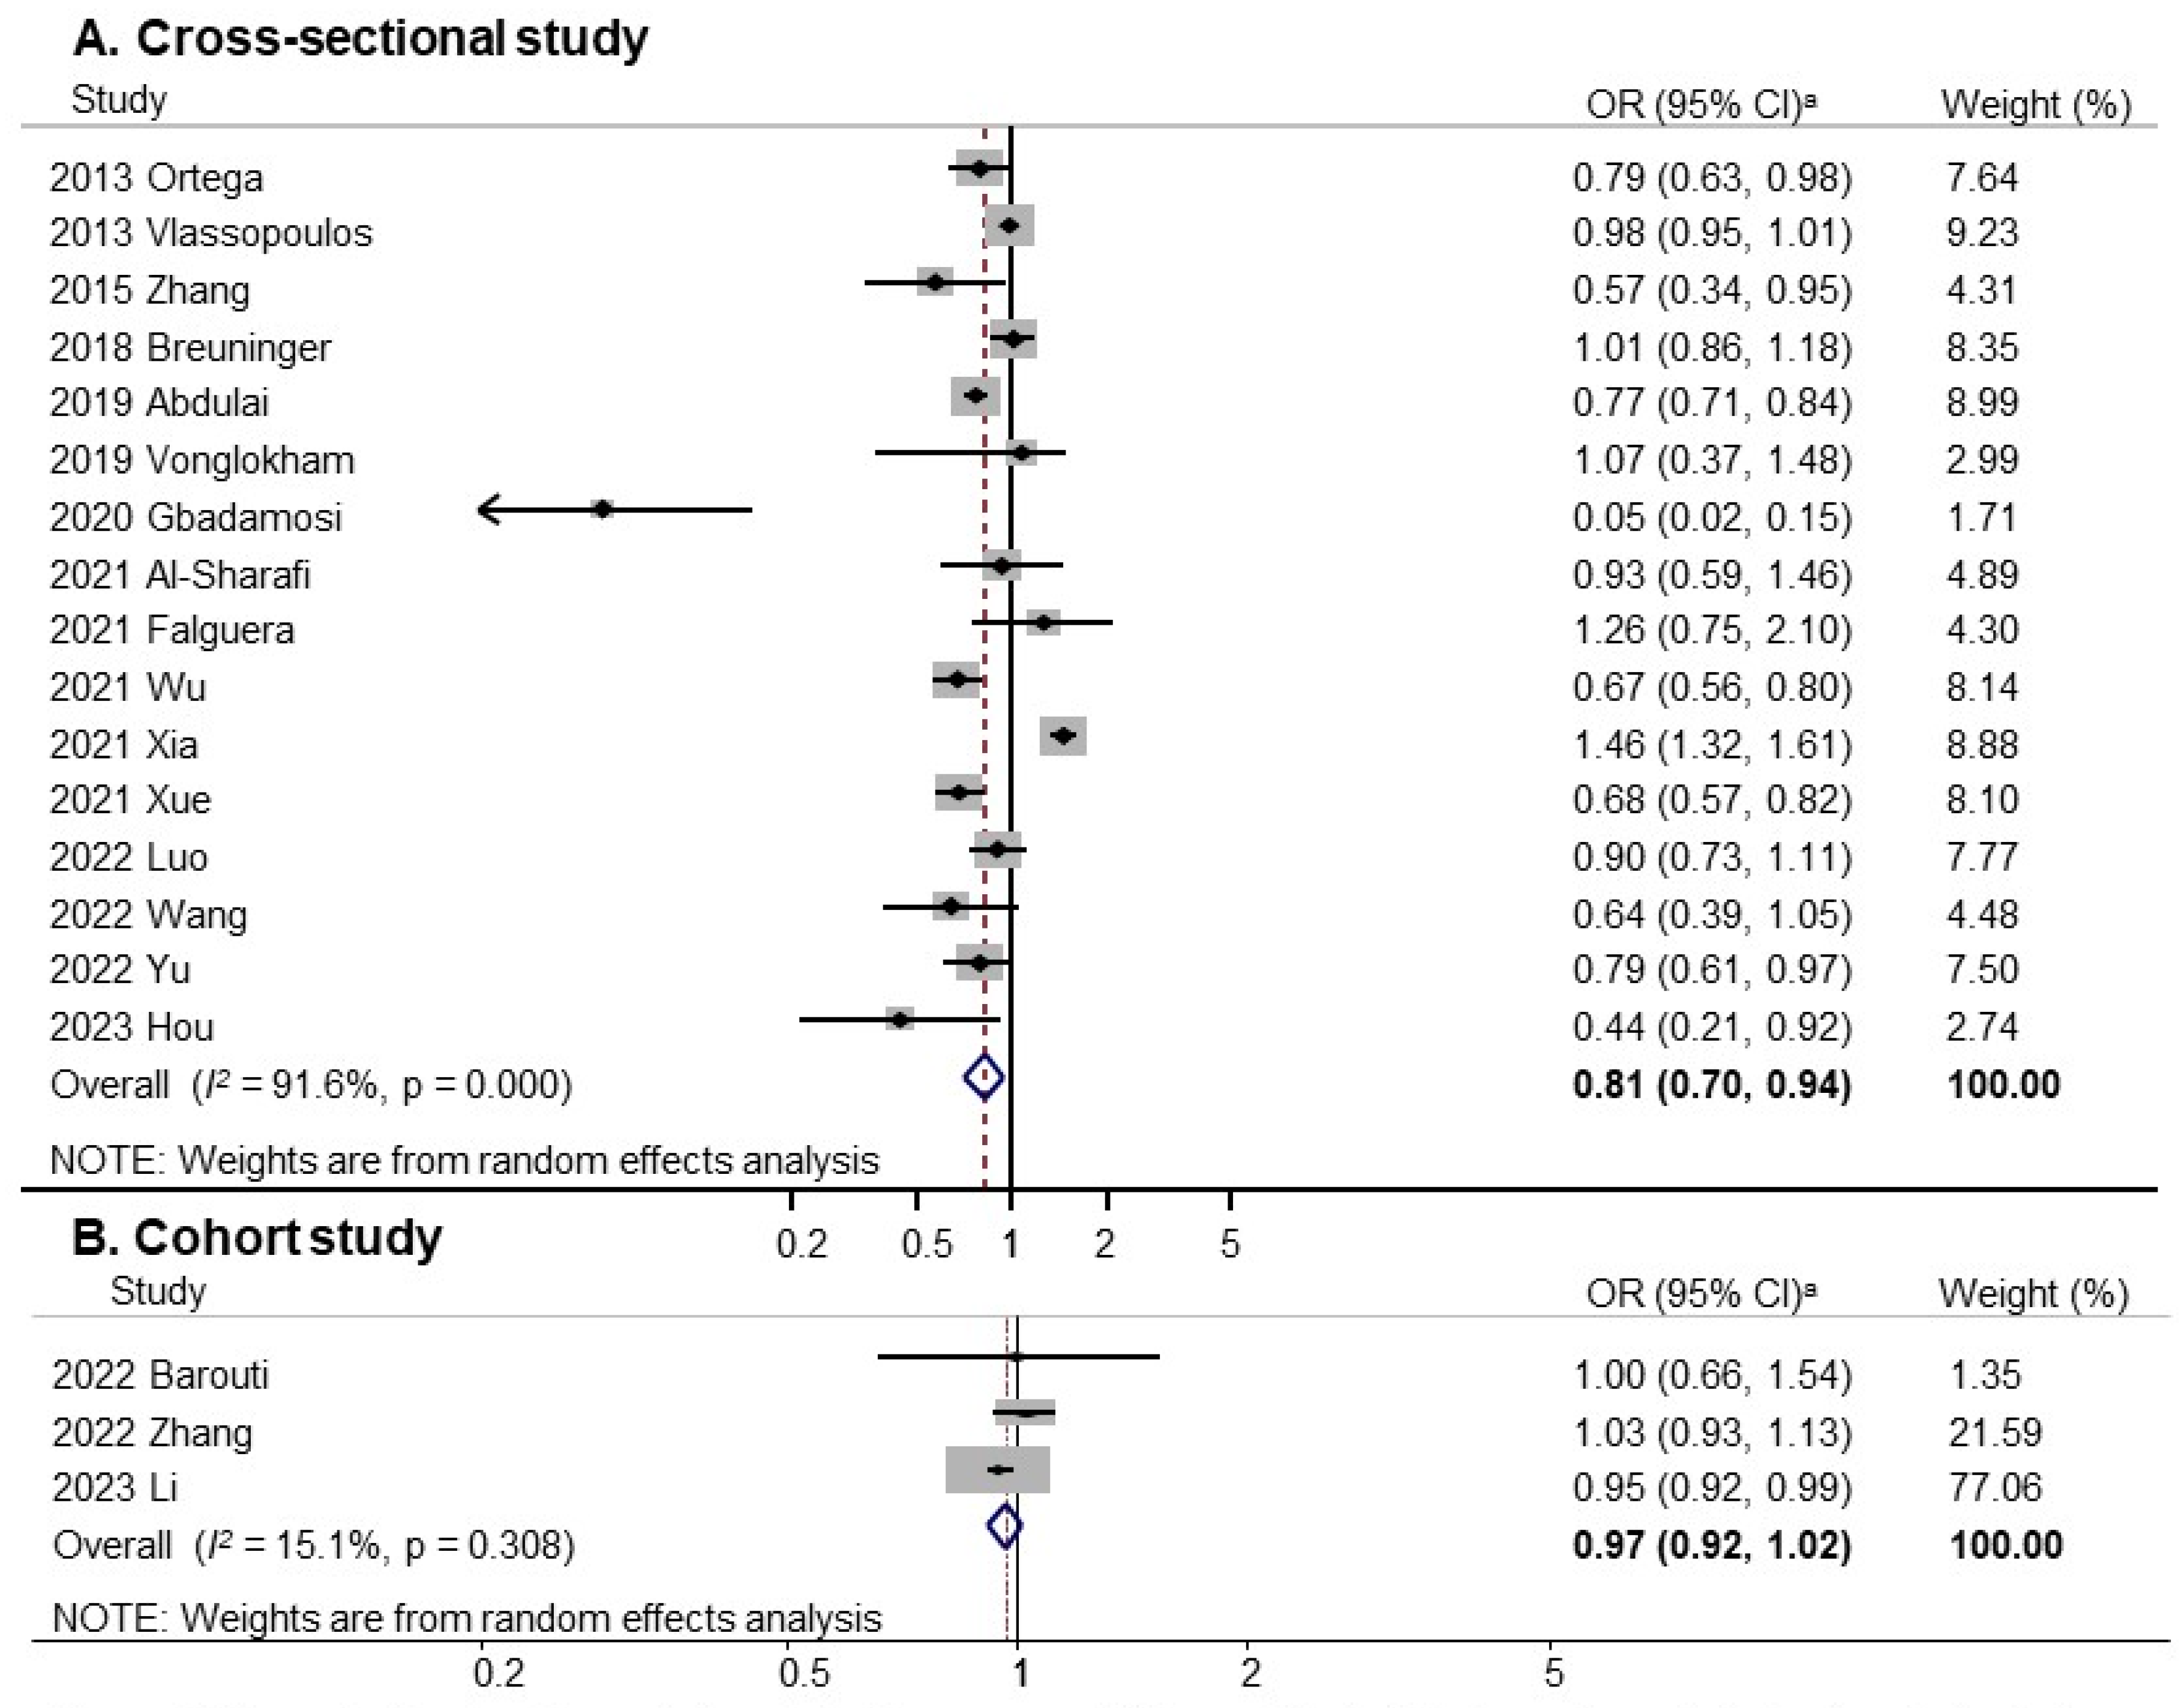
3.5. Subgroup Meta-Analyses
4. Discussion
5. Conclusions
Supplementary Materials
Author Contributions
Funding
Institutional Review Board Statement
Informed Consent Statement
Data Availability Statement
Conflicts of Interest
References
- NCD Risk Factor Collaboration (NCD-RisC). Worldwide trends in diabetes prevalence and treatment from 1990 to 2022: A pooled analysis of 1108 population-representative studies with 141 million participants. Lancet 2024, 404, 2077–2093. [Google Scholar] [CrossRef] [Scilit]
- International Diabetes Federation. IDF Diabetes Atlas, 11th ed.; International Diabetes Federation: Brussels, Belgium, 2025. [Google Scholar]
- Butt, M.D.; Ong, S.C.; Rafiq, A.; Kalam, M.N.; Sajjad, A.; Abdullah, M.; Malik, T.; Yaseen, F.; Babar, Z.U. A systematic review of the economic burden of diabetes mellitus: Contrasting perspectives from high and low middle-income countries. J. Pharm. Policy Pract. 2024, 17, 2322107. [Google Scholar] [CrossRef] [Scilit]
- Jing, X.; Chen, J.; Dong, Y.; Han, D.; Zhao, H.; Wang, X.; Gao, F.; Li, C.; Cui, Z.; Liu, Y.; et al. Related factors of quality of life of type 2 diabetes patients: A systematic review and meta-analysis. Health Qual. Life Outcomes 2018, 16, 189. [Google Scholar] [CrossRef] [Scilit] [PubMed]
- Gregg, E.W.; Sattar, N.; Ali, M.K. The changing face of diabetes complications. Lancet Diabetes Endocrinol. 2016, 4, 537–547. [Google Scholar] [CrossRef] [Scilit]
- Ley, S.H.; Hamdy, O.; Mohan, V.; Hu, F.B. Prevention and management of type 2 diabetes: Dietary components and nutritional strategies. Lancet 2014, 383, 1999–2007. [Google Scholar] [CrossRef] [Scilit]
- Forouhi, N.G.; Misra, A.; Mohan, V.; Taylor, R.; Yancy, W. Dietary and nutritional approaches for prevention and management of type 2 diabetes. BMJ 2018, 361, k2234. [Google Scholar] [CrossRef] [Scilit]
- Gong, D.; Lai, W.F. Dietary patterns and type 2 diabetes: A narrative review. Nutrition 2025, 140, 112905. [Google Scholar] [CrossRef] [Scilit]
- Toi, P.L.; Anothaisintawee, T.; Chaikledkaew, U.; Briones, J.R.; Reutrakul, S.; Thakkinstian, A. Preventive role of diet interventions and dietary factors in type 2 diabetes mellitus: An umbrella review. Nutrients 2020, 12, 2722. [Google Scholar] [CrossRef] [Scilit] [PubMed]
- Schwingshackl, L.; Hoffmann, G.; Lampousi, A.M.; Knuppel, S.; Iqbal, K.; Schwedhelm, C.; Bechthold, A.; Schlesinger, S.; Boeing, H. Food groups and risk of type 2 diabetes mellitus: A systematic review and meta-analysis of prospective studies. Eur. J. Epidemiol. 2017, 32, 363–375. [Google Scholar] [CrossRef] [Scilit] [PubMed]
- Banjarnahor, R.L.; Javadi Arjmand, E.; Onni, A.T.; Thomassen, L.M.; Perillo, M.; Balakrishna, R.; Sletten, I.S.K.; Lorenzini, A.; Plastina, P.; Fadnes, L.T. Umbrella review of systematic reviews and meta-analyses on consumption of different food groups and risk of type 2 diabetes mellitus and metabolic syndrome. J. Nutr. 2025, 155, 1285–1297. [Google Scholar] [CrossRef] [Scilit]
- Młynarska, E.; Wasiak, J.; Gajewska, A.; Steć, G.; Jasińska, J.; Rysz, J.; Franczyk, B. Exploring the significance of gut microbiota in diabetes pathogenesis and management-A narrative review. Nutrients 2024, 16, 1938. [Google Scholar] [CrossRef] [Scilit]
- Dou, B.; Zhu, Y.; Sun, M.; Wang, L.; Tang, Y.; Tian, S.; Wang, F. Mechanisms of flavonoids and their derivatives in endothelial dysfunction induced by oxidative stress in diabetes. Molecules 2024, 29, 3265. [Google Scholar] [CrossRef] [Scilit] [PubMed]
- Murillo, S.; Mallol, A.; Adot, A.; Juarez, F.; Coll, A.; Gastaldo, I.; Roura, E. Culinary strategies to manage glycemic response in people with type 2 diabetes: A narrative review. Front. Nutr. 2022, 9, 1025993. [Google Scholar] [CrossRef] [Scilit]
- Crummett, L.T.; Grosso, R.J. Postprandial glycemic response to whole fruit versus blended fruit in healthy, young adults. Nutrients 2022, 14, 4565. [Google Scholar] [CrossRef] [Scilit] [PubMed]
- Bazzano, L.A.; Li, T.Y.; Joshipura, K.J.; Hu, F.B. Intake of fruit, vegetables, and fruit juices and risk of diabetes in women. Diabetes Care 2008, 31, 1311–1317. [Google Scholar] [CrossRef] [Scilit]
- Hostalek, U. Global epidemiology of prediabetes-present and future perspectives. Clin. Diabetes Endocrinol. 2019, 5, 5. [Google Scholar] [CrossRef] [Scilit] [PubMed]
- U.S. Preventive Services Task Force; Davidson, K.W.; Barry, M.J.; Mangione, C.M.; Cabana, M.; Caughey, A.B.; Davis, E.M.; Donahue, K.E.; Doubeni, C.A.; Krist, A.H.; et al. Screening for prediabetes and type 2 diabetes: U.S. Preventive Services Task Force recommendation statement. JAMA 2021, 326, 736–743. [Google Scholar]
- Page, M.J.; McKenzie, J.E.; Bossuyt, P.M.; Boutron, I.; Hoffmann, T.C.; Mulrow, C.D.; Shamseer, L.; Tetzlaff, J.M.; Akl, E.A.; Brennan, S.E.; et al. The PRISMA 2020 statement: An updated guideline for reporting systematic reviews. BMJ 2021, 372, n71. [Google Scholar] [CrossRef] [Scilit]
- Wells, G.A.; Shea, B.; O’Connell, D.; Peterson, J.; Welch, V.; Losos, M.; Tugwell, P. The Newcastle-Ottawa Scale (NOS) for Assessing the Quality of Nonrandomised Studies in Meta-Analyses. Available online: http://www.ohri.ca/programs/clinical_epidemiology/oxford.htm (accessed on 25 January 2026).
- Higgins, J.P.; Thompson, S.G. Quantifying heterogeneity in a meta-analysis. Stat. Med. 2002, 21, 1539–1558. [Google Scholar] [CrossRef] [Scilit]
- DerSimonian, R.; Laird, N. Meta-analysis in clinical trials. Control. Clin. Trials 1986, 7, 177–188. [Google Scholar] [CrossRef] [Scilit]
- Ortega, E.; Franch, J.; Castell, C.; Goday, A.; Ribas-Barba, L.; Soriguer, F.; Vendrell, J.; Casamitjana, R.; Bosch-Comas, A.; Bordiu, E.; et al. Mediterranean diet adherence in individuals with prediabetes and unknown diabetes: The Di @ bet.es study. Ann. Nutr. Metab. 2013, 62, 339–346. [Google Scholar] [CrossRef] [Scilit]
- Vlassopoulos, A.; Lean, M.E.J.; Combet, E. Influence of smoking and diet on glycated haemoglobin and ‘pre-diabetes’ categorisation: A cross-sectional analysis. BMC Public Health 2013, 13, 1013. [Google Scholar] [CrossRef] [Scilit] [PubMed]
- Zhang, M.; Zhu, Y.; Li, P.; Chang, H.; Wang, X.; Liu, W.; Zhang, Y.; Huang, G. Associations between dietary patterns and impaired fasting glucose in Chinese men: A cross-sectional study. Nutrients 2015, 7, 8072–8089. [Google Scholar] [CrossRef] [Scilit]
- Bagheri, F.; Siassi, F.; Koohdani, F.; Mahaki, B.; Qorbani, M.; Yavari, P.; Shaibu, O.M.; Sotoudeh, G. Healthy and unhealthy dietary patterns are related to pre-diabetes: A case-control study. Br. J. Nutr. 2016, 116, 874–881. [Google Scholar] [CrossRef] [Scilit]
- Breuninger, T.A.; Riedl, A.; Wawro, N.; Rathmann, W.; Strauch, K.; Quante, A.; Peters, A.; Thorand, B.; Meisinger, C.; Linseisen, J. Differential associations between diet and prediabetes or diabetes in the KORA FF4 study. J. Nutr. Sci. 2018, 7, e34. [Google Scholar] [CrossRef] [Scilit] [PubMed]
- Abdulai, T.; Li, Y.; Zhang, H.; Tu, R.; Liu, X.; Zhang, L.; Dong, X.; Li, R.; Wang, Y.; Wang, C. Prevalence of impaired fasting glucose, type 2 diabetes and associated risk factors in undiagnosed Chinese rural population: The Henan rural cohort study. BMJ Open 2019, 9, e029628. [Google Scholar] [CrossRef] [Scilit]
- Vonglokham, M.; Kounnavong, S.; Sychareun, V.; Pengpid, S.; Peltzer, K. Prevalence and social and health determinants of pre-diabetes and diabetes among adults in Laos: A cross-sectional national population-based survey, 2013. Trop. Med. Int. Health 2019, 24, 65–72. [Google Scholar] [CrossRef] [Scilit] [PubMed]
- Gbadamosi, M.A.; Tlou, B. Modifiable risk factors associated with noncommunicable diseases among adult outpatients in Manzini, Swaziland: A cross-sectional study. BMC Public Health 2020, 20, 665. [Google Scholar] [CrossRef] [Scilit]
- Al-Sharafi, B.A.; Qais, A.A.; Salem, K.; Bashaaib, M.O. Family history, consanguinity and other risk factors affecting the prevalence of prediabetes and undiagnosed diabetes mellitus in overweight and obese Yemeni adults. Diabetes Metab. Syndr. Obes. 2021, 14, 4853–4863. [Google Scholar] [CrossRef] [Scilit]
- Falguera, M.; Castelblanco, E.; Rojo-López, M.I.; Vilanova, M.B.; Rea, J.; Alcubierre, N.; Miró, N.; Molló, A.; Mata-Cases, M.; Franch-Nadal, J.; et al. Mediterranean diet and healthy eating in subjects with prediabetes from the Mollerussa prospective observational cohort study. Nutrients 2021, 13, 252. [Google Scholar] [CrossRef] [Scilit]
- Wu, C.; Liu, P.; Yuan, Z. Fruit and vegetable intake is inversely associated with type 2 diabetes in Chinese women: Results from the China health and nutrition survey. Int. J. Food Sci. Nutr. 2021, 72, 208–218. [Google Scholar] [CrossRef] [Scilit]
- Xia, M.; Liu, K.; Feng, J.; Zheng, Z.; Xie, X. Prevalence and risk factors of type 2 diabetes and prediabetes among 53,288 middle-aged and elderly adults in China: A cross-sectional study. Diabetes Metab. Syndr. Obes. 2021, 14, 1975–1985. [Google Scholar] [CrossRef] [Scilit]
- Xue, Y.; Liu, C.; Wang, B.; Mao, Z.; Yu, S.; Wang, Y.; Zhang, D.; Wang, C.; Li, W.; Li, X. The association between dietary patterns with type 2 diabetes mellitus and pre-diabetes in the Henan rural cohort study. Public Health Nutr. 2021, 24, 5443–5452. [Google Scholar] [CrossRef] [Scilit]
- Barouti, A.A.; Tynelius, P.; Lager, A.; Bjorklund, A. Fruit and vegetable intake and risk of prediabetes and type 2 diabetes: Results from a 20-year long prospective cohort study in Swedish men and women. Eur. J. Nutr. 2022, 61, 3175–3187. [Google Scholar] [CrossRef] [Scilit]
- Luo, G.; Li, X.; Zhao, X.; He, L.; Lv, X.; Feng, E.; Cui, N.; Cui, J.; Sun, Y.; Sun, J. Relationship between dietary patterns and prediabetes, undiagnosed or diagnosed diabetes mellitus among adults in Qingdao: A cross-sectional study. Asia Pac. J. Clin. Nutr. 2022, 31, 660–673. [Google Scholar]
- Wang, D.D.; Qi, Q.; Wang, Z.; Usyk, M.; Sotres-Alvarez, D.; Mattei, J.; Tamez, M.; Gellman, M.D.; Daviglus, M.; Hu, F.B.; et al. The gut microbiome modifies the association between a Mediterranean diet and diabetes in USA Hispanic/ Latino population. J. Clin. Endocrinol. Metab. 2022, 107, e924–e934. [Google Scholar] [CrossRef] [Scilit] [PubMed]
- Yu, E.Y.-W.; Ren, Z.; Mehrkanoon, S.; Stehouwer, C.D.A.; van Greevenbroek, M.M.J.; Eussen, S.J.P.M.; Zeegers, M.P.; Wesselius, A. Plasma metabolomic profiling of dietary patterns associated with glucose metabolism status: The Maastricht study. BMC Med. 2022, 20, 450. [Google Scholar] [CrossRef] [Scilit] [PubMed]
- Zhang, S.; Meng, G.; Zhang, Q.; Liu, L.; Yao, Z.; Wu, H.; Gu, Y.; Wang, Y.; Zhang, T.; Wang, X.; et al. Dietary fibre intake and risk of prediabetes in China: Results from the Tianjin chronic low-grade systemic inflammation and health (TCLSIH) cohort study. Br. J. Nutr. 2022, 128, 753–761. [Google Scholar] [CrossRef] [Scilit] [PubMed]
- Hou, Y.C.; Li, J.Y.; Chen, J.H.; Hsiao, J.K.; Wu, J.H. Short Mediterranean diet screener detects risk of prediabetes in Taiwan, a cross-sectional study. Sci. Rep. 2023, 13, 1220. [Google Scholar] [CrossRef] [Scilit]
- Li, L.; Yang, H.Y.; Ma, Y.; Liang, X.H.; Xu, M.; Zhang, J.; Huang, Z.X.; Meng, L.H.; Zhou, J.; Xian, J.; et al. Whole fresh fruit intake and risk of incident diabetes in different glycemic stages: A nationwide prospective cohort investigation. Eur. J. Nutr. 2023, 62, 771–782. [Google Scholar] [CrossRef] [Scilit] [PubMed]
- Kim, E.K.; Ha, A.W.; Choi, E.O.; Ju, S.Y. Analysis of kimchi, vegetable and fruit consumption trends among Korean adults: Data from the Korea National Health and Nutrition Examination Survey (1998–2012). Nutr. Res. Pract. 2016, 10, 188–197. [Google Scholar] [CrossRef] [Scilit]
- Rippin, H.L.; Maximova, K.; Loyola, E.; Breda, J.; Wickramasinghe, K.; Ferreira-Borges, C.; Berdzuli, N.; Hajihosseini, M.; Novik, I.; Pisaryk, V.; et al. Suboptimal intake of fruits and vegetables in nine selected countries of the World Health Organization European Region. Prev. Chronic Dis. 2023, 20, E104. [Google Scholar] [CrossRef] [Scilit] [PubMed]
- Smith, L.; López Sánchez, G.F.; Tully, M.A.; Barnett, Y.; Butler, L.; Keyes, H.; Jacob, L.; Kostev, K.; Oh, H.; Rahmati, M.; et al. Temporal trends in inadequate vegetable and fruit consumption among adolescents aged 12-15 years from 31 countries in Asia, Africa, and the Americas. Health Sci. Rep. 2025, 8, e70711. [Google Scholar] [CrossRef] [Scilit]
- Du, H.; Li, L.; Bennett, D.; Guo, Y.; Turnbull, I.; Yang, L.; Bragg, F.; Bian, Z.; Chen, Y.; Chen, J.; et al. Fresh fruit consumption in relation to incident diabetes and diabetic vascular complications: A 7-year prospective study of 0.5 million Chinese adults. PLoS Med. 2017, 14, e1002279. [Google Scholar] [CrossRef] [Scilit]
- Halvorsen, R.E.; Elvestad, M.; Molin, M.; Aune, D. Fruit and vegetable consumption and the risk of type 2 diabetes: A systematic review and dose-response meta-analysis of prospective studies. BMJ Nutr. Prev. Health 2021, 4, 519–531. [Google Scholar] [CrossRef] [Scilit]
- Li, M.; Fan, Y.; Zhang, X.; Hou, W.; Tang, Z. Fruit and vegetable intake and risk of type 2 diabetes mellitus: Meta-analysis of prospective cohort studies. BMJ Open 2014, 4, e005497. [Google Scholar] [CrossRef] [Scilit] [PubMed]
- Della Corte, K.A.; Bosler, T.; McClure, C.; Buyken, A.E.; LeCheminant, J.D.; Schwingshackl, L.; Della Corte, D. Dietary sugar intake and incident type 2 diabetes risk: A systematic review and dose-response meta-analysis of prospective cohort studies. Adv. Nutr. 2025, 16, 100413. [Google Scholar] [CrossRef] [Scilit]
- D’Elia, L.; Dinu, M.; Sofi, F.; Volpe, M.; Strazzullo, P. 100% fruit juice intake and cardiovascular risk: A systematic review and meta-analysis of prospective and randomised controlled studies. Eur. J. Nutr. 2021, 60, 2449–2467. [Google Scholar] [CrossRef] [Scilit] [PubMed]
- Lee, C.W.; Myung, S.K. Consumption of fruit juice and risk of type 2 diabetes mellitus: A systematic review and meta-analysis of prospective cohort studies. Am. J. Med. 2025, 138, 1428–1437. [Google Scholar] [CrossRef] [Scilit]
- Wang, P.; Fang, J.; Gao, Z.; Zhang, C.; Xie, S. Higher intake of fruits, vegetables or their fiber reduces the risk of type 2 diabetes: A meta-analysis. J. Diabetes Investig. 2016, 7, 56–69. [Google Scholar] [CrossRef] [Scilit]
- Li, S.; Miao, S.; Huang, Y.; Liu, Z.; Tian, H.; Yin, X.; Tang, W.; Steffen, L.M.; Xi, B. Fruit intake decreases risk of incident type 2 diabetes: An updated meta-analysis. Endocrine 2015, 48, 454–460. [Google Scholar] [CrossRef] [Scilit] [PubMed]
- Mauvais-Jarvis, F. Sex differences in metabolic homeostasis, diabetes, and obesity. Biol. Sex Differ. 2015, 6, 14. [Google Scholar] [CrossRef] [Scilit] [PubMed]
- Ahmed, A.; Lager, A.; Fredlund, P.; Elinder, L.S. Consumption of fruit and vegetables and the risk of type 2 diabetes: A 4-year longitudinal study among Swedish adults. J. Nutr. Sci. 2020, 9, e14. [Google Scholar] [CrossRef] [Scilit] [PubMed]
- Williams, D.E.; Wareham, N.J.; Cox, B.D.; Byrne, C.D.; Hales, C.N.; Day, N.E. Frequent salad vegetable consumption is associated with a reduction in the risk of diabetes mellitus. J. Clin. Epidemiol. 1999, 52, 329–335. [Google Scholar] [CrossRef] [Scilit]


| Study | Country, (Study Name) | Outcome Assessment | Participants (Prediabetes/NGT) | Age Range (Years) | Dietary Assessment | Definition of Fruit and Vegetable Consumption | Categories of Exposure (Highest vs. Lowest Category) | OR (95%CI) | Adjusted Variables |
|---|---|---|---|---|---|---|---|---|---|
| Cross-sectional study | |||||||||
| 2013 Ortega [23] | Spain (The Di@bet.es Study) | Impaired glucose tolerance (IGT) and/or impaired fasting glucose (IFG) according to the 1999 WHO criteria | 4598 (826/3772) | ≥18 | FFQ. Interviewer administered | MedDiet score | High (>26) vs. low (<23) | 0.79 (0.63–0.98) | Age, BMI and WC, sex, educational level, civil status, hypertension, dyslipidemia, physical exercise, smoking status, family history of diabetes in 1st-degree relatives |
| 2013 Vlassopoulos [24] | United Kingdom (The Scottish Health Surveys) | Glycated hemoglobin (HbA1c) between 5.7% (39 mmol/mol) and 6.4% (46 mmol/mol) | 5546 (1391/4155) | 18–95 | 24 h dietary recall. Interviewer administered | Fruit and vegetable | Yes vs. no | 0.98 (0.95–1.01) | Age, sex, ethnic group, social class, physical activity level, CRP, BMI, waist circumference, year of study, smoking status |
| 2015 Zhang [25] | China | Fasting plasma glucose (FPG) concentration of 110–126 mg/dL (6.1–7.0 mmol/L) | 1459 (132/1327) | 20–75 | One-month dietary recall. Interviewer administered | Vegetable–fruit pattern | Highest tertile (T3) vs. lowest tertile (T1) | 0.57 (0.34–0.95) | Age, BMI, total energy intake, drinking status, smoking status, physical activity status |
| 2018 Breuninger [27] | Germany (Cooperative Health Research in the Region of Augsburg (KORA) FF4 study) | IFG (5.6–6.9 mmol/L fasting glucose), IGT (7.8–11.0 mmol/L 2 h glucose) or the combination of both according to the 2003 ADA criteria | 1334 (545/789) | 46–71 | 24 h dietary recall and FFQ. Self-administered | Vegetables | One standard deviation vs. habitual dietary intake | 1.01 (0.86–1.18) | Age, sex, energy intake, BMI, waist circumference, family history of diabetes, physical activity, smoking, education, hypertention |
| 2019 Abdulai [28] | China | IFG (6.1–6.99 mmol/L) according to the WHO criteria | 35,410 (2670/32,740) | ≥20 | FFQ. Interviewer administered | Fruits/vegetables | Yes vs. no | 0.77 (0.71–0.84) | Age, gender, smoking, drinking, exercise, hypertension, family history of diabetes, waist circumference, BMI, metabolic syndrome, dyslipidaemia |
| 2019 Vonglokham [29] | Laos | FPG levels 6.1 to <7.0 mmol/L | 2347 (56/2291) | 18–64 | FFQ. Interviewer administered | Fruit and vegetable | >5 servings/d vs. no | 1.07 (0.37–1.48) | Age, sex, education, marital status, ethno-linguistic group, urban residence, BMI, central obesity, physical activity, high sitting time, current tobacco, drinking, hypertensive, raised cholesterol |
| 2020 Gbadamosi [30] | Swaziland | IFG and IGT were defined according to the WHO criteria | 357 (25/332) | ≥18 | FFQ. Self-administered | Vegetables | ≥3 servings/d vs. no | 0.05 (0.02–0.15) | Smoking, consumption of salty processed foods, consumption of fruits |
| 2021 AI-Sharafi [31] | Yemen | IFG 100–125 mg/dL, and oral glucose tolerance test (OGTT) (75 g glucose 2 h) or HbA1c 5.7–6.4% according to the ADA criteria | 547 (208/339) | 20–70 | FFQ. Interviewer administered | Fruit and vegetable | Yes vs. no | 0.93 (0.59–1.46) | None |
| 2021 Falguera [32] | Spain (The Mollerussa Prospective Observational Cohort Study) | FPG from 100 mg/dL to <126 mg/dL or HbA1c from 5.7% to <6.5% | 535 (216/319) | ≥25 | FFQ, Interviewer administered | aMED score | Highest tertile (5–8) vs. lowest tertile (0–3) | 1.26 (0.75–2.10) | Age, sex, BMI, education level, hypertension, dyslipidemia, physical activity |
| 2021 Wu [33] | China (The China Health and Nutrition Survey (CHNS)) | FPG from ≥6.1 to <7.0 mmol/L or HbAlc from ≥5.7% to <6.5% (Association AD 2018; Chinese Diabetes Society 2018) | 6228 (1980/4248) | 18–65 | 24 h dietary recall. Interviewer administered | Fruit and vegetable | Highest quintile (≥533.3 g/d) vs. lowest quintile (<229.8 g/d) | 0.67 (0.56–0.80) | Age, residence, education level, smoking status, alcohol intake, history of hypertension, daily energy intake, leisure physical activity, BMI, red meat intake, whole grains intake, legumes intake |
| 2021 Xia [34] | China | Defined following the WHO criteria | 45,892 (1643/44,249) | 45–101 | FFQ. Interviewer administered | Vegetable | ≥100 g/d vs. <100 g/d | 1.46 (1.32–1.61) | Age, sex, education, income, comorbidities, smoking, drinking, sleep duration, family history of diabetes, BMI, abdominal obesity |
| 2021 Xue [35] | China | 5.6 mmol/L ≤ FPG < 7.0 mmol/L or 5.7% < HbA1c < 6.5% according to the 2018 ADA criteria | 35,125 (2634/32,491) | 18–79 | FFQ. Interviewer administered | Vegetable–fruit pattern | Highest quintile (Q5) vs. lowest quintile (Q1) | 0.68 (0.57–0.82) | Age, region, gender, education level, marital status, per capita monthly income, BMI, smoking, alcohol drinking, physical activity, family history of diabetes, energy |
| 2022 Luo [37] | China (The Qingdao Diabetes Prevention Program) | 5.6 mmol/L ≤ FPG < 7.0 mmol/L or 7.8 mmol/L ≤ 2 h PG < 11.1 mmol/L according to the 2018 ADA criteria | 3681 (1330/2351) | 35–74 | FFQ. Interviewer administered | Fruit–vegetable pattern | Highest quartile (Q4) vs. lowest quartile (Q1) | 0.90 (0.73–1.11) | Age, sex, educational attainment, marital status, urban-rural distribution, personal monthly income, family history of diabetes, occupational physical activity, smoking, hypertension, BMI, TG, total energy intake |
| 2022 Wang [38] | USA (Hispanic Community Health Study-Study of Latino) | FPG ≥ 100 mg/dL (5.5 mmol/L) and <126 mg/dL (7 mmol/L); a 2 h post-load glucose level (2 hPG) ≥ 140 mg/dL (7.7 mmol/L) and <200 mg/dL (11.2 mmol/L); A1c level ≥ 5.7% (39 mmol/mol) and <6.5% according to the ADA criteria | 1199 (805/394) | 23–83 | 24 h dietary recall. Interviewer administered | MedDiet index | Highest tertile (mean 36.2) vs. lowest tertile (mean 27.4) | 0.64 (0.39–1.05) | Age, sex, total energy intake, physical activity, metformin use, antibiotic use, probiotic use, place of birth, age at relocation to the us mainland, Bristol stool scale, BMI |
| 2022 Yu [39] | Netherland (The Maastricht Study) | FPG of 6.1–6.9 mmol/L and no hypoglycaemic medications (GMS score = 1) according to the 2006 WHO criteria | 2474 (514/1960) | 40–75 | FFQ. Self-administered | MED score | Highest tertile (6–9) vs. lowest tertile (0–3) | 0.79 (0.61–0.97) | Age, sex, BMI, level of education, level of household income, smoking status, daily energy intake, daily glucose intake, estimated glomerular filtration rate, total physical activity, usage of lipid-modification medication, history of cardiovascular disease, the year for metabolomics measurement |
| 2023 Hou [41] | Taiwan | Abnormal fasting glucose referred to 100–125 mg/dL and abnormal glycated hemoglobin referred to 5.7–6.4% according to the ADA criteria | 242 (147/95) | 20–65 | 24 h dietary recall. Interviewer administered | Vegetables | ≥2 servings/d vs. none | 0.44 (0.21–0.92) | Age, gender, BMI |
| Case–control study | |||||||||
| 2016 Bagheri [26] | Iran | Fasting blood glucose (FBG) between 5.6 and 6.9 mmol/L or OGTT 7.8–11 mmol/L | 300 (150/150) | 35–65 | FFQ. Interviewer administered | VFL dietary pattern | Highest tertile (T3) vs. lowest tertile (T1) | 0.16 (0.10–0.26) | Age, education, physical activity, BMI, energy intake |
| Cohort study | |||||||||
| 2022 Barouti [36] | Sweden (The Stockholm Diabetes Prevention Program (SDPP)) | IFG 6.1–6.9 and 2 h glucose < 7.8 mmol/L; IGT < 6.1 and 2 h glucose 7.8–11.0 mmol/L according to the 1999 WHO criteria | 5997 (870/5127) | 35–65 | FFQ. Self-administered | Total fruit and vegetable | Highest tertile (T3) vs. lowest tertile (T1) | 1.00 (0.66–1.54) | Age, family history of diabetes, education, socioeconomic index group, high blood pressure, physical activity, smoking, alcohol, wholegrain intake, yoghurt/sour milk intake, BMI |
| 2022 Zhang [40] | China (The Tianjin Chronic Low-grade Systemic Inflammation and Health (TCLSIH) Cohort Study) | FPG of 5.6–6.9 mmol/L, and/or 2 h plasma glucose of 7.8–11.0 mmol/L in the oral glucose tolerance test, and/or an HbA1c of 5.7–6.4% (36–46 mmol/mol) without a history of diabetes according to the ADA criteria | 18,085 (4139/13,946) | 18–90 | FFQ. Self-administered | Vegetable fiber | Highest quartile (Q4) vs. lowest quartile (Q1) | 1.03 (0.93–1.13) | Age, sex, baseline BMI, smoking status, alcohol drinking status, educational level, occupation, household income per month, physical activity, metabolic syndrome, family history of disease, long-term use of medications, total energy intake, total protein intake, total fat intake, added sugar intake, intake of the other fiber sources |
| 2023 Li [42] | China (The China Cardiometabolic Disease and Cancer Cohort Study) | Either IFG (FPG 5.6–6.9 mmol/L, and OGTT 2 hPG < 7.8 mmol/L), IGT (FPG < 7.0 mmol/L and OGTT 2 hPG 7.8–11.0 mmol/L) or combined IFG/IGT | 21,031 (4379/16,652) | ≥40 | FFQ. Interviewer administered | 100 g/d intake of fresh fruit | Yes vs. no | 0.95 (0.92–0.99) | Age, sex, BMI, waist circumference, physical activity, sedentary time, smoking and drinking status, education level, family history of diabetes, triglycerides, LDL-C, HDL-C |
| Cross-Sectional and Case–Control Study (n = 17) | Selection | Comparability | Exposure | Total | ||||||
| 1 | 2 | 3 | 4 | 5A | 5B | 6 | 7 | 8 | ||
| 2013 Ortega [23] | 1 | 1 | 1 | 0 | 1 | 1 | 0 | 1 | 0 | 6 |
| 2013 Vlassopoulos [24] | 1 | 1 | 1 | 0 | 1 | 1 | 0 | 1 | 0 | 6 |
| 2015 Zhang [25] | 1 | 1 | 1 | 1 | 1 | 1 | 0 | 1 | 0 | 7 |
| 2016 Bagheri [26] | 1 | 1 | 1 | 1 | 1 | 1 | 0 | 1 | 1 | 8 |
| 2018 Breuninger [27] | 1 | 1 | 1 | 1 | 1 | 1 | 0 | 1 | 1 | 8 |
| 2019 Abdulai [28] | 1 | 1 | 1 | 1 | 1 | 1 | 0 | 1 | 0 | 7 |
| 2019 Vonglokham [29] | 1 | 1 | 1 | 0 | 1 | 1 | 0 | 1 | 0 | 6 |
| 2020 Gbadamosi [30] | 1 | 1 | 0 | 0 | 0 | 1 | 0 | 1 | 0 | 4 |
| 2021 AI-Sharafi [31] | 1 | 1 | 1 | 1 | 0 | 0 | 0 | 1 | 0 | 5 |
| 2021 Falguera [32] | 1 | 1 | 1 | 1 | 1 | 1 | 0 | 1 | 1 | 8 |
| 2021 Wu [33] | 1 | 1 | 1 | 1 | 1 | 1 | 0 | 1 | 1 | 8 |
| 2021 Xia [34] | 1 | 1 | 1 | 1 | 1 | 1 | 0 | 1 | 1 | 8 |
| 2021 Xue [35] | 1 | 1 | 1 | 1 | 1 | 1 | 0 | 1 | 1 | 8 |
| 2022 Luo [37] | 1 | 1 | 1 | 1 | 1 | 1 | 0 | 1 | 1 | 8 |
| 2022 Wang [38] | 1 | 1 | 1 | 0 | 1 | 1 | 0 | 1 | 0 | 6 |
| 2022 Yu [39] | 1 | 1 | 1 | 0 | 1 | 1 | 0 | 1 | 1 | 7 |
| 2023 Hou [41] | 1 | 1 | 0 | 1 | 1 | 1 | 0 | 1 | 1 | 7 |
| Cohort study (n = 3) | Selection | Comparability | Exposure | |||||||
| 1 | 2 | 3 | 4 | 5A | 5B | 6 | 7 | 8 | ||
| 2022 Barouti [36] | 1 | 1 | 0 | 1 | 1 | 1 | 1 | 1 | 0 | 7 |
| 2022 Zhang [40] | 1 | 1 | 0 | 1 | 1 | 1 | 1 | 1 | 1 | 8 |
| 2023 Li [42] | 1 | 1 | 1 | 1 | 1 | 1 | 1 | 0 | 1 | 8 |
| Factors | Number of Studies | Summary OR (95% CI) | Heterogeneity, I2 (%) |
|---|---|---|---|
| Study design | |||
| Cross-sectional study | 16 | 0.81 (0.70–0.94) | 91.6 |
| Cohort study | 3 | 0.97 (0.92–1.02) | 15.1 |
| Case–control study | 1 | 0.16 (0.10–0.26) | 0.0 |
| Sex | |||
| Men | 4 | 0.77 (0.61–0.97) | 63.3 |
| Women | 3 | 0.97 (0.69–1.37) | 82.1 |
| Age | |||
| 65 years and younger | 5 | 0.55 (0.30–1.01) | 89.9 |
| 40 years and older | 4 | 1.04 (0.81–1.33) | 95.5 |
| Dietary patterns | |||
| Vegetable | 8 | 0.86 (0.69–1.07) | 94.4 |
| Fruit | 9 | 0.82 (0.71–0.94) | 93.1 |
| Fruit and vegetable | 10 | 0.72 (0.60–0.87) | 91.9 |
| Mediterranean diet | 5 | 0.77 (0.60–1.00) | 54.4 |
| Fruits-vegetables pattern | 4 | 0.50 (0.29–0.87) | 92.9 |
| Definition of prediabetes | |||
| ADA | 7 | 0.85 (0.72–1.01) | 73.8 |
| WHO | 6 | 0.73 (0.50–1.07) | 96.3 |
| Assessment of outcome | |||
| IFG | 18 | 0.75 (0.66–0.85) | 88.3 |
| IGT | 10 | 0.74 (0.61–0.89) | 90.5 |
| HbA1c | 6 | 0.84 (0.71–1.00) | 87.0 |
| Region | |||
| America | 1 | 0.64 (0.39–1.05) | 0.0 |
| Asia | 10 | 0.86 (0.73–1.01) | 93.3 |
| Europe | 7 | 0.84 (0.68–1.04) | 85.5 |
| Methodological quality | |||
| High quality | 14 | 0.80 (0.69–0.93) | 92.8 |
| Moderate quality | 6 | 0.68 (0.48–0.98) | 87.4 |
Disclaimer/Publisher’s Note: The statements, opinions and data contained in all publications are solely those of the individual author(s) and contributor(s) and not of MDPI and/or the editor(s). MDPI and/or the editor(s) disclaim responsibility for any injury to people or property resulting from any ideas, methods, instructions or products referred to in the content. |
© 2026 by the authors. Licensee MDPI, Basel, Switzerland. This article is an open access article distributed under the terms and conditions of the Creative Commons Attribution (CC BY) license.
Share and Cite
Hong, S.-H.; Bae, Y.-J. Effects of Dietary Fruit and Vegetable Consumption on Prediabetes: A Systematic Review and Meta-Analysis. Nutrients 2026, 18, 1391. https://doi.org/10.3390/nu18091391
Hong S-H, Bae Y-J. Effects of Dietary Fruit and Vegetable Consumption on Prediabetes: A Systematic Review and Meta-Analysis. Nutrients. 2026; 18(9):1391. https://doi.org/10.3390/nu18091391
Chicago/Turabian StyleHong, Seung-Hee, and Yun-Jung Bae. 2026. "Effects of Dietary Fruit and Vegetable Consumption on Prediabetes: A Systematic Review and Meta-Analysis" Nutrients 18, no. 9: 1391. https://doi.org/10.3390/nu18091391
APA StyleHong, S.-H., & Bae, Y.-J. (2026). Effects of Dietary Fruit and Vegetable Consumption on Prediabetes: A Systematic Review and Meta-Analysis. Nutrients, 18(9), 1391. https://doi.org/10.3390/nu18091391