Prospective Associations of Serum Vitamin B12, Homocysteine, and Ferritin Levels with Probable Sarcopenia


Abstract
1. Introduction
2. Participants and Methods
2.1. Study Design and Participants
2.2. HS Measurement and PS as an Outcome
2.3. Assay of Serum Biomarkers
2.4. Confounding Variables
2.5. Statistical Analysis
3. Results
3.1. Baseline Characteristics by HS Quartiles
3.2. Associations of Serum Vitamin B12, Folate, Hcy, and Ferritin Quartiles with PS Risk
3.3. Associations of Serum Vitamin B12, Folate, Hcy, and Ferritin Categories with PS Risk in All, Male, and Female Participants
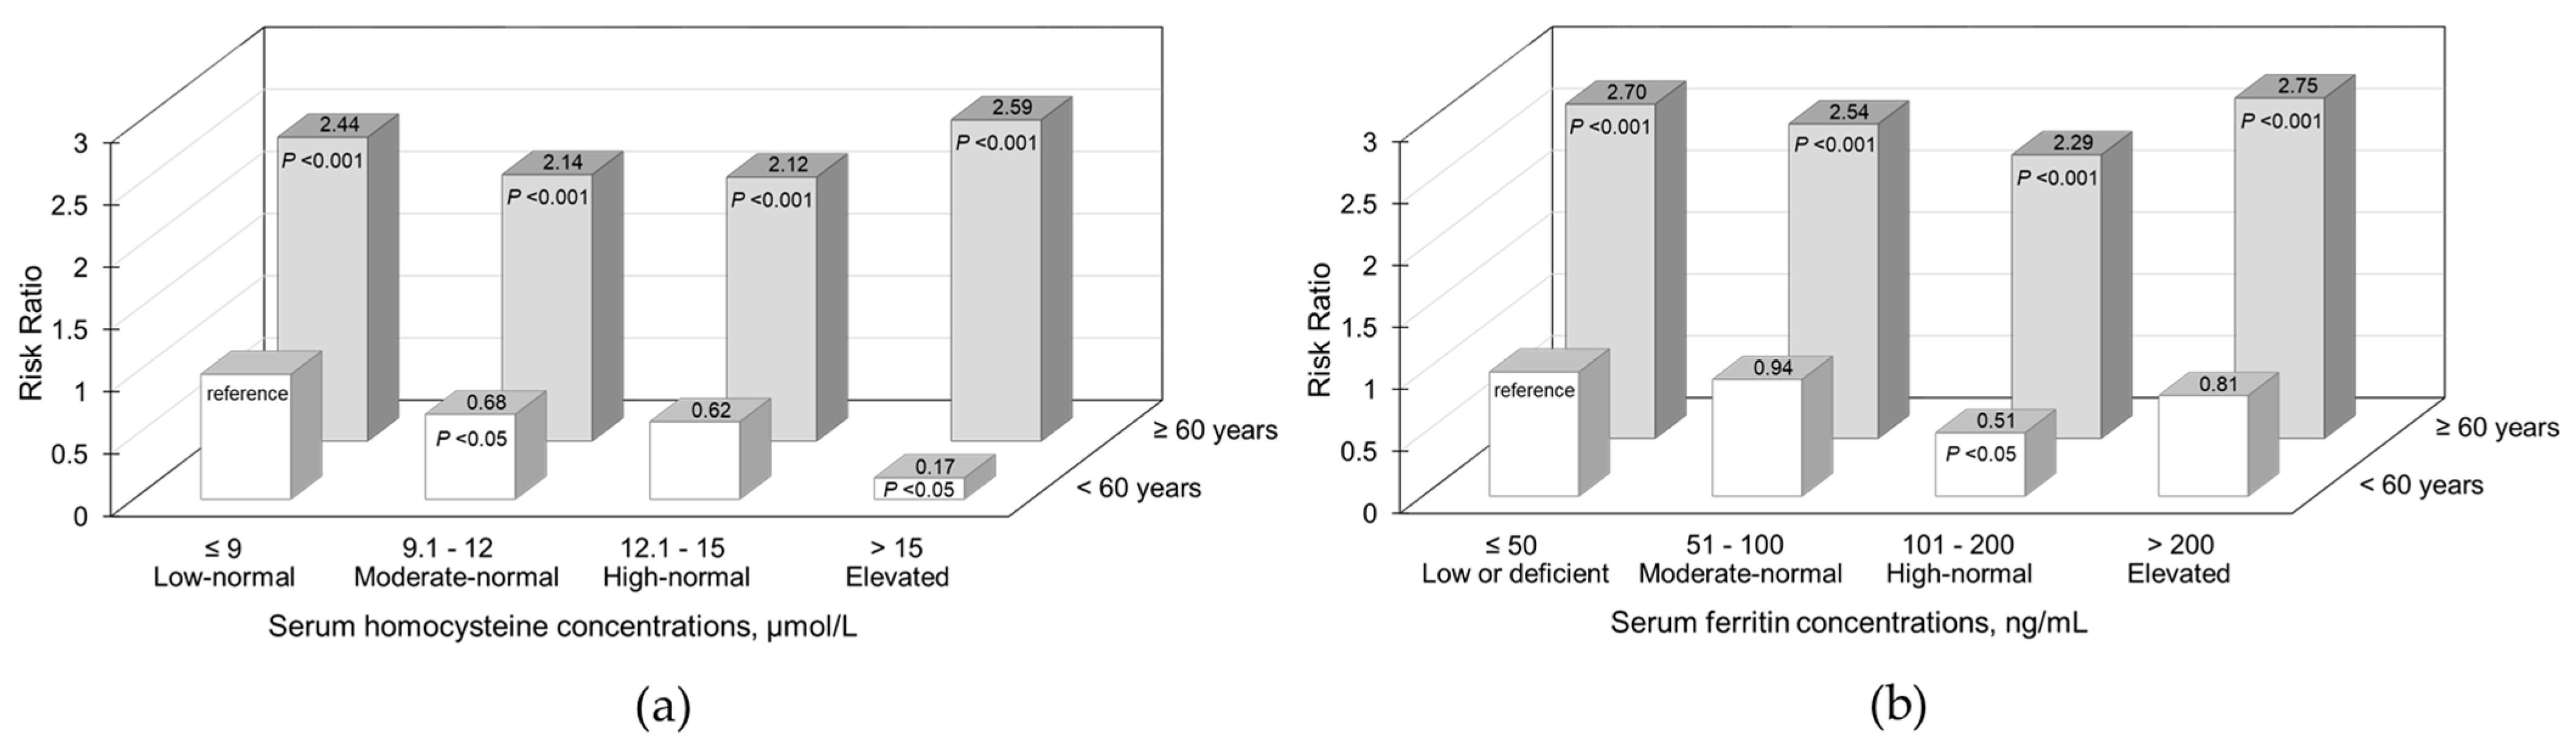
3.4. Joint Associations of Serum Hcy and Ferritin Levels and Risk Factors with PS Risk
4. Discussion
5. Conclusions
Supplementary Materials
Funding
Institutional Review Board Statement
Informed Consent Statement
Data Availability Statement
Conflicts of Interest
Abbreviations
| ANOVA | analysis of variance |
| AST | aspartate transaminase |
| BMI | body mass index |
| CI | confidence interval |
| Cr | creatinine |
| CVD | cardiovascular disease |
| DM | diabetes mellitus |
| FFQ | food frequency questionnaire |
| HS | handgrip strength |
| Hb | hemoglobin |
| Hcy | homocysteine |
| hs-CRP | high-sensitivity C-reactive protein |
| HTN | hypertension |
| KNIH | Korea National Institute of Health |
| KoGES | Korean Genome and Epidemiology Study |
| MMP | muscle mass percentage |
| RR | risk ratio |
| SD | standard deviation |
| PS | probable sarcopenia |
| TS | transsulfuration |
| UA | uric acid |
| WBC | white blood cell |
References
- Kirk, B.; Cawthon, P.M.; Arai, H.; Ávila-Funes, J.A.; Barazzoni, R.; Bhasin, S.; Binder, E.F.; Bruyere, O.; Cederholm, T.; Chen, L.K.; et al. Global Leadership Initiative in Sarcopenia (GLIS) group. The Conceptual Definition of Sarcopenia: Delphi Consensus from the Global Leadership Initiative in Sarcopenia (GLIS). Age Ageing 2024, 53, afae052. [Google Scholar] [CrossRef] [Scilit]
- Cruz-Jentoft, A.J.; Bahat, G.; Bauer, J.; Boirie, Y.; Bruyère, O.; Cederholm, T.; Cooper, C.; Landi, F.; Rolland, Y.; Sayer, A.A.; et al. Sarcopenia: Revised European consensus on definition and diagnosis. Age Ageing 2019, 48, 16–31. [Google Scholar] [CrossRef] [Scilit]
- Chen, L.K.; Woo, J.; Assantachai, P.; Auyeung, T.W.; Chou, M.Y.; Iijima, K.; Jang, H.C.; Kang, L.; Kim, M.; Kim, S.; et al. Asian Working Group for Sarcopenia: 2019 Consensus Update on Sarcopenia Diagnosis and Treatment. J. Am. Med. Dir. Assoc. 2020, 21, 300–307.e2. [Google Scholar] [CrossRef] [Scilit]
- Ribeiro, L.W.; Berndt, S.; Mielke, G.I.; Doust, J.; Mishra, G.D. Factors associated with handgrip strength across the life course: A systematic review. J. Cachexia Sarcopenia Muscle 2024, 15, 2270–2280. [Google Scholar] [CrossRef] [Scilit]
- Swart, K.M.; van Schoor, N.M.; Heymans, M.W.; Schaap, L.A.; den Heijer, M.; Lips, P. Elevated homocysteine levels are associated with low muscle strength and functional limitations in older persons. J. Nutr. Health Aging 2013, 17, 578–584. [Google Scholar] [CrossRef] [Scilit]
- Swart, K.M.A.; Enneman, A.W.; Van Wijngaarden, J.P.; Van Dijk, S.C.; Brouwer-Brolsma, E.M.; Ham, A.C.; Dhonukshe-Rutten, R.A.M.; van der Velde, N.; Brug, J.; Van Meurs, J.B.J.; et al. Homocysteine and the methylenetetrahydrofolate reductase 677C→T polymorphism in relation to muscle mass and strength, physical performance and postural sway. Eur. J. Clin. Nutr. 2013, 67, 743–748. [Google Scholar] [CrossRef] [Scilit]
- Vidoni, M.L.; Pettee Gabriel, K.; Luo, S.T.; Simonsick, E.M.; Day, R.S. Relationship between homocysteine and muscle strength decline: The Baltimore Longitudinal Study of Aging. J. Gerontol. A Biol. Sci. Med. Sci. 2018, 73, 546–551. [Google Scholar] [CrossRef] [Scilit]
- Ao, M.; Inuiya, N.; Ohta, J.; Kurose, S.; Takaoka, H.; Abe, Y.; Niki, N.; Inoue, S.; Tanaka, S.; Miyawaki, T.; et al. Relationship between Homocysteine, Folate, Vitamin B12 and Physical Performance in the Institutionalized Elderly. J. Nutr. Sci. Vitaminol. 2019, 65, 1–7. [Google Scholar] [CrossRef] [Scilit] [PubMed]
- García-Alfaro, P.; Rodriguez, I.; Pérez-López, F.R. Plasma homocysteine levels and handgrip strength in postmenopausal women. Climacteric 2022, 25, 504–509. [Google Scholar] [CrossRef] [Scilit] [PubMed]
- Kumar, A.; Palfrey, H.A.; Pathak, R.; Kadowitz, P.J.; Gettys, T.W.; Murthy, S.N. The metabolism and significance of homocysteine in nutrition and health. Nutr. Metab. 2017, 14, 78. [Google Scholar] [CrossRef] [Scilit] [PubMed]
- Tseng, S.H.; Lee, W.J.; Peng, L.N.; Lin, M.H.; Chen, L.K. Associations between hemoglobin levels and sarcopenia and its components: Results from the I-Lan longitudinal study. Exp. Gerontol. 2021, 150, 111379. [Google Scholar] [CrossRef] [Scilit]
- Wang, H.; Lin, P. Association between sarcopenia and hemoglobin level: A systematic review and meta-analysis. Front. Med. 2024, 11, 1424227. [Google Scholar] [CrossRef] [Scilit] [PubMed]
- Ho, V.; Lee, C.T.; Merchant, R.A. The “Iron Tale”—Iron indices and handgrip strength in community-dwelling adults. Aging Clin. Exp. Res. 2022, 34, 3025–3032. [Google Scholar] [CrossRef] [Scilit] [PubMed]
- Tounaoua, M.R.; Chen, H.; Shaibu, Z.; Guo-Yang, Z. Correlation between iron accumulation and sarcopenia in middle-aged and elderly populations. BMC Musculoskelet. Disord. 2025, 26, 638. [Google Scholar] [CrossRef] [Scilit] [PubMed]
- Finch, C.A.; Stray, S.; Huebers, H.A.; Bellotti, V.; Lipschitz, D.A.; Cook, J.D.; Pippard, M.J. Plasma ferritin determination as a diagnostic tool. West. J. Med. 1986, 145, 657–663. [Google Scholar]
- Kim, Y.; Han, B.G.; KoGES Group. Cohort Profile: The Korean Genome and Epidemiology Study (KoGES) Consortium. Int. J. Epidemiol. 2017, 46, e20. [Google Scholar] [CrossRef] [Scilit]
- Lee, J.Y.; Jun, N.R.; Yoon, D.; Shin, C.; Baik, I. Association between dietary patterns in the remote past and telomere length. Eur. J. Clin. Nutr. 2015, 69, 1048–1052. [Google Scholar] [CrossRef] [Scilit]
- Janssen, I.; Heymsfield, S.B.; Ross, R. Low relative skeletal muscle mass (sarcopenia) in older persons is associated with functional impairment and physical disability. J. Am. Geriatr. Soc. 2002, 50, 889–896. [Google Scholar] [CrossRef] [Scilit]
- Celis-Morales, C.A.; Petermann, F.; Hui, L.; Lyall, D.M.; Iliodromiti, S.; McLaren, J.; Anderson, J.; Welsh, P.; Mackay, D.F.; Pell, J.P.; et al. Associations between diabetes and both cardiovascular disease and all-cause mortality are modified by grip strength: Evidence from UK Biobank, a prospective population-based cohort study. Diabetes Care 2017, 40, 1710–1718. [Google Scholar] [CrossRef] [Scilit]
- Chen, Z.; Chen, J.; Song, C.; Sun, J.; Liu, W. Association between serum iron status and muscle mass in adults: Results from NHANES 2015–2018. Front. Nutr. 2022, 9, 941093. [Google Scholar] [CrossRef] [Scilit]
- Rural Living Science Institute. Food Composition Table, 6th ed.; Rural Development Administration of Korea: Suwon, Republic of Korea, 2001. [Google Scholar]
- Adams, P.C.; Reboussin, D.M.; Barton, J.C.; McLaren, C.E.; Eckfeldt, J.H.; McLaren, G.D.; Dawkins, F.W.; Acton, R.T.; Harris, E.L.; Gordeuk, V.R.; et al. Hemochromatosis and Iron Overload Screening (HEIRS) Study Research Investigators. Hemochromatosis and iron-overload screening in a racially diverse population. N. Engl. J. Med. 2005, 352, 1769–1778. [Google Scholar] [CrossRef] [Scilit] [PubMed]
- Malinow, M.R.; Bostom, A.G.; Krauss, R.M. Homocyst(e)ine, diet, and cardiovascular diseases: A statement for healthcare professionals from the Nutrition Committee, American Heart Association. Circulation 1999, 99, 178–182. [Google Scholar] [CrossRef] [Scilit]
- Yuan, S.; Larsson, S.C. Epidemiology of sarcopenia: Prevalence, risk factors, and consequences. Metabolism 2023, 144, 155533. [Google Scholar] [CrossRef] [Scilit]
- Robinson, S.; Granic, A.; Sayer, A.A. Micronutrients and sarcopenia: Current perspectives. Proc. Nutr. Soc. 2021, 80, 311–318. [Google Scholar] [CrossRef] [Scilit]
- Al-Naseem, A.; Sallam, A.; Choudhury, S.; Thachil, J. Iron deficiency without anaemia: A diagnosis that matters. Clin. Med. 2021, 21, 107–113. [Google Scholar] [CrossRef] [Scilit] [PubMed]
- Ryan, B.J.; Foug, K.L.; Gioscia-Ryan, R.A.; Ludzki, A.C.; Ahn, C.; Schleh, M.W.; Gillen, J.B.; Chenevert, T.L.; Horowitz, J.F. Skeletal muscle ferritin abundance is tightly related to plasma ferritin concentration in adults with obesity. Exp. Physiol. 2020, 105, 1808–1814. [Google Scholar] [CrossRef] [Scilit]
- Papatheodorou, L.; Weiss, N. Vascular oxidant stress and inflammation in hyperhomocysteinemia. Antioxid. Redox Signal. 2007, 9, 1941–1958. [Google Scholar] [CrossRef] [Scilit]
- Buonocore, D.; Rucci, S.; Vandoni, M.; Negro, M.; Marzatico, F. Oxidative system in aged skeletal muscle. Muscles Ligaments Tendons J. 2012, 1, 85–90. [Google Scholar] [PubMed]
- Papet, I.; Rémond, D.; Dardevet, D.; Mosoni, L.; Polakof, S.; Peyron, M.A.; Savary-Auzeloux, I. Sulfur amino acids and skeletal muscle. In Nutrition and Skeletal Muscle; Walrand, S., Ed.; Academic Press: Cambridge, MA, USA, 2019; pp. 335–363. [Google Scholar] [CrossRef] [Scilit]


| Characteristics | Sex-Specific Quartiles of Absolute Handgrip Strength | p Value for Trend 1 | |||
|---|---|---|---|---|---|
| 1st Quartile | 2nd Quartile | 3rd Quartile | 4th Quartile | ||
| Number of participants | 482 | 488 | 485 | 475 | |
| Relative handgrip strength | 0.77 ± 0.30 | 1.0 ± 0.4 | 1.2 ± 0.40 | 1.4 ± 0.4 | <0.001 |
| Age, years | 66.1 ± 7.2 | 62.0 ± 7.6 | 57.6 ± 7.0 | 53.7 ± 5.8 | <0.001 |
| Body mass index, kg/m2 | 24.3 ± 3.3 | 24.3 ± 3.0 | 25.0 ± 3.1 | 25.1 ± 3.1 | <0.001 |
| Muscle mass percentage | 68.8 ± 7.3 | 69.8 ± 7.2 | 69.8 ± 7.1 | 70.8 ± 6.9 | <0.001 |
| Low income 2, % | 87.3 | 79.7 | 69.1 | 57.3 | <0.001 |
| High school or higher, % | 14.7 | 21.1 | 27.8 | 40.4 | <0.001 |
| Office worker, % | 1.2 | 3.7 | 6.6 | 7.0 | <0.001 |
| Current smoker, % | 16.2 | 15.8 | 16.9 | 20.4 | 0.07 |
| Current alcohol drinker, % | 40.7 | 40.6 | 46.8 | 53.3 | <0.001 |
| Regular exercise ≥ 5 days/week, % | 9.8 | 8.8 | 13.4 | 12.8 | <0.05 |
| Presence of chronic diseases 3, % | 52.3 | 50.0 | 46.8 | 43.0 | <0.01 |
| Dietary protein intake, g/day | 52.9 ± 26.6 | 55.9 ± 34.0 | 58.4 ± 37.3 | 60.4 ± 34.6 | <0.001 |
| Blood biomarkers | |||||
| Vitamin B12, pg/mL | 573.0 ± 339.0 | 601.5 ± 248.9 | 628.4 ± 334.2 | 625.6 ± 283.8 | <0.01 |
| Folate, ng/mL | 7.3 ± 4.1 | 7.6 ± 4.8 | 7.7 ± 4.4 | 7.7 ± 4.2 | 0.23 |
| Homocysteine, μmol/L | 12.4 ± 4.4 | 11.6 ± 3.2 | 11.2 ± 3.9 | 11.1 ± 4.7 | <0.001 |
| Ferritin, ng/mL | 139.8 ± 137.2 | 130.9 ± 117.6 | 141.8 ± 141.4 | 136.6 ± 125.4 | 0.96 |
| White blood cell count, thousand/μL | 6.3 ± 1.7 | 6.0 ± 1.5 | 6.2 ± 1.7 | 6.0 ± 1.7 | <0.05 |
| Hemoglobin, g/dL | 13.8 ± 1.1 | 13.9 ± 1.1 | 14.0 ± 1.3 | 14.0 ± 1.2 | <0.05 |
| Aspartate aminotransferase, IU/L | 26.6 ± 11.1 | 26.5 ± 10.3 | 25.5 ± 8.8 | 25.3 ± 9.6 | <0.05 |
| Uric acid, mg/dL | 4.8 ± 1.4 | 4.7 ± 1.4 | 4.9 ± 1.3 | 4.9 ± 1.3 | <0.05 |
| Creatinine, mg/dL | 0.91 ± 0.15 | 0.91 ± 0.14 | 0.91 ± 0.13 | 0.92 ± 0.14 | 0.75 |
| Hs-CRP, mg/L | 1.1 ± 1.0 | 0.94 ± 0.83 | 1.1 ± 0.94 | 0.89 ± 0.83 | <0.05 |
| Serum Biomarkers | Quintiles (Q) | Cases | Risk Ratio (95% Confidence Interval) | ||
|---|---|---|---|---|---|
| [Median] | Age-Adjusted | Multivariable Model 1 | Multivariable Model 2 | ||
| Vitamin B12, pg/mL | 1st Q [375] | 185 | Reference | Reference | Reference |
| 2nd Q [499] | 149 | 0.97 (0.83, 1.14) | 0.93 (0.79, 1.09) | 0.94 (0.80, 1.10) | |
| 3rd Q [616] | 129 | 0.95 (0.81, 1.12) | 0.87 (0.74, 1.03) | 0.88 (0.74, 1.03) | |
| 4th Q [832] | 135 | 0.98 (0.83, 1.15) | 0.87 (0.74, 1.02) | 0.86 (0.73, 1.01) | |
| p for trend | 0.79 | 0.07 | 0.06 | ||
| Folate, ng/mL | 1st Q [3.6] | 131 | Reference | Reference | Reference |
| 2nd Q [5.6] | 165 | 1.18 (0.99, 1.39) | 1.07 (0.90, 1.27) | 1.07 (0.90, 1.27) | |
| 3rd Q [7.7] | 160 | 1.19 (1.00, 1.41) | 1.04 (0.88, 1.24) | 1.06 (0.89, 1.26) | |
| 4th Q [12.1] | 142 | 1.14 (0.95, 1.36) | 0.98 (0.82, 1.18) | 0.97 (0.80, 1.18) | |
| p for trend | 0.29 | 0.62 | 0.55 | ||
| Homocysteine, μmol/L | 1st Q [8.1] | 150 | Reference | Reference | Reference |
| 2nd Q [10.1] | 131 | 0.70 (0.59, 0.83) | 0.75 (0.63, 0.89) | 0.74 (0.62, 0.88) | |
| 3rd Q [11.9] | 149 | 0.69 (0.58, 0.82) | 0.79 (0.67, 0.94) | 0.77 (0.64, 0.92) | |
| 4th Q [15.1] | 168 | 0.67 (0.57, 0.79) | 0.86 (0.72, 1.03) | 0.81 (0.67, 0.98) | |
| p for trend | <0.001 | 0.36 | 0.15 | ||
| Ferritin, ng/mL | 1st Q [44] | 174 | Reference | Reference | Reference |
| 2nd Q [86] | 166 | 0.83 (0.72, 0.97) | 0.95 (0.82, 1.11) | 0.98 (0.84, 1.14) | |
| 3rd Q [132] | 133 | 0.65 (0.55, 0.76) | 0.79 (0.67, 0.93) | 0.81 (0.68, 0.95) | |
| 4th Q [232] | 125 | 0.66 (0.56, 0.79) | 0.92 (0.76, 1.10) | 0.95 (0.78, 1.15) | |
| p for trend | <0.001 | 0.23 | 0.28 | ||
| Serum Biomarkers | Categories | Cases | Multivariable Risk Ratio (95% Confidence Interval) | ||
|---|---|---|---|---|---|
| [Range] | Noncases | All | Men, n = 870 | Women, n = 1060 | |
| Vitamin B12, pg/mL | Low or deficient [≤300] | 11/32 | Reference | Reference | Reference |
| Low-normal [301–500] | 97/125 | 0.95 (0.78, 1,16) | 1.23 (0.79, 1.90) | 0.86 (0.69, 1.07) | |
| Moderate-normal [501–700] | 49/152 | 0.87 (0.71, 1.07) | 0.87 (0.53, 1.42) | 0.91 (0.73, 1.13) | |
| High-normal [>700] | 26/106 | 0.84 (0.67, 1.04) | 0.75 (0.43, 1.30) | 0.89 (0.70, 1.14) | |
| Folate, ng/mL | Low or deficient [≤4] | 53/42 | Reference | Reference | Reference |
| Low-normal [4.1–7.0] | 74/159 | 0.97 (0.82, 1.16) | 1.09 (0.82, 1.44) | 0.96 (0.77, 1.21) | |
| Moderate-normal [7.1–10] | 34/119 | 0.98 (0.81, 1.19) | 0.95 (0.65, 1.39) | 1.00 (0.79, 1.27) | |
| High-normal [>10] | 22/95 | 0.90 (0.72, 1.11) | 0.93 (0.61, 1.42) | 0.89 (0.69, 1.16) | |
| Homocysteine, μmol/L | Low-normal [≤9] | 18/121 | Reference | Reference | Reference |
| Moderate-normal [9.1–12] | 56/172 | 0.77 (0.65, 0.90) | 0.59 (0.38, 0.90) | 0.85 (0.72, 1.02) | |
| High-normal [12.1–15] | 54/88 | 0.73 (0.60, 0.89) | 0.61 (0.39, 0.97) | 0.80 (0.64, 1.00) | |
| Elevated [>15] | 55/34 | 0.82 (0.66, 1.02) | 0.61 (0.38, 0.99) | 0.88 (0.67, 1.14) | |
| Ferritin, ng/mL | Low or deficient [≤50] | 18/107 | Reference | Reference | Reference |
| Low-normal [51–100] | 37/160 | 0.89 (0.76, 1.04) | 0.86 (0.59, 1.25) | 0.89 (0.75, 1.05) | |
| High-normal [101–200] | 63/122 | 0.75 (0.64, 0.87) | 0.70 (0.50, 0.97) | 0.79 (0.66, 0.95) | |
| Mildly elevated [201–300] | 38/20 | 0.91 (0.71, 1.17) | 0.94 (0.66, 1.34) | 0.90 (0.62, 1.31) | |
| Elevated [>300] | 27/6 | 0.86 (0.64, 1.16) | 0.83 (0.55, 1.25) | 1.03 (0.63, 1.69) | |
| Risk Factors at Baseline | Cases | RR 1 (95% CI) | RR 1 (95% CI) by Hcy Levels | RR 1 (95% CI) by Ferritin Levels 2 | ||
|---|---|---|---|---|---|---|
| Noncases | All | ≤15 μmol/L | >15 μmol/L | ≤200 or 300 ng/mL | >200 or 300 ng/mL | |
| Age | ||||||
| <60 years | 110/835 | Reference | Reference | 0.23 (0.06, 0.90) | Reference | 1.18 (0.64, 2.17) |
| ≥60 years | 488/497 | 3.09 (2.52, 3.78) | 2.81 (2.29, 3.44) | 3.49 (2.71, 4.50) | 3.08 (2.50, 3.81) | 3.14 (2.31, 4.26) |
| p for interaction | <0.05 | 0.66 | ||||
| Muscle mass | ||||||
| ≥70% | 198/728 | Reference | Reference | 1.14 (0.88, 1.46) | Reference | 1.03 (0.75, 1.41) |
| <70% | 400/604 | 1.44 (1.17, 1.78) | 1.48 (1.19, 1.83) | 1.63 (1.23, 2.15) | 1.45 (1.17, 1.79) | 1.55 (1.09, 2.19) |
| p for interaction | 0.85 | 0.86 | ||||
| Physical activity | ||||||
| Regular exercise | 126/469 | Reference | Reference | 1.05 (0.71, 1.55) | Reference | 1.29 (0.73, 2.28) |
| Absence of exercise | 472/863 | 1.19 (1.02, 1.39) | 1.18 (0.99, 1.40) | 1.30 (1.03, 1.64) | 1.22 (1.03, 1.43) | 1.17 (0.91, 1.52) |
| p for interaction | 0.81 | 0.35 | ||||
| Protein intake | ||||||
| 2nd to 4th quartiles | 427/1038 | Reference | Reference | 1.05 (0.85, 1.30) | Reference | 0.93 (0.71, 1.22) |
| 1st quartile | 171/294 | 0.96 (0.84, 1.10) | 0.95 (0.82, 1.09) | 1.10 (0.86, 1.39) | 0.94 (0.82, 1.07) | 1.23 (0.87, 1.73) |
| p for interaction | 0.46 | 0.13 | ||||
Disclaimer/Publisher’s Note: The statements, opinions and data contained in all publications are solely those of the individual author(s) and contributor(s) and not of MDPI and/or the editor(s). MDPI and/or the editor(s) disclaim responsibility for any injury to people or property resulting from any ideas, methods, instructions or products referred to in the content. |
© 2026 by the author. Licensee MDPI, Basel, Switzerland. This article is an open access article distributed under the terms and conditions of the Creative Commons Attribution (CC BY) license.
Share and Cite
Baik, I. Prospective Associations of Serum Vitamin B12, Homocysteine, and Ferritin Levels with Probable Sarcopenia. Nutrients 2026, 18, 1362. https://doi.org/10.3390/nu18091362
Baik I. Prospective Associations of Serum Vitamin B12, Homocysteine, and Ferritin Levels with Probable Sarcopenia. Nutrients. 2026; 18(9):1362. https://doi.org/10.3390/nu18091362
Chicago/Turabian StyleBaik, Inkyung. 2026. "Prospective Associations of Serum Vitamin B12, Homocysteine, and Ferritin Levels with Probable Sarcopenia" Nutrients 18, no. 9: 1362. https://doi.org/10.3390/nu18091362
APA StyleBaik, I. (2026). Prospective Associations of Serum Vitamin B12, Homocysteine, and Ferritin Levels with Probable Sarcopenia. Nutrients, 18(9), 1362. https://doi.org/10.3390/nu18091362