Article

New Insights into Human Milk Oligosaccharide Profiles in China: Findings from a Large-Scale Analysis of Human Milk


1
Key Laboratory of Special Diet Nutrition and Health Research of China National Light Industry Council, School of Medicine, Nankai University, Tianjin 300071, China
2
Research Institute of Public Health, Nankai University, Tianjin 300071, China
3
Abbott Nutrition Research & Development Center, Shanghai 200233, China
4
Abbott Nutrition Research & Development Center, Columbus, OH 43215, USA
5
Abbott Nutrition Research & Development Center, Singapore 138668, Singapore
*
Authors to whom correspondence should be addressed.
These authors contributed equally to this work.
Nutrients 2026, 18(3), 417; https://doi.org/10.3390/nu18030417
Submission received: 19 December 2025 / Revised: 20 January 2026 / Accepted: 23 January 2026 / Published: 27 January 2026
(This article belongs to the Section Pediatric Nutrition)

Abstract

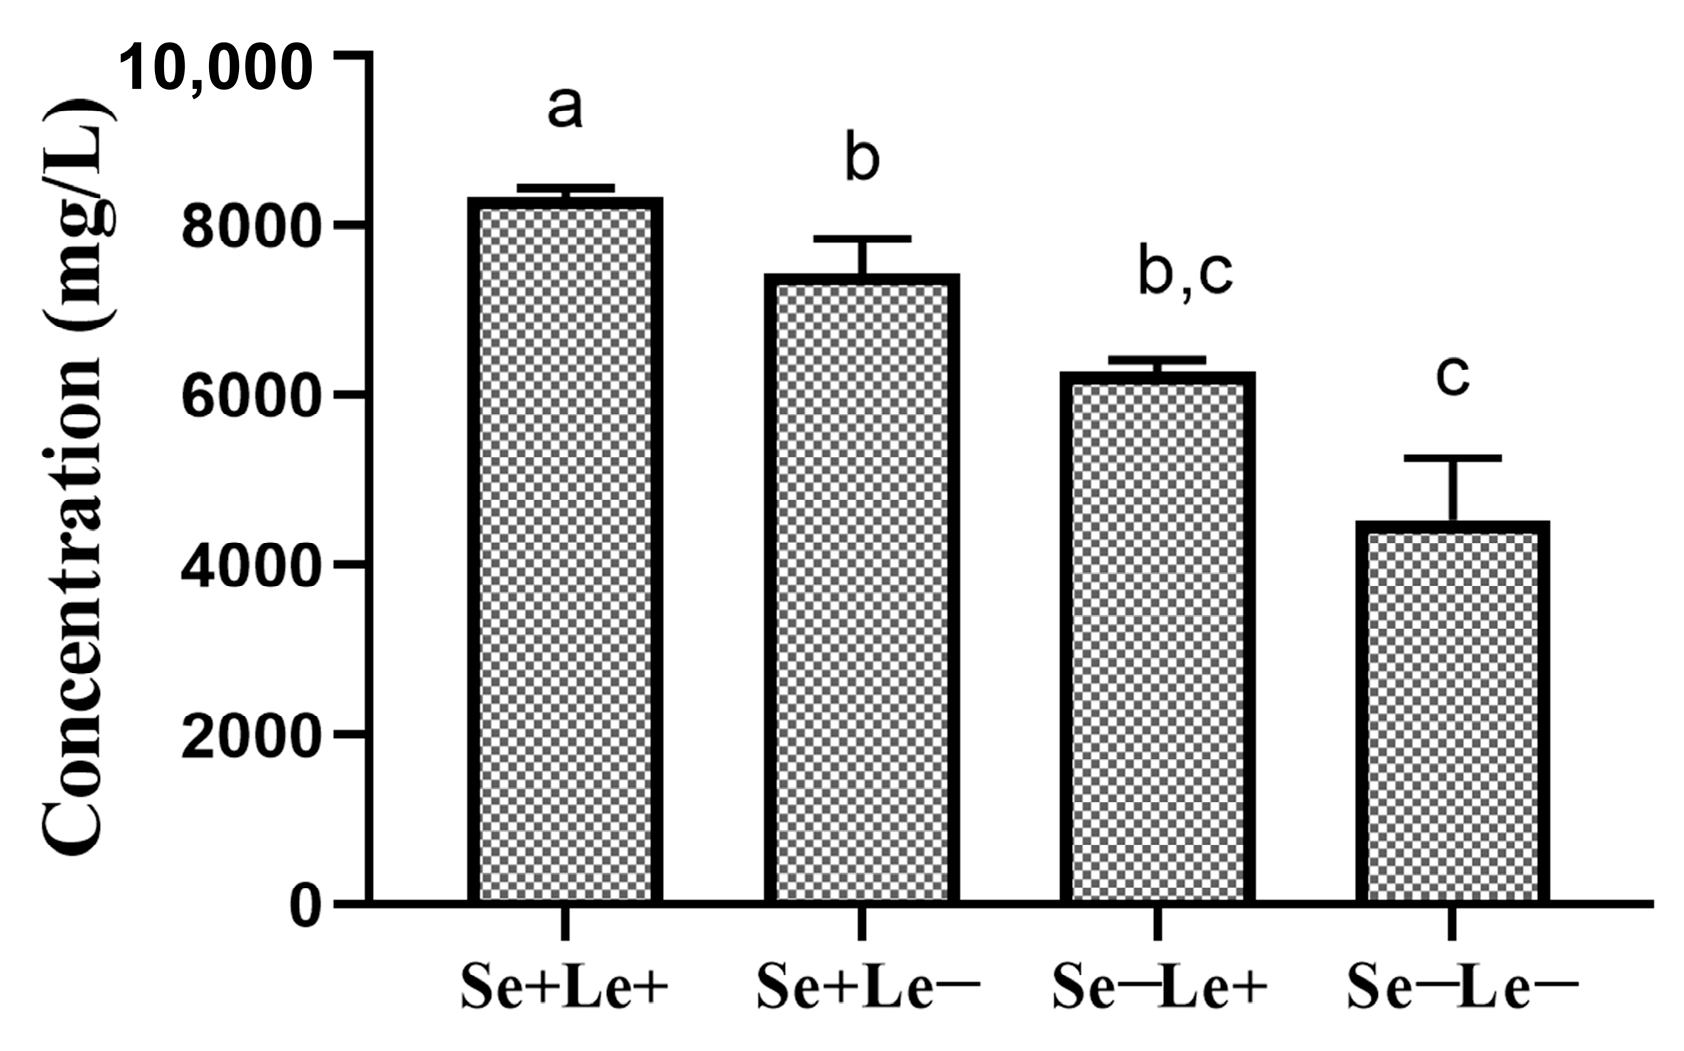
Background/Objectives: This study systematically analyzed the concentration dynamics of human milk oligosaccharides (HMOs) and the distribution characteristics of secretory (Se) and Lewis (Le) phenotypes in China. Methods: A total of 1462 breast milk samples were collected from lactating mothers in six major regions of China, including Changchun, Lanzhou, Chengdu, Tianjin, Guangzhou, and Shanghai. We quantified 17 major HMOs by high-performance anion exchange chromatography-pulsed amperometric detection (HPAEC-PAD), and Se/Le phenotypes were determined to evaluate regional differences and distribution patterns. Results: Total HMO concentration in breast milk showed a significant downward trend within 200 days postpartum and stabilized after 200 to 400 days. Fucosylated HMOs accounted for the highest proportion 60.0 83.0 % , among which 2′-FL had the largest concentration 903.4 2832.7   m g / L ; acetylated HMOs 8.4 17.6 % and sialylated HMOs 8.2 25.3 % accounted for relatively lower proportions. This study further divided breast milk into four phenotypes based on HMO characteristics: 72.49% of the samples were Se+/Le+, 6.145% were Se+/Le−, 20.12% were Se−/Le+, and 1.24% were double negative (Se−/Le−). Se+ and Le+ phenotypes accounted for 78.7% and 92.6% of the total population, respectively. The total concentration of HMOs in breast milk of different phenotypes was significantly different, with the average total HMO concentration of Se+/Le+ breast milk being the highest (8342 mg/L), while that of Se−/Le− breast milk being the lowest (4532 mg/L). Se+ phenotype was associated with higher levels of fucosylated HMOs, including 2′-fucosyllactose (2′-FL) and lacto-N-fucopentaose I (LNFP I), and lower levels of lacto-N-tetraose (LNT) and sialyl-lacto-N-tetraose b (LST b) compared to other phenotypes. Most HMOs reached their highest concentrations during the colostrum (CM) and transitional milk (TM) stages, followed by a progressive decline with lactation, with phenotype-specific variations evident across all HMOs. Notably, certain HMOs, such as 3-FL, 3′-SL, DFL, and LNDFH II, exhibited distinct temporal patterns. Conclusions: This study revealed the Se/Le phenotype distribution and dynamic characteristics of HMOs in the Chinese mother-infant population, offering a valuable reference for global breast milk composition databases and infant nutrition research.

1. Introduction

Human breast milk is universally recognized as the optimal nutritional source for infants. In alignment with World Health Organization (WHO) guidelines, exclusive breastfeeding is strongly advised for the first six months of life, with continued breastfeeding alongside complementary foods recommended until at least two years of age. Beyond its foundational role in nourishment, breast milk confers critical immunological protection and is associated with both immediate and lifelong health benefits. These include reduced risks of gastrointestinal infections, acute illnesses, and chronic conditions such as type 2 diabetes and obesity [1,2,3,4,5]. Emerging evidence also underscores its positive correlation with enhanced cognitive development and improved socioemotional outcomes [6,7,8]. The intricate composition of human milk extends beyond macronutrients (e.g., lactose, lipids) and micronutrients, encompassing bioactive molecules with multifunctional roles. A prime example is human milk oligosaccharides (HMOs), which rank as the third most abundant solid constituent, following lactose and lipid, present at concentrations of 20–25 g/L in colostrum and declining to 5–15 g/L in mature milk [9,10,11]. Characterized by structural diversity and functional versatility, HMOs are now recognized not only as prebiotics fostering beneficial gut microbiota but also as mediators of pathogen inhibition and immune modulation in preclinical studies [12]. Recent advances in analytical techniques have further elucidated their complexity of structures, as well as the nutritional and protective mechanisms, solidifying their importance in infant health and development [13,14].
HMOs function as prebiotics, playing a pivotal role in shaping the infant gut microbiota. Accumulating evidence confirms their ability to promote colonization of beneficial bacteria, particularly Bifidobacteria, which dominate the intestinal ecosystem of breastfed infants, constituting over 50–70% of the total microbial population [15]. This selective advantage arises from Bifidobacteria’s unique genetic machinery, which encodes specialized oligosaccharide transporters and glycoside hydrolases to efficiently metabolize HMOs, thereby enhancing their survival and proliferation [16]. Beyond microbiota modulation, preclinical studies also suggested that HMOs serve as a frontline defense against pathogens by disrupting bacterial adhesion and inhibiting growth kinetics of diverse enteric pathogens, thereby protecting infants from invasive infections. Notably, the majority of HMOs undergo microbial fermentation in the colon, producing metabolites such as short-chain fatty acids (SCFAs) and aromatic lactic acids with localized and systemic immunomodulatory effects. A small portion of HMOs are also directly absorbed intact into systemic circulation of both breastfed infants and adults, where they directly influence host physiology through mechanisms such as immune regulation and enhancement of epithelial barrier function. Emerging research further reveals that HMOs and their derivatives, including sialic acid, extend their benefits to neurodevelopment [17,18]. Clinical studies suggest that early exposure to the most prevalent HMOs, namely 2′-fucosyllactose (2′-FL), correlates positively with cognitive development in breastfed infants, while metabolites such as sialic acid facilitate neuronal signaling, synaptogenesis, and brain maturation [17,19]. These multifunctional roles underscore the significance of HMOs not only in gut health but also in systemic development and long-term neurological outcomes, including improved cognitive performance and language development during infancy, as well as higher intelligence quotient (IQ) scores and a reduced risk of childhood behavioral disorders during childhood [19,20,21].
HMOs are synthesized in the mammary gland through the action of glucosyltransferases, forming structures composed of 3–23 monosaccharide units [22,23]. These oligosaccharides are derived from a lactose core, Gal β1-4 Glc, which is extended through the addition of lacto-N-biose (Gal β1-3 GlcNAc, β1-3 linkage) or N-acetyllactosamine (Gal β1-4 GlcNAc, β1-6 linkage). The structural diversity of HMOs arises from further modifications involving five key monosaccharides: D-glucose (Glc), D-galactose (Gal), N-acetylglucosamine (GlcNAc), L-fucose (Fuc), and N-acetylneuraminic acid (Neu5Ac, or sialic acid) [24,25]. Fucosylation or sialylation of the core structures defines the classification of HMOs. Fucosylated variants (45–83% of total HMOs) are formed via α1-2, α1-3, or α1-4 glycosidic bonds, while sialylated variants (6–21%) result from α2-3 or α2-6 linkages. Acetylated variants (6–35%) represent an additional structural category terminating in N-acetylglucosamine [26,27,28,29,30,31]. To date, over 200 distinct HMO structures have been identified in human milk, with their biological effects directly linked to their unique isomeric configurations. This structural complexity underscores the functional versatility of HMOs, as subtle variations in glycosidic bonds or terminal modifications can significantly alter their interactions with microbial and host receptors. Consequently, elucidating HMO profiles provides critical insights into their role in infant health and development.
HMOs exhibit a conserved structural framework, yet their profiles display marked interindividual variation in both composition and concentration. Studies have shown that HMO concentrations in breast milk fluctuate with lactational stage [32,33]. In addition to the lactational stage, maternal genetics and environmental factors such as diet, physiology, and geographic location significantly influence HMO concentration and composition [30,34,35]. The maternal genetic phenotype contributes to HMO profiles. The variation in HMO profiles is largely determined by two key genetic factors: the Secretor (Se) and Lewis (Le) phenotypes, which are governed by the maternal galactoside 2-α-l-fucosyltransferase 2 (FUT2) and galactoside 3/4-l-fucosyltransferase (FUT3) genes on chromosome 19 [22,36]. Secretor-positive (Se+) mothers, who express FUT2, predominantly produce HMOs with α1-2 linkages, such as 2′-FL and lacto-N-fucopentaose I (LNFP I) [37]. In contrast, Lewis-positive (Le+) mothers, who express FUT3, predominantly produce HMOs with α1-3/4 linkages, such as 3-FL and lacto-N-fucopentaose II (LNFP II) [37]. Additionally, Lewis antigen expression is jointly regulated by FUT2 and FUT3, with distinct Lewis determinants arising from variations in galactose linkage and fucosylation position [38].
The Se+/Le+ phenotype exhibits the highest compositional diversity, encompassing 2′-FL, 3-FL, difucosyllactose (DFL), lacto-N-tetraose (LNT), lacto-N-neo-tetraose (LNnT), lacto-N-fucopentaose I/II (LNFP I/2), and lacto-N-difucohexaose I/II (LDFH 1/2). In contrast, the Se−/Le+ group lacks α1-2-fucosylated HMOs, with its profile comprising 3-FL, LNT, LNnT, LNFP II, and LDFH III. The Se+/Le− phenotype exhibits intermediate diversity, featuring 2′-FL, LNT, LNnT, and LNFP I. Finally, the rare Se−/Le− group, characterized by absent FUT2 and FUT3 activity, shows minimal fucosylation [28,39]. Secretor phenotypes further modulate total HMO concentrations, with non-secretors displaying significantly lower levels than their secretor counterparts [33,40]. Emerging research now prioritizes comparative analyses of HMO composition and abundance across these four groups, refining our understanding of genetic determinants in HMO biosynthesis.
Beyond genetic determinants, environmental factors, including geography, delivery season, maternal diet, age, ethnicity, parity, and delivery mode, may influence the concentration and composition of HMOs. A multinational study of 410 lactating women across 11 cohorts revealed marked geographical disparities: Swedish mothers exhibited higher levels of 3-FL and LNFP III compared to African mothers, while Peruvian mothers demonstrated elevated 2′-FL, 3-FL, and 3′-SL concentrations, with 98% of this cohort classified as secretors [30]. Notably, ethnically similar populations residing in distinct regions displayed divergent HMO profiles, particularly in LNT and DSLNT levels.
Further comparisons reveal geographic variations in HMO compositions. Asian mothers showing higher siallylacto-N-tetraose c (LST c) concentrations than Caucasian counterparts, Hispanic populations exhibiting lower siallylacto-N-tetraose b (LST b), and Chinese and South African mothers producing more LNFP III than Finnish mothers, alongside reduced 2′-FL and LNFP I levels [30,37,41]. A large contributor to HMO compositional differences between Chinese mothers is thought to be due to maternal phenotypic groups S e + / L e + , S e / L e + , S e + / L e , S e / L e . For instance, 2′-FL abundance strongly correlates with Se+/Le+ and Se+/Le− phenotypes, whereas elevated 3-FL typically indicates Se−/Le+ phenotypes. Seasonal and perinatal factors may influence HMO level and composition. Gambian mothers produce less LNnT during wet seasons [42], while preterm delivery was associated with elevated 3′-sialyllactose (3′-SL), 6′-sialyllactose (6′-SL), LNT, and LNDFH I compared to term delivery [43]. Despite these insights, research on drivers of HMO variability in Chinese populations remains limited, underscoring the need for expanded studies in diverse regional populations.
Previous studies have measured HMO profiles in Chinese populations [33,44,45,46], predominantly focused on early lactation stages (≤2 months postpartum), with limited longitudinal data extending to 12 months [47]. Critical gaps remain in understanding how HMO composition evolves across lactation periods and geographic regions in China, particularly when stratified by maternal Se/Le phenotypes. To address this, we conducted a multicenter longitudinal study within the Chinese Breast Milk Cohort, analyzing 1462 breast milk samples from six cities over 13 months postpartum. This investigation aimed to quantify temporal changes in HMO concentrations during the first year of lactation, correlate Se/Le phenotypic groups with distinct HMO profiles, examine the impact of geographic variation on HMO diversity, and explore associations among HMO components in relation to maternal and infant characteristics. By integrating maternal, genetic, and environmental factors, our findings elucidate the dynamic interplay shaping HMO composition and provide novel insights into phenotype-driven and region-specific variations in Chinese breast milk.

2. Materials and Methods

2.1. Study Design and Participants

This study was conducted within the framework of the Maternal Nutrition and Infant Investigation (MUAI), a longitudinal cohort initiated in 2017 to examine maternal and infant health in China. With institutional support from regional hospitals, approximately 2000 mother-infant pairs were recruited across 6 geographically diverse cities: Tianjin (Northern China), Changchun (Northeast China), Lanzhou (Northwest China), Chengdu (Southwest China), Guangzhou (South China), and Shanghai (East China) (Figure 1). These regions were selected to capture variations in dietary practices and lifestyle patterns representative of the Chinese population.
Eligibility criteria included mothers aged 20–35 years who had resided in their respective regions for ≥2 years, breastfed for >3 months, delivered full-term singletons (37–42 weeks of gestation), and had infants with Apgar scores > 8. Exclusion criteria encompassed diagnosed maternal or infant chronic/acute illnesses, infectious diseases, or the use of medications that could affect nutritional metabolism. Breast milk samples were collected from the 6 regional cohorts. The study protocol adhered to the Declaration of Helsinki and was approved by the Ethics Committee of Tianjin hospital of ITCWM Nankai hospital (NKYY_YX-IRB 2018_005_01, 6 February 2018, Tianjin, China). Written informed consent was obtained from all participants, and the trial was registered with the China Clinical Trial Center (ChiCTR1800015387, 1 March 2018).

2.2. Breast Milk Sample Collection

Breast milk samples were collected at five lactation stages: colostrum (CM, 0–5 days postpartum), transitional milk (TM, 10–15 days postpartum), mature milk stage 1 (M1, 40–45 days postpartum), mature milk stage 2 (M2, 200–240 days postpartum), and mature milk stage 3 (M3, 300–400 days postpartum). A standardized collection protocol was implemented across all 6 study sites. Samples were obtained between 8:00 and 11:00 a.m. using manual or electric pumps to fully empty one breast. The thoroughly mixed milk sample was then divided: a portion was allocated for human milk research, while the remainder was returned to the mother for infant feeding. Considering the variation in milk volume across different lactation stages, the collected volumes in the MUAI study were standardized as follows: 5–10 mL for colostrum, 10–15 mL for transitional milk, and 30–50 mL for mature milk. Collected samples were immediately placed in insulated containers for transport to local laboratories. If delayed transport occurred, samples were temporarily stored at −20 °C and transferred within 24 h. Upon arrival, samples underwent controlled thawing in a 25 °C water bath for 20 min, followed by vortexing (2 min) to ensure homogeneity. Visually homogeneous samples (free of oil layers or particulate matter) were aliquoted and archived at −80 °C for subsequent analysis.

2.3. HMOs Analysis

For colostrum and transitional milk, an aliquot of 100 μL of homogenized sample was diluted 10-fold with lab water (type 1, 18.2 MΩ·cm), vortexed for 1 min to achieve homogeneity, and filtered through a 0.22 μm nylon membrane to deplete proteins and lipids. Mature milk samples (an aliquot of 200 μL) underwent identical processing, including dilution, vortexing, and filtration. All filtrates were subsequently transferred to injection vials for chromatographic analysis.
The identification and quantification of native HMOs were performed using a Thermo Fisher ICS 5000 (Thermo, Waltham, MA, USA) series high-performance anion-exchange chromatography system with pulsed amperometric detection (HPAEC-PAD). The system comprised a ternary gradient pump and an electrochemical cell operating under a carbohydrates quad potential waveform, with an Ag/AgCl reference electrode. Four chromatographic methods were used to analyze 17 HMOs to achieve separation of all isomers. For 2′-FL, 3-FL, LNT, and LNnT, chromatographic separation was performed on a separation column (CarboPac™ PA1, 4 × 150 mm, Thermo, Waltham, MA, USA) connected to a guard column (CarboPac™ PA1, 4 × 50 mm, Thermo, Waltham, MA, USA), with the column temperature maintained at 25 °C. The injection mode was full-loop injection, and the flow rate was 1.0 mL/min. The elution gradient was as follows: 0.00–12.00 min, 60 mM NaOH; 12.00–20.00 min, 60–155 mM NaOH; 20.00–30.00 min, 155 mM NaOH; 30.01–43.00 min, 125 mM NaOH/18 mM NaOAc; 43.01–48.00 min, 100 mM NaOH/240 mM NaOAc; 48.01–63.00 min, 60 mM NaOH. Ion chromatography instrument parameters were used to separate DFL, LNFP I, LNFP II, LNFP III, and LNDFH I. The sugar column guard column PA1 was connected in series with the sugar analysis column PA1. The column temperature was 25 °C. The injection mode was full-loop injection, and the flow rate was 1.0 mL/min. The elution gradient was as follows: 0.00–12.00 min, 60 mM NaOH; 12.00–26.00 min, 130 mM NaOH; 26.01–31.00 min, 100 mM NaOH/240 mM NaOAc; 31.01–41.00 min, 60 mM NaOH.
Ion chromatography instrument parameters were used to separate LNDFH 2 and TFLNH. The sugar column guard column PA1 was connected in series with 2 sugar analysis columns PA1. The column temperature was 28 °C, the injection mode was full-loop injection, and the flow rate was 0.6 mL/min. The elution gradient was as follows: 0.00–14.00 min, 140 mM NaOH; 14.01–26.00 min, 100 mM NaOH/240 mM NaOAc; 26.01–41.00 min, 140 mM NaOH. Ion chromatography instrument parameters were used to separate 3′-SL, 6′-SL, LST a, LST b, LST c, and DSLNT. The sugar column guard column PA1 was connected in series with the sugar analysis column PA1. The column temperature was 25 °C, the injection mode was full-loop injection, and the flow rate was 1.0 mL/min. The elution gradient was as follows: 0.00–16.00 min, 100 mM NaOH/60 mM NaOAc; 16.00–40.00 min, 100 mM NaOH/60–210 mM NaOAc; 40.01–44.00 min, 100 mM NaOH/240 mM NaOAc; 44.01–54.00 min, 100 mM NaOH/60 mM NaOAc.

2.4. Classification of Maternal Phenotype as Secretor and Lewis

The maternal phenotypes—defined by the expression of two specific fucosyltransferases, namely FUT2 and FUT3—were determined following previously published literature [44,48]. Maternal phenotypes are categorized into secretor phenotypes and Lewis phenotypes. Secretor phenotypes were classified based on the α1-2 concentration in breast milk. Lewis phenotypes were classified based on the α1-4 concentration in breast milk. The Se/Le type of breast milk was classified according to the content of 2′-FL, DFL, LNFP I, LNFP II, LNDFH I, and LNDFH 2 in breast milk as reported in previous studies.

2.5. Statistical Analysis

All exploratory and descriptive statistical analyses were performed with the use of SPSS 25.0 (IBM SPSS Corp., Armonk, NY, USA) and GraphPad Prism 9.5.1 (LLC of Boston, MA, USA). HMO concentrations were reported as the median (25–75th percentile) since the data presented a non-normal distribution. The minimum sample size was calculated by the formula (z × SD/E)2). E was the average value of HMO concentration multiplied by the allowable error of the method. SD was the standard deviation of HMO concentrations, and z = 1.96. The variation of HMO concentrations among 6 geographical sites was explored with the independent nonparametric test (Kruskal–Wallis One-way ANOVA, all pairwise, adjust p-value). The proportions of secretors and non-secretors were compared by the Chi-square test. All statistical analyses were considered significant at p < 0.05 (two-sided). The sum of the concentrations of 2′-FL, 3-FL, LNFP I, LNFP II, LNFP III, LNDFH I, LNDFH 2, TFLNH, LNT, LNnT, 3′-SL, 6′-SL, LST a, LST b, LST c, and DSLNT represented the total HMO concentrations.

3. Results

3.1. Maternal and Infant Characteristics Across Study Sites

A total of 1462 healthy mothers participated in the study, including 244 from Changchun, 299 from Lanzhou, 281 from Chengdu, 229 from Tianjin, 342 from Guangzhou, and 363 from Shanghai. Overall, the average (SD) age at delivery of the participant mothers was 29.9 (3.5) years. The pre-pregnant body mass index (BMI) and pre-delivery BMI of the participant mothers were 21.1 (2.9) kg/m2 and 26.6 (3.3) kg/m2, respectively. The weight gain during pregnancy was 14.6 (5.6) kg. The gestational age of the participant mothers was 39.2 (1.6) weeks. The rate of vaginal delivery and primipara was 59% and 71%, respectively. 49% of infants were female. The infant birthweight and birth length were 3397.6 (637.9) g and 49.9 (2.1) cm, respectively. The characteristics of participant mothers at each city are listed in Table 1. Except for the maternal age at delivery and the infant’s sex, the characteristics of mothers and infants showed significant differences across cities.

3.2. The Proportion of Secretor and Lewis Phenotypes Across Lactation Stages and Cities

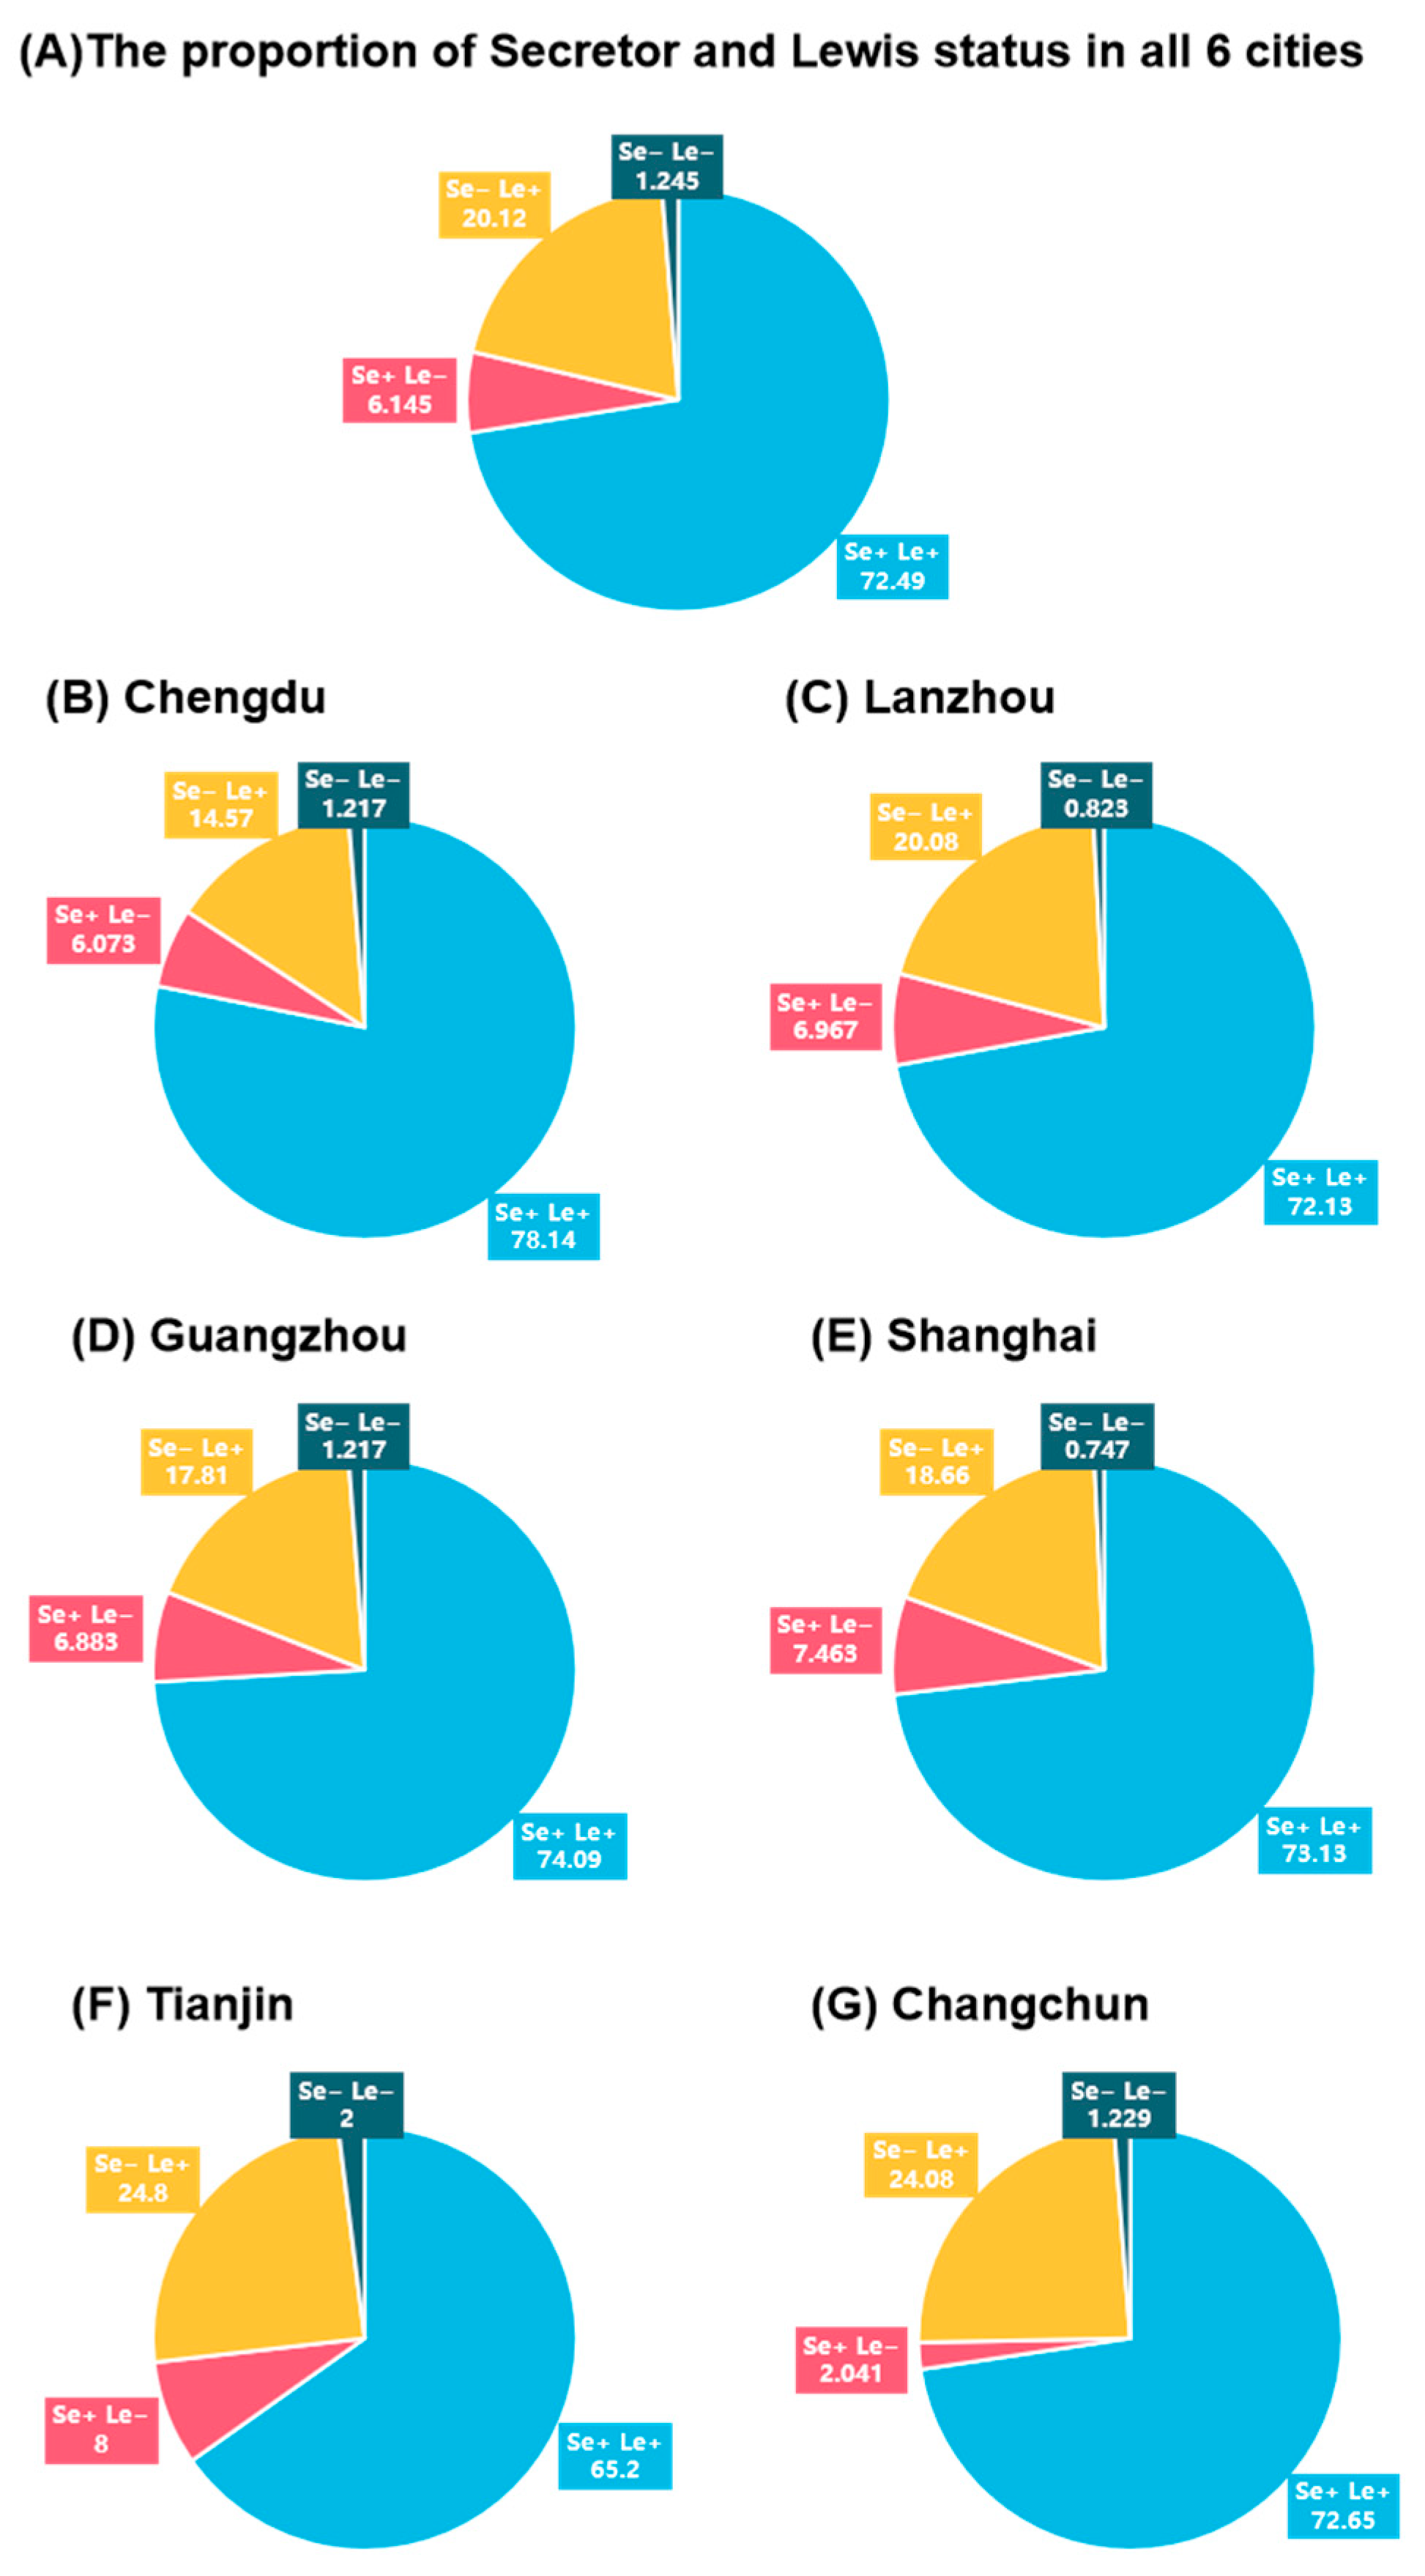
As shown in Figure 2A, the Se+/Le+ phenotype was the most prevalent across all lactation stages, accounting for 72.49% of the overall population. The Se−/Le+ phenotype was the second most common, representing 20.12% of the population. In contrast, the Se+/Le− and Se−/Le− phenotypes were relatively rare, consistently comprising ~10% of the population across all lactation stages.
The distribution of secretor and Lewis phenotypes in the six cities aligns with that of the total population. Nevertheless, notable geographical variations in the distribution of these phenotypes existed (Figure 2B–G). The most common phenotype across all cities was Se+/Le+, with the highest prevalence in Chengdu (78.14%) and the lowest in Tianjin (65.20%). The second most frequent phenotype was Se−/Le+ (20.1%), particularly common in Changchun (24.08%) and Tianjin (24.8%), indicating more non-secretor mothers in those regions. Se+/Le− and Se−/Le− phenotypes were rare, making up 6.145% and 1.244% of the total population, respectively. Notably, Tianjin had higher rates of Se− and Le− phenotypes (2%), likely due to regional genetic, ethnic, or environmental influences (Table 2).
Overall, secretor-positive (Se+) mothers represented 78.7% of the cohort, while Lewis-positive (Le+) mothers accounted for 92.6%, indicating that most Chinese lactating women possess the enzymatic capacity to synthesize fucosylated HMOs (Table 2). Despite this, regional variation in the secretion phenotypes was not significant. Chi-square analysis revealed no significant difference in the proportion of secretor and Lewis phenotypes among different cities, although there was a significant intercity difference in the secretion phenotype alone (chi-square p = 0.03).

3.3. Total Human Milk Oligosaccharides Content Across Secretor and Lewis Phenotypes

As shown in Table 3, the average of total contents of 17 HMOs in Se+/Le+, Se+/Le−, Se−/Le+, and Se−/Le− types of breast milk is 8342 mg/L, 7449 mg/L, 6276 mg/L, and 4532 mg/L, respectively. There are significant differences in the total HMOs content in the four types of breast milk (p < 0.001). The results are shown in Figure 3.

3.4. Contents of Fucosylated, Acetylated, and Sialylated Oligosaccharides in Breast Milk Across Secretor and Lewis Phenotypes

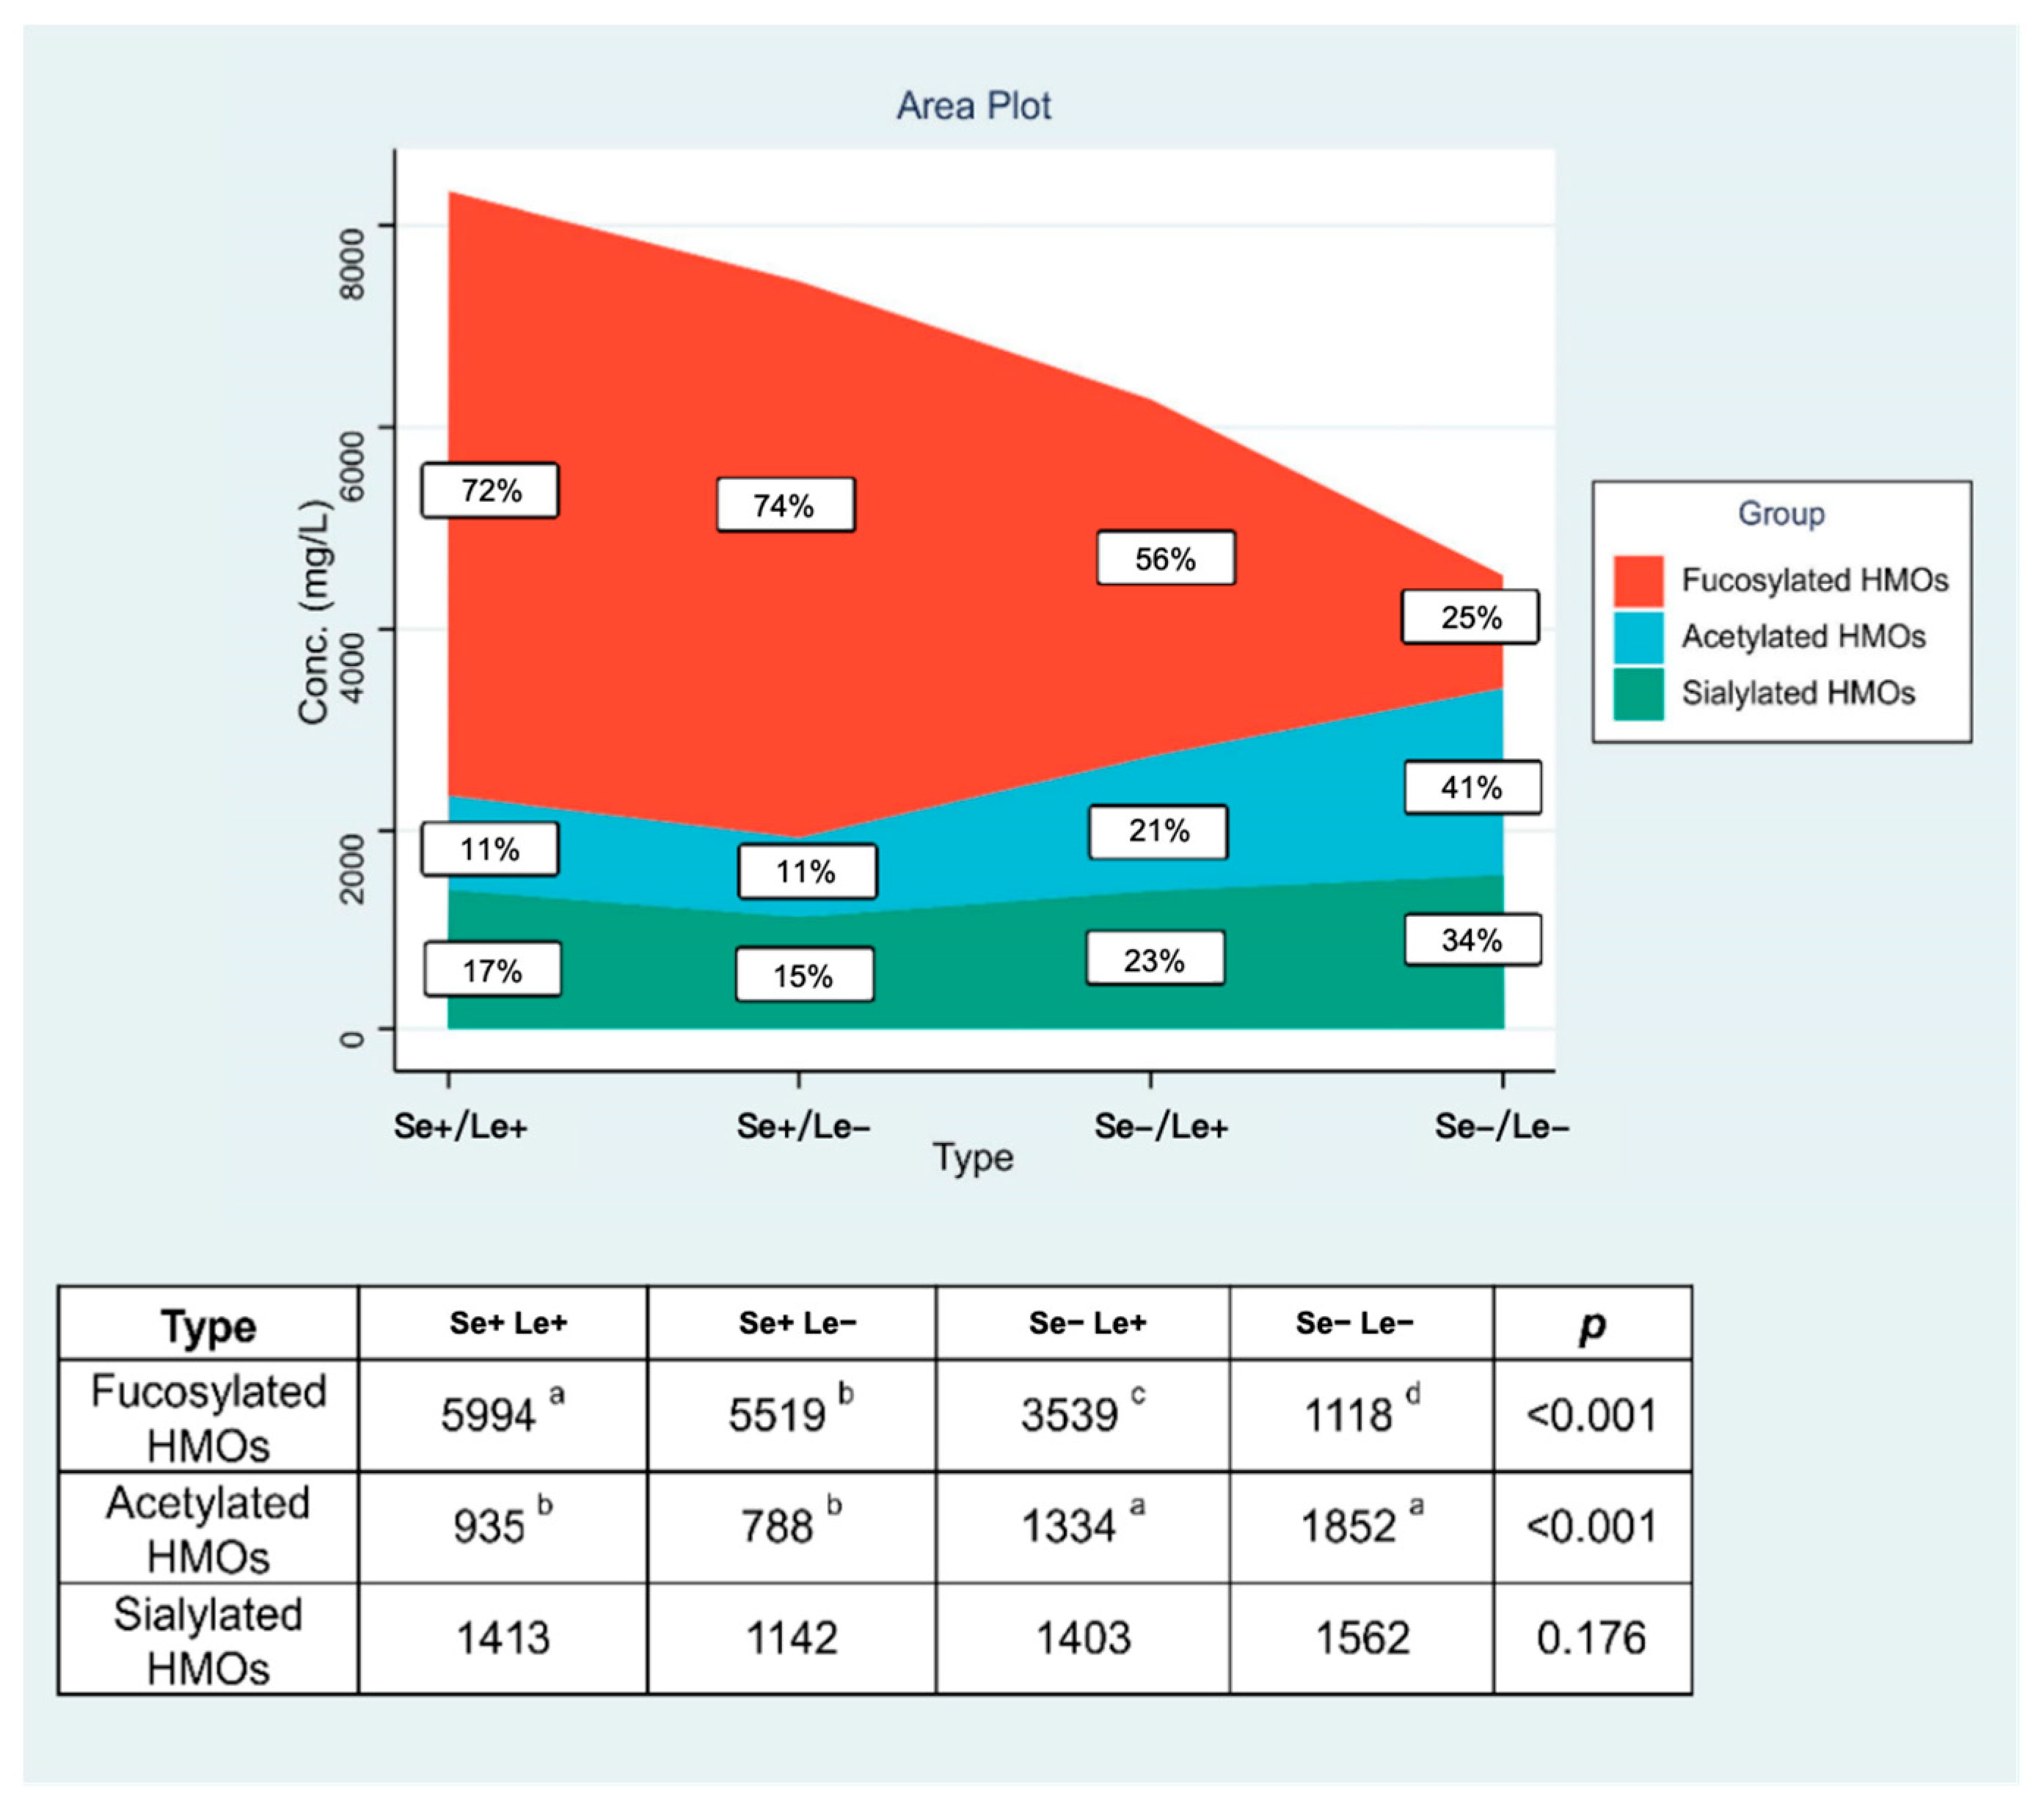
As demonstrated in Figure 4, the Se/Le phenotype exerted a pronounced influence on the composition of fucosylated and acetylated HMOs (p < 0.001), while sialylated HMOs remained statistically consistent across all four phenotypic categories throughout the 400-day postpartum period.

3.5. Distribution of 17 HMOs in Breast Milk Across Secretor and Lewis Phenotypes

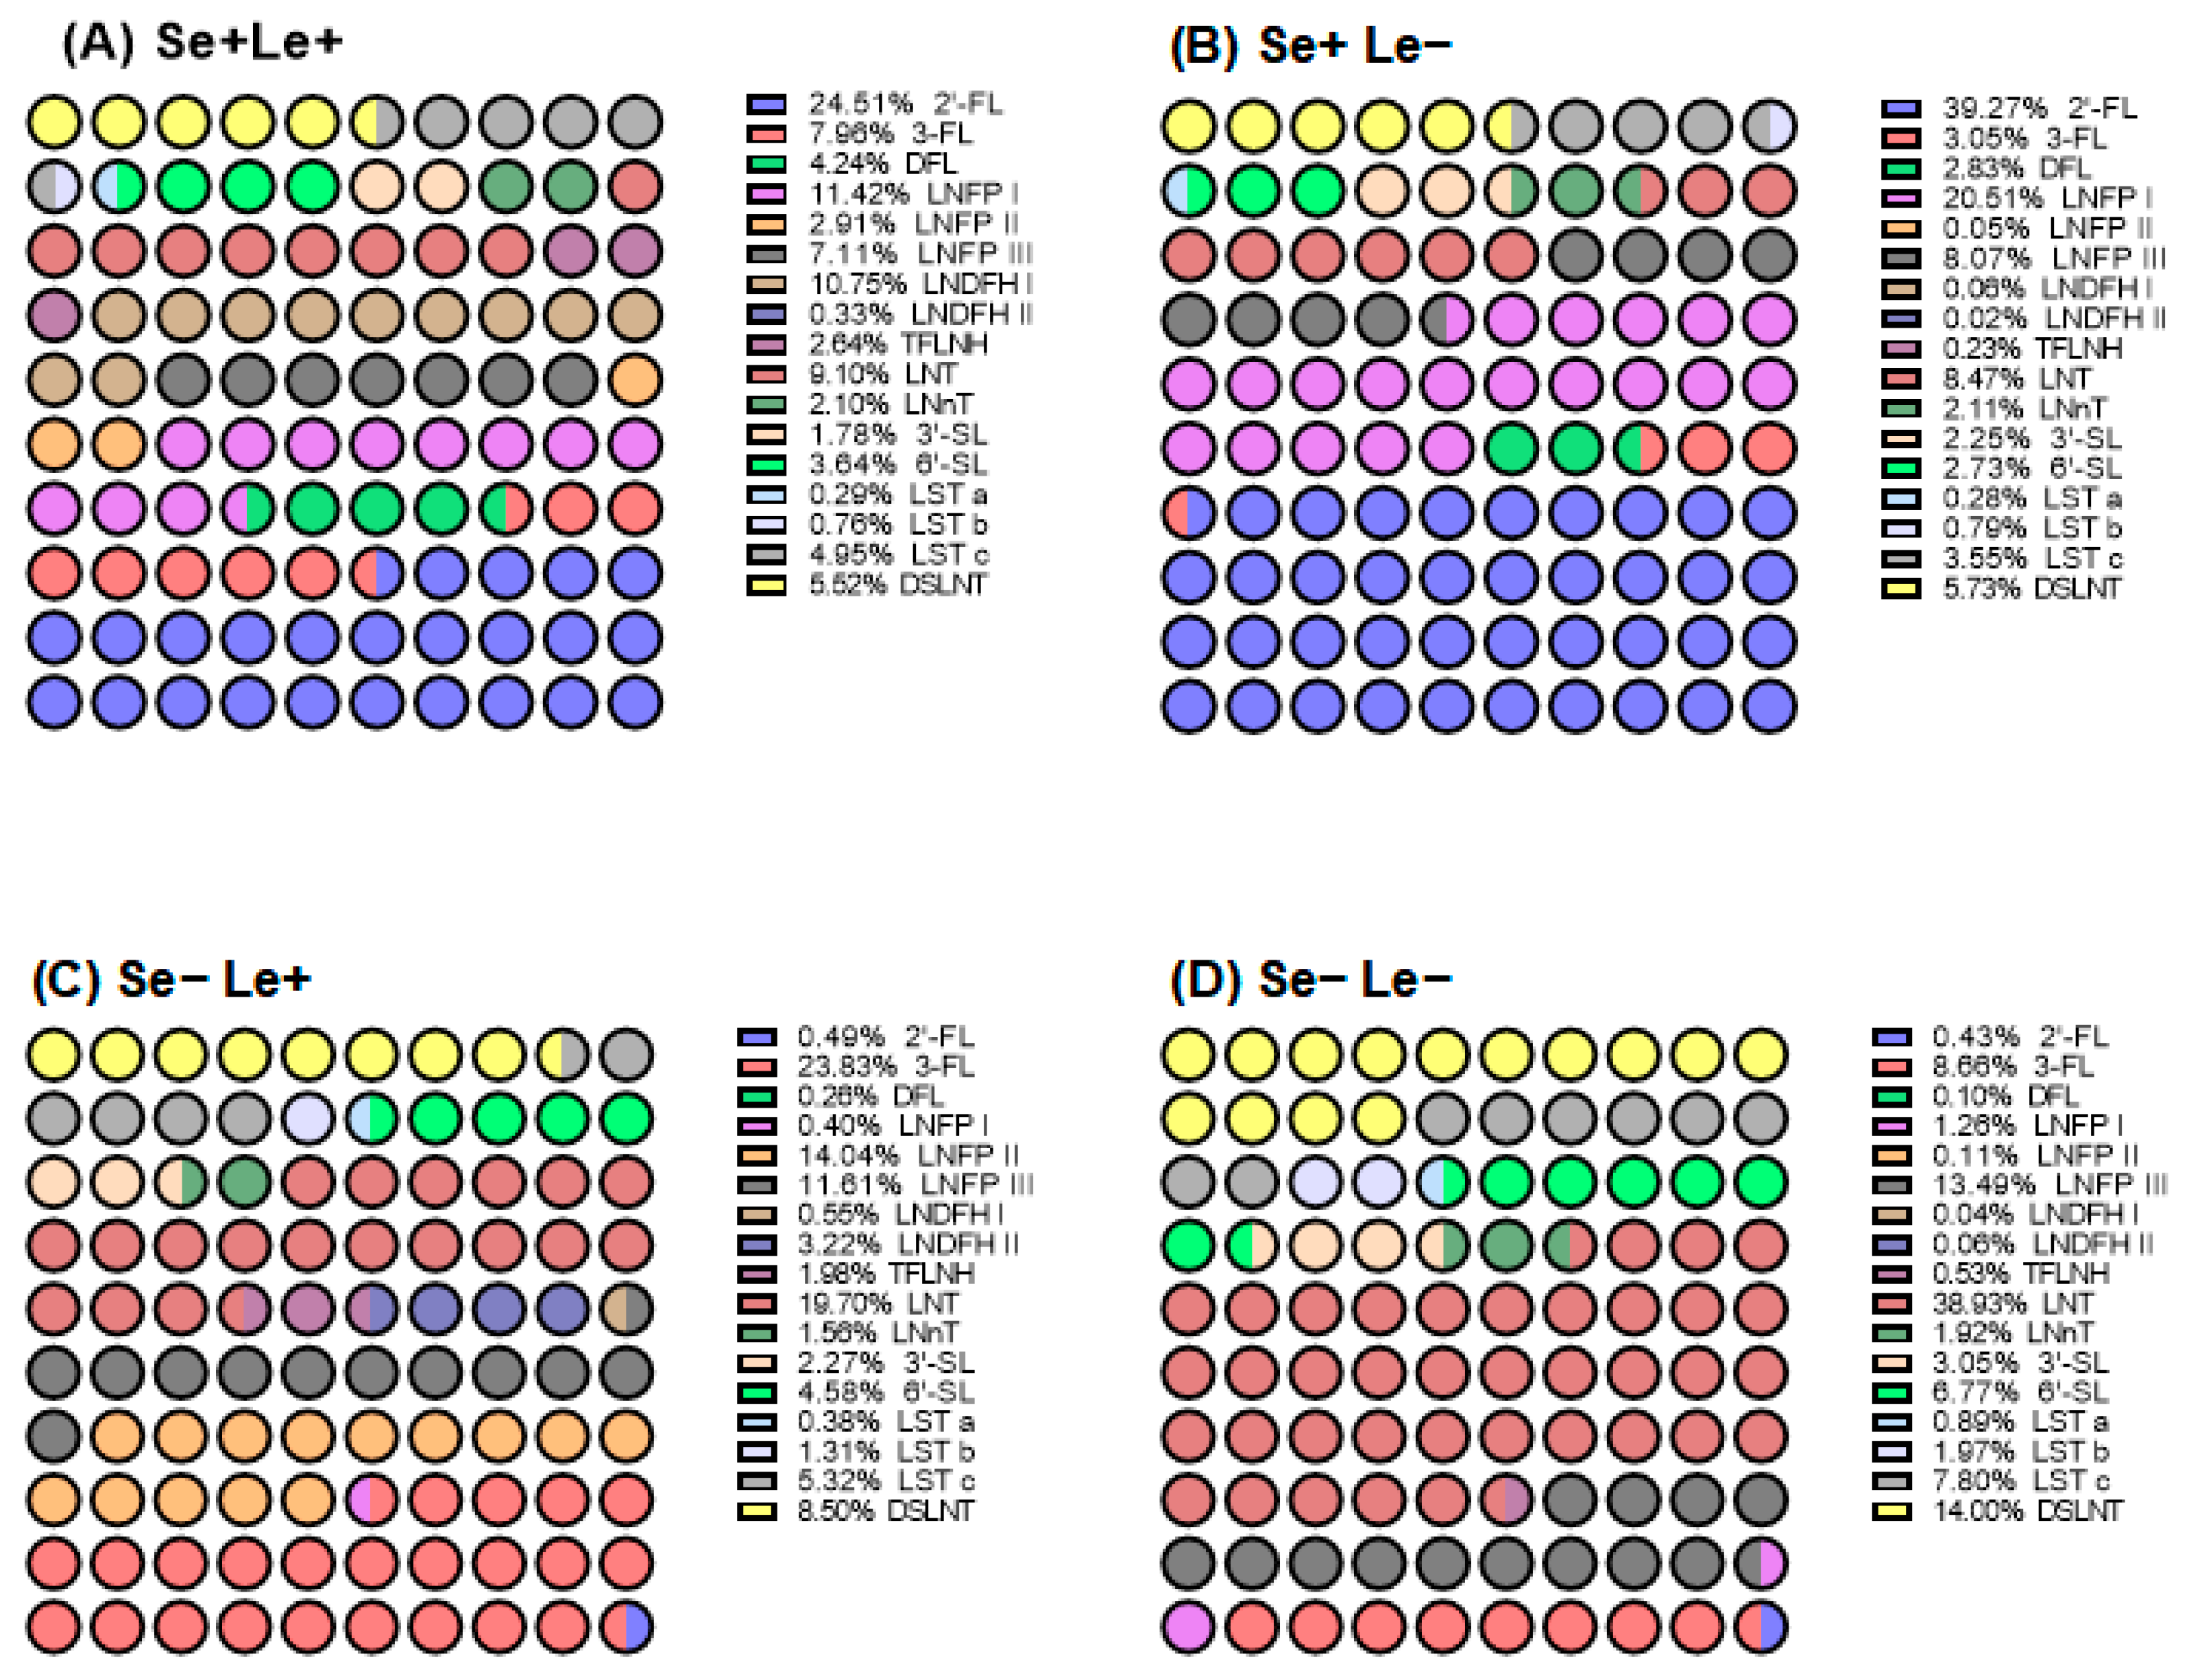
As shown in Figure 5, the distribution of HMOs is strongly influenced by maternal Se/Le phenotypes: Se+/Le+ and Se+/Le− milk is dominated by secretor-dependent HMOs such as 2′-FL (24.51% vs. 39.27%), LNFP I (11.42% vs. 20.51%), and LNDFH I level (10.75% vs. 0.06%). Se−/Le+ milk shows elevated Lewis-dependent HMOs, such as 3-FL (23.83%), LNT (19.70%), and LNFP II (14.04%). In contrast, Se−/Le− milk lacks both antigens and is characterized by high proportions of core structures such as LNT (38.93%), DSLNT (14.00%), and LNFP III (13.49%).
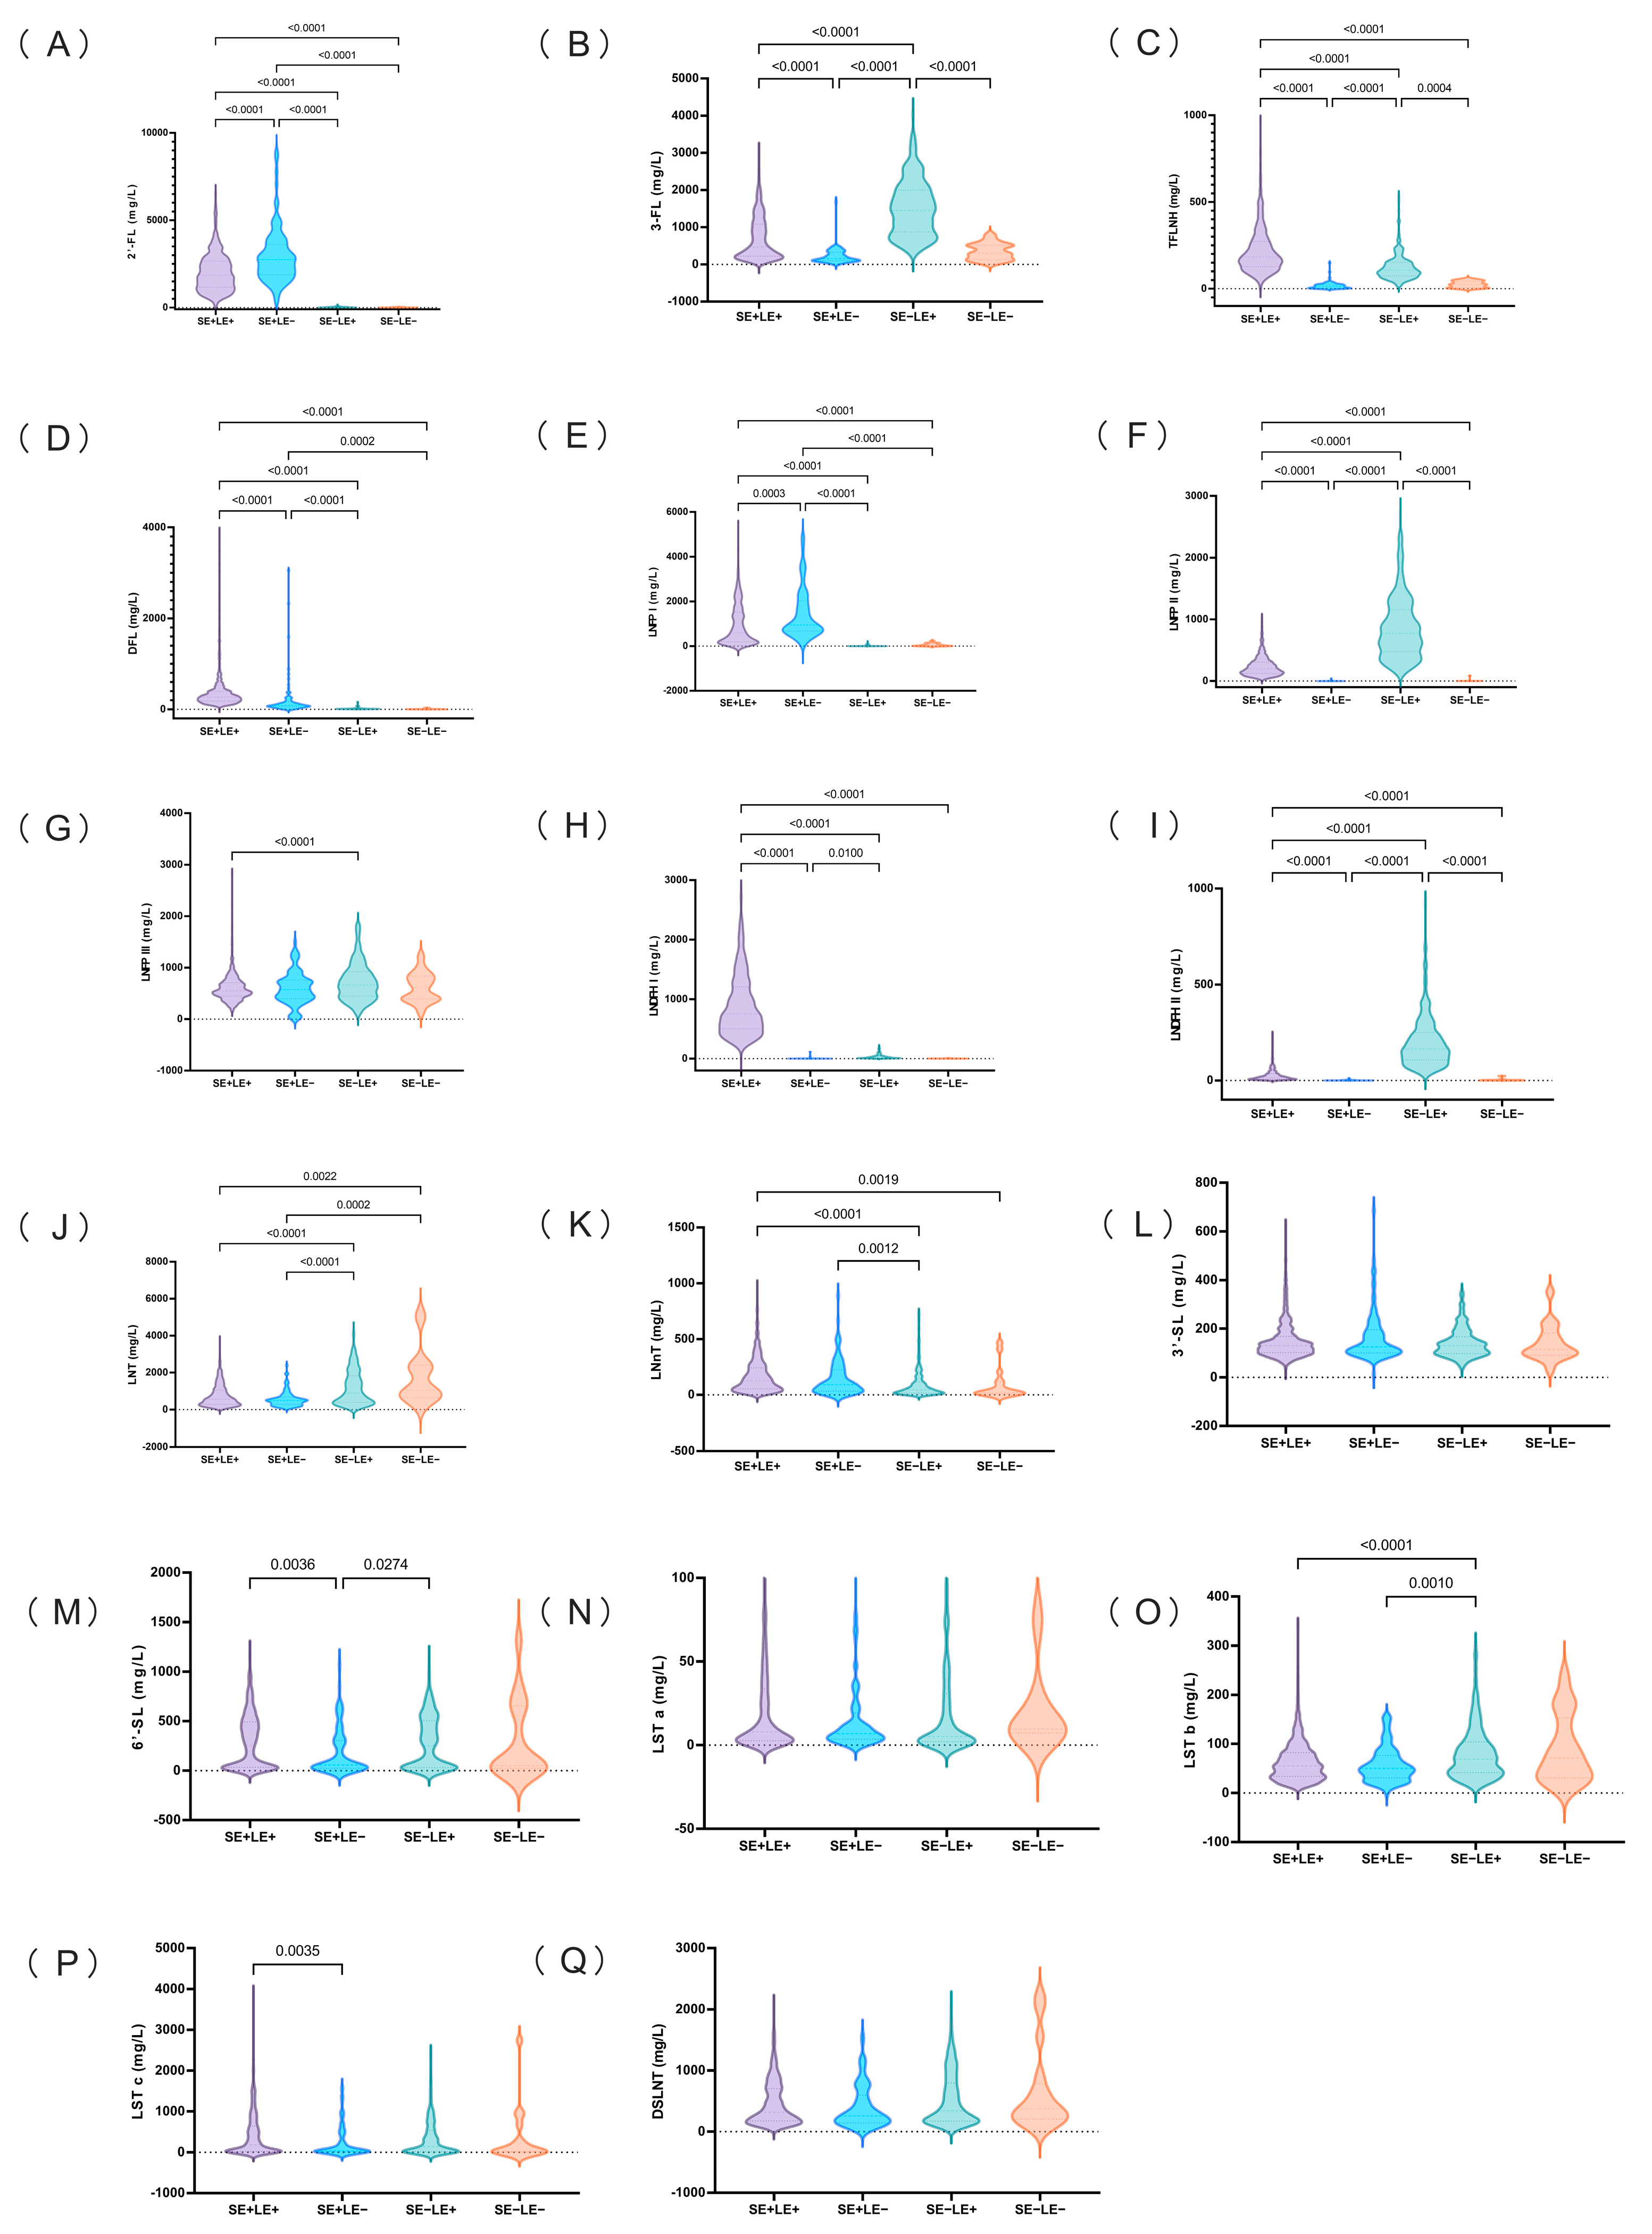
With the exception of 3′-SL, LST, and DSLNT, the remaining 14 HMOs showed significant differences across the four types of breast milk (Figure 6). The contents of 2′-FL, DFL, and LNFP I in Se+ breast milk were significantly higher than those in Se− breast milk, and the contents of LNT were significantly lower than those in Se− breast milk. In addition, the content of DSLNT in Se+ breast milk is lower than that in Se− breast milk, but not significantly. The contents of 3-FL, TFLNH, LNFP II, LNDFH I, and LNDFH 2 in Le+ breast milk were significantly higher than those in Le− breast milk. Beyond the HMOs previously documented in the literature (2′-FL, DFL, LNFP I, LNFP II, LNDFH I, and LNDFH 2), our study further identified 3-FL and TFLNH as robust biomarkers for distinguishing Le+ from Le− phenotypes, whereas LNT and LNnT exhibited specificity in differentiating Se+ and Se− groups. Other HMOs demonstrated limited discriminative power in classifying the Se/Le phenotype.

3.6. Trends in the Changes of 17 HMOs in Breast Milk Across Secretor and Lewis Phenotypes

As shown in Table 4, the changing trends of 15 HMOs across three major milk phenotypes (Se+/Le+, Se+/Le−, and Se−Le+) exhibited broadly similar patterns across lactation. Due to the limited sample size of the Se−Le− group at each lactation stage (CM: n = 2, TM: n = 3, M1: n = 3, M2: n = 3, and M3: n = 8), this group was excluded from trend analysis.
In Se+/Le+ and Se+/Le− milk, 2′-FL levels declined significantly with lactation progression (p < 0.001), stabilizing between 200 and 400 days postpartum (M2–M3). Although the content of 2′-FL in Se−/Le+ milk was markedly lower, it followed a similar downward trend across lactation. Conversely, 3-FL showed a continuous increased trend in all three groups, with Se−Le+ milk presenting the highest levels (up to 2236 mg/L at M3). DFL followed a U-shaped curve, with elevated levels at early (CM) and late (M3) lactation stages across Se+/Le+ and Se+/Le− phenotypes. The content of LNFP I decreased throughout the lactation period and plateaued between 200 and 400 days postpartum. The content of LNFP II first increased and then decreased, with the highest content in transitional milk, and tended to be stable between 200 and 400 days postpartum. LNFP III exhibited a gradual decrease over time in Se+/Le+ and Se−Le+ milk (p < 0.001), with only marginally significant change observed in Se+/Le− milk (p = 0.051). LNDFH I concentrations significantly declined across lactation in both Se+/Le+ and Se−Le+ milk (p < 0.001), whereas LNDFH 2 showed a gradual increase in Se+/Le+ milk, from 24 mg/L in CM to 46 mg/L in M3 (p < 0.001). In Se−Le+ milk, LNDFH 2 levels remained high throughout lactation (~200 mg/L), but the content in Le-type breast milk is lower than 10 mg/L. The trend of TFLNH differed by phenotype: in Se+/Le+ milk, it increased from CM to TM, followed by a decrease; in Se−Le+ milk, it showed an initial decrease, then increased again from TM to M3 (p < 0.001). LNT levels showed an inverted U-shape in all phenotypes, peaking in TM (e.g., 2223 mg/L in Se−Le+ milk). Thereafter, the Se−Le+ phenotype exhibited a sustained decline from TM to M3, whereas Se+ phenotypes decreased after the peak but remained relatively stable between M2 and M3. LNnT declined over time in all three groups (Se+/Le+, Se+/Le−, Se−Le+) (p < 0.001) and tended to plateau between 200 and 400 days postpartum. In terms of 3′-SL, levels were highest in CM, followed by a sharp decline during the TM stage and a further reduction to lower steady levels in mature milk (M1 and M2). A slight rebound was observed at the M3 only in Se+/Le+ milk, but concentrations did not return to CM levels. LST a, LST b, and LST c all decreased consistently throughout lactation, especially LST c, which dropped from 914–1130 mg/L in CM to 15–26 mg/L by M3 in all phenotypes (p < 0.001). Lastly, DSLNT exhibited unique trends. In Se+/Le+ milk, DSLNT content dropped significantly in the first 240 days but rose again by 300–400 days postpartum (from 161 mg/L to 206 mg/L, p < 0.001), forming a late-stage recovery pattern. In contrast, in Se+/Le− milk, DSLNT declined from TM to M1 and remained relatively stable from M1 to M3. In Se−Le+ milk, DSLNT also declined significantly from TM to M2, after which levels stabilized between M2 and M3.

3.7. Correlations Among HMOs and Their Associations with Maternal and Infant Factors

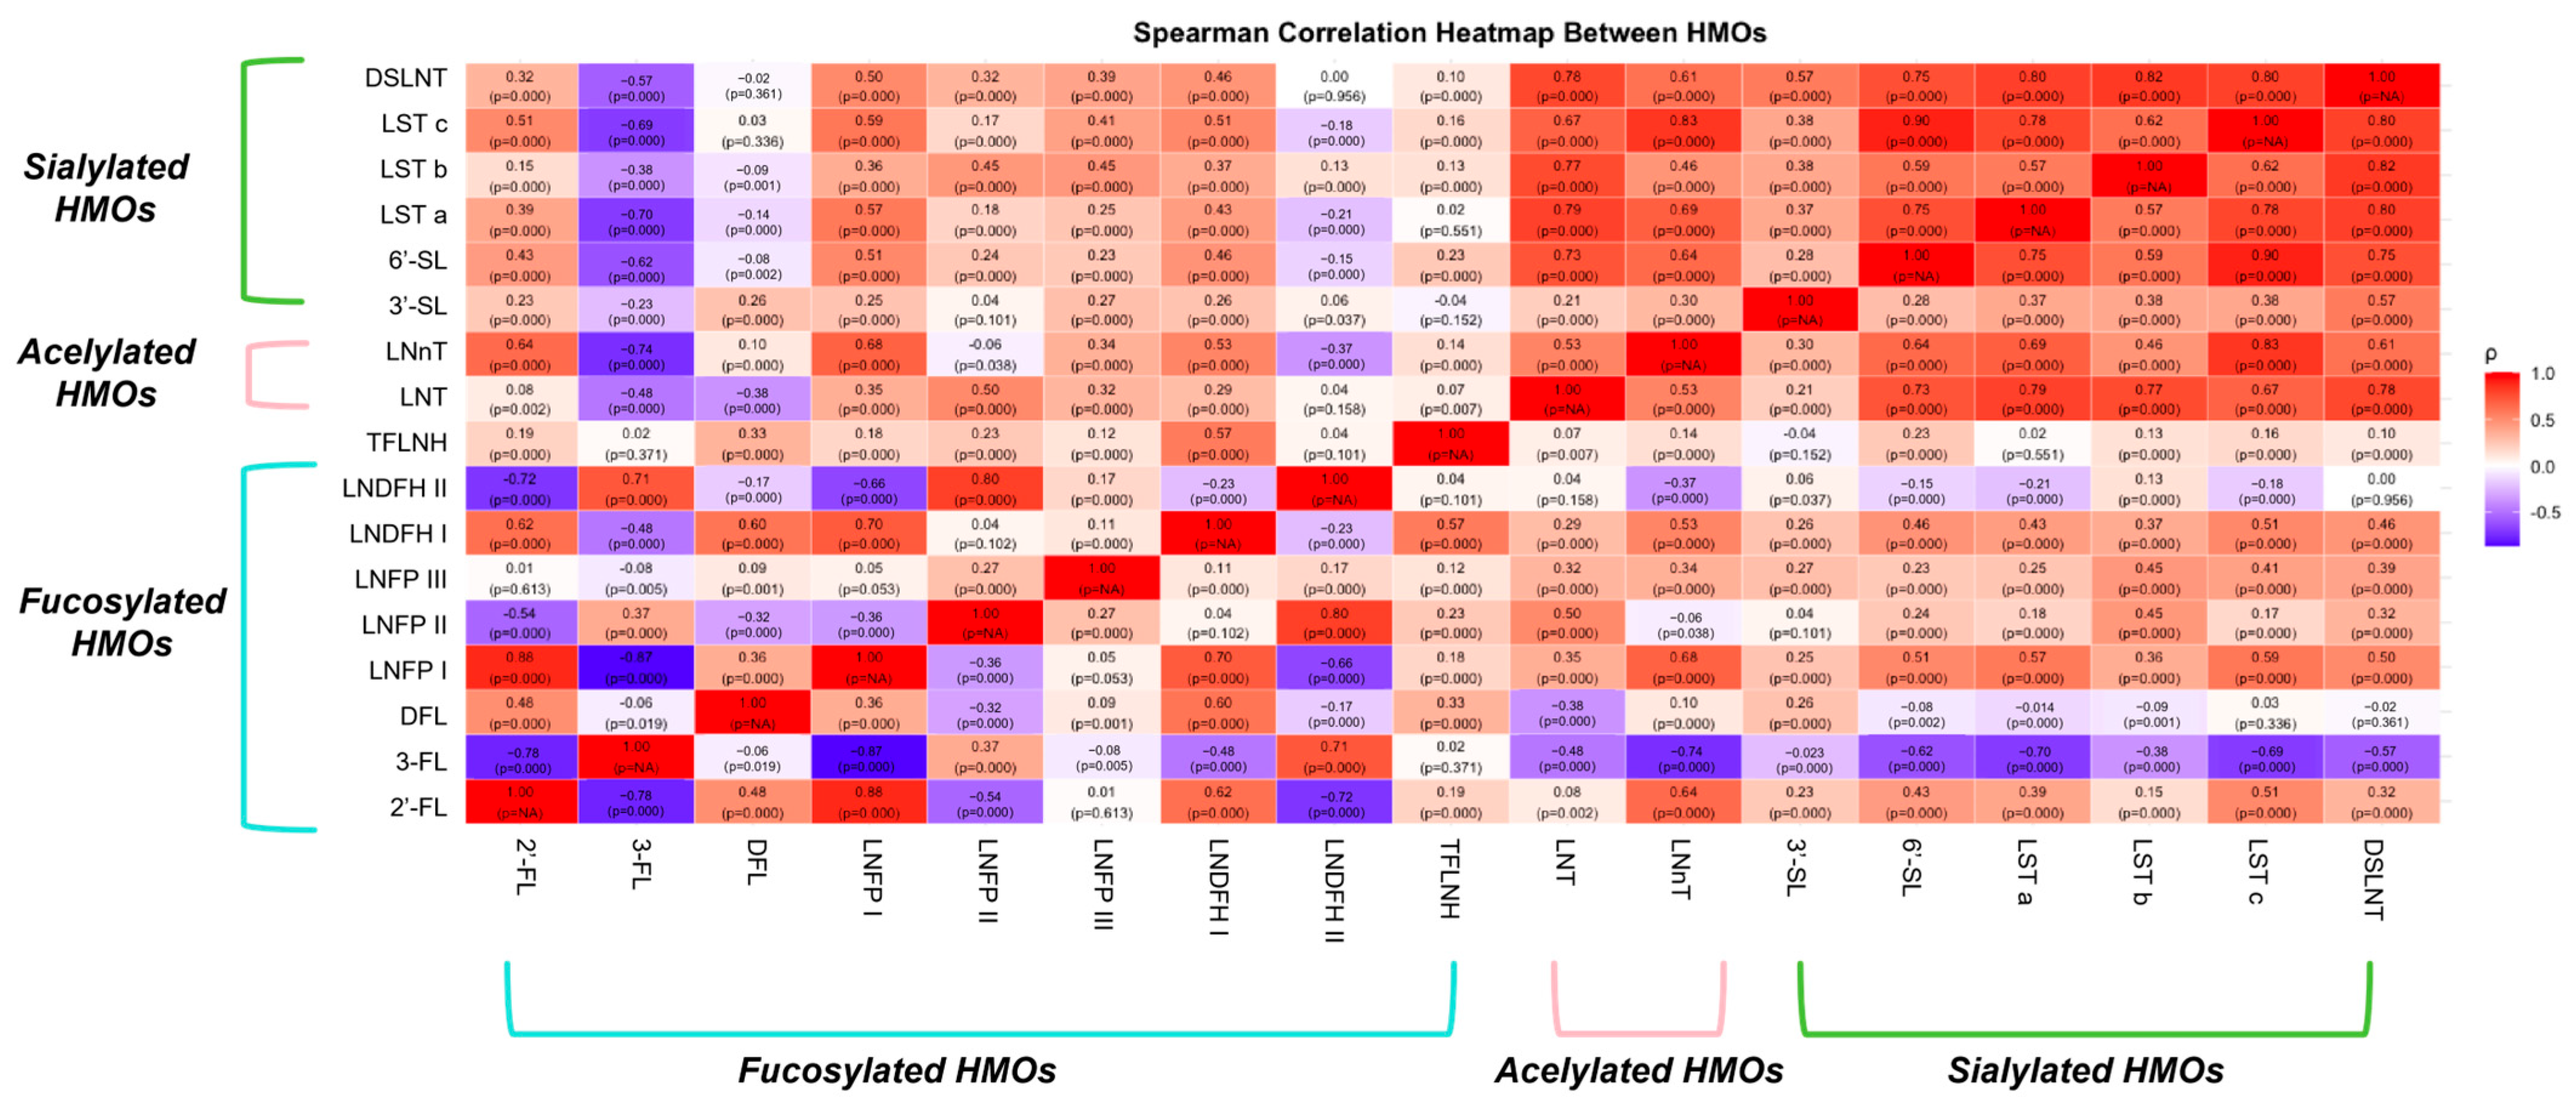
As shown in Figure 7, we calculated the correlations among various HMOs, categorizing them into three groups: fucosylated HMOs (blue bracket), acetylated HMOs (red bracket), and sialylated HMOs (green bracket). 2′-FL was positively associated with DFL, LNFP I, LNDFH I, and TFLNH, LNT, LNnT, and all sialylated HMOs, but negatively associated with 3-FL, LNFP II, and LNDFH II. 3-FL exhibited negative correlations with 2′-FL, DFL, LNFP I, LNFP III, and LNDFH I and all sialylated HMOs, but positively associated with LNFP II and LNDFH II. This may stem from substrate competition during the synthesis of fucosylated HMOs, particularly between (α1-2)- and (α1-3/4)-fucosylated HMOs.
In contrast, sialylated HMOs (e.g., 3′-SL, 6′-SL, LST a, LST b, LST c, and DSLNT) demonstrated strong positive correlations (r = 0.28–0.90), reflecting their structural similarities. Additionally, sialylated HMOs showed significant positive correlations with acetylated HMOs (e.g., LNT and LNnT) but exhibited significant negative or very weak positive correlations with fucosylated HMOs. This discrepancy may be linked to the presence of a shared Galβ1-4Glc structure, implying potential substrate competition among these HMOs.
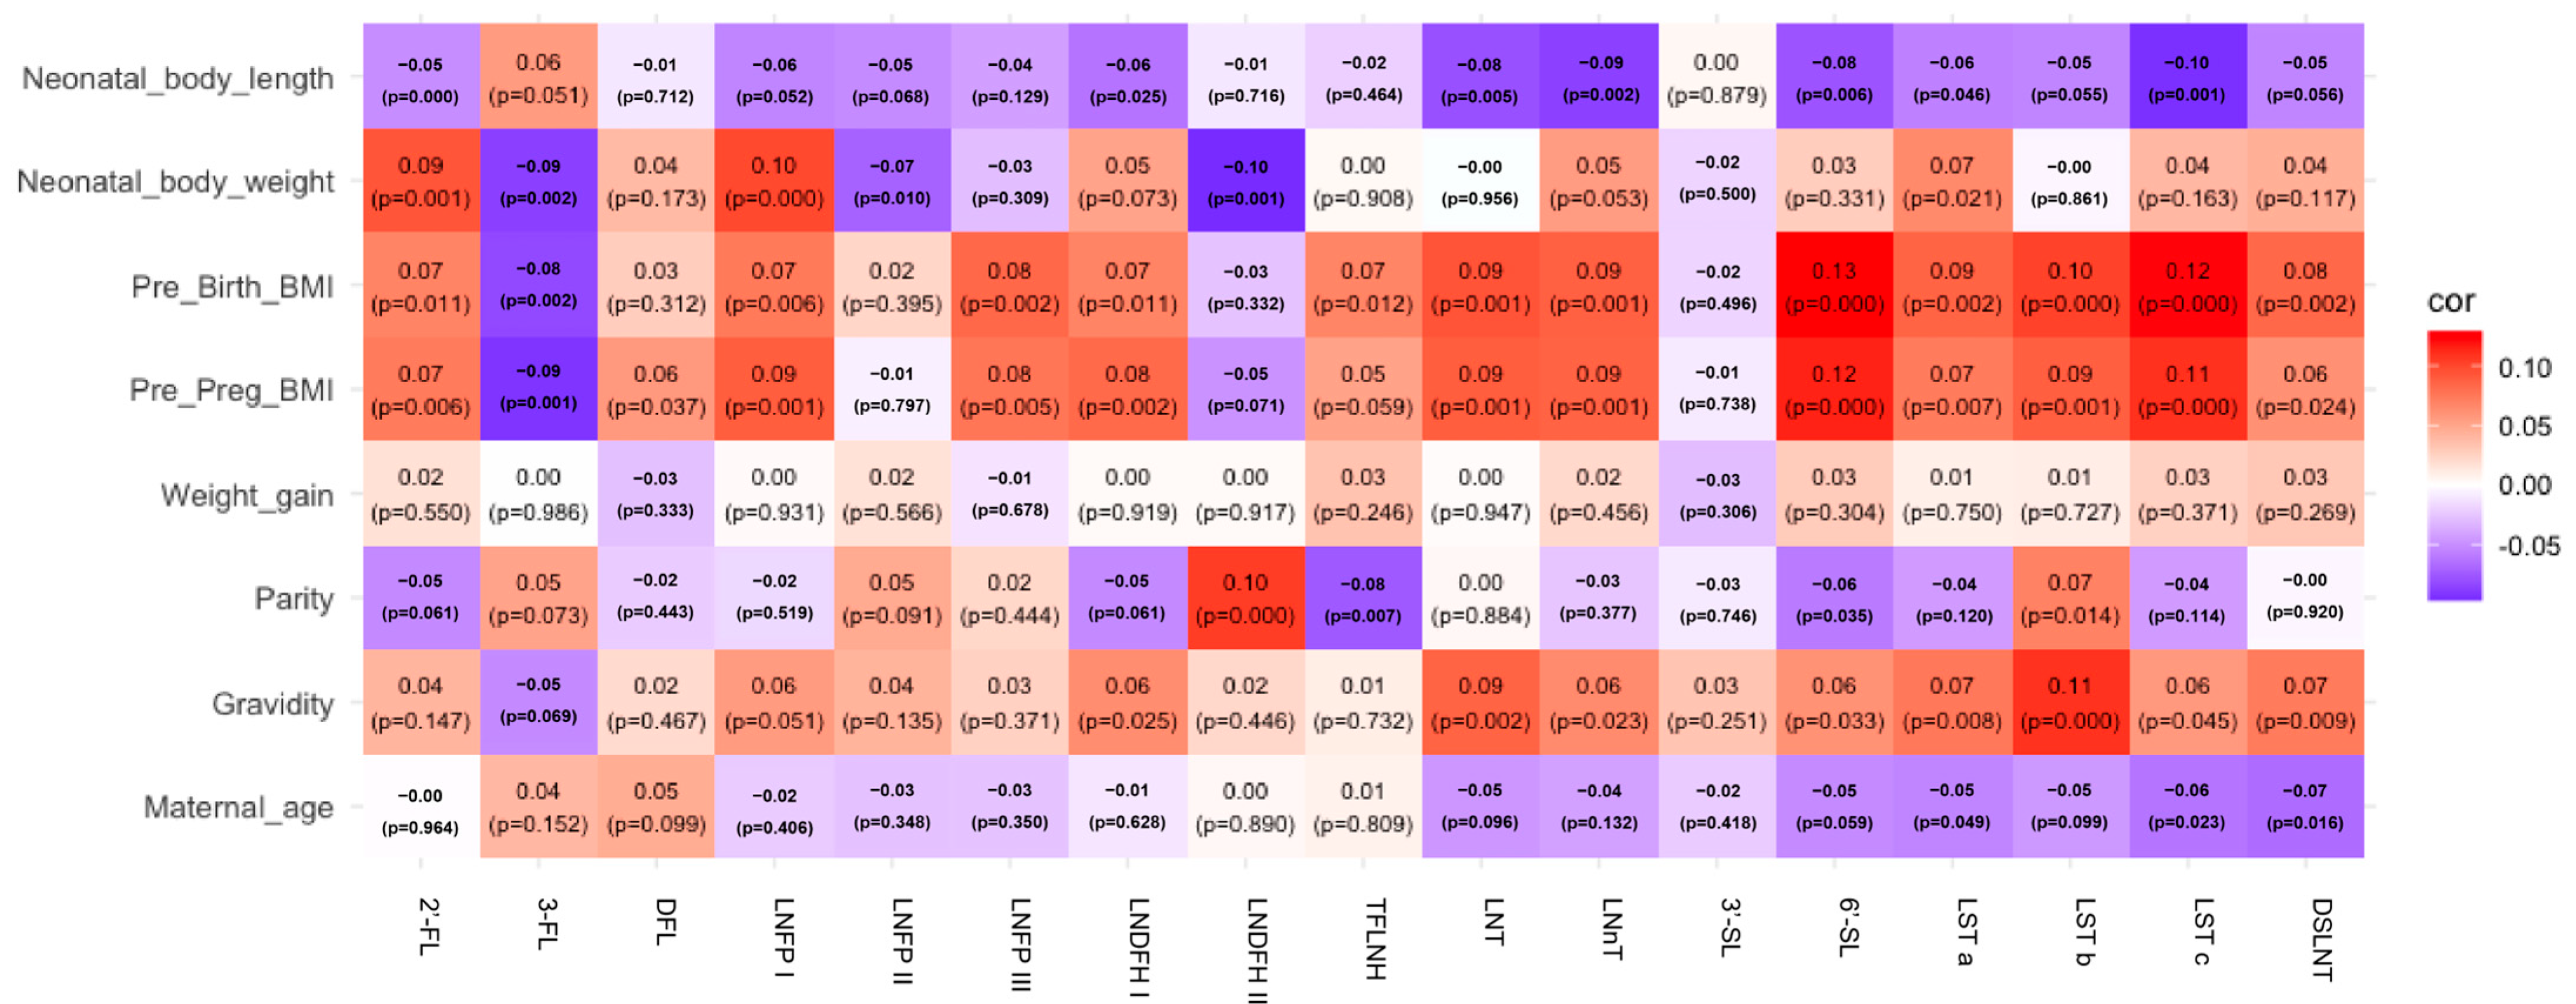
We further analyzed the associations between maternal factors (age, gravidity, parity, gestational weight gain, pre-pregnancy, and pre-delivery BMI) and HMO concentrations over the first 400 days postpartum (Figure 8). Maternal age at delivery was negatively correlated with LST a, LST c, and DSLNT. Gravidity showed positive correlations with acetylated HMOs (LNT and LNnT) and most sialylated HMOs (6′-SL, LST a, LST b, LST c, and DSLNT). Parity was positively correlated with LNDFH 2 and LST b but negatively correlated with TFLNH, and 6′-SL. Maternal obesity also significantly influenced HMO levels. Pre-pregnancy BMI was negatively correlated with 3-FL but positively correlated with 2′-FL, DFL, LNFP I, LNFP III, LNDFH I, LNT, LNnT, and most sialylated HMOs (6′-SL, LST a, LST b, LST c, and DSLNT). Pre-delivery BMI had broader effects; it was positively correlated with 2′-FL, LNFP I, LNFP III, LNDFH I, TFLNH, LNT, LNnT, and most sialylated HMOs (6′-SL, LST a, LST b, LST c, and DSLNT), yet negatively correlated with 3-FL. Gestational weight gain showed no significant association with HMO levels.
Lastly, we examined the correlations between infant growth metrics and HMOs. Birth body length was negatively associated with LNDFH I, LNT, LNnT, 6′-SL, LST a, and LST c. Birth weight was positively correlated with 2′-FL, LNFP I, and LST a but negatively with 3-FL, LNFP II, and LNDFH 2.
Despite the weak correlation coefficients, these findings suggest that HMO composition and levels are influenced by multiple maternal and infant factors and may be closely linked to infant growth and development.

4. Discussion

In this large-scale, multicenter study, we comprehensively assessed the absolute concentrations of representative HMOs in 1462 breast milk samples from six geographically diverse Chinese cities. Additionally, we systematically examined how HMO composition varied across lactation stages, maternal Se/Le phenotypes, and geographic regions. By presenting detailed quantitative profiles up to 13 months postpartum, our findings provide a robust foundation for developing a Chinese HMO reference database and inform strategies to tailor infant nutrition based on maternal phenotype and lactation stage. Overall, the lactation stage emerged as the primary driver of HMO concentration changes, with total HMO levels and individual components exhibiting distinct, time-dependent patterns. The total concentration of 17 HMOs in human milk exhibited a declining trend from 0 to 200 days postpartum, followed by a stable concentration between 200 and 400 days. Similarly, the levels of fucosylated HMOs decreased during the 0–200-day period and remained stable thereafter from 200 to 400 days. Colostrum contained the highest median concentration of fucosylated HMOs, reaching 8 g/L. In contrast, non-fucosylated neutral HMOs showed an initial increase followed by a decrease over the first 400 days, peaking in transitional milk at 10–15 days with a median concentration of 1.8 g/L, and remained stable between 200 and 400 days. Sialylated HMOs displayed a decreasing trend from 0 to 200 days and stabilized thereafter up to 400 days. The highest median concentration of sialylated HMOs was observed in colostrum, at 2.8 g/L.
Since the Se and Le genotypes directly determine the activity of FUT2 and FUT3 enzymes that catalyze the fucosylation of HMOs, understanding their population distribution is essential for interpreting the observed HMO profiles in this cohort. Notably, while the lactation stage reflects the trajectory of HMO concentrations, whereas Se and Le phenotypes—determined by FUT2 and FUT3 activity—represent fundamental genetic determinants that shape inter-individual variability in HMO composition, particularly for fucosylated structures. We systematically examined the Se/Le phenotypes of mothers in various Chinese cities. In our cohort, the Se+ to Se− ratio (78.7%:21.4%) was consistent with the general distribution pattern reported in Finland (87%:13%) [49], Brazil (89%:11%) [48], Spain (66%:34%) [50], and Malaysia (88%:12%) [51]. Moreover, in our cohort, the proportion of Le+ to Le− mothers was 92.6%:7.4%, consistent with the general distribution pattern observed in previous studies in China and other populations. Similar distributions have been reported among Chinese mothers (91–94% Le+) [44] and in Germany (94%:6%), a multinational study (87%:13%) [47], and an international cohort of 371 mothers [52]. Of all Se/Le phenotypes, the most predominant phenotype of our study participants was Se+/Le+ (72.5%), followed by Se−/Le+ (20.1%) and Se+/Le− (6.1%), with Se−/Le− being rare (1.2%). In Asian populations, the prevalence of the Se+/Le+ phenotype varies between 55% and 73%, while Se−/Le+ ranges from 20% to 31%, Se+/Le− from 6% to 11%, and Se−/Le− from 3% to 5% [53,54,55,56]. These distributions differ notably from African populations, where the distributions are approximately 54% for Se+/Le+, 14% for Se−/Le+, 25% for Se+/Le−, and 7% for Se−/Le−, with the proportion of Se+/Le− individuals being notably higher than in Asian populations [57]. In our study, only two mothers exhibited the Se−/Le− phenotype, underscoring its rarity in Asian populations. Notably, no significant regional differences in Se/Le phenotype distributions were observed across the six Chinese cities, suggesting that maternal fucosyltransferase activity is primarily determined by genetic background rather than geographic or environmental factors. Together, these findings provide robust population-level data on Se/Le phenotype distribution among Chinese mothers and support their relevance for interpreting inter-individual variability in HMO profiles.
Several studies have noted significant differences in oligosaccharide profiles between different geographical locations and provinces [30,44,58]. By examining the impact of geographical location on maternal phenotype, we found significant differences in the proportions of Se+ and Se− among six Chinese provinces, but no significant difference in the proportions of Le+ and Le−. Overall, more southerly regions had a higher proportion of Se+ mothers. Various factors, such as dietary habits and seasonal variations, may be closely associated with the province the mothers come from, affecting HMO levels. More than 90% of the mother-infant pairs recruited in the six regions of this study were of Han ethnicity and presumably had similar cultural and dietary habits, as well as a similar genetic background, which may have led to regional similarities. Future research can delve deeper into this issue by collecting samples from a broader range of locations and performing multivariate analyses.
Our findings confirm that the total HMO concentrations and compositional profiles varied significantly by phenotype. Se+/Le+ milk exhibited the highest total HMO concentrations, averaging 8342 mg/L, followed by Se+/Le− 7449 m g / L , Se−/Le+ 6276 m g / L , and Se−/Le− 4532 m g / L . Fucosylated HMOs accounted for the largest proportion 60.0 83.0 % across all samples, while non-fucosylated acetylated HMOs 8.4 17.6 % and sialylated HMOs 8.2 25.3 % contributed to smaller proportions. The stage of lactation also had a significant impact on HMO levels. Total HMO concentrations decreased as postpartum time progressed, with the most pronounced decline occurring after the first 200 days (CM to M2). This trend is consistent with findings from other longitudinal studies [33,44]. For example, 2′-FL content in Se+/Le+ milk dropped from 3262 mg/L in early lactation to 1104 mg/L after 200 days. This trend is consistent with prior studies in other populations. LNFP I also showed a marked decline, while 3-FL increased steadily throughout lactation, especially between 200 and 400 days postpartum. This pattern suggests a distinct role for 3-FL in later infancy, potentially supporting ongoing gut maturation, immune modulation, and neurodevelopment. The observed increase in 3-FL is likely attributable to its biosynthesis via FUT3 (encoded by the Le gene). Indeed, Se−/Le+ milk exhibited the highest 3-FL concentrations, consistent with prior evidence that 3-FL predominates in Se−/Le+ individuals due to substrate competition. Our data also support earlier reports that maternal genetic variation strongly influences enzyme activity and HMO composition, with 3-FL, 2′-FL, and LNFP I serving as biomarkers for differentiating phenotypes.
This study found that breast milk 2′-FL levels averaged 3–4 g/L in the first 45 days postpartum and 1 g/L between 200 and 400 days of secretor mothers. Additionally, secretor mothers provide high 2′-FL levels for up to one year, supporting early infant development. Preclinical studies associate 2′-FL with improved microbiota, pathogen defense, anti-inflammatory effects, and cognitive development. Clinical studies show that supplementation of 2′-FL 0.2 1.0 g / L to infant formula reduces plasma inflammatory cytokines and TNF-α by 29–83%, similar to levels in breastfed infants [13]. Another double-blind study reported that after 16 weeks, infants fed 2′-FL-supplemented formula 1.0 g / L showed altered Bifidobacterium metabolism and increased activity of two HMO-related glycosyl hydrolase families [59]. Among secretor mothers, the second most abundant fucosylated HMO was LNFP I and was exclusively present in the Se+ participants. Its concentration showed a significant decrease throughout lactation, consistent with findings from other studies [49]. These findings suggest that high-level HMOs such as 2′-FL in breast milk may promote early infant development and health through gut health benefits, including improved microbiota, enhanced pathogen defense, and reduced inflammation.
This study also extends the focus to other fucosylated HMOs, particularly highlighting 3-FL as one of the most predominant fucosylated HMOs aside from 2′-FL. Notably, the concentration dynamics of 3-FL exhibit a distinct time-dependent pattern: during the first year postpartum, its levels demonstrate a consistent upward trend throughout lactation. Although the decline in 2′-FL concentration during lactation was not statistically significant, it aligns with trends reported in previous studies. The two isomers, 2′-FL and 3-FL, differ in the position of the fucose attachment on the lactose molecule: in 2′-FL, fucose is linked via an α1-2 glycosidic bond, while in 3-FL, it is linked via an α1-3 glycosidic bond. Both isomers play crucial roles in infant health, supporting gut microbiota development, immune regulation, antiviral and antimicrobial defense, and neurological maturation, as shown in preclinical and clinical studies [60,61]. 3-FL is one of the few HMOs known to increase significantly during lactation, suggesting its importance beyond the exclusive breastfeeding period. This oligosaccharide may provide benefits to infants aged 6 to 12 months, a period beyond the typical lactation phase [62]. The concentration of 3-FL increased across lactation in all groups except the Se−/Le− group, where a reduction at month three was followed by a recovery in month four The Se−/Le+ group showed the highest 3-FL levels. Synthesis of 3-FL is influenced by the expression of the Le gene, while FUT3 is the key enzyme responsible for its biosynthesis. Other studies have observed higher levels of 3-FL in non-secretor milk compared to secretor milk, suggesting that the availability of the enzyme substrates leads to competition, thereby influencing the relative levels of fucosylated HMOs [63,64]. Ning et al. (2024) [65] reported that mothers from the Han Hebei region exhibited higher 3-FL levels than the average values found in other Chinese cohorts. These differences were primarily attributed to the presence or absence of α1,2-fucosylated HMOs, such as 2′-FL, LNFP I, and LNDFH I, in secretor and non-secretor milk.
Among sialylated HMOs, 6′-SL, LST c, and DSLNT were the most abundant across all Se/Le groups. Overall, 6′-SL and LST c consistently declined with lactation, whereas 3′-SL showed a peak in CM, a sharp decline by the transitional stage, stabilization at low levels during mature milk, and a slight late-stage rebound limited to Se+/Le+ milk. DSLNT, another prominent sialylated HMO, showed a consistent decline across lactation stages, except in Se+/Le+ milk, where it slightly increased between 200 and 400 days postpartum. The dynamic changes in HMO concentrations during lactation and their complex relationships highlight the potential roles of specific HMOs in infant development. DSLNT exhibited a significant negative correlation with advancing lactation, in agreement with previously reported data [30]. The biological relevance of these compositional changes warrants further investigation.
Maternal characteristics also correlated with HMO concentrations. Maternal age showed negative correlations with LST a, LST c, and DSLNT, suggesting that older mothers may produce lower levels of certain sialylated HMOs, potentially impacting functions related to infant neurodevelopment and immunity [66]. Pre-pregnancy and pre-delivery BMI also demonstrated correlations with a wide range of HMOs, highlighting the potential importance of maternal metabolic status during late pregnancy and lactation. Although most correlations were weak in magnitude, the consistent patterns underscore the multifactorial regulation of HMO biosynthesis by maternal physiology and its potential impact on infant growth. These observations highlight the importance of personalized nutritional strategies during lactation, particularly for populations with metabolic risk factors or multiple maternity histories and warrant further mechanistic studies to clarify causality and clinical significance.
While existing research on Chinese lactation has predominantly centered on early postpartum stages (<6 months), our investigation extends the methodological rigor to 13 months post-delivery, providing new insights into longitudinal HMO trajectory evolution. Despite its strengths, including a nationally representative cohort n = 1462 and HPAEC-PAD-based quantification of 17 principal HMOs, this study acknowledges several constraints. Notably, while our analysis encompassed key fucosylated, sialylated, and acetylated structures, the targeted HMOs represent <10% of the documented structural diversity in human milk (>200 identified variants), although they represent over 80% of the quantified HMOs in human milk [67]. Additionally, although spanning six geographical regions, demographic homogeneity persists (the ethnicity of >90% of participants was Han), necessitating validation in multi-ethnic cohorts with distinct genetic backgrounds and dietary patterns. Crucially, the absence of infant biometric linkage data leaves the biological relevance of observed HMO fluctuations unresolved, highlighting an opportunity for subsequent investigations to establish clinical correlations between temporal HMO profiles and pediatric developmental endpoints.

5. Conclusions

This study establishes the first large-scale, longitudinal profile of human milk oligosaccharides (HMOs) in China, encompassing diverse lactation stages (0–400 days postpartum) and six major geographic regions. Our data reveal that HMO composition is modulated by maternal secretor/Le phenotypes and dynamic lactational timelines. These findings provide insights for feeding strategies that integrate maternal genotyping and stage-specific milk biochemistry. By creating the most comprehensive Chinese HMO reference database to date (1462 samples), this work fills a critical gap in global lactational biology while providing an evidence base for developing tailored formula milk and optimizing breastfeeding guidelines. Future translational research could prioritize linking these HMO signatures to infant gut microbiota maturation, immune competency metrics, and neurodevelopmental outcomes.

Author Contributions

Conceptualization, Y.M. and S.W.; methodology, S.L. and Q.L.; formal analysis and data curation, S.L. and Q.L.; writing—original draft preparation, S.L. and Q.L.; writing—review and editing, C.P., S.T.M., R.H.B., X.L., Y.M. and S.W.; visualization, S.L. and Q.L.; supervision, S.W.; project administration, S.W.; funding acquisition, S.W. All authors have read and agreed to the published version of the manuscript.

Funding

This research was funded by the Abbott Nutrition Research and Development (R&D) Centre (2021557), Shanghai, China.

Institutional Review Board Statement

The study was conducted in accordance with the Declaration of Helsinki and approved by the Ethics Committee of Tianjin hospital of ITCWM Nankai hospital (NKYY_YX-IRB 2018_005_01, 6 February 2018) and registered in the China Clinical Trial Center (ChiCTR1800015387, 28 March 2018).

Informed Consent Statement

Informed consent was obtained from all subjects involved in the study.

Data Availability Statement

The datasets generated or analyzed during the current study are not publicly available due to the data management requirements of our institution but are available from the corresponding authors upon reasonable request.

Conflicts of Interest

The authors declare no conflict of interest. C.P., S.T.M., R.H.B., X.L., and Y.M. were all employees of Abbott Nutrition Research & Development Center when this work was completed. The authors declare that this study received funding from the Abbott Nutrition Research and Development (R&D) Centre, Shanghai, China. The funder was not involved in the study design, collection, analysis, interpretation of data, the writing of this article or the decision to submit it for publication.

Abbreviations

The following abbreviations are used in this manuscript:
HMOshuman milk oligosaccharides
2′-FL2′-fucosyllactose
3-FL3-fucosyllactose
DFLdifucosyllactose
LNFP Ilacto-N-fucopentaose I
LNFP IIlacto-N-fucopentaose II
LNFP IIIlacto-N-fucopentaose III
LNDFH Ilacto-N-difucohexaose I
LNDFH IIlacto-N-difucohexaose II
TFLNHtri-fucosyl-lacto-N-hexaose
LNTlacto-N-tetraose
LNnTlacto-N-neo-tetraose
3′-SL3′-sialyllactose
6′-SL6′-sialyllactose
LST a/b/csialyl-lacto-N-tetraose a/b/c
DSLNTdisialyl-lacto-N-tetraose
SCFAsshort-chain fatty acids
Neu5AcN-acetylneuraminic acid
GlcD-glucose
GalD-galactose
GlcNAcN-acetylglucosamine
FucL-fucose
SeSecretor
LeLewis
Se+/Se−Secretor-positive/negative
Le+/Le−Lewis-positive/negative
FUT2α1-2-fucosyltransferase gene
FUT3α1-3-fucosyltransferase gene
CA19-9Carbohydrate Antigen 19-9
HPAEC-PADhigh-performance anion exchange chromatography-pulsed amperometric detection
CMcolostrum
TMtransitional milk
M1mature milk stage 1
M2mature milk stage 2
M3mature milk stage 3
ANOVAAnalysis of Variance
SPSSStatistical Package for the Social Sciences
FDRFalse Discovery Rate
SDStandard Deviation
SEStandard Error
WHOWorld Health Organization
MUAIMaternal Nutrition and Infant Investigation
ChiCTRChina Clinical Trial Center
TNF-αTumor Necrosis Factor-α
BMIBody Mass Index

References

  1. Domenici, R.; Vierucci, F. Exclusive Breastfeeding and Vitamin D Supplementation: A Positive Synergistic Effect on Prevention of Childhood Infections? Int. J. Environ. Res. Public Health 2022, 19, 2973. [Google Scholar] [CrossRef]
  2. Boix-Amorós, A.; Collado, M.C.; Van’t Land, B.; Calvert, A.; Le Doare, K.; Garssen, J.; Hanna, H.; Khaleva, E.; Peroni, D.G.; Geddes, D.T.; et al. Reviewing the Evidence on Breast Milk Composition and Immunological Outcomes. Nutr. Rev. 2019, 77, 541–556. [Google Scholar] [CrossRef] [PubMed]
  3. Schalich, K.M.; Buendia, M.A.; Kaur, H.; Choksi, Y.A.; Washington, M.K.; Codreanu, G.S.; Sherrod, S.D.; McLean, J.A.; Peek, R.M., Jr.; Acra, S.A.; et al. A Human Milk Oligosaccharide Prevents Intestinal Inflammation in Adulthood via Modulating Gut Microbial Metabolism. mBio 2024, 15, e00298-24. [Google Scholar] [CrossRef] [PubMed]
  4. Moore, R.E.; Xu, L.L.; Townsend, S.D. Prospecting Human Milk Oligosaccharides as a Defense Against Viral Infections. ACS Infect. Dis. 2021, 7, 254–263. [Google Scholar] [CrossRef] [PubMed]
  5. Dinleyici, M.; Barbieur, J.; Dinleyici, E.C.; Vandenplas, Y. Functional Effects of Human Milk Oligosaccharides (HMOs). Gut Microbes 2023, 15, 2186115. [Google Scholar] [CrossRef]
  6. Kim, K.M.; Choi, J.-W. Associations between Breastfeeding and Cognitive Function in Children from Early Childhood to School Age: A Prospective Birth Cohort Study. Int. Breastfeed. J. 2020, 15, 83. [Google Scholar] [CrossRef]
  7. Victora, C.G.; Horta, B.L.; Loret de Mola, C.; Quevedo, L.; Pinheiro, R.T.; Gigante, D.P.; Gonçalves, H.; Barros, F.C. Association between Breastfeeding and Intelligence, Educational Attainment, and Income at 30 Years of Age: A Prospective Birth Cohort Study from Brazil. Lancet Glob. Health 2015, 3, e199–e205. [Google Scholar] [CrossRef]
  8. AlThuneyyan, D.A.; AlGhamdi, F.F.; AlZain, R.N.; AlDhawyan, Z.S.; Alhmly, H.F.; Purayidathil, T.S.; AlGindan, Y.Y.; Abdullah, A.A. The Effect of Breastfeeding on Intelligence Quotient and Social Intelligence Among Seven- to Nine-Year-Old Girls: A Pilot Study. Front. Nutr. 2022, 9, 726042. [Google Scholar] [CrossRef]
  9. Bode, L. Human Milk Oligosaccharides: Every Baby Needs a Sugar Mama. Glycobiology 2012, 22, 1147–1162. [Google Scholar] [CrossRef]
  10. Kull, I.; Böhme, M.; Wahlgren, C.-F.; Nordvall, L.; Pershagen, G.; Wickman, M. Breast-Feeding Reduces the Risk for Childhood Eczema. J. Allergy Clin. Immunol. 2005, 116, 657–661. [Google Scholar] [CrossRef]
  11. Picciano, M.F. Nutrient Composition of Human Milk. Pediatr. Clin. N. Am. 2001, 48, 53–67. [Google Scholar] [CrossRef]
  12. Chen, Q.; Ma, X.; Guo, Z.; Zhang, P.; Li, B.; Wang, Z. Gut Microbiota: A Key Role for Human Milk Oligosaccharides in Regulating Host Health Early in Life. Compr. Rev. Food Sci. Food Saf. 2024, 23, e13431. [Google Scholar] [CrossRef]
  13. Goehring, K.C.; Marriage, B.J.; Oliver, J.S.; Wilder, J.A.; Barrett, E.G.; Buck, R.H. Similar to Those Who Are Breastfed, Infants Fed a Formula Containing 2′-Fucosyllactose Have Lower Inflammatory Cytokines in a Randomized Controlled Trial. J. Nutr. 2016, 146, 2559–2566. [Google Scholar] [CrossRef]
  14. Marriage, B.J.; Buck, R.H.; Goehring, K.C.; Oliver, J.S.; Williams, J.A. Infants Fed a Lower Calorie Formula With 2′FL Show Growth and 2′FL Uptake Like Breast-Fed Infants. J. Pediatr. Gastroenterol. Nutr. 2015, 61, 649–658. [Google Scholar] [CrossRef]
  15. Newburg, D.S. Oligosaccharides in Human Milk and Bacterial Colonization. J. Pediatr. Gastroenterol. Nutr. 2000, 30, S8–S17. [Google Scholar] [CrossRef] [PubMed]
  16. Sela, D.A.; Chapman, J.; Adeuya, A.; Kim, J.H.; Chen, F.; Whitehead, T.R.; Lapidus, A.; Rokhsar, D.S.; Lebrilla, C.B.; German, J.B.; et al. The Genome Sequence of Bifidobacterium Longum Subsp. Infantis Reveals Adaptations for Milk Utilization within the Infant Microbiome. Proc. Natl. Acad. Sci. USA 2008, 105, 18964–18969. [Google Scholar] [CrossRef] [PubMed]
  17. Jacobi, S.K.; Yatsunenko, T.; Li, D.; Dasgupta, S.; Yu, R.K.; Berg, B.M.; Chichlowski, M.; Odle, J. Dietary Isomers of Sialyllactose Increase Ganglioside Sialic Acid Concentrations in the Corpus Callosum and Cerebellum and Modulate the Colonic Microbiota of Formula-Fed Piglets. J. Nutr. 2016, 146, 200–208. [Google Scholar] [CrossRef]
  18. Vázquez, E.; Barranco, A.; Ramírez, M.; Gruart, A.; Delgado-García, J.M.; Martínez-Lara, E.; Blanco, S.; Martín, M.J.; Castanys, E.; Buck, R.; et al. Effects of a Human Milk Oligosaccharide, 2’-Fucosyllactose, on Hippocampal Long-Term Potentiation and Learning Capabilities in Rodents. J. Nutr. Biochem. 2015, 26, 455–465. [Google Scholar] [CrossRef] [PubMed]
  19. Berger, P.K.; Plows, J.F.; Jones, R.B.; Alderete, T.L.; Yonemitsu, C.; Poulsen, M.; Ryoo, J.H.; Peterson, B.S.; Bode, L.; Goran, M.I. Human Milk Oligosaccharide 2’-Fucosyllactose Links Feedings at 1 Month to Cognitive Development at 24 Months in Infants of Normal and Overweight Mothers. PLoS ONE 2020, 15, e0228323. [Google Scholar] [CrossRef]
  20. Docq, S.; Spoelder, M.; Wang, W.; Homberg, J.R. The Protective and Long-Lasting Effects of Human Milk Oligosaccharides on Cognition in Mammals. Nutrients 2020, 12, 3572. [Google Scholar] [CrossRef]
  21. Cho, S.; Zhu, Z.; Li, T.; Baluyot, K.; Howell, B.R.; Hazlett, H.C.; Elison, J.T.; Hauser, J.; Sprenger, N.; Wu, D.; et al. Human Milk 3’-Sialyllactose Is Positively Associated with Language Development during Infancy. Am. J. Clin. Nutr. 2021, 114, 588–597. [Google Scholar] [CrossRef]
  22. Smilowitz, J.T.; Lebrilla, C.B.; Mills, D.A.; German, J.B.; Freeman, S.L. Breast Milk Oligosaccharides: Structure-Function Relationships in the Neonate. Annu. Rev. Nutr. 2014, 34, 143–169. [Google Scholar] [CrossRef] [PubMed]
  23. Wang, J.; Chen, M.-S.; Wang, R.-S.; Hu, J.-Q.; Liu, S.; Wang, Y.-Y.-F.; Xing, X.-L.; Zhang, B.-W.; Liu, J.-M.; Wang, S. Current Advances in Structure–Function Relationships and Dose-Dependent Effects of Human Milk Oligosaccharides. J. Agric. Food Chem. 2022, 70, 6328–6353. [Google Scholar] [CrossRef]
  24. Wu, S.; Tao, N.; German, J.B.; Grimm, R.; Lebrilla, C.B. Development of an Annotated Library of Neutral Human Milk Oligosaccharides. J. Proteome Res. 2010, 9, 4138–4151. [Google Scholar] [CrossRef] [PubMed]
  25. Wu, S.; Grimm, R.; German, J.B.; Lebrilla, C.B. Annotation and Structural Analysis of Sialylated Human Milk Oligosaccharides. J. Proteome Res. 2011, 10, 856–868. [Google Scholar] [CrossRef]
  26. Kuntz, S.; Kunz, C.; Borsch, C.; Hill, D.; Morrin, S.; Buck, R.; Rudloff, S. Influence of Microbially Fermented 2’-Fucosyllactose on Neuronal-like Cell Activity in an in Vitro Co-Culture System. Front. Nutr. 2024, 11, 1351433. [Google Scholar] [CrossRef]
  27. Tonon, K.M.; Miranda, A.; Abrão, A.C.F.V.; De Morais, M.B.; Morais, T.B. Validation and Application of a Method for the Simultaneous Absolute Quantification of 16 Neutral and Acidic Human Milk Oligosaccharides by Graphitized Carbon Liquid Chromatography—Electrospray Ionization—Mass Spectrometry. Food Chem. 2019, 274, 691–697. [Google Scholar] [CrossRef]
  28. Thurl, S.; Munzert, M.; Henker, J.; Boehm, G.; Müller-Werner, B.; Jelinek, J.; Stahl, B. Variation of Human Milk Oligosaccharides in Relation to Milk Groups and Lactational Periods. Br. J. Nutr. 2010, 104, 1261–1271. [Google Scholar] [CrossRef]
  29. Sprenger, N.; Lee, L.Y.; De Castro, C.A.; Steenhout, P.; Thakkar, S.K. Longitudinal Change of Selected Human Milk Oligosaccharides and Association to Infants’ Growth, an Observatory, Single Center, Longitudinal Cohort Study. PLoS ONE 2017, 12, e0171814. [Google Scholar] [CrossRef] [PubMed]
  30. McGuire, M.K.; Meehan, C.L.; McGuire, M.A.; Williams, J.E.; Foster, J.; Sellen, D.W.; Kamau-Mbuthia, E.W.; Kamundia, E.W.; Mbugua, S.; Moore, S.E.; et al. What’s Normal? Oligosaccharide Concentrations and Profiles in Milk Produced by Healthy Women Vary Geographically. Am. J. Clin. Nutr. 2017, 105, 1086–1100. [Google Scholar] [CrossRef]
  31. Coppa, G.; Pierani, P.; Zampini, L.; Carloni, I.; Carlucci, A.; Gabrielli, O. Oligosaccharides in Human Milk during Different Phases of Lactation. Acta Paediatr. 1999, 88, 89–94. [Google Scholar] [CrossRef]
  32. Thurl, S.; Munzert, M.; Boehm, G.; Matthews, C.; Stahl, B. Systematic Review of the Concentrations of Oligosaccharides in Human Milk. Nutr. Rev. 2017, 75, 920–933. [Google Scholar] [CrossRef]
  33. Liu, S.; Mao, Y.; Wang, J.; Tian, F.; Hill, D.R.; Xiong, X.; Li, X.; Zhao, Y.; Wang, S. Lactational and Geographical Variation in the Concentration of Six Oligosaccharides in Chinese Breast Milk: A Multicenter Study over 13 Months Postpartum. Front. Nutr. 2023, 10, 1267287. [Google Scholar] [CrossRef]
  34. Seferovic, M.D.; Mohammad, M.; Pace, R.M.; Engevik, M.; Versalovic, J.; Bode, L.; Haymond, M.; Aagaard, K.M. Maternal Diet Alters Human Milk Oligosaccharide Composition with Implications for the Milk Metagenome. Sci. Rep. 2020, 10, 22092. [Google Scholar] [CrossRef] [PubMed]
  35. Samuel, T.M.; Binia, A.; De Castro, C.A.; Thakkar, S.K.; Billeaud, C.; Agosti, M.; Al-Jashi, I.; Costeira, M.J.; Marchini, G.; Martínez-Costa, C.; et al. Impact of Maternal Characteristics on Human Milk Oligosaccharide Composition over the First 4 Months of Lactation in a Cohort of Healthy European Mothers. Sci. Rep. 2019, 9, 11767. [Google Scholar] [CrossRef]
  36. Oriol, R.; Le Pendu, J.; Mollicone, R. Genetics of ABO, H, Lewis, X and Related Antigens. Vox Sang. 1986, 51, 161–171. [Google Scholar] [CrossRef]
  37. Azad, M.B.; Robertson, B.; Atakora, F.; Becker, A.B.; Subbarao, P.; Moraes, T.J.; Mandhane, P.J.; Turvey, S.E.; Lefebvre, D.L.; Sears, M.R.; et al. Human Milk Oligosaccharide Concentrations Are Associated with Multiple Fixed and Modifiable Maternal Characteristics, Environmental Factors, and Feeding Practices. J. Nutr. 2018, 148, 1733–1742. [Google Scholar] [CrossRef] [PubMed]
  38. Hundshammer, C.; Minge, O. In Love with Shaping You—Influential Factors on the Breast Milk Content of Human Milk Oligosaccharides and Their Decisive Roles for Neonatal Development. Nutrients 2020, 12, 3568. [Google Scholar] [CrossRef] [PubMed]
  39. Dessì, A.; Briana, D.; Corbu, S.; Gavrili, S.; Cesare Marincola, F.; Georgantzi, S.; Pintus, R.; Fanos, V.; Malamitsi-Puchner, A. Metabolomics of Breast Milk: The Importance of Phenotypes. Metabolites 2018, 8, 79. [Google Scholar] [CrossRef]
  40. Castanys-Muñoz, E.; Martin, M.J.; Prieto, P.A. 2’-Fucosyllactose: An Abundant, Genetically Determined Soluble Glycan Present in Human Milk. Nutr. Rev. 2013, 71, 773–789. [Google Scholar] [CrossRef]
  41. Gómez-Gallego, C.; Morales, J.M.; Monleón, D.; du Toit, E.; Kumar, H.; Linderborg, K.M.; Zhang, Y.; Yang, B.; Isolauri, E.; Salminen, S.; et al. Human Breast Milk NMR Metabolomic Profile across Specific Geographical Locations and Its Association with the Milk Microbiota. Nutrients 2018, 10, 1355. [Google Scholar] [CrossRef]
  42. Davis, J.C.C.; Lewis, Z.T.; Krishnan, S.; Bernstein, R.M.; Moore, S.E.; Prentice, A.M.; Mills, D.A.; Lebrilla, C.B.; Zivkovic, A.M. Growth and Morbidity of Gambian Infants Are Influenced by Maternal Milk Oligosaccharides and Infant Gut Microbiota. Sci. Rep. 2017, 7, 40466. [Google Scholar] [CrossRef]
  43. Sundekilde, U.K.; Downey, E.; O’Mahony, J.A.; O’Shea, C.-A.; Ryan, C.A.; Kelly, A.L.; Bertram, H.C. The Effect of Gestational and Lactational Age on the Human Milk Metabolome. Nutrients 2016, 8, 304. [Google Scholar] [CrossRef]
  44. Ren, X.; Yan, J.; Bi, Y.; Shuttleworth, P.W.; Wang, Y.; Jiang, S.; Wang, J.; Duan, Y.; Lai, J.; Yang, Z. Human Milk Oligosaccharides Are Associated with Lactation Stage and Lewis Phenotype in a Chinese Population. Nutrients 2023, 15, 1408. [Google Scholar] [CrossRef] [PubMed]
  45. Liu, S.; Cai, X.; Wang, J.; Mao, Y.; Zou, Y.; Tian, F.; Peng, B.; Hu, J.; Zhao, Y.; Wang, S. Six Oligosaccharides’ Variation in Breast Milk: A Study in South China from 0 to 400 Days Postpartum. Nutrients 2021, 13, 4017. [Google Scholar] [CrossRef]
  46. Wu, J.; Wu, S.; Huo, J.; Ruan, H.; Xu, X.; Hao, Z.; Wei, Y. Systematic Characterization and Longitudinal Study Reveal Distinguishing Features of Human Milk Oligosaccharides in China. Curr. Dev. Nutr. 2020, 4, nzaa113. [Google Scholar] [CrossRef] [PubMed]
  47. Lefebvre, G.; Shevlyakova, M.; Charpagne, A.; Marquis, J.; Vogel, M.; Kirsten, T.; Kiess, W.; Austin, S.; Sprenger, N.; Binia, A. Time of Lactation and Maternal Fucosyltransferase Genetic Polymorphisms Determine the Variability in Human Milk Oligosaccharides. Front. Nutr. 2020, 7, 574459. [Google Scholar] [CrossRef] [PubMed]
  48. Tonon, K.M.; de Morais, M.B.; Abrão, A.C.F.V.; Miranda, A.; Morais, T.B. Maternal and Infant Factors Associated with Human Milk Oligosaccharides Concentrations According to Secretor and Lewis Phenotypes. Nutrients 2019, 11, 1358. [Google Scholar] [CrossRef]
  49. Matharu, D.; Ponsero, A.J.; Lengyel, M.; Meszaros-Matwiejuk, A.; Kolho, K.-L.; de Vos, W.M.; Molnar-Gabor, D.; Salonen, A. Human Milk Oligosaccharide Composition Is Affected by Season and Parity and Associates with Infant Gut Microbiota in a Birth Mode Dependent Manner in a Finnish Birth Cohort. EBioMedicine 2024, 104, 105182. [Google Scholar] [CrossRef]
  50. Kunz, C.; Meyer, C.; Collado, M.C.; Geiger, L.; García-Mantrana, I.; Bertua-Ríos, B.; Martínez-Costa, C.; Borsch, C.; Rudloff, S. Influence of Gestational Age, Secretor, and Lewis Blood Group Status on the Oligosaccharide Content of Human Milk. J. Pediatr. Gastroenterol. Nutr. 2017, 64, 789–798. [Google Scholar] [CrossRef]
  51. Ma, L.; McJarrow, P.; Jan Mohamed, H.J.B.; Liu, X.; Welman, A.; Fong, B.Y. Lactational Changes in the Human Milk Oligosaccharide Concentration in Chinese and Malaysian Mothers’ Milk. Int. Dairy J. 2018, 87, 1–10. [Google Scholar] [CrossRef]
  52. Eussen, S.R.B.M.; Mank, M.; Kottler, R.; Hoffmann, X.-K.; Behne, A.; Rapp, E.; Stahl, B.; Mearin, M.L.; Koletzko, B. Presence and Levels of Galactosyllactoses and Other Oligosaccharides in Human Milk and Their Variation during Lactation and According to Maternal Phenotype. Nutrients 2021, 13, 2324. [Google Scholar] [CrossRef]
  53. Gabrielli, O.; Zampini, L.; Galeazzi, T.; Padella, L.; Santoro, L.; Peila, C.; Giuliani, F.; Bertino, E.; Fabris, C.; Coppa, G.V. Preterm Milk Oligosaccharides During the First Month of Lactation. Pediatrics 2011, 128, e1520–e1531. [Google Scholar] [CrossRef]
  54. Elwakiel, M.; Hageman, J.A.; Wang, W.; Szeto, I.M.; van Goudoever, J.B.; Hettinga, K.A.; Schols, H.A. Human Milk Oligosaccharides in Colostrum and Mature Milk of Chinese Mothers: Lewis Positive Secretor Subgroups. J. Agric. Food Chem. 2018, 66, 7036–7043. [Google Scholar] [CrossRef]
  55. King, J.R.; Varadé, J.; Hammarström, L. Fucosyltransferase Gene Polymorphisms and Lewisb-Negative Status Are Frequent in Swedish Newborns, With Implications for Infectious Disease Susceptibility and Personalized Medicine. J. Pediatr. Infect. Dis. Soc. 2019, 8, 507–518. [Google Scholar] [CrossRef]
  56. Guo, M.; Luo, G.; Lu, R.; Shi, W.; Cheng, H.; Lu, Y.; Jin, K.; Yang, C.; Wang, Z.; Long, J.; et al. Distribution of Lewis and Secretor Polymorphisms and Corresponding CA19-9 Antigen Expression in a Chinese Population. FEBS Open Bio 2017, 7, 1660–1671. [Google Scholar] [CrossRef] [PubMed]
  57. Nordgren, J.; Sharma, S.; Bucardo, F.; Nasir, W.; Günaydın, G.; Ouermi, D.; Nitiema, L.W.; Becker-Dreps, S.; Simpore, J.; Hammarström, L.; et al. Both Lewis and Secretor Status Mediate Susceptibility to Rotavirus Infections in a Rotavirus Genotype–Dependent Manner. Clin. Infect. Dis. 2014, 59, 1567–1573. [Google Scholar] [CrossRef]
  58. Vinjamuri, A.; Davis, J.C.C.; Totten, S.M.; Wu, L.D.; Klein, L.D.; Martin, M.; Quinn, E.A.; Scelza, B.; Breakey, A.; Gurven, M.; et al. Human Milk Oligosaccharide Compositions Illustrate Global Variations in Early Nutrition. J. Nutr. 2022, 152, 1239–1253. [Google Scholar] [CrossRef]
  59. Wallingford, J.C.; Neve Myers, P.; Barber, C.M. Effects of Addition of 2-Fucosyllactose to Infant Formula on Growth and Specific Pathways of Utilization by Bifidobacterium in Healthy Term Infants. Front. Nutr. 2022, 9, 961526. [Google Scholar] [CrossRef] [PubMed]
  60. Kassai, S.; de Vos, P. Gastrointestinal Barrier Function, Immunity, and Neurocognition: The Role of Human Milk Oligosaccharide (hMO) Supplementation in Infant Formula. Compr. Rev. Food Sci. Food Saf. 2024, 23, e13271. [Google Scholar] [CrossRef]
  61. Du, Z.; Li, Z.; Guang, C.; Zhu, Y.; Mu, W. Recent Advances of 3-Fucosyllactose in Health Effects and Production. Arch. Microbiol. 2024, 206, 378. [Google Scholar] [CrossRef] [PubMed]
  62. Li, Z.; Zhu, Y.; Ni, D.; Zhang, W.; Mu, W. Occurrence, Functional Properties, and Preparation of 3-Fucosyllactose, One of the Smallest Human Milk Oligosaccharides. Crit. Rev. Food Sci. Nutr. 2023, 63, 9364–9378. [Google Scholar] [CrossRef] [PubMed]
  63. Austin, S.; De Castro, C.; Bénet, T.; Hou, Y.; Sun, H.; Thakkar, S.; Vinyes-Pares, G.; Zhang, Y.; Wang, P. Temporal Change of the Content of 10 Oligosaccharides in the Milk of Chinese Urban Mothers. Nutrients 2016, 8, 346. [Google Scholar] [CrossRef]
  64. Kortesniemi, M.; Jafari, T.; Zhang, Y.; Yang, B. 1H NMR Metabolomics of Chinese Human Milk at Different Stages of Lactation among Secretors and Non-Secretors. Molecules 2022, 27, 5526. [Google Scholar] [CrossRef] [PubMed]
  65. Ning, Y.; Xun, Y.; Fong, B.; McJarrow, P.; Ma, L.; Jan Mohamed, H.J.; Dong, H.; Yuan, Q. Analysis of Twelve Human Milk Oligosaccharides over Fifteen Months Post-Partum in Human Milk from Chinese Mothers. Heliyon 2024, 10, e39293. [Google Scholar] [CrossRef]
  66. Parvin, R.; Hamid, N.; Rahman, K.; Khan, A.A.; Rahat, F.; Rahman, S.; Hossain, B.; Rashid, I.I. The Science of Human Milk Oligosaccharides (HMO) for Developing Immunity and Healthy Digestive System in Newborn Infants Throughout Life. Int. J. Immunol. 2024, 12, 1–9. [Google Scholar] [CrossRef]
  67. Soyyılmaz, B.; Mikš, M.H.; Röhrig, C.H.; Matwiejuk, M.; Meszaros-Matwiejuk, A.; Vigsnæs, L.K. The Mean of Milk: A Review of Human Milk Oligosaccharide Concentrations throughout Lactation. Nutrients 2021, 13, 2737. [Google Scholar] [CrossRef]
Figure 1. Multicenter maternal nutrition and infant investigation study location.
Nutrients 18 00417 g001
Figure 2. The proportion of secretor and Lewis phenotypes in Chinese milk at 0–400 postpartum periods of each city. (A) The proportion of Secretor and Lewis status in all 6 cities, (B) The proportion of Secretor and Lewis status in Chengdu, (C) The proportion of Secretor and Lewis status in Lanzhou, (D) The proportion of Secretor and Lewis status in Guangzhou, (E) The proportion of Secretor and Lewis status in Shanghai, (F) The proportion of Secretor and Lewis status in Tianjin, (G) The proportion of Secretor and Lewis status in Changchun.
Nutrients 18 00417 g002
Figure 3. Contents of a total of 17 oligosaccharides in the milk of secretor and Lewis phenotypes (mg/L) at 0–400 postpartum periods. Note: a,b,c Values within a row in individual cities with different superscript letters were significantly different (adjusted p < 0.05 by the Dunn correction for multiple tests) according to an independent nonparametric test (Kruskal-Wallis one-way ANOVA, all pairwise).
Nutrients 18 00417 g003
Figure 4. Contents of the three major types of oligosaccharides in the milk of secretor and Lewis phenotypes at 0–400 postpartum periods (n = 1462, MEAN, mg/L). Note: a,b,c,d Values within a row in individual cities with different superscript letters were significantly different (adjusted p < 0.05 by the Dunn correction for multiple tests) according to an independent nonparametric test (Kruskal–Wallis one-way ANOVA, all pairwise).
Nutrients 18 00417 g004
Figure 5. The proportion of 17 HMOs in the milk of secretor and Lewis phenotypes of all study participants.
Nutrients 18 00417 g005
Figure 6. Contents of 17 HMOs in the milk of secretor and Lewis phenotypes at 0–400 postpartum periods (MEAN, mg/L). Note: Statistical significance was determined using the Kruskal–Wallis one-way ANOVA followed by Dunn’s post-hoc pairwise comparisons (adjusted p < 0.05). (A) 2′-FL, (B) 3-FL, (C) TFLNH, (D) DFL, (E) LNFP I, (F) LNFP II, (G) LNFP III, (H) LNDFH I, (I) LNDFH I, (J) LNT, (K) LNnT, (L) 3′-SL, (M) 6′-SL, (N) LST a, (O) LST b, (P) LST c, (Q) DSLNT.
Nutrients 18 00417 g006
Figure 7. Correlation matrix of HMO types at 0–400 postpartum periods, with blue color indicating negative correlations and red color indicating positive correlations.
Nutrients 18 00417 g007
Figure 8. Correlation matrix of HMO types and maternal and infant factors at 0–400 postpartum periods, with blue color indicating negative correlations and red color indicating positive correlations.
Nutrients 18 00417 g008
Table 1. Characteristics of participant mothers at each city (MEAN ± SD or %).
CharacteristicChangchun (n = 244)Lanzhou (n = 299)Chengdu (n = 281)Tianjin (n = 229)Guangzhou (n = 342)Shanghai (n = 363)p
Maternal
Age at delivery, years29.9 ± 3.029.8 ± 4.329.5 ± 3.330.3 ± 3.229.7 ± 3.730.1 ± 3.00.054
Pre-pregnancy BMI, kg/m221.3 ± 3.0 a,b21.3 ± 2.8 a,b20.7 ± 2.5 b21.8 ± 3.4 a20.3 ± 2.5 b21.2 ± 2.8 a,b<0.001
Pre-delivery BMI, kg/m227.4 ± 3.8 a26.8 ± 3.0 a,b26.2 ± 2.8 b27.3 ± 3.4 a25.5 ± 3.1 b26.7 ± 3.6 a,b<0.001
Gestational weight gain, kg16.5 ± 5.5 a14.3 ± 5.3 b14.2 ± 4.6 b14.6 ± 7.6 b13.5 ± 4.9 b14.7 ± 5.5 b<0.001
Gestational age, weeks39.0 ± 1.1 b39.0 ± 2.1 a,b39.5 ± 1.6 a39.2 ± 1.7 a,b38.9 ± 1.4 b39.6 ± 1.0 a<0.001
Vaginal delivery, %42% a59% b43% a68% b,c77% c61% b<0.001
Primipara, %95% a50% b73% c,d77% d64% c74% c,d<0.001
Infant
Birthweight, g3380.1 ± 401.1 a,b3277.8 ± 445.1 b3409.5 ± 624.7 a,b3396.7 ± 490.8 a3542.6 ± 1004.9 a,b3332.3 ± 368.2 a,b0.025
Body length, cm50.5 ± 1.7 a49.0 ± 2.5 c49.8 ± 1.5 b,c50.4 ± 2.6 a,b50.3 ± 2.3 b49.4 ± 1.3 c<0.001
Gender (Female %)49%47%43%51%48%53%0.159
Note: a,b,c,d values within a row in individual cities with unlike superscript letters were significantly different (p < 0.05). Nonparametric test—Kruskal–Wallis one-way ANOVA (multiple comparisons: all pairwise, adj-p). Chi-square test (z-test—compare column proportions—adjust p-values (Dunn method)).
Table 2. Distribution of secretor+/− and Lewis+/− phenotypes among lactating women across six Chinese cities (%).
Chengdu
(n = 281)
Lanzhou
(n = 299)
Guangzhou
(n = 342)
Shanghai
(n = 363)
Tianjin
(n = 229)
Changchun
(n = 244)
Total
Se+84.21%79.10%81.07%74.70%80.59%73.20%78.7%
Se−15.79%20.90%18.93%25.30%19.41%26.80%21.4%
Le+92.67%92.21%91.90%96.73%91.80%90.00%92.6%
Le−7.33%7.79%8.10%3.27%8.20%10.00%7.4%
Table 3. Contents of a total of 17 oligosaccharides in the milk of secretor and Lewis phenotypes (mg/L).
Se/Le PhenotypesAverageSDSEp 25p 50p 75
Se+/Le+834233271025375754311,093
Se+/Le−744937063934583585510,582
Se−/Le+62762368141447957418031
Se−/Le−45323179729235731866199
Note: SD: standard deviation; SE: standard error; p 25: the 25th percentile; p 50: the 50th percentile; p 75: the 75th percentile.
Table 4. Change trends of 17 HMOs in the milk of secretor and Lewis phenotypes throughout lactation (mean, mg/L).
2′-FL CMTMM1M2M3p
Se+/Le+3262 a2433 b2151 c1238 d1104 d<0.001
Se+/Le−4948 a3580 a2628 a,b2164 b2313 b<0.001
Se−/Le+63 a39 a,b29 b13 c14 c<0.001
Se−/Le−2424281515-
3-FL CMTMM1M2M3p
Se+/Le+222 c243 c461 b1199 a1242 a<0.001
Se+/Le−127 b,c89 b,c 182 b250 a,b 363 a<0.001
Se−/Le+830 c941 c1400 b1946 a2236 a<0.001
Se−/Le−85139642364481-
DFL CMTMM1M2M3p
Se+/Le+502 a222 b228 b346 a494 a<0.001
Se+/Le−255 a91 a,b61 b207 a,b 326 a,b0.015
Se−/Le+30 a11 b,c16 a,b10 b,c15 b<0.001
Se−/Le−42247-
LNFP I CMTMM1M2M3p
Se+/Le+1936 a1619 a746 b214 c230 c<0.001
Se+/Le−3223 a2798 a1303 a,b729 b814 b<0.001
Se−/Le+54 a28 b44 a5 b3 b<0.001
Se−/Le−11662355051-
LNFP II CMTMM1M2M3p
Se+/Le+220 b336 a241 b197 b214 b<0.001
Se+/Le−3 b11 a7 a1 b1 b<0.001
Se−/Le+1111 a,b1365 a986 b525 c500 c<0.001
Se−/Le−101291-
LNFP III CMTMM1M2M3p
Se+/Le+780 a559 b,c561 b,c564 b505 c<0.001
Se+/Le−8666354725695160.051
Se−/Le+1158 a782 b727 b557 c461 c<0.001
Se−/Le−907590687408594-
LNDFH I CMTMM1M2M3p
Se+/Le+1338 a1250 a838 b493 c548 c<0.001
Se+/Le−3310260.055
Se−/Le+90 a38 b28 b9 c13 c<0.001
Se−/Le−11013-
LNDFH II CMTMM1M2M3p
Se+/Le+24 c17 d20 d31 b46 a<0.001
Se+/Le−5 a1 b1 a,b1 b1 b<0.001
Se−/Le+222 a,b223 a,b 216 a,b 151 b206 a0.020
Se−/Le−50291-
TFLNH CMTMM1M2M3p
Se+/Le+152 c316 a283 a155 b,c182 b<0.001
Se+/Le−14181217220.451
Se−/Le+160 a95 c101 c117 b,c144 a,b<0.001
Se−/Le−1716141735-
LNT CMTMM1M2M3p
Se+/Le+910 b1459 a714 b323 c351 c<0.001
Se+/Le−945 a,b1249 a524 a,b401 b429 b<0.001
Se−/Le+2063 a2223 a1078 b513 c414 c<0.001
Se−/Le−362536681571897983-
LNnT CMTMM1M2M3p
Se+/Le+375 a236 b143 c69 d54 d<0.001
Se+/Le−392 a233 a,b114 b82 b75 b<0.001
Se−/Le+277 a113 b64 b28 c16 c<0.001
Se−/Le−337201681317-
3′-SL CMTMM1M2M3p
Se+/Le+238 a143 b107 c115 c144 b<0.001
Se+/Le−282 a150 b92 b144 b170 b<0.001
Se−/Le+217 a148 b109 c106 c132 b,c<0.001
Se−/Le−28815199108121-
6′-SL CMTMM1M2M3p
Se+/Le+469 b 639 a312 c44 d32 e<0.001
Se+/Le−398 a601 a270 a37 b28 b<0.001
Se−/Le+464 a,b619 a328 b48 c27 c<0.001
Se−/Le−7459213963535-
LST a CMTMM1M2M3p
Se+/Le+57 a47 a10 b3 c4 c<0.001
Se+/Le−59 a46 a6 b6 b7 b<0.001
Se−/Le+65 a43 a7 b3 c2 c<0.001
Se−/Le−148992779-
LST b CMTMM1M2M3p
Se+/Le+84 a83 a69 b39 c41 c<0.001
Se+/Le−108 a80 a,b52 b42 b,c40 b,c<0.001
Se−/Le+136 a93 b92 b52 c46 c<0.001
Se−/Le−204117857657-
LST c CMTMM1M2M3p
Se+/Le+1130 a644 b241 c29 d26 d<0.001
Se+/Le−914 a605 a129 a21 b19 b<0.001
Se−/Le+932 a536 a198 b26 c 15 c<0.001
Se−/Le−18277612051016-
DSLNT CMTMM1M2M3p
Se+/Le+852 a726 a353 b161 d206 c<0.001
Se+/Le−1018 a644 a,b255 b227 b,c254 b,c<0.001
Se−/Le+1080 a828 a 418 b185 c199 c<0.001
Se−/Le−21311011526276294-
Note: a,b,c,d,e Values within a row in individual cities with different superscript letters were significantly different (adjusted p < 0.05 by the Dunn correction for multiple tests) according to an independent nonparametric test (Kruskal–Wallis one-way ANOVA, all pairwise); CM (colostrum, 0–5 days postpartum), TM (transitional milk, 10–15 days), M1 (mature milk stage 1, 40–45 days), M2 (mature milk stage 2, 200–240 days), and M3 (mature milk stage 3, 300–400 days).
Disclaimer/Publisher’s Note: The statements, opinions and data contained in all publications are solely those of the individual author(s) and contributor(s) and not of MDPI and/or the editor(s). MDPI and/or the editor(s) disclaim responsibility for any injury to people or property resulting from any ideas, methods, instructions or products referred to in the content.