Development of a Three-Component Nutrient Density Calculator (NDC) for Mixed Dishes to Guide Innovation and Reformulation of Recipes

 ,
,
Abstract
1. Introduction
2. Materials and Methods
2.1. Food and Nutrient Database for Dietary Studies (FNDDS 2021–2023)
2.2. Food Pyramid Equivalents Database (FPED) 2017–2020
2.3. FNDDS 2021–2023 Recipe File
2.4. Observed Servings and FDA Reference Amounts Customarily Consumed (RACCs)
2.5. Nutrient Density Calculator
2.5.1. Nutrient Standards
2.5.2. Three NDC Components and the Overall NDC Score
- Nutrienti and ingredienti are the amounts of desirable nutrients or ingredients per serving. Limiting nutrienti is the amount of limiting nutrients per serving. The LIM component can include total or added sugars depending on availability of data.
- Serving i is the estimated mean serving size as consumed by adults in the NHANES 2017–2019 and 2021–2023 data
- Percent daily values per serving were capped at 100% following NRF standard practice. The capping is indicated by the minimum function in formulas (1)–(3).
2.5.3. Weighting of Sub-Score Components
2.5.4. Nutrient Density Calculator as a 10-Point Score
2.6. Comparisons with Existing Nutrient Profiling Metrics
2.7. Statistical Analyses
2.8. Sensitivity of the NDC in Food Product Reformulation
3. Results
3.1. Observed Serving Sizes vs. Reference Amounts Customarily Consumed (RACCs)
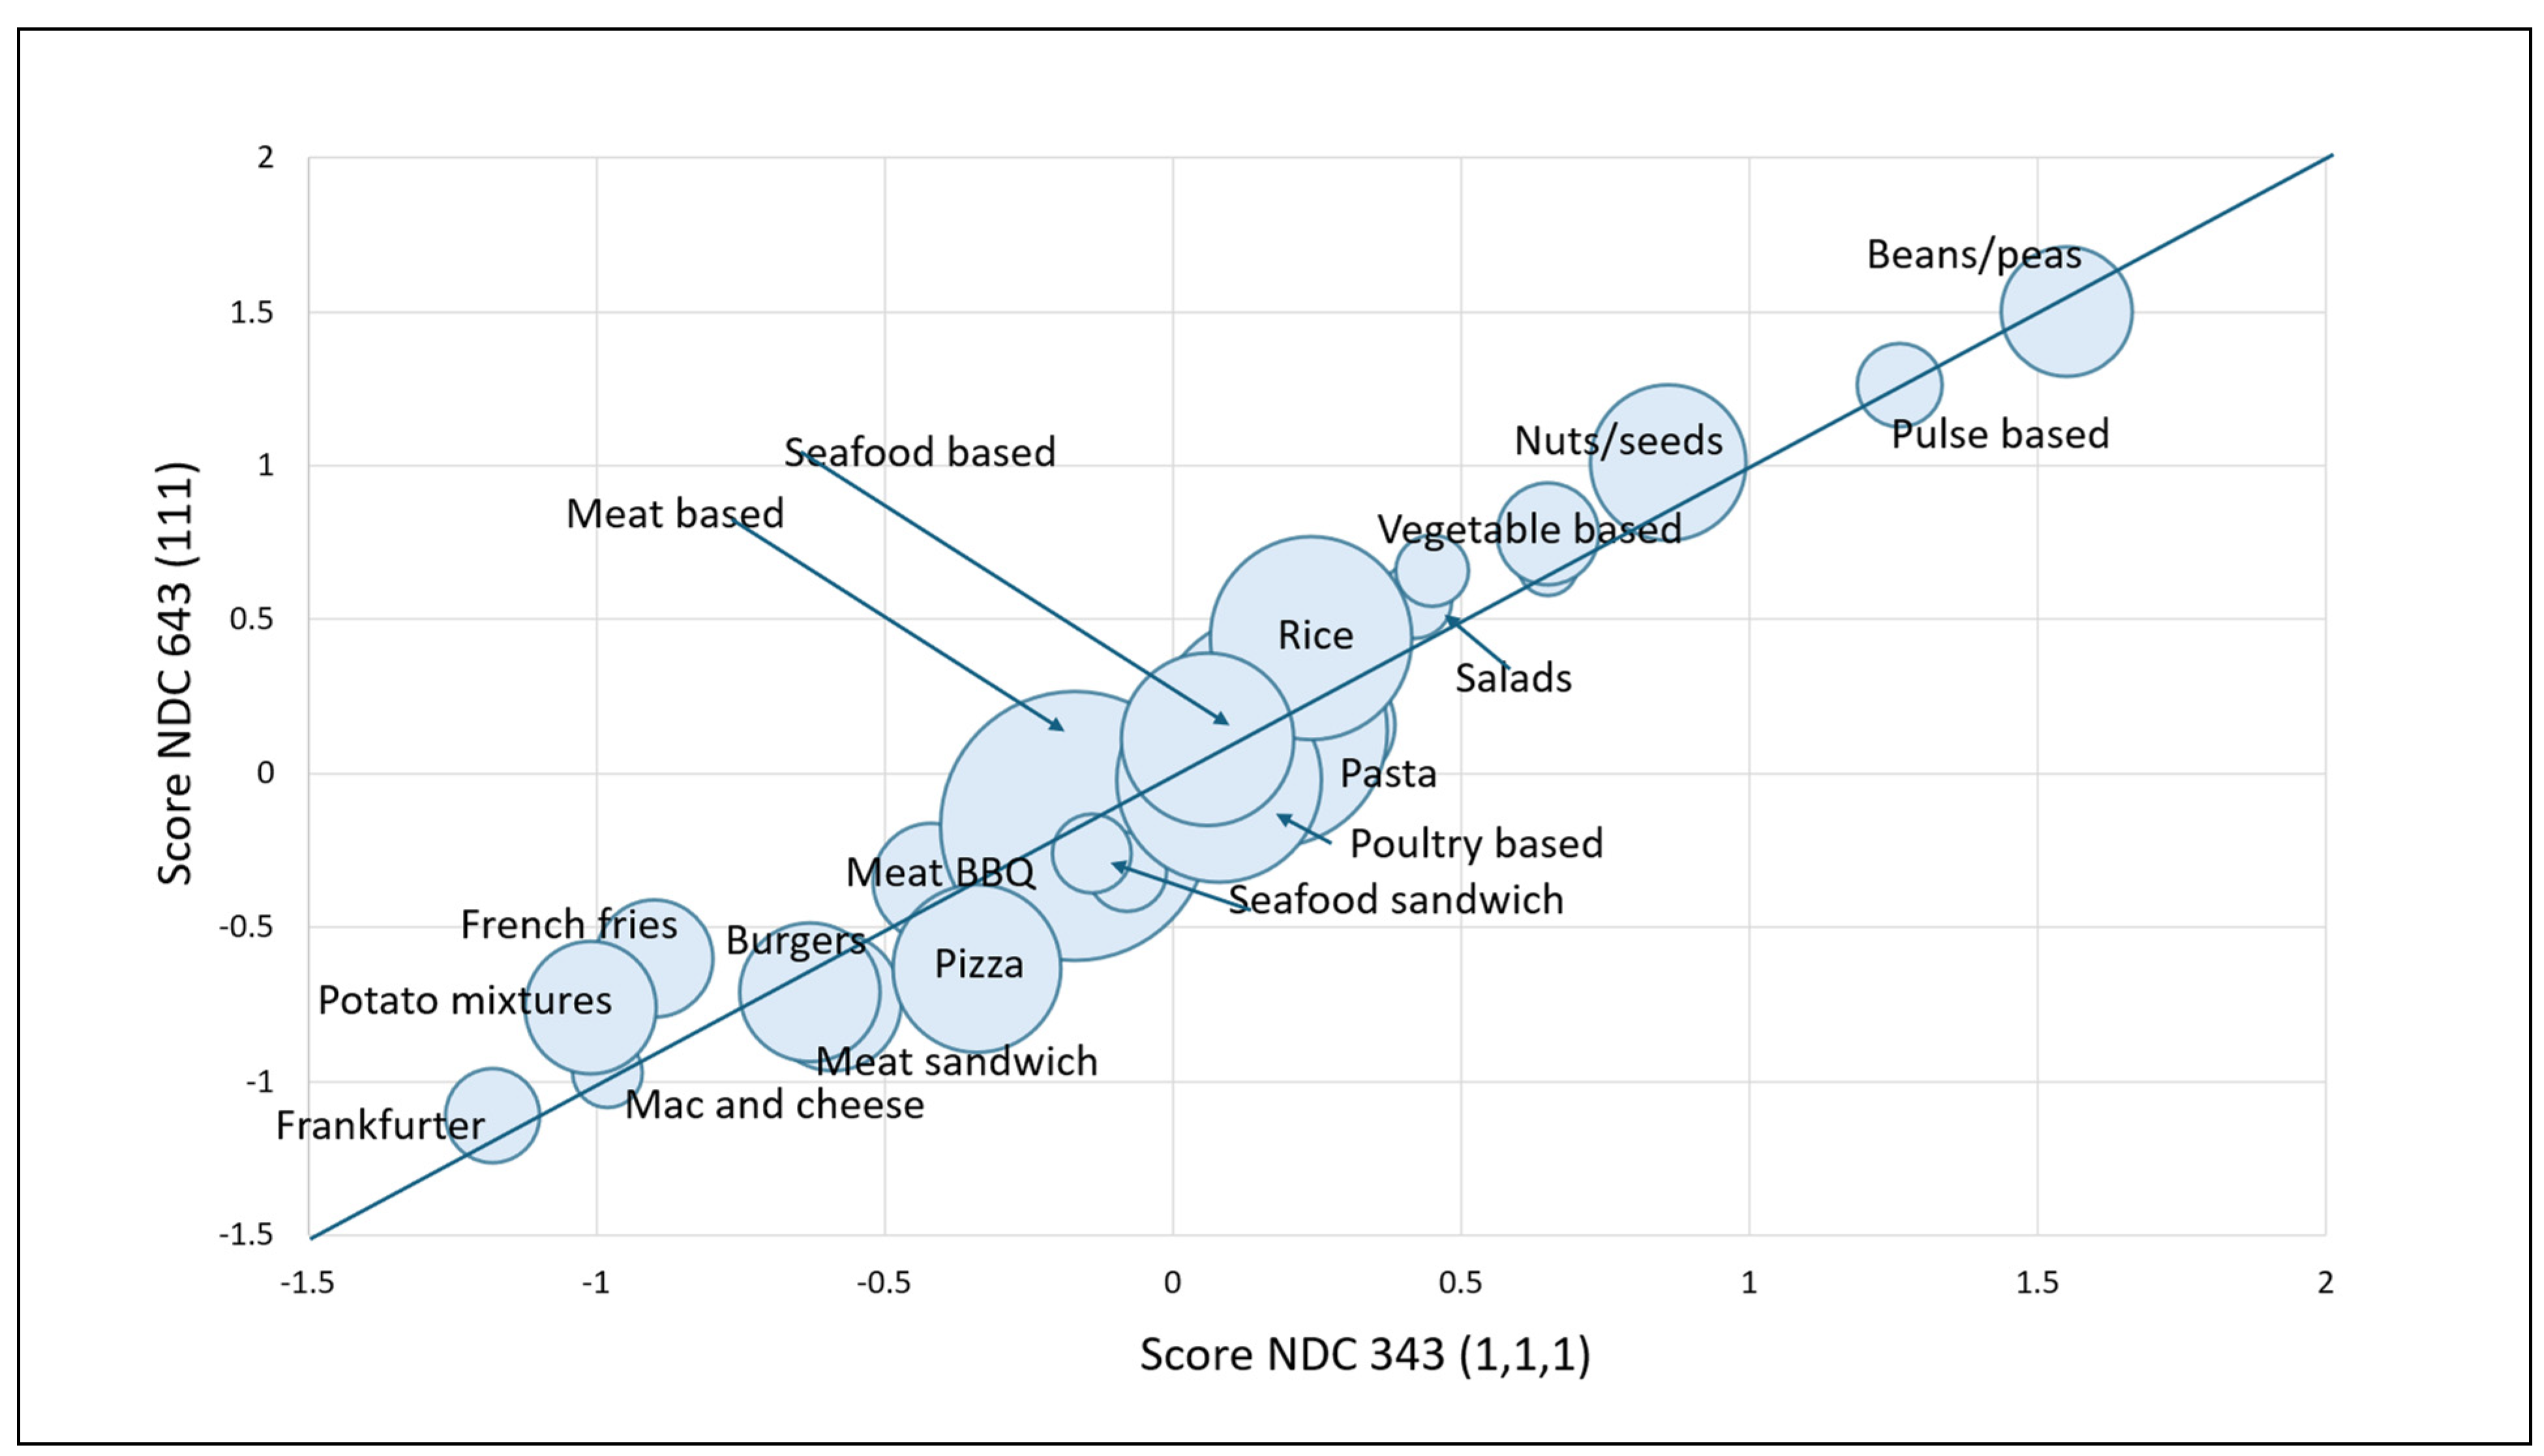
3.2. NDC643 and NDC343 Alternative Models
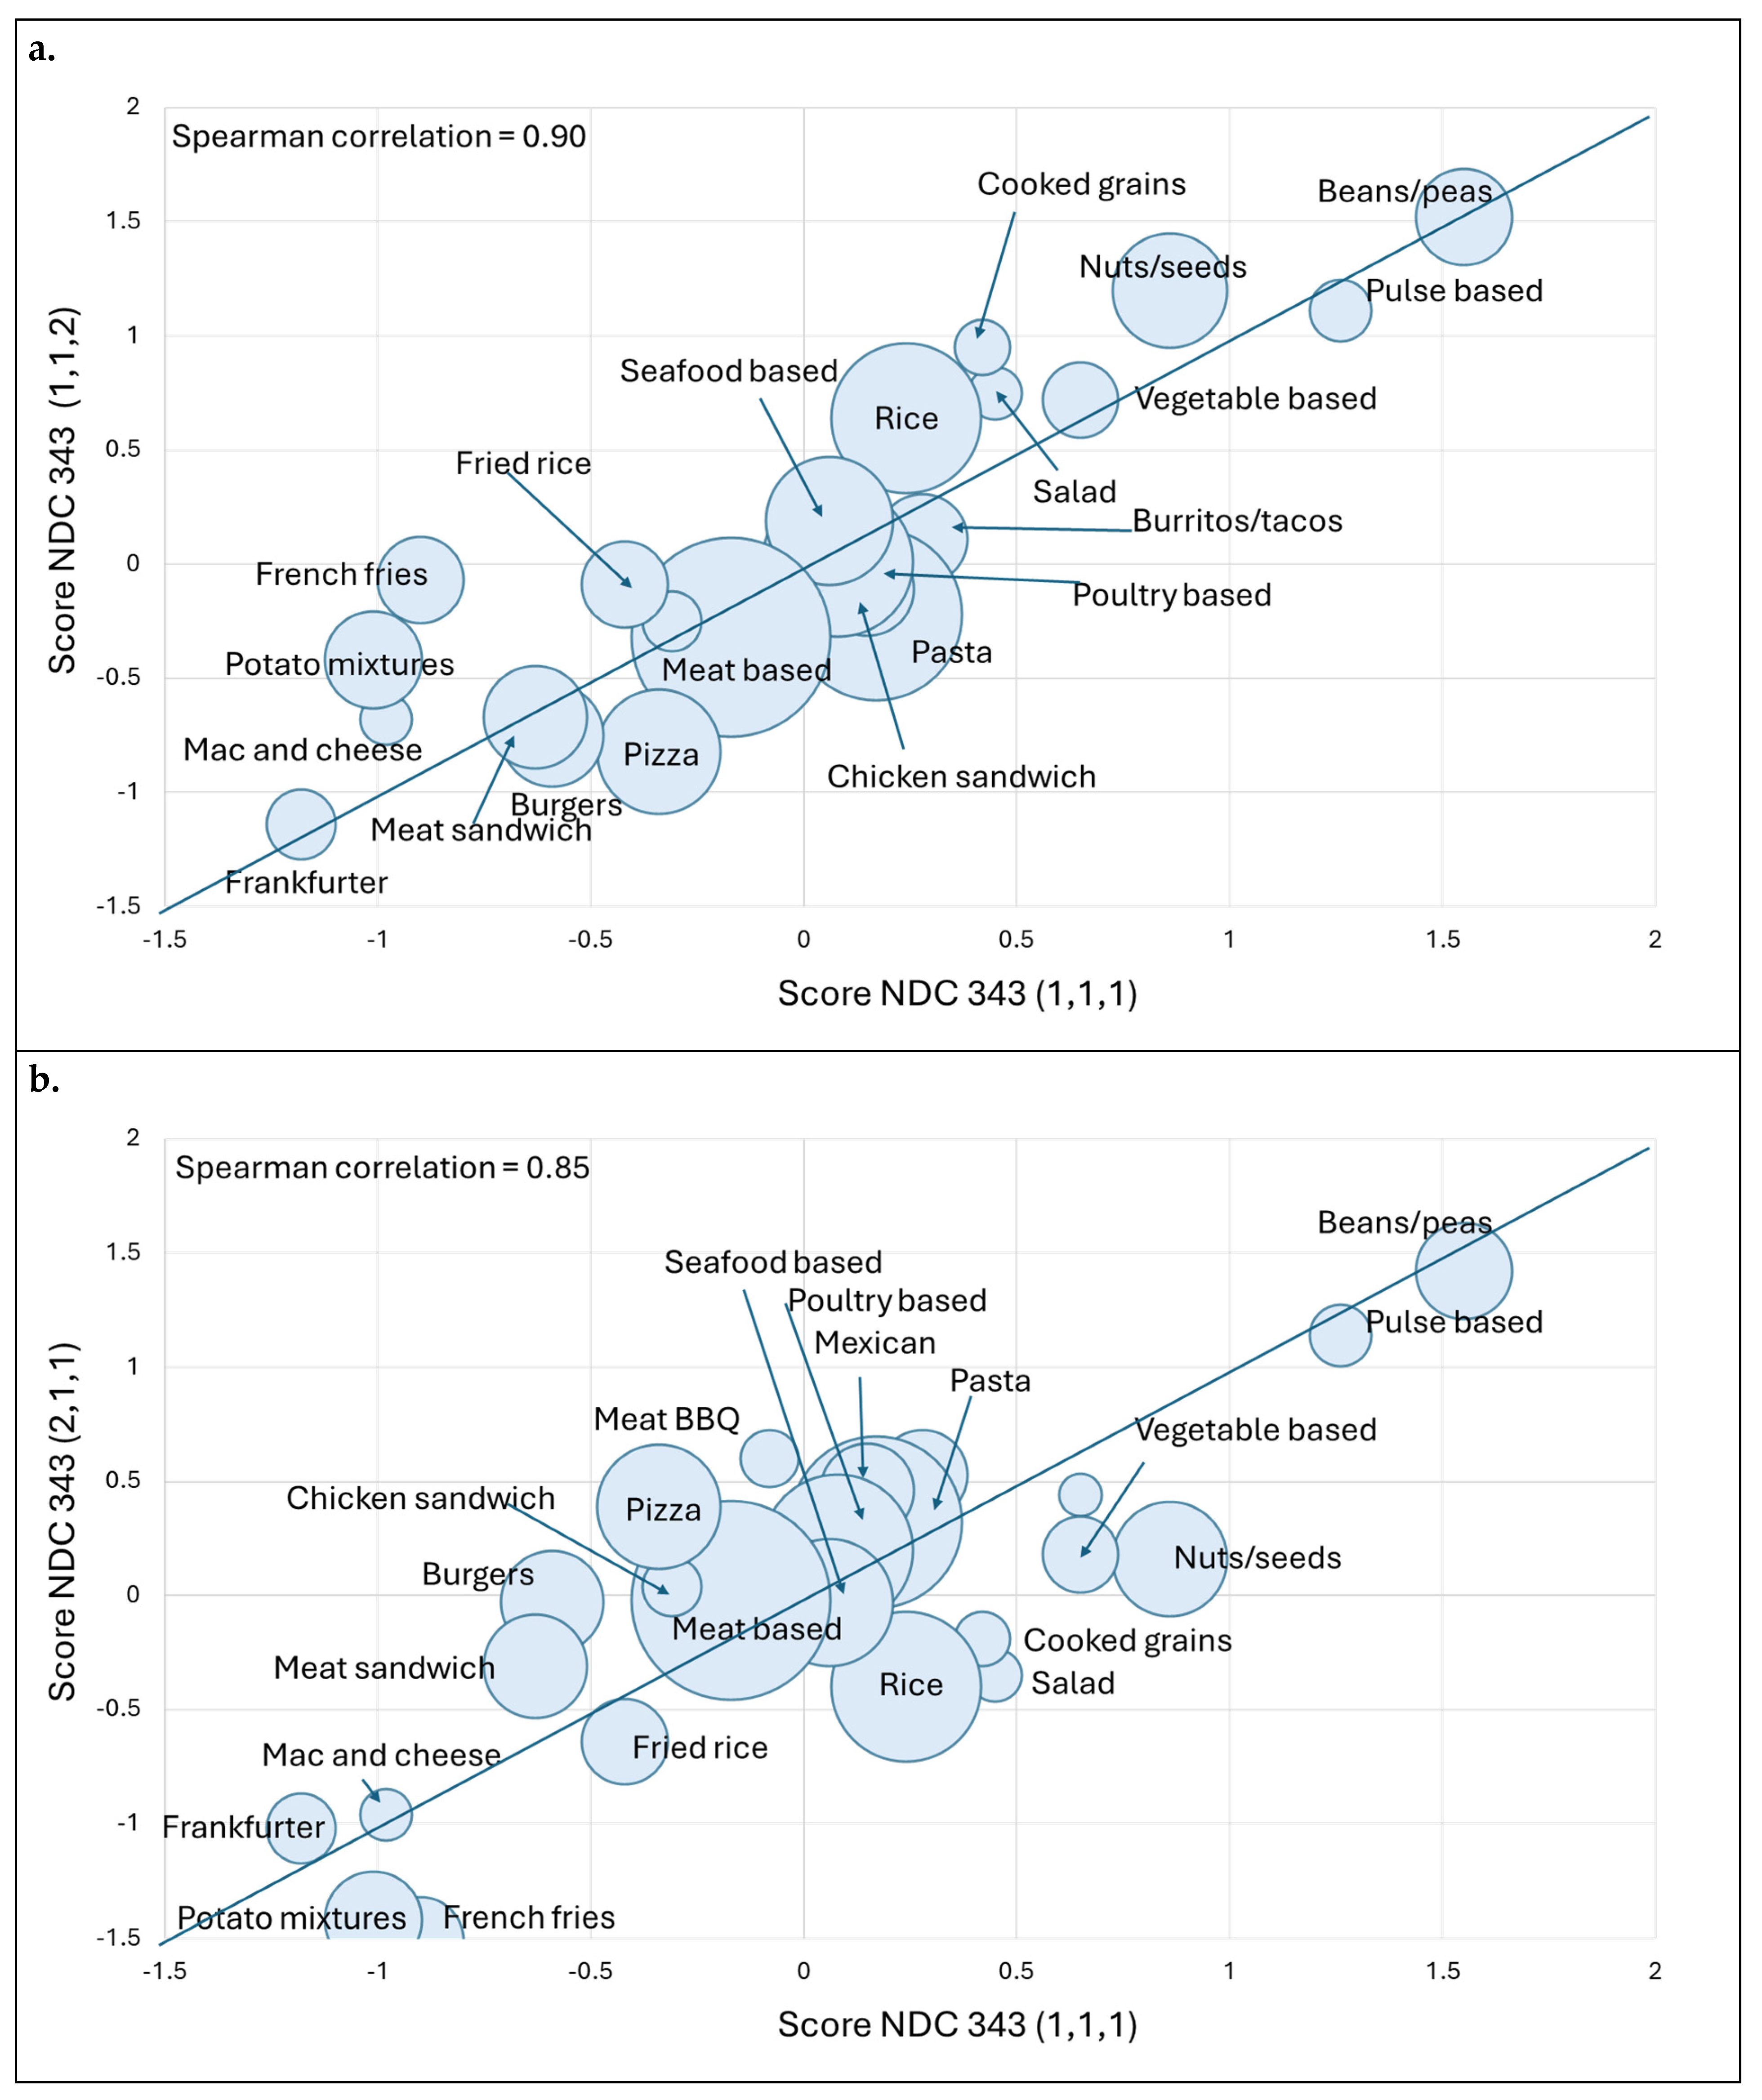
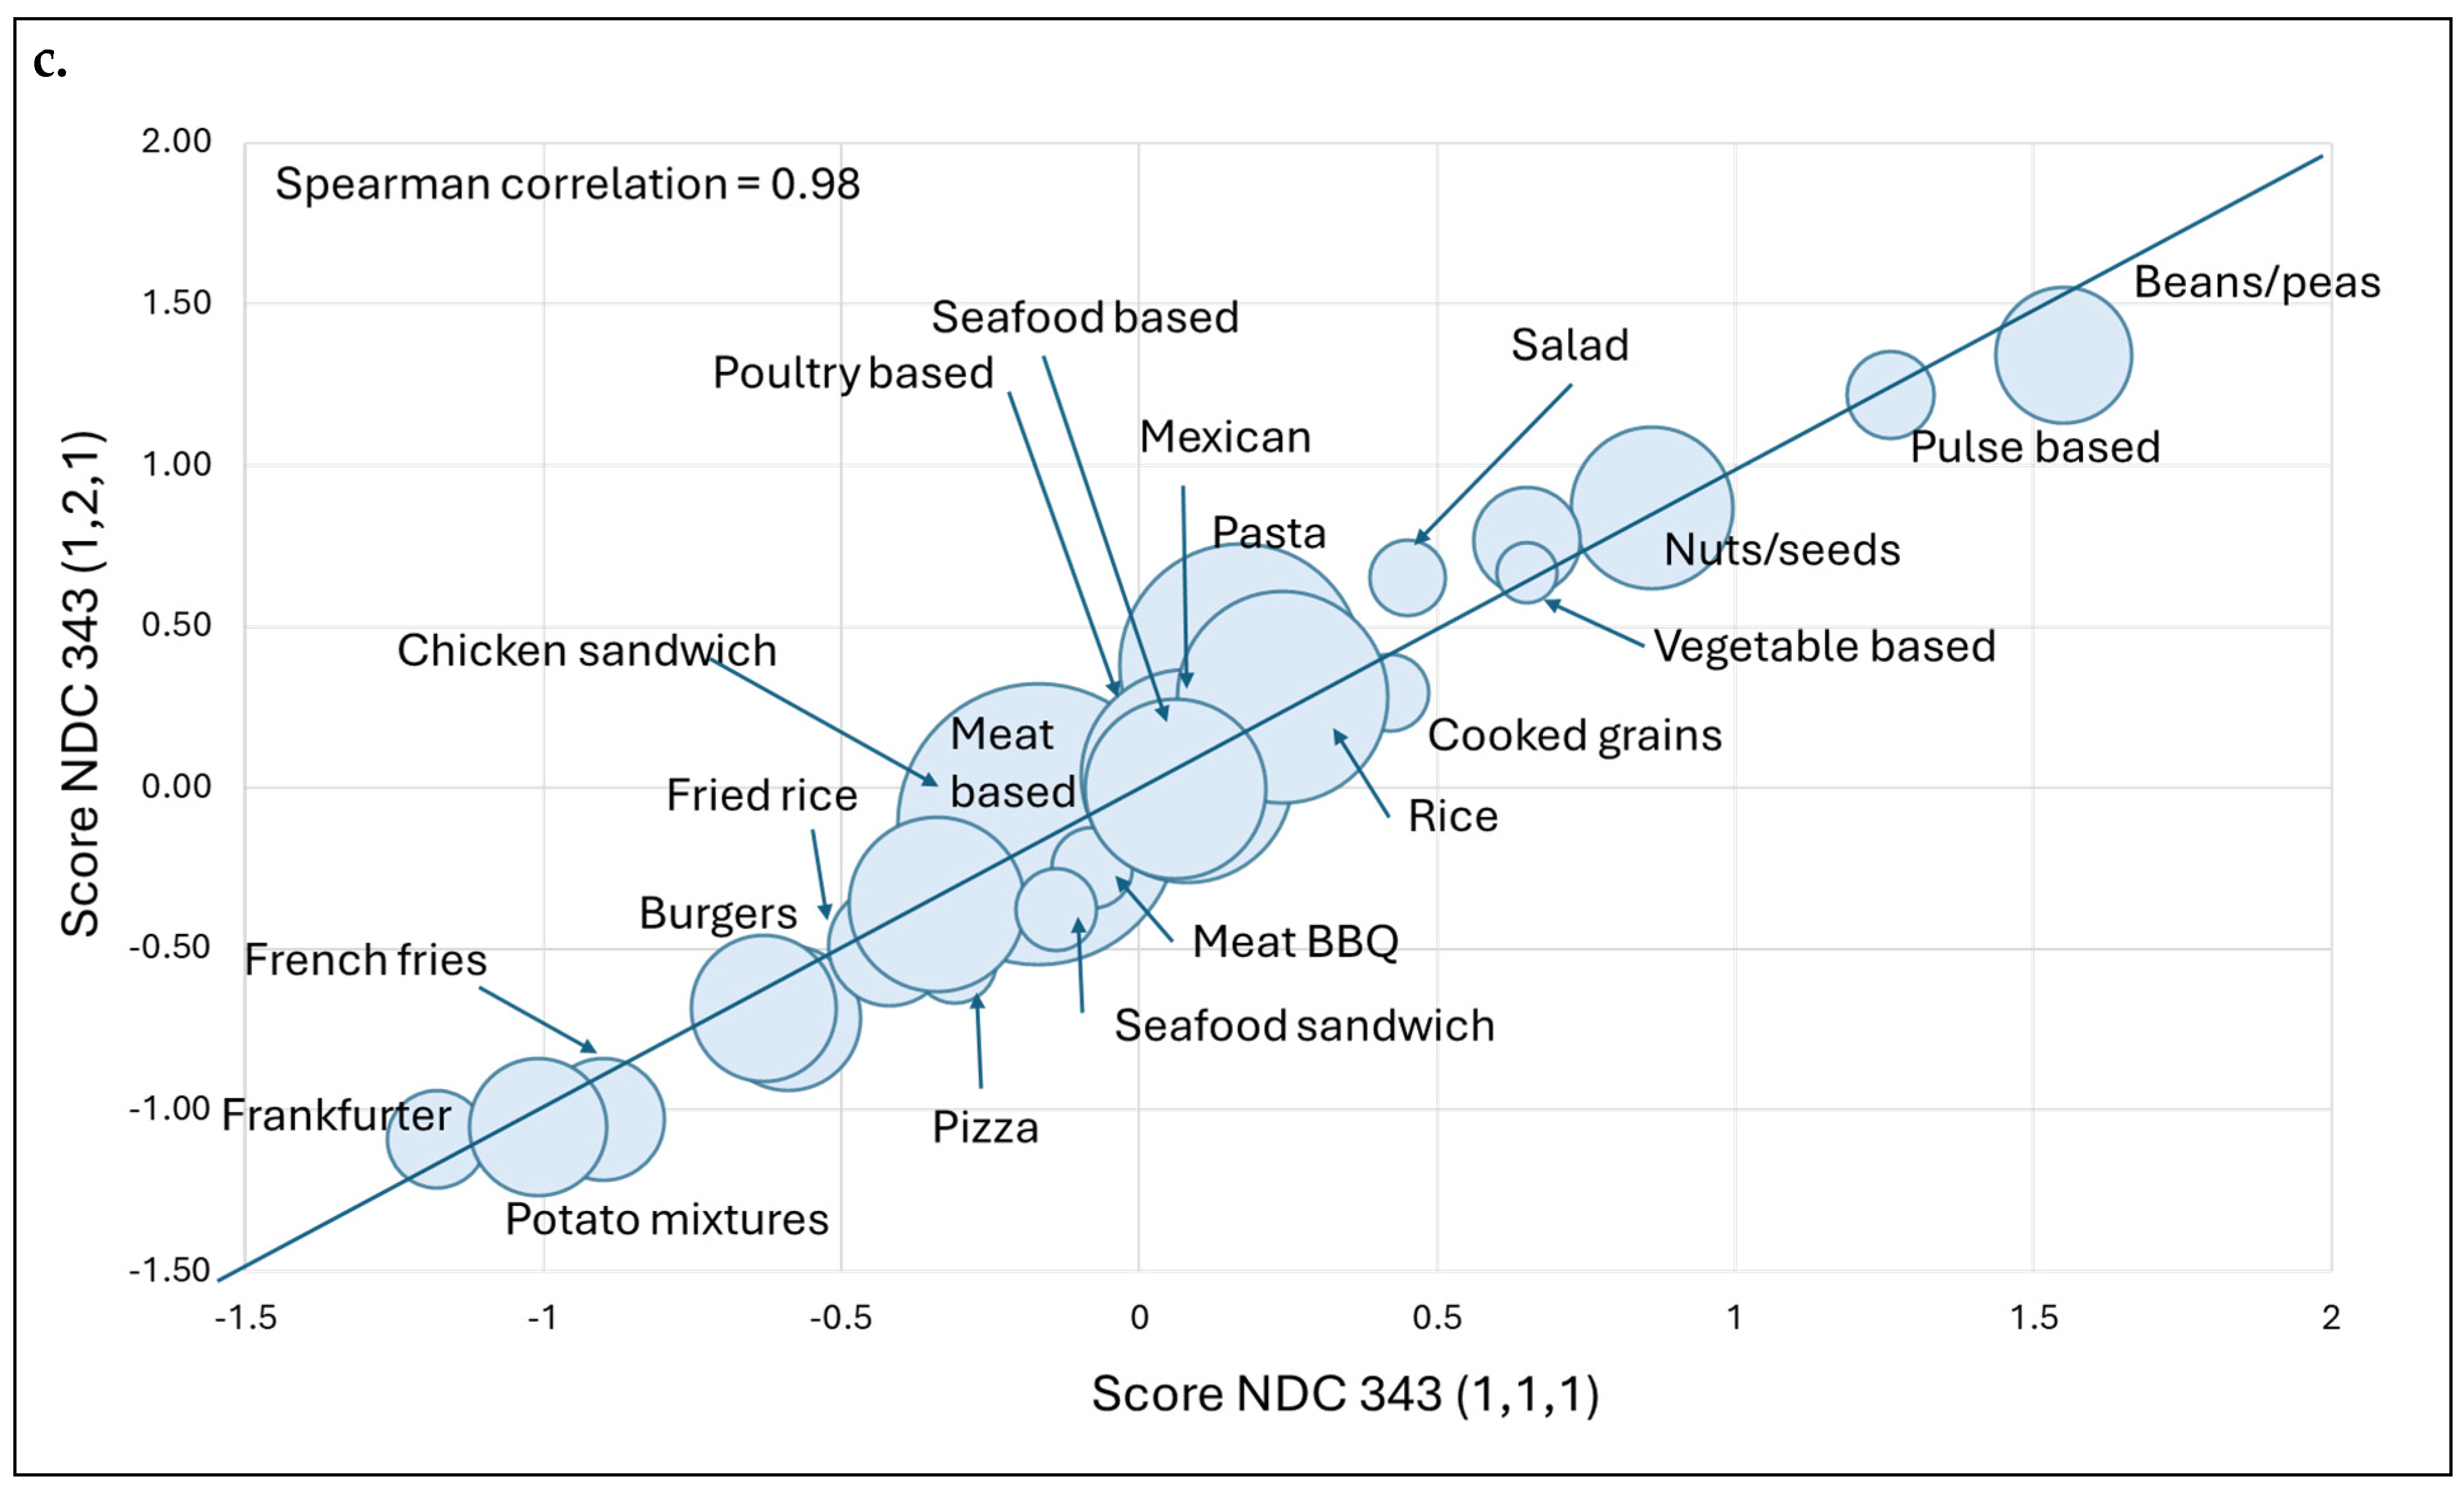
3.3. Different Weights for NDC343 Components (1,1,1), (1,1,2), (2,1,1) and (1,2,1)
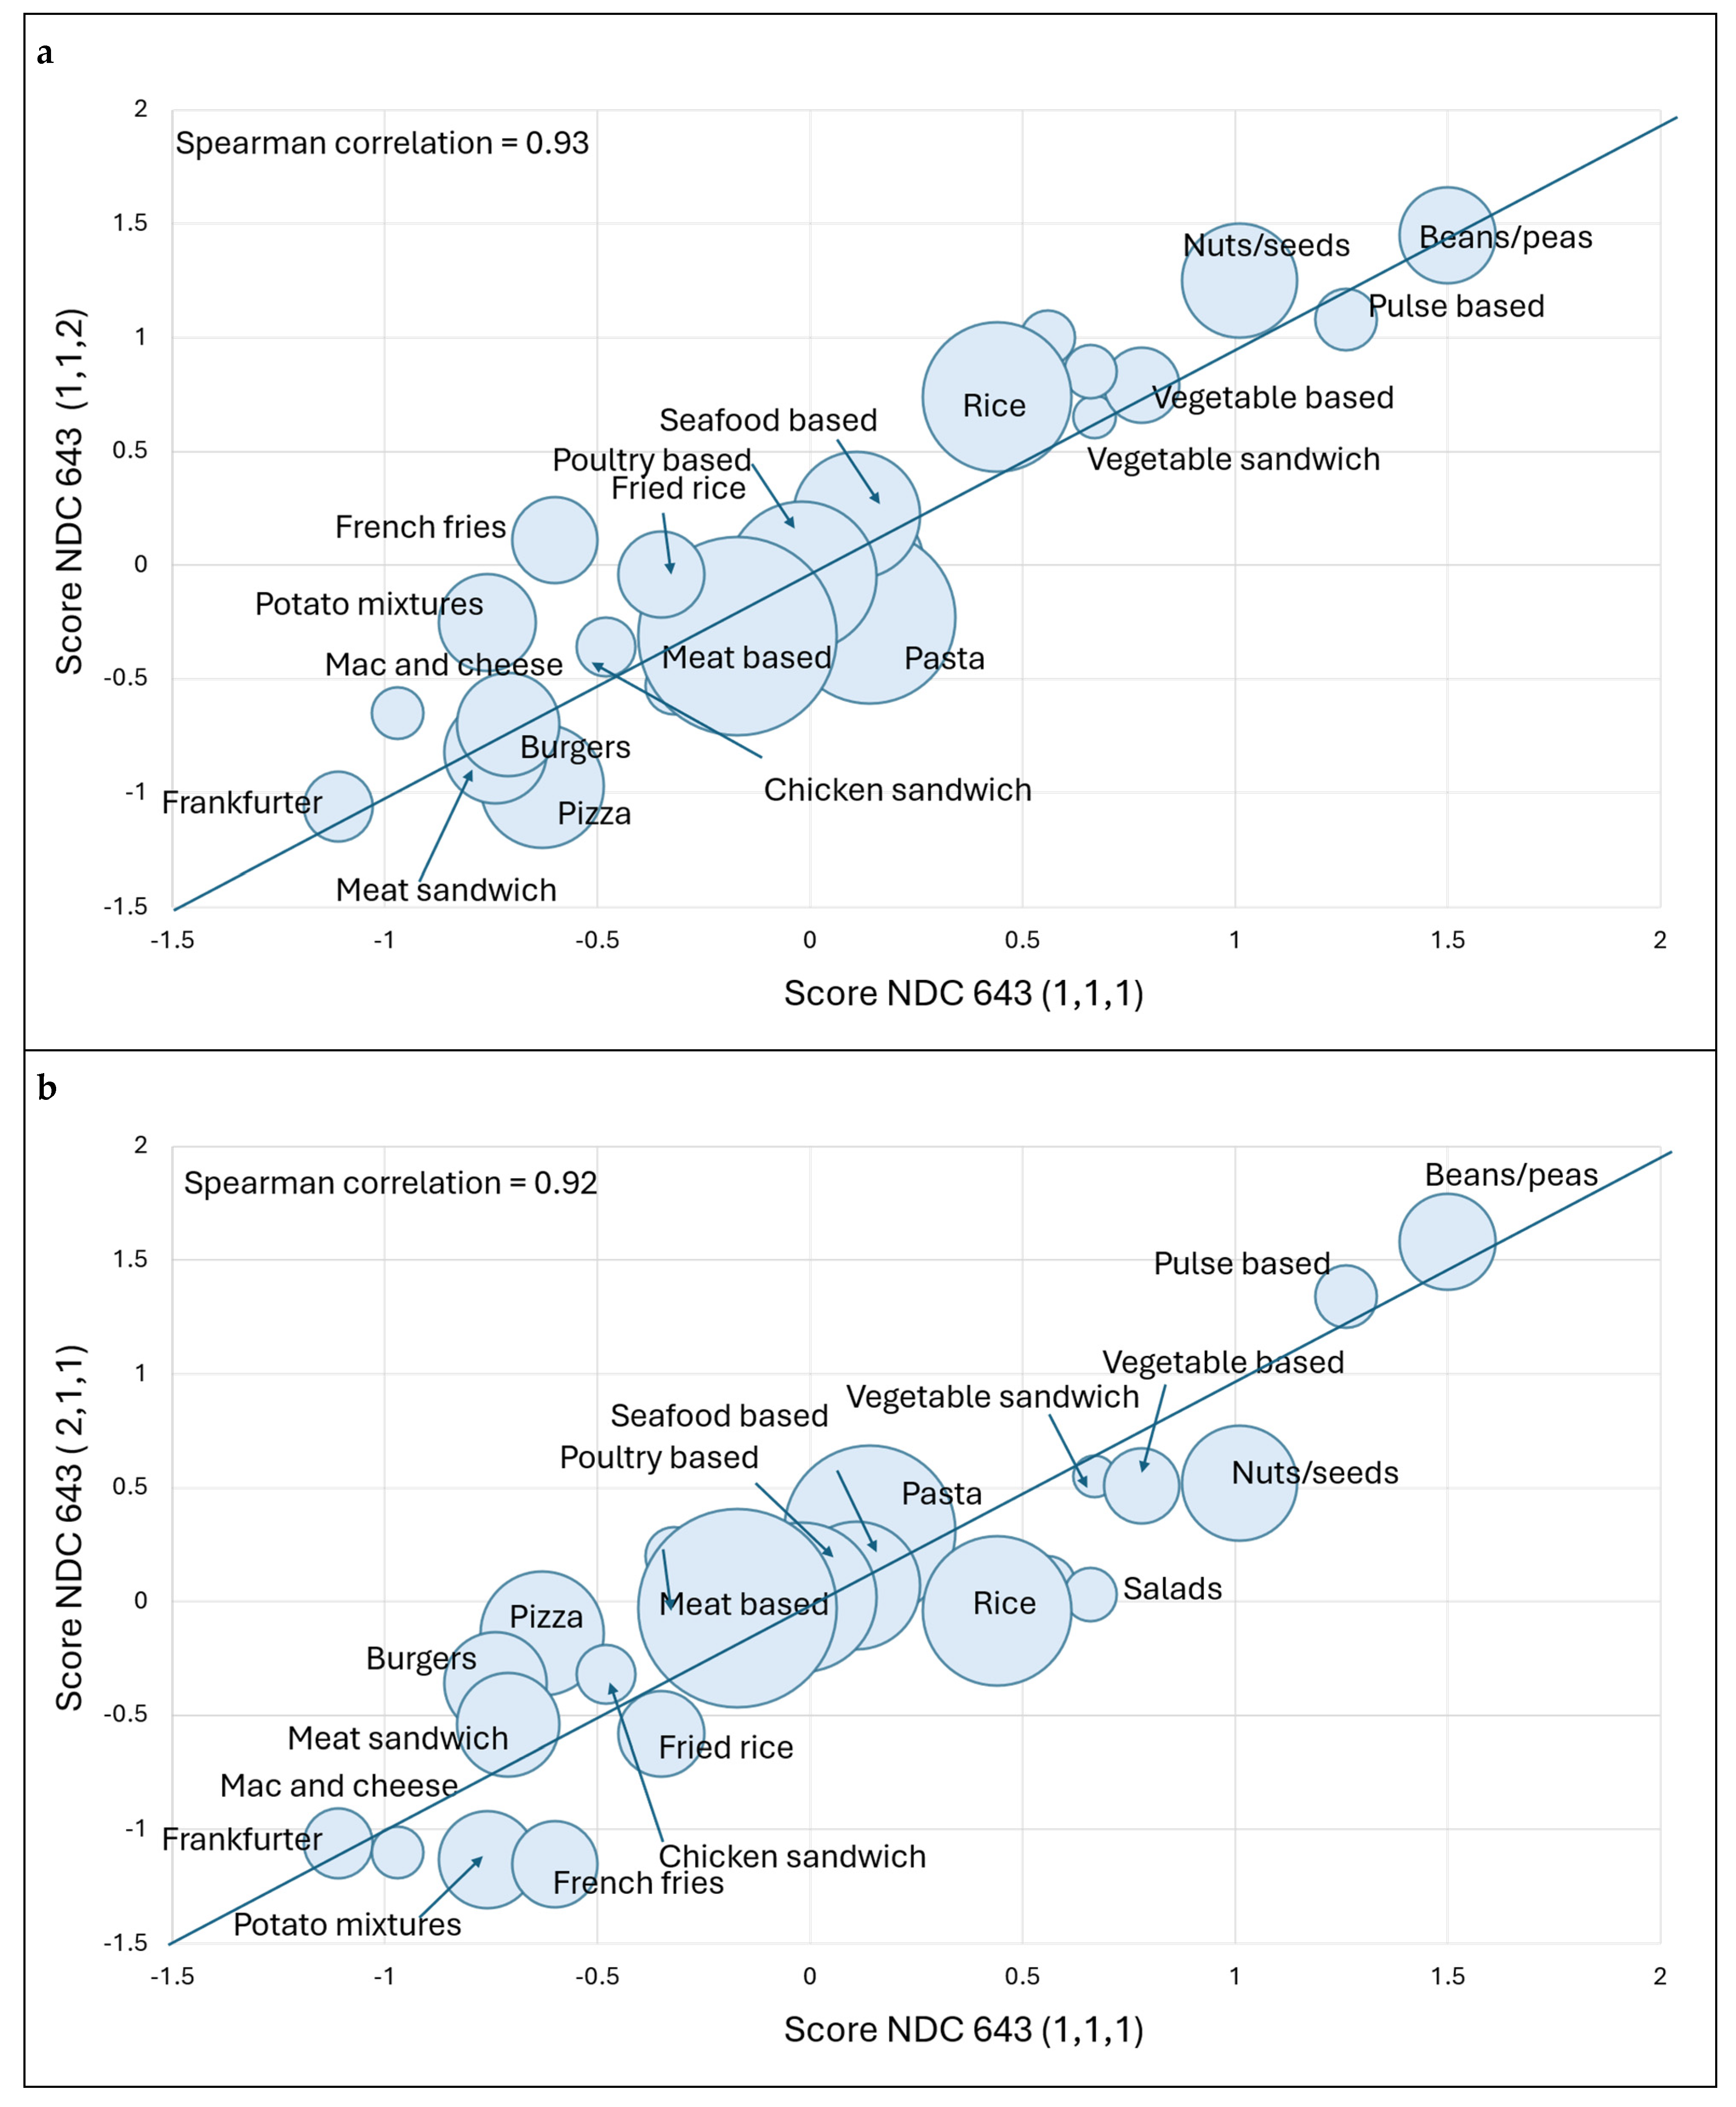
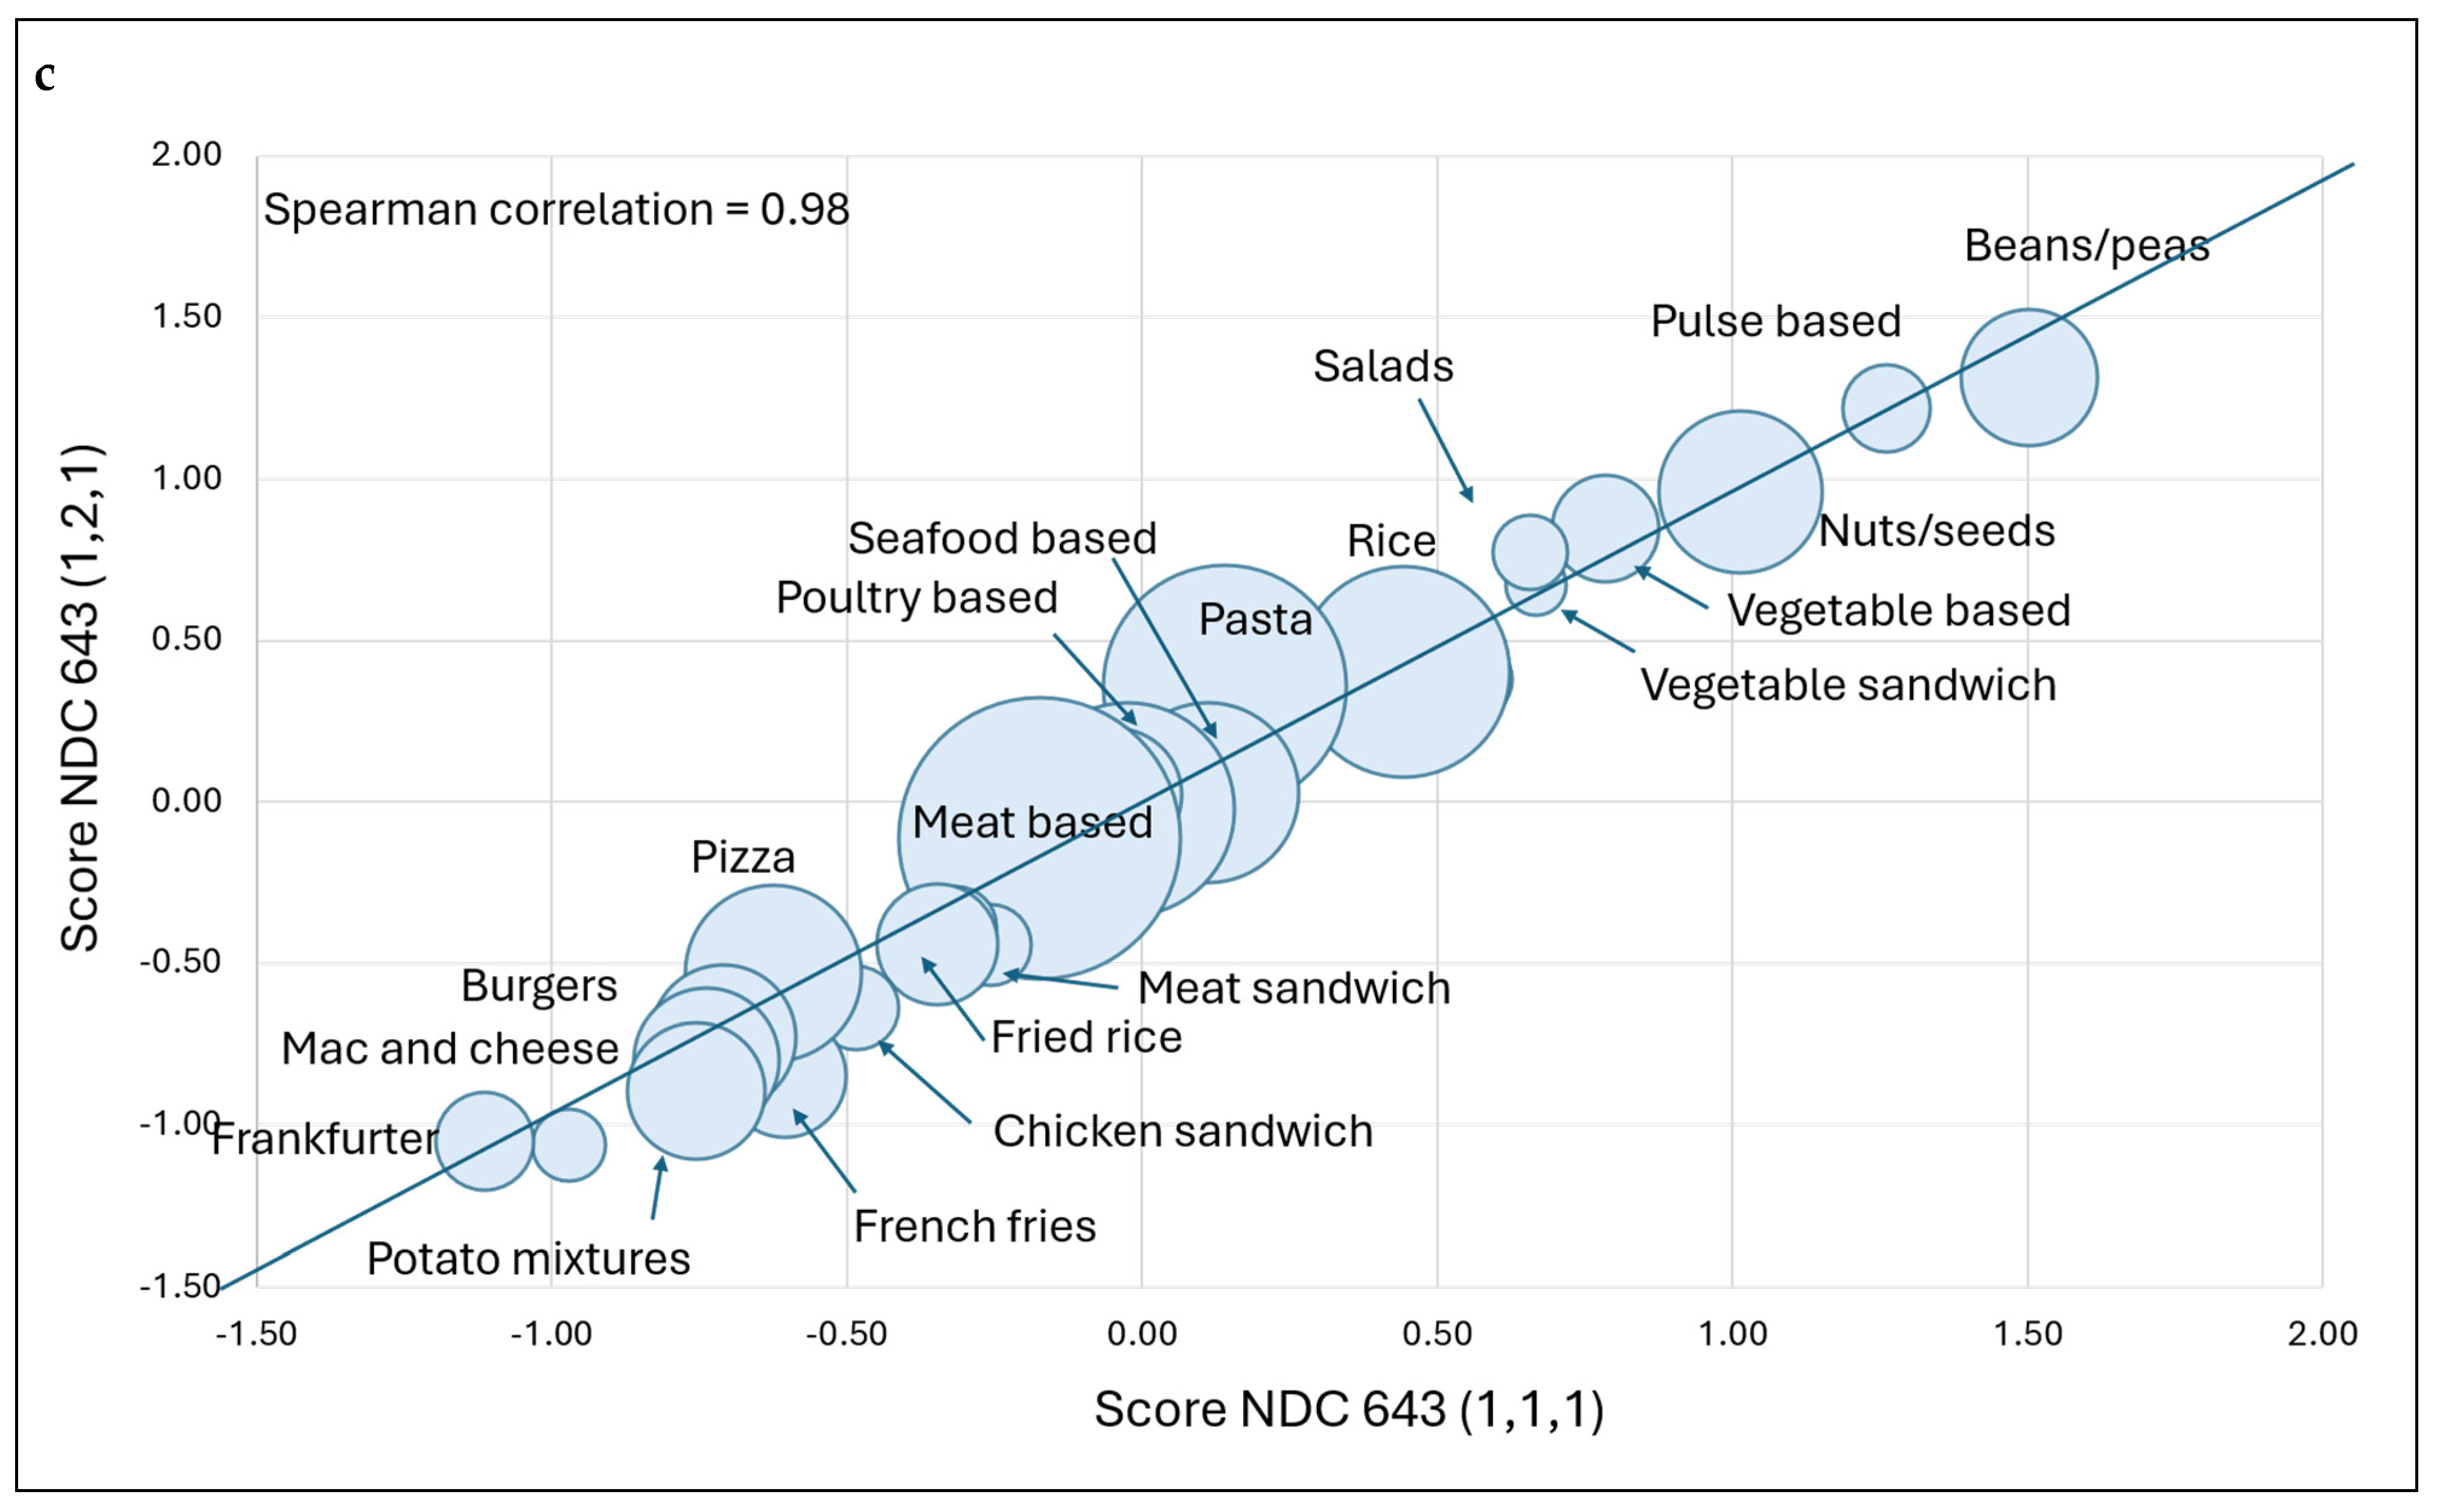
3.4. Different Weights for NDC643 Components (1,1,1), (1,1,2), (2,1,1) and (1,2,1)
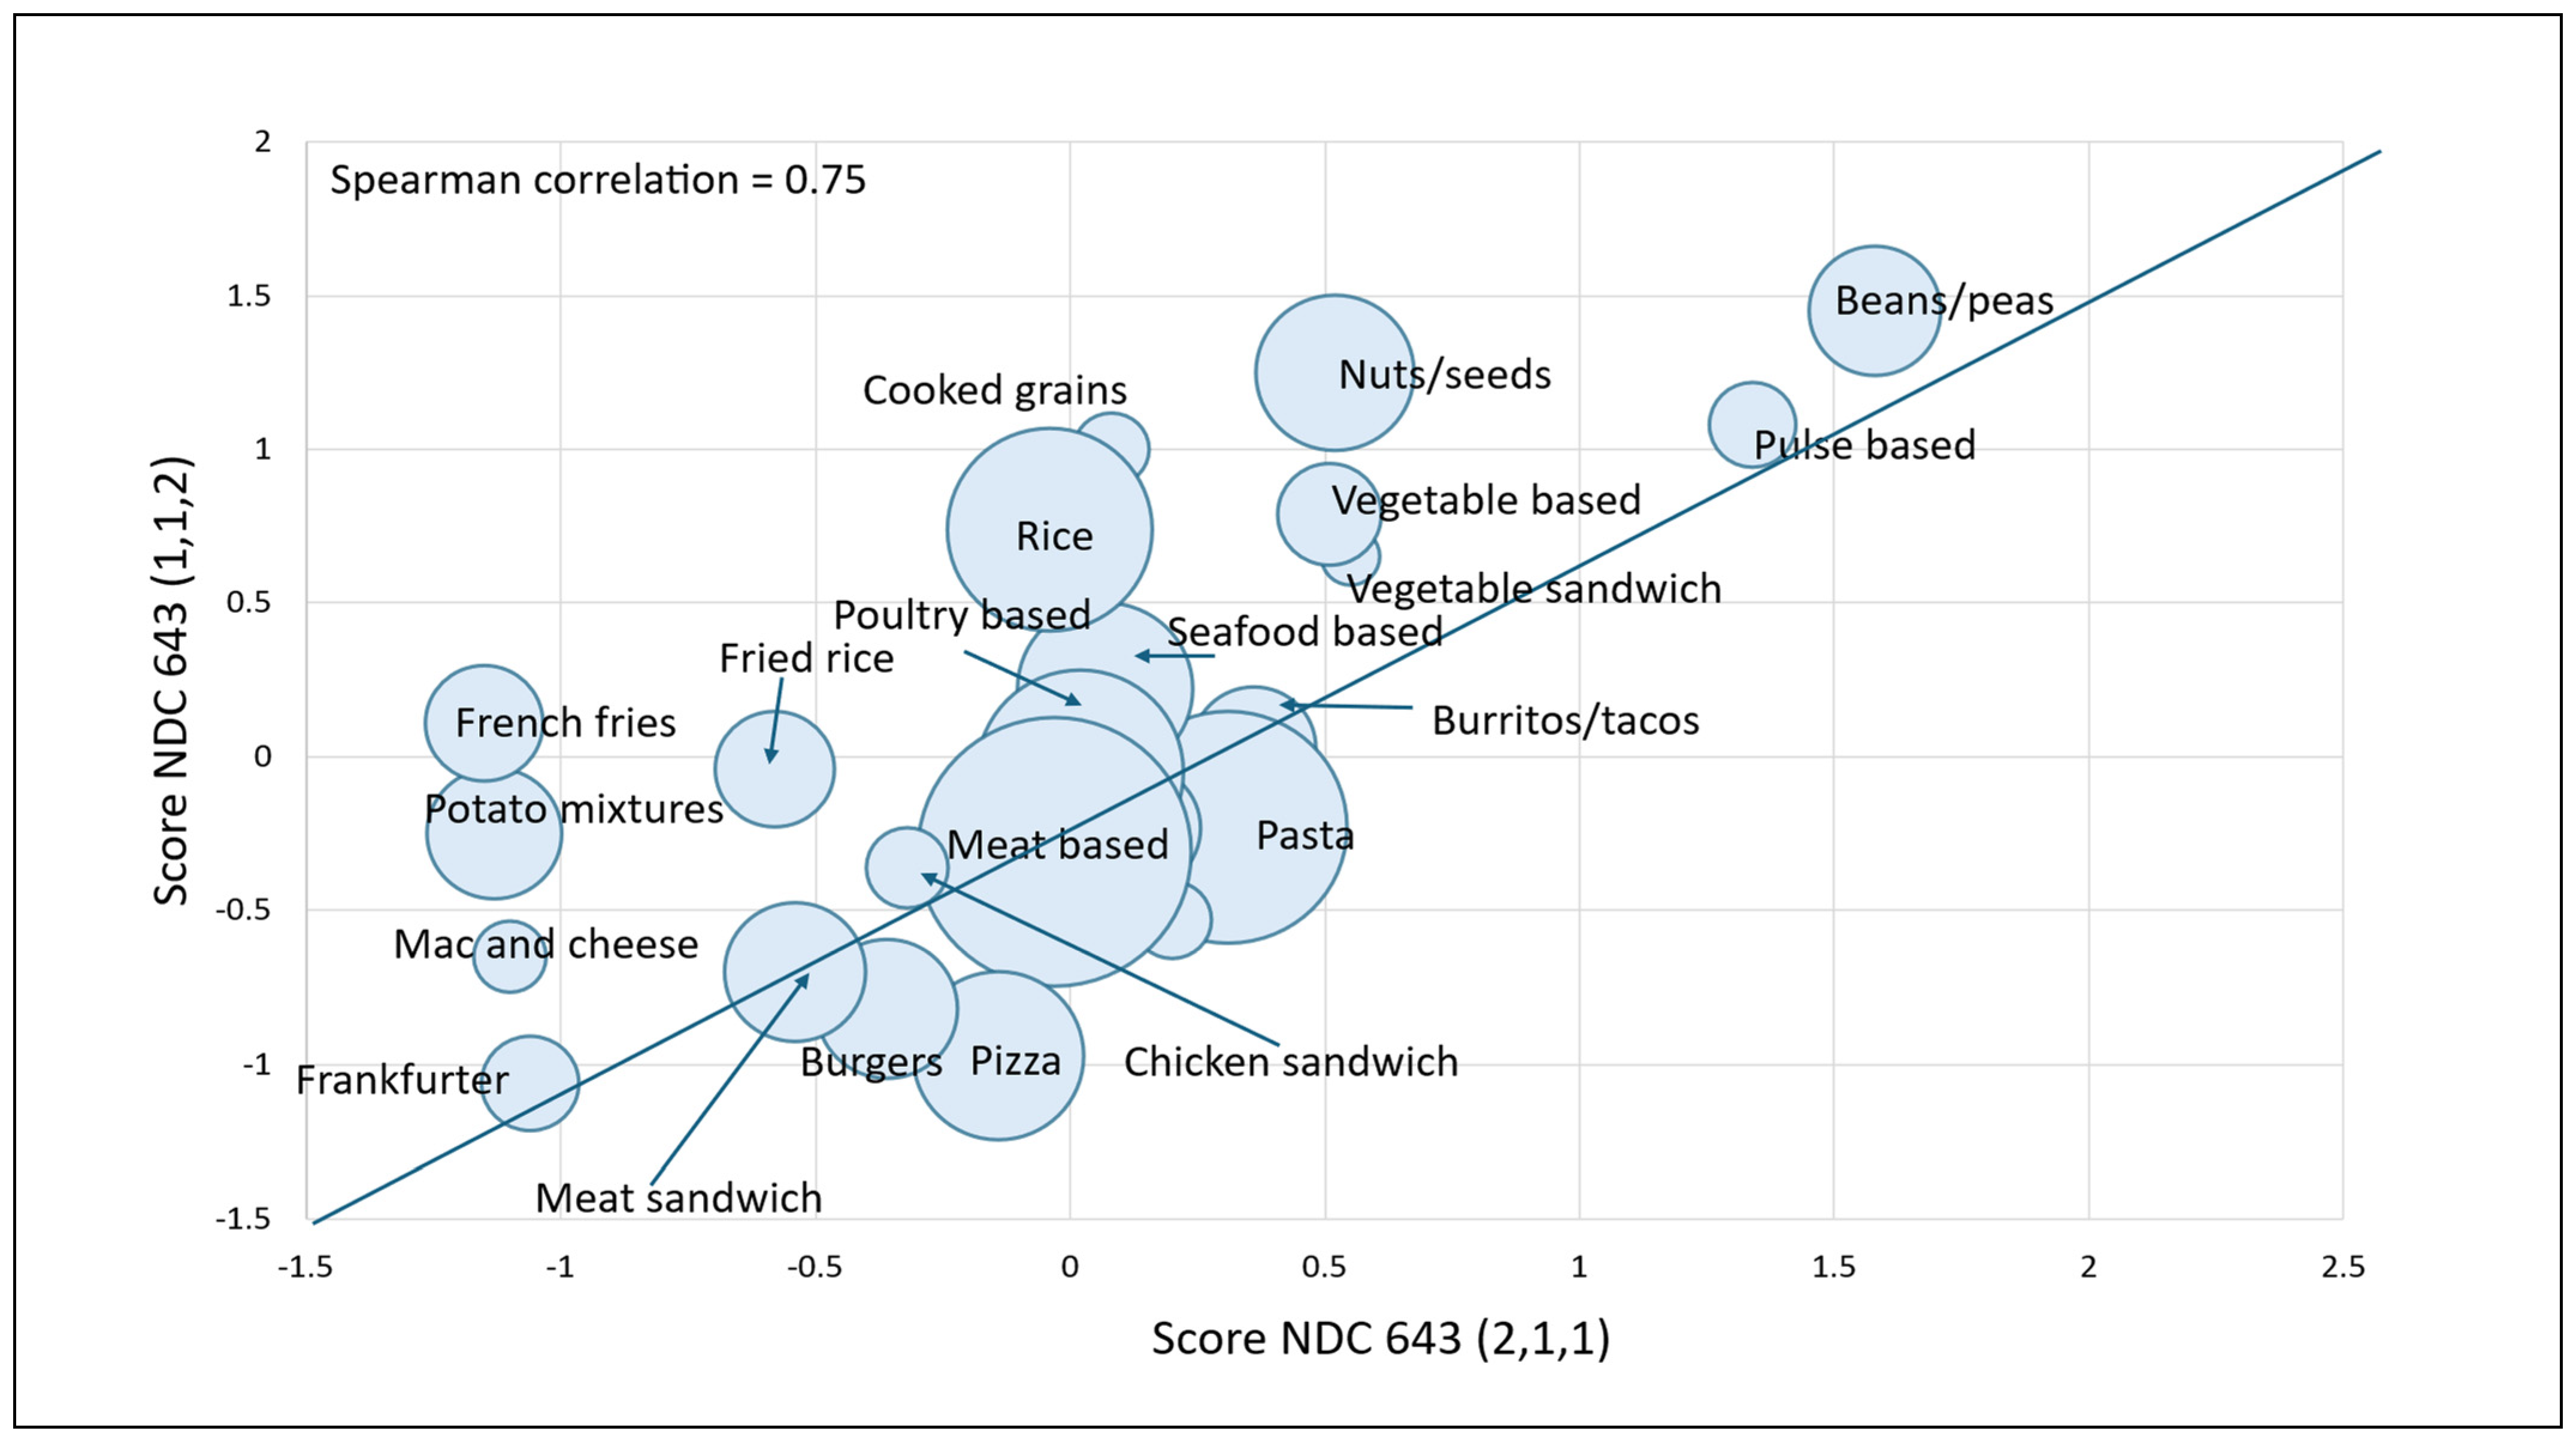
3.5. Contrast Between NDC643 (1,1,2) and NDC643 (2,1,1) Alternative Weights
3.6. Correlations Between NDC643 and Nutri-Score and Health Star Rating (HSR)
3.7. Converting Raw NDC Values to NDC643 10-Point Score
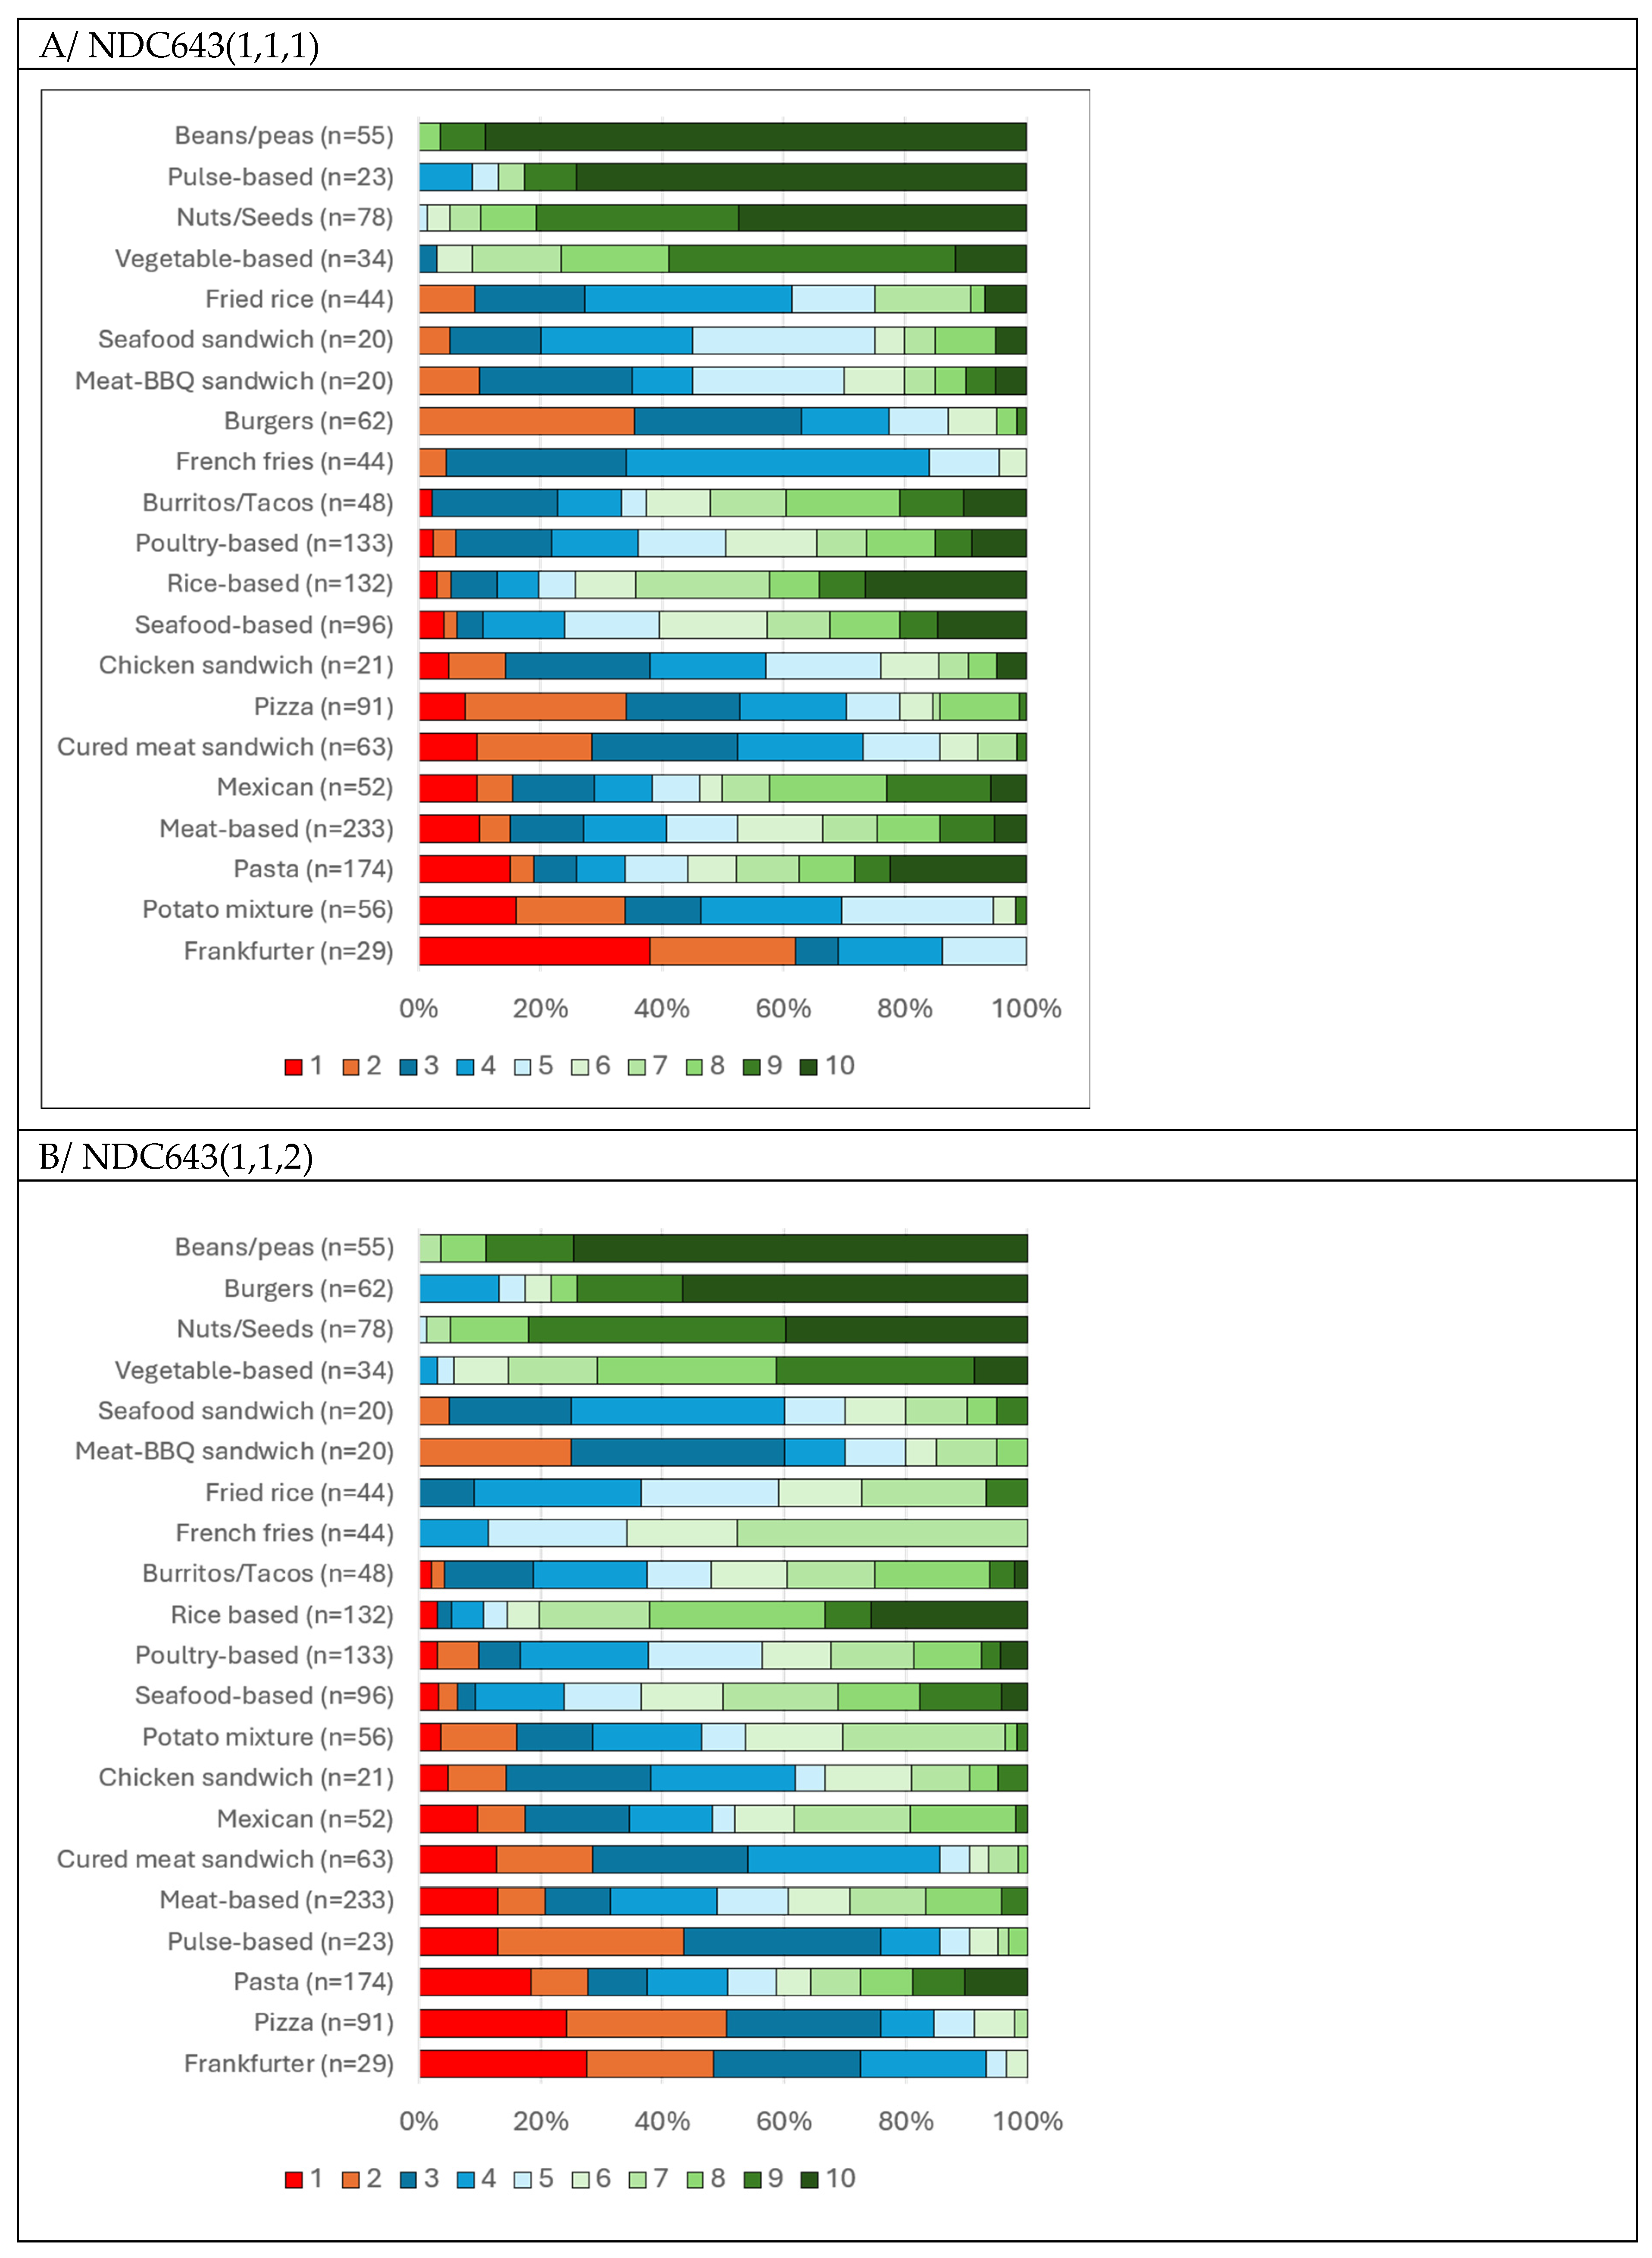
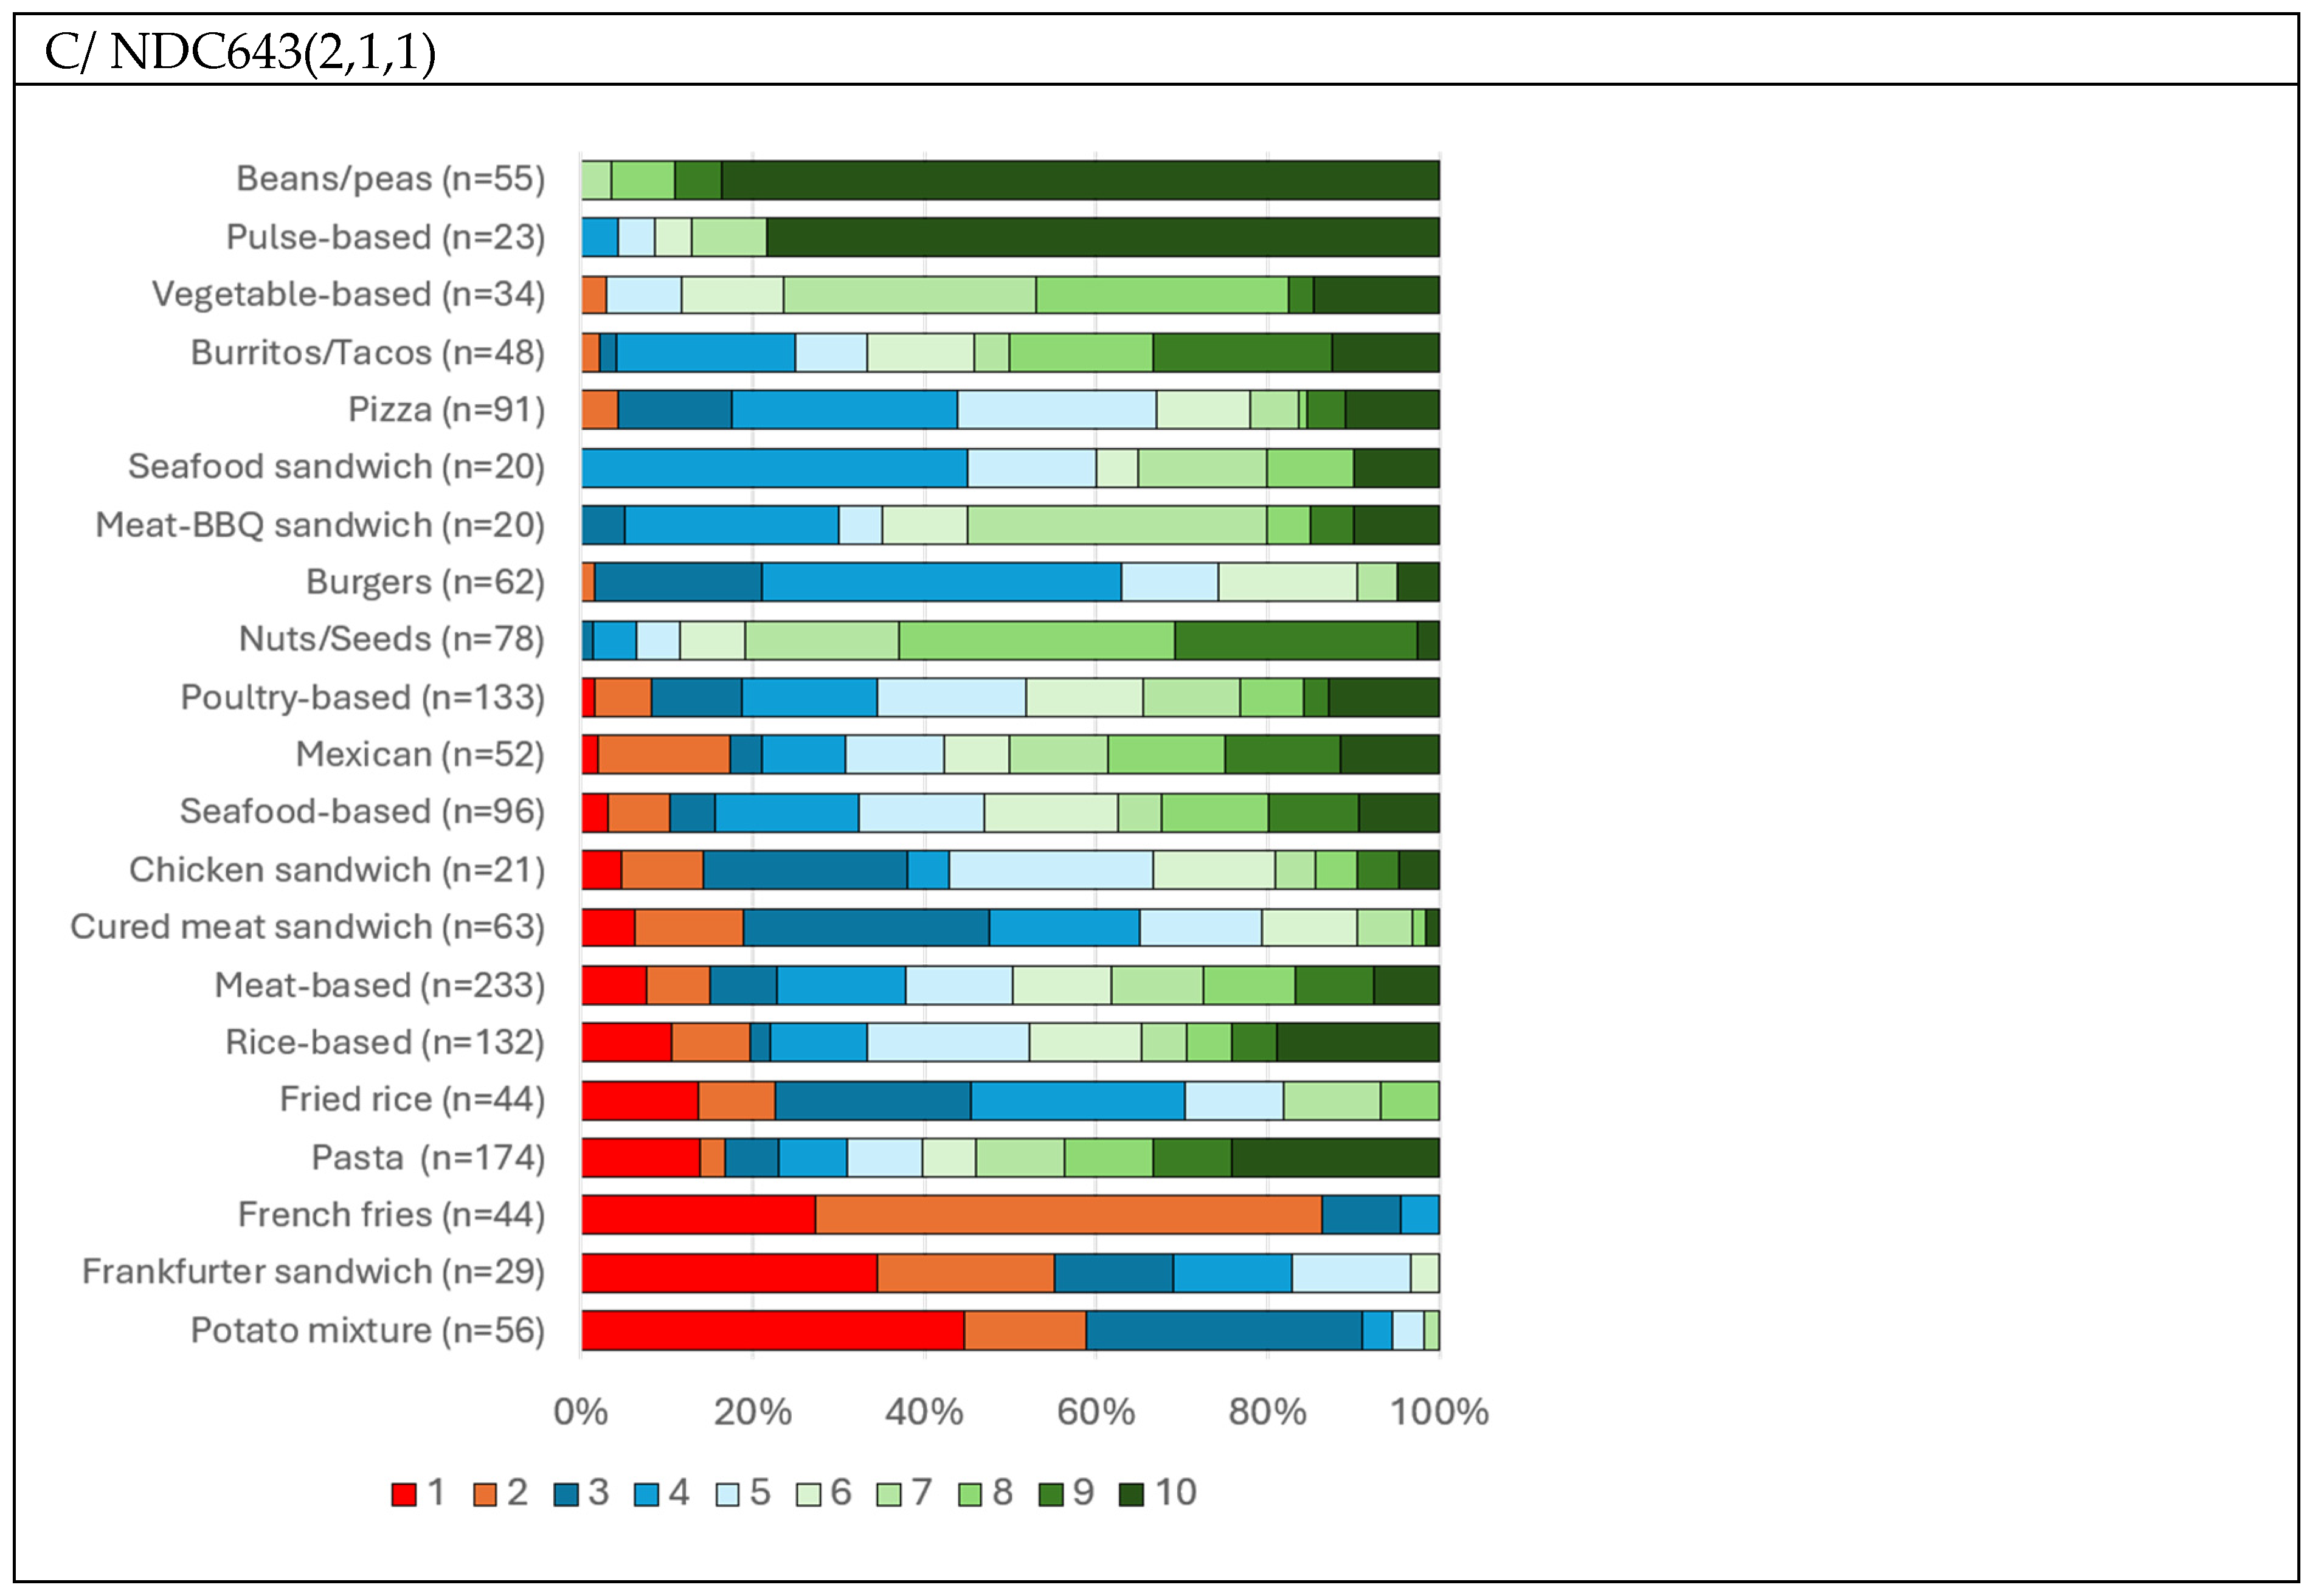
3.8. Sensitivity of NDC643 Within Food Categories Using 10-Point Scale
3.9. Sensitivity of NDC643 to Reformulation of Mixed Dishes
4. Discussion
5. Conclusions
Supplementary Materials
Author Contributions
Funding
Institutional Review Board Statement
Informed Consent Statement
Data Availability Statement
Acknowledgments
Conflicts of Interest
Abbreviations
| DVs | Daily values |
| DGA | Dietary guidelines for Americans |
| FDA | Food and Drug Administration |
| FNDDS | Food and Nutrient Database for Dietary Studies |
| FPED | Food Patterns Equivalents Database |
| MRVs | Maximal recommended values |
| NP | Nutrient profile |
| NDC | Nutrient Density Calculator |
| NHANES | National Health and Nutrition Examination Survey |
| RACC | Reference Amount Customarily Consumed |
References
- Lehmann, U.; Charles, V.R.; Vlassopoulos, A.; Masset, G.; Spieldenner, J. Nutrient profiling for product reformulation: Public health impact and benefits for the consumer. Proc. Nutr. Soc. 2017, 76, 255–264. [Google Scholar] [CrossRef] [Scilit] [PubMed]
- van der Bend, D.L.M.; van Eijsden, M.; van Roost, M.H.I.; de Graaf, K.; Roodenburg, A.J.C. The Nutri-Score algorithm: Evaluation of its validation process. Front. Nutr. 2022, 9, 974003. [Google Scholar] [CrossRef] [Scilit] [PubMed] [PubMed Central]
- Curtain, F.; Grafenauer, S. Health Star Rating in Grain Foods—Does It Adequately Differentiate Refined and Whole Grain Foods? Nutrients 2019, 11, 415. [Google Scholar] [CrossRef] [Scilit] [PubMed]
- Drewnowski, A.; Dwyer, J.; King, J.C.; Weaver, C.M. A proposed nutrient density score that includes food groups and nutrients to better align with dietary guidance. Nutr. Rev. 2019, 77, 404–416. [Google Scholar] [CrossRef] [Scilit] [PubMed] [PubMed Central]
- Drewnowski, A. Uses of nutrient profiling to address public health needs: From regulation to reformulation. Proc. Nutr. Soc. 2017, 76, 220–229. [Google Scholar] [CrossRef] [Scilit] [PubMed]
- US Department of Agriculture. Food and Nutrient Database for Dietary Studies. Available online: https://www.ars.usda.gov/northeast-area/beltsville-md-bhnrc/beltsville-human-nutrition-research-center/food-surveys-research-group/docs/fndds/ (accessed on 7 July 2026).
- Md Noh, M.F.; Gunasegavan, R.D.; Mustafa Khalid, N.; Balasubramaniam, V.; Mustar, S.; Abd Rashed, A. Recent Techniques in Nutrient Analysis for Food Composition Database. Molecules 2020, 25, 4567. [Google Scholar] [CrossRef] [Scilit] [PubMed] [PubMed Central]
- Das, P.; Devi, L.P.; Gogoi, M. Nutrient composition of some regional recipes of Assam, India. Stud. Ethno-Med. 2009, 3, 111–117. [Google Scholar] [CrossRef] [Scilit]
- Das, P.; Neog, P.; Laishram, P.D.; Gogoi, M. Nutrient composition of some cereals and pulses based recipes of Assam, India. J. Hum. Ecol. 2005, 17, 237–246. [Google Scholar] [CrossRef] [Scilit]
- Hoteit, M.; Zoghbi, E.; Rady, A.; Shankiti, I.; Al-Jawaldeh, A. Fatty Acids Quality in Middle Eastern Traditional Dishes, Arabic Sweets and Market Foods Frequently Consumed in Lebanon. Nutrients 2021, 13, 2462. [Google Scholar] [CrossRef] [Scilit] [PubMed] [PubMed Central]
- Issa, C.; Salameh, P.; Batal, M.; Vieux, F.; Lairon, D.; Darmon, N. The nutrient profile of traditional Lebanese composite dishes: Comparison with composite dishes consumed in France. Int. J. Food Sci. Nutr. 2009, 60, 285–295. [Google Scholar] [CrossRef] [Scilit] [PubMed]
- Vijayakumar, A.; Dubasi, H.B.; Awasthi, A.; Jaacks, L.M. Development of an Indian Food Composition Database. Curr. Dev. Nutr. 2024, 8, 103790, Erratum in: Curr Dev. Nutr. 2025, 9, 107450. https://doi.org/10.1016/j.cdnut.2025.107450. [Google Scholar] [CrossRef] [Scilit] [PubMed] [PubMed Central]
- Basaqr, R.; Bakr, E.S.; Ibrahim, Y.; Bujan, Y.; Alqasimi, K.; Aljaadi, A. Comprehensive nutritional compositions of traditional dishes from five Saudi regions using Elizabeth Stewart Hands and Associates Food Processor software. Front. Nutr. 2025, 12, 1658078. [Google Scholar] [CrossRef] [Scilit] [PubMed] [PubMed Central]
- Fulgoni, V.L.; Keast, D.R.; Drewnowski, A. Development and Validation of the Nutrient-Rich Foods Index: A Tool to Measure Nutritional Quality of Foods. J. Nutr. 2009, 139, 1549–1554. [Google Scholar] [CrossRef] [Scilit] [PubMed]
- Hua, S.V.; Soto, M.J.; Dunn, C.G.; Bleich, S.N.; Vercammen, K.A. Prevalence and nutrient composition of menu offerings targeted to customers with dietary restrictions at US fast casual and full-service restaurants. Public Health Nutr. 2021, 24, 1240–1247. [Google Scholar] [CrossRef] [Scilit] [PubMed] [PubMed Central]
- US Food and Drug Administration. Reference Amounts Customarily Consumed per Eating Occasion. Code of Federal Regulations Title 21. US Food and Drug Administration. Available online: https://www.ecfr.gov/current/title-21/chapter-I/subchapter-B/part-101/subpart-A/section-101.12 (accessed on 7 July 2026).
- Shahid, M.; Neal, B.; Jones, A. Uptake of Australia’s Health Star Rating System 2014–2019. Nutrients 2020, 12, 1791. [Google Scholar] [CrossRef] [Scilit] [PubMed] [PubMed Central]
- US Department of Agriculture. Food Patterns Equivalents Database 2017–2018: Methodology and User Guide. Available online: https://www.ars.usda.gov/ARSUserFiles/80400530/pdf/fped/Amended%20FPED%202017-2018%20documentation%20for%20Use%20with%20WWEIA%20NHANES%202017-March%202020%20Prepandemic.pdf (accessed on 7 July 2026).
- Centers for Disease Control and Prevention. NHANES Survey Methods and Analytic Guidelines. Available online: https://wwwn.cdc.gov/nchs/nhanes/analyticguidelines.aspx (accessed on 7 July 2026).
- Darmon, N.; Vieux, F.; Maillot, M.; Volatier, J.-L.; Martin, A. Nutrient profiles discriminate between foods according to their contribution to nutritionally adequate diets: A validation study using linear programming and the SAIN,LIM system. Am. J. Clin. Nutr. 2009, 89, 1227–1236. [Google Scholar] [CrossRef] [Scilit] [PubMed]
- Matthieu, M.; Elaine, L.; Adam, D.; Nicole, D. Nutrient Profiling Can Help Identify Foods of Good Nutritional Quality for Their Price: A Validation Study with Linear Programming. J. Nutr. 2008, 138, 1107–1113. [Google Scholar] [CrossRef] [Scilit] [PubMed]
- US Food and Drug Administration. Daily Value on the Nutrition and Supplement Facts Labels. Available online: https://www.fda.gov/food/nutrition-facts-label/daily-value-nutrition-and-supplement-facts-labels (accessed on 7 July 2026).
- U.S. Department of Health and Human Services. Dietary Guidelines for Americans, 2020–2025. 9th ed. Available online: https://www.dietaryguidelines.gov/sites/default/files/2020-12/Dietary_Guidelines_for_Americans_2020-2025.pdf (accessed on 7 July 2026).
- US Department of Agriculture and Department of Health and Human Services. Scientific Report of the 2025 Dietary Guidelines Advisory Committee: Advisory Report to the Secretary of Health and Human Services and Secretary of Agriculture. U.S. Department of Health and Human Services. Available online: https://www.dietaryguidelines.gov/sites/default/files/2024-12/Scientific_Report_of_the_2025_Dietary_Guidelines_Advisory_Committee_508c.pdf (accessed on 7 July 2026).
- Marinangeli, C.P.F.; Curran, J.; Barr, S.I.; Slavin, J.; Puri, S.; Swaminathan, S.; Tapsell, L.; Patterson, C.A. Enhancing nutrition with pulses: Defining a recommended serving size for adults. Nutr. Rev. 2017, 75, 990–1006. [Google Scholar] [CrossRef] [Scilit] [PubMed] [PubMed Central]
- Fadnes, L.T.; Balakrishna, R. Nuts and seeds—A scoping review for Nordic Nutrition Recommendations 2023. Food Nutr. Res. 2024, 68, 10483. [Google Scholar] [CrossRef] [Scilit] [PubMed] [PubMed Central]
- Yu, L.; Braesco, V.; Cooper, S.L.; Drewnowski, A.; Esteves, B.H.; Budelli, A.L. The Kraft Heinz Company global nutrition targets for the innovation and reformulation of food and beverages: Current and future directions. Front. Nutr. 2023, 10, 1104617. [Google Scholar] [CrossRef] [Scilit] [PubMed] [PubMed Central]
- Grummon, A.H.; Petimar, J.; Soto, M.J.; Bleich, S.N.; Simon, D.; Cleveland, L.P.; Rao, A.; Block, J.P. Changes in Calorie Content of Menu Items at Large Chain Restaurants After Implementation of Calorie Labels. JAMA Netw. Open 2021, 4, e2141353. [Google Scholar] [CrossRef] [Scilit] [PubMed]
- Rocha, A.; Viegas, C.; Gonçalves, S. Turning the table toward plant-based: Different perspectives on menu reformulation in food service. Front. Nutr. 2025, 12, 1601979. [Google Scholar] [CrossRef] [Scilit] [PubMed] [PubMed Central]
- Soo, J.; Harris, J.L.; Davison, K.K.; Williams, D.R.; Roberto, C.A. Changes in the nutritional quality of fast-food items marketed at restaurants, 2010 v. 2013. Public Health Nutr. 2018, 21, 2117–2127. [Google Scholar] [CrossRef] [Scilit] [PubMed] [PubMed Central]
- Hatton, C.R.; Petimar, J.; Zhang, Y.; Collis, C.E.; Hou, T.; Ross, A.; Polacsek, M.; Grummon, A.H.; Rimm, E.B.; Block, J.P. Product Reformulation in Response to the 2016 FDA Updated Nutrition Facts Label. JAMA Health Forum 2026, 7, e261253. [Google Scholar] [CrossRef] [Scilit] [PubMed]
- Agarwal, S.; Fulgoni, V.L., 3rd. Effect of Adding Pulses to Replace Protein Foods and Refined Grains in Healthy Dietary Patterns. Nutrients 2023, 15, 4355. [Google Scholar] [CrossRef] [Scilit] [PubMed] [PubMed Central]
- Papanikolaou, Y.; Slavin, J.; Papanikolaou, S.; Fulgoni, V.L., 3rd. Adding more beans to the US typical dietary pattern can lead to greater intake of shortfall nutrients and a higher diet quality in younger and older adults. Maturitas 2024, 186, 108012. [Google Scholar] [CrossRef] [Scilit] [PubMed]
- Richter, C.; Fulgoni, K.; Fulgoni, V.L., 3rd; Johnson, B.; Kijek, M.; Maniscalco, S.; Psota, T. Assessment of the unique nutrient contribution of white potatoes in the diet and the nutrient implications of replacing Refined and Whole Grains with Starchy Vegetables. Front. Nutr. 2025, 12, 1692564. [Google Scholar] [CrossRef] [Scilit] [PubMed] [PubMed Central]
- Fulgoni, V.L., 3rd; Agarwal, S.; Marinangeli, C.P.F.; Miller, K. Impact of Plant Protein Intakes on Nutrient Adequacy in the US. Nutrients 2024, 16, 1158. [Google Scholar] [CrossRef] [Scilit] [PubMed] [PubMed Central]
- U.S. Department of Health and Human Services. Dietary Guidelines for Americans 2025–2030. Available online: https://cdn.realfood.gov/DGA.pdf (accessed on 7 July 2026).
- National Cattelemn’s Beef Association. 7 January 2026. New Dietary Guidelines Emphasize Beef’s Place in a Healthy Diet. Available online: https://www.ncba.org/news-media/news/details/46309/new-dietary-guidelines-emphasize-beefs-place-in-a-healthy-diet (accessed on 7 July 2026).
- Fulgoni, K.; Fulgoni, V.L., 3rd. Beef Intake Is Associated with Higher Nutrient Intake and Nutrient Adequacy in U.S. Adolescents, NHANES 2001–2018. Nutrients 2023, 15, 4996. [Google Scholar] [CrossRef] [Scilit] [PubMed] [PubMed Central]
- Agarwal, S.; Fulgoni, V.L., 3rd. Beef Consumption Is Associated with Higher Intakes and Adequacy of Key Nutrients in Older Adults Age 60+ Years: National Health and Nutrition Examination Survey 2011–2018 Analysis. Nutrients 2024, 16, 1779. [Google Scholar] [CrossRef] [Scilit] [PubMed] [PubMed Central]
- Fulgoni, K.; Fulgoni, V.L., 3rd; Agarwal, S.; Ricklefs-Johnson, K.; Pikosky, M.A.; Cifelli, C.J. Current Contribution to Energy and Nutrient Intake from Dairy Foods in Children and Adults Using NHANES, 2015–2018. J. Nutr. 2025, 155, 2333–2354. [Google Scholar] [CrossRef] [Scilit] [PubMed]
- Papanikolaou, Y.; Slavin, J.; Fulgoni, V.L., 3rd. Adult dietary patterns with increased bean consumption are associated with greater overall shortfall nutrient intakes, lower added sugar, improved weight-related outcomes and better diet quality. Nutr. J. 2024, 23, 36. [Google Scholar] [CrossRef] [Scilit] [PubMed] [PubMed Central]
- Abi Hanna, M. Decoding Reference Amounts Customarily Consumed (RACC). Available online: https://foodlabelmaker.com/regulatory-hub/fda/racc/ (accessed on 7 July 2026).
- Hooker, K.; Sanjeevi, N.; Monsivais, P. An Updated Definition of “Healthy” Foods in the United States: How Do They Measure in Nutrient Density, Cost, and Frequency of Consumption? Curr. Dev. Nutr. 2025, 9, 107545. [Google Scholar] [CrossRef] [Scilit] [PubMed] [PubMed Central]



| Food Group | 4-Digit WWEIA Code | Shortened Name | WWEIA Category Full Name | N |
|---|---|---|---|---|
| Mixed dishes | 3006 | Seafood-based | Seafood mixed dishes | 96 |
| Mixed dishes | 3202 | Rice | Rice mixed dishes | 132 |
| Mixed dishes | 3204 | Pasta | Pasta mixed dishes, excl mac and cheese | 174 |
| Mixed dishes | 3206 | Mac and cheese | Macaroni and cheese | 16 |
| Mixed dishes | 3104 | Vegetable-based | Vegetable dishes | 34 |
| Mixed dishes | 4004 | Cooked grains | Pasta, noodles, cooked grains | 18 |
| Mixed dishes | 3402 | Fried rice | Fried rice and lo/chow mein | 44 |
| Mixed dishes | 3002 | Meat-based | Meat mixed dishes | 233 |
| Mixed dishes | 3004 | Poultry-based | Poultry mixed dishes | 133 |
| Mixed dishes | 3102 | Pulse-dbased | Bean, pea, legume dishes | 23 |
| Mixed dishes | 3502 | Burritos/tacos | Burritos and tacos | 48 |
| Mixed dishes | 3506 | Mexican | Other Mexican mixed dishes | 52 |
| Mixed dishes | 3602 | Pizza | Pizza | 91 |
| Sandwiches | 3702 | Burgers | Burgers | 62 |
| Sandwiches | 3742 | Meat–BBQ sandwich | Meat and BBQ sandwiches | 20 |
| Sandwiches | 3740 | Cured meat sandwich | Deli and cured meat sandwiches | 63 |
| Sandwiches | 3704 | Chicken sandwich | Chicken filet sandwiches | 21 |
| Sandwiches | 3730 | Seafood sandwich | Seafood sandwiches | 20 |
| Sandwiches | 3703 | Frankfurter | Frankfurter sandwiches | 29 |
| Sandwiches | 3744 | Vegetable sandwich | Vegetable sandwiches/burgers | 11 |
| Single dishes | 2802 | Beans/peas | Beans, peas, legumes (cooked) | 55 |
| Single dishes | 6432 | Non-lettuce salads | Coleslaw, non-lettuce salads | 17 |
| Single dishes | 6806 | Potato mixtures | Mashed potatoes, white potato mixtures | 56 |
| Single dishes | 6804 | French fries | French fries, fried white potatoes | 44 |
| Nuts and seeds | 2804 | Nuts/seeds | Nuts and seeds | 78 |
| Nutrients to Encourage | Daily Value | Ingredients | Daily Value | Nutrients to Limit | Maximum Recommended Value |
|---|---|---|---|---|---|
| Protein * | 50 g | Fruits and vegetable | 85 g | Saturated fats | 20 g |
| Fiber * | 28 g | Whole grains | 50 g | Sodium | 2300 mg |
| Calcium * | 1300 mg | Pulses | 65 g | Total/added sugars | Total 90 g/added 50 g |
| Iron | 18 mg | Nuts and seeds | 30 g | ||
| Potassium | 3500 mg | ||||
| Vitamin D | 20 mcg |
| Name | Formula | Weight for NRn3 or 6 | Weight for MP4 | Weight for LIM3 | Range for Final Score, % |
|---|---|---|---|---|---|
| NDCn43(1,1,1) | NRn×1 + MP4×1 − LIM3×1 | 1/3 = 0.33 | 1/3 = 0.33 | 1/3 = 0.33 | −100 to 200 |
| NDCn43(1,1,2) | NRn×1 + MP4×1 − LIM3×2 | 1/4 = 0.25 | 1/4 = 0.25 | 2/4 = 0.50 | −200 to 200 |
| NDCn43(2,1,1) | NRn×2 + MP4×1 − LIM3×1 | 2/4 = 0.50 | 1/4 = 0.25 | 1/4 = 0.25 | −100 to 300 |
| NDCn43(1,2,1) | NRn×1 + MP4×2 − LIM3×1 | 1/4 = 0.25 | 2/4 = 0.50 | 1/4 = 0.25 | −100 to 300 |
| RACC | Observed Serving Sizes from NHANES 2017–2023 for Adults | ||||||||
|---|---|---|---|---|---|---|---|---|---|
| Category | N Events | Mean | SEM | LCL | UCL | 10th ile | 50th ile | 90th ile | |
| Seafood-based | 240 | 523 | 211 | 14.67 | 187 | 236 | 42 | 170 | 442 |
| Rice-based | 240 | 1163 | 181 | 6.04 | 171 | 191 | 56 | 157 | 344 |
| Pasta | 140 | 2476 | 323 | 6.30 | 313 | 334 | 102 | 250 | 500 |
| Mac and cheese | 140 | 816 | 234 | 10.63 | 216 | 252 | 77 | 201 | 460 |
| Vegetable-based | 113 | 384 | 187 | 14.03 | 164 | 211 | 54 | 149 | 359 |
| Cooked grains | 140 | 546 | 153 | 11.05 | 134 | 171 | 43 | 120 | 280 |
| Fried rice | 195 | 764 | 236 | 9.80 | 220 | 253 | 74 | 198 | 433 |
| Meat-based | 240 | 1935 | 255 | 7.64 | 242 | 268 | 60 | 202 | 504 |
| Poultry-based | 240 | 1452 | 246 | 7.11 | 234 | 258 | 75 | 210 | 460 |
| Pulse-based | 240 | 590 | 205 | 14.88 | 180 | 230 | 64 | 170 | 340 |
| Burritos/tacos | 140 | 1102 | 193 | 7.59 | 180 | 206 | 70 | 160 | 362 |
| Mexican | 170 | 1004 | 199 | 7.64 | 186 | 212 | 63 | 157 | 384 |
| Pizza | 195 | 2546 | 212 | 4.68 | 204 | 220 | 70 | 175 | 402 |
| Burgers | 170 | 2047 | 178 | 2.67 | 173 | 182 | 101 | 165 | 270 |
| Meat–BBQ sandwich | 140 | 399 | 216 | 5.96 | 206 | 226 | 100 | 180 | 360 |
| Cured meat sandwich | 155 | 2166 | 156 | 3.05 | 150 | 161 | 86 | 140 | 250 |
| Chicken sandwich | 160 | 892 | 161 | 3.97 | 154 | 168 | 92 | 140 | 280 |
| Seafood sandwich | 140 | 498 | 185 | 5.88 | 175 | 195 | 120 | 180 | 302 |
| Frankfurter | 140 | 697 | 162 | 4.65 | 154 | 170 | 88 | 120 | 302 |
| Vegetable sandwich | 155 | 138 | 146 | 6.28 | 136 | 157 | 64 | 140 | 250 |
| Beans/peas | 130 | 1394 | 135 | 5.04 | 127 | 144 | 25 | 104 | 260 |
| Non-lettuce salads | 100 | 685 | 122 | 7.40 | 109 | 134 | 28 | 110 | 220 |
| Potato mixtures | 140 | 1759 | 191 | 4.33 | 184 | 198 | 63 | 188 | 340 |
| French fries | 70 | 3660 | 95 | 1.93 | 91 | 98 | 30 | 80 | 160 |
| Nuts/seeds | 30 | 5785 | 36 | 1.19 | 34 | 38 | 5 | 28 | 73 |
| Scores and Metrics | Energy Density, kcal/100 g | Energy Density, kcal/Serving | Nutri-Score * | HSR Score |
|---|---|---|---|---|
| NR6 | 0.44 | 0.73 | 0.33 | 0.16 |
| MP4 | −0.23 | −0.31 | −0.41 | −0.47 |
| LIM3 | 0.46 | 0.85 | 0.77 | 0.69 |
| NDC343 (1,1,1) | −0.25 | −0.35 | −0.64 | −0.74 |
| NDC343 (1,1,2) | −0.38 | −0.64 | −0.78 | −0.80 |
| NDC343 (2,1,1) | 0.00 (NS) | 0.07 | −0.39 | −0.58 |
| NDC343 (1,2,1) | −0.25 | −0.31 | −0.56 | −0.66 |
| NDC643 (1,1,1) | −0.33 | −0.53 | −0.70 | −0.75 |
| NDC643 (1,1,2) | −0.42 | −0.71 | −0.79 | −0.79 |
| NDC643 (2,1,1) | −0.16 | −0.26 | −0.57 | −0.70 |
| NDC643 (1,2,1) | −0.30 | −0.40 | −0.60 | −0.67 |
| ED kcal/100 g | 1.00 | 0.61 | 0.55 | 0.36 |
| ED kcal/serving | 0.61 | 1.00 | 0.63 | 0.54 |
| NDC Version | 1st | 2nd | 3rd | 4th | 5th | 6th | 7th | 8th | 9th |
|---|---|---|---|---|---|---|---|---|---|
| NDC643(1,1,1) | −12.54 | −7.75 | −3.50 | 0.13 | 4.83 | 10.58 | 16.75 | 22.50 | 29.25 |
| NDC643(1,1,2) | −47.92 | −36.00 | −27.63 | −20.88 | −14.96 | −8.75 | −0.50 | 8.42 | 20.46 |
| NDC643(2,1,1) | 1.33 | 7.29 | 11.33 | 15.25 | 19.67 | 24.42 | 29.83 | 35.50 | 43.00 |
| NDC643(1,2,1) | −10.50 | −5.83 | −0.58 | 7.33 | 17.50 | 28.42 | 39.33 | 47.50 | 55.25 |
| NDC Grade | 1 | 2 | 3 | 4 | 5 | 6 | 7 | 8 | 9 | 10 |
|---|---|---|---|---|---|---|---|---|---|---|
| NDC643(1,1,1) | <−15 | <−10 | <−5 | <0 | <5 | <10 | <15 | <20 | <25 | ≥25 |
| NDC643(1,1,2) | <−50 | <−40 | <−30 | <−20 | <−15 | <−10 | <0 | <10 | <20 | ≥20 |
| NDC643(2,1,1) | <0 | <5 | <10 | <15 | <20 | <25 | <30 | <35 | <40 | ≥40 |
| NDC643(1,2,1) | <−10 | <−5 | <0 | <5 | <15 | <25 | <35 | <45 | <55 | ≥55 |
| Food Description | Version | Serving (g) | Nutri-Score | HSR Star | NDC643(2,1,1) | NDC643(1,2,1) | NDC643(1,1,1) | NDC643(1,1,2) | ||||
|---|---|---|---|---|---|---|---|---|---|---|---|---|
| Score | Grade | Score | Grade | Score | Grade | Score | Grade | |||||
| Spiced chickpea and lentil | Original | 284 | C | 6 | 28.3 | 7 | 51.0 | 9 | 11.8 | 7 | −32.3 | 3 |
| Modified | 291 | B | 7 | 50.3 | 10 | 73.2 | 10 | 33.9 | 10 | 12.3 | 9 | |
| Flavored rice A | Original | 160 | C | 6 | 0.7 | 2 | −7.2 | 2 | −7.2 | 3 | −22.2 | 4 |
| Modified | 156 | C | 7 | 2.0 | 2 | −4.0 | 3 | −4.0 | 4 | −14.0 | 6 | |
| Flavored rice B | Original | 160 | C | 6 | 6.7 | 3 | −7.2 | 2 | 2.5 | 5 | −6.2 | 7 |
| Modified | 156 | C | 7 | 10.0 | 4 | −3.3 | 3 | 5.8 | 6 | 0.5 | 8 | |
| Flavored rice C | Original | 151 | C | 6 | 0.7 | 2 | −8.7 | 2 | −7.2 | 3 | −22.2 | 4 |
| Modified | 144 | C | 7 | 2.7 | 2 | −0.8 | 3 | −3.3 | 4 | −12.7 | 6 | |
| Flavored meatballs | Original | 140 | D | 6 | −11.0 | 1.0 | −16.7 | 1.0 | −16.7 | 1.0 | −39.0 | 3.0 |
| Modified 1 | 140 | D | 7 | −7.0 | 1.0 | −13.5 | 1.0 | −13.5 | 2.0 | −33.5 | 3.0 | |
| Modified 2 | 140 | D | 7 | −6.7 | 1.0 | −13.3 | 1.0 | −13.3 | 2.0 | −33.3 | 3.0 | |
| Flavored peanuts | Original | 30 | D | 3 | 6.7 | 3.0 | 9.5 | 5.0 | 2.5 | 5.0 | −6.2 | 7.0 |
| Modified | 30 | C | 5 | 10.0 | 4.0 | 12.8 | 5.0 | 5.8 | 6.0 | 0.5 | 8.0 | |
Disclaimer/Publisher’s Note: The statements, opinions and data contained in all publications are solely those of the individual author(s) and contributor(s) and not of MDPI and/or the editor(s). MDPI and/or the editor(s) disclaim responsibility for any injury to people or property resulting from any ideas, methods, instructions or products referred to in the content. |
© 2026 by the authors. Licensee MDPI, Basel, Switzerland. This article is an open access article distributed under the terms and conditions of the Creative Commons Attribution (CC BY) license.
Share and Cite
Maillot, M.; Calabretta, V.; Schulz, J.; Bonnema, A.; Drewnowski, A. Development of a Three-Component Nutrient Density Calculator (NDC) for Mixed Dishes to Guide Innovation and Reformulation of Recipes. Nutrients 2026, 18, 2282. https://doi.org/10.3390/nu18142282
Maillot M, Calabretta V, Schulz J, Bonnema A, Drewnowski A. Development of a Three-Component Nutrient Density Calculator (NDC) for Mixed Dishes to Guide Innovation and Reformulation of Recipes. Nutrients. 2026; 18(14):2282. https://doi.org/10.3390/nu18142282
Chicago/Turabian StyleMaillot, Matthieu, Veruska Calabretta, Jackie Schulz, Angela Bonnema, and Adam Drewnowski. 2026. "Development of a Three-Component Nutrient Density Calculator (NDC) for Mixed Dishes to Guide Innovation and Reformulation of Recipes" Nutrients 18, no. 14: 2282. https://doi.org/10.3390/nu18142282
APA StyleMaillot, M., Calabretta, V., Schulz, J., Bonnema, A., & Drewnowski, A. (2026). Development of a Three-Component Nutrient Density Calculator (NDC) for Mixed Dishes to Guide Innovation and Reformulation of Recipes. Nutrients, 18(14), 2282. https://doi.org/10.3390/nu18142282