Would the Removal of Voluntary Iron Fortification Put Vulnerable Populations at Risk? Modelling the Risk of Inadequate and Excess Iron Intakes in Children in Ireland


Abstract
1. Introduction
2. Materials and Methods
2.1. Study Sample
2.2. Food and Beverage Consumption Data and Estimation of Nutrient Intakes
2.3. Identification of Iron-Containing Food Supplements
2.4. Identification of Iron-Fortified Foods and Their Consumers
2.5. Identification of the Naturally Occurring Iron in Iron-Fortified Foods
2.6. Baseline Intakes and Modelling Scenarios
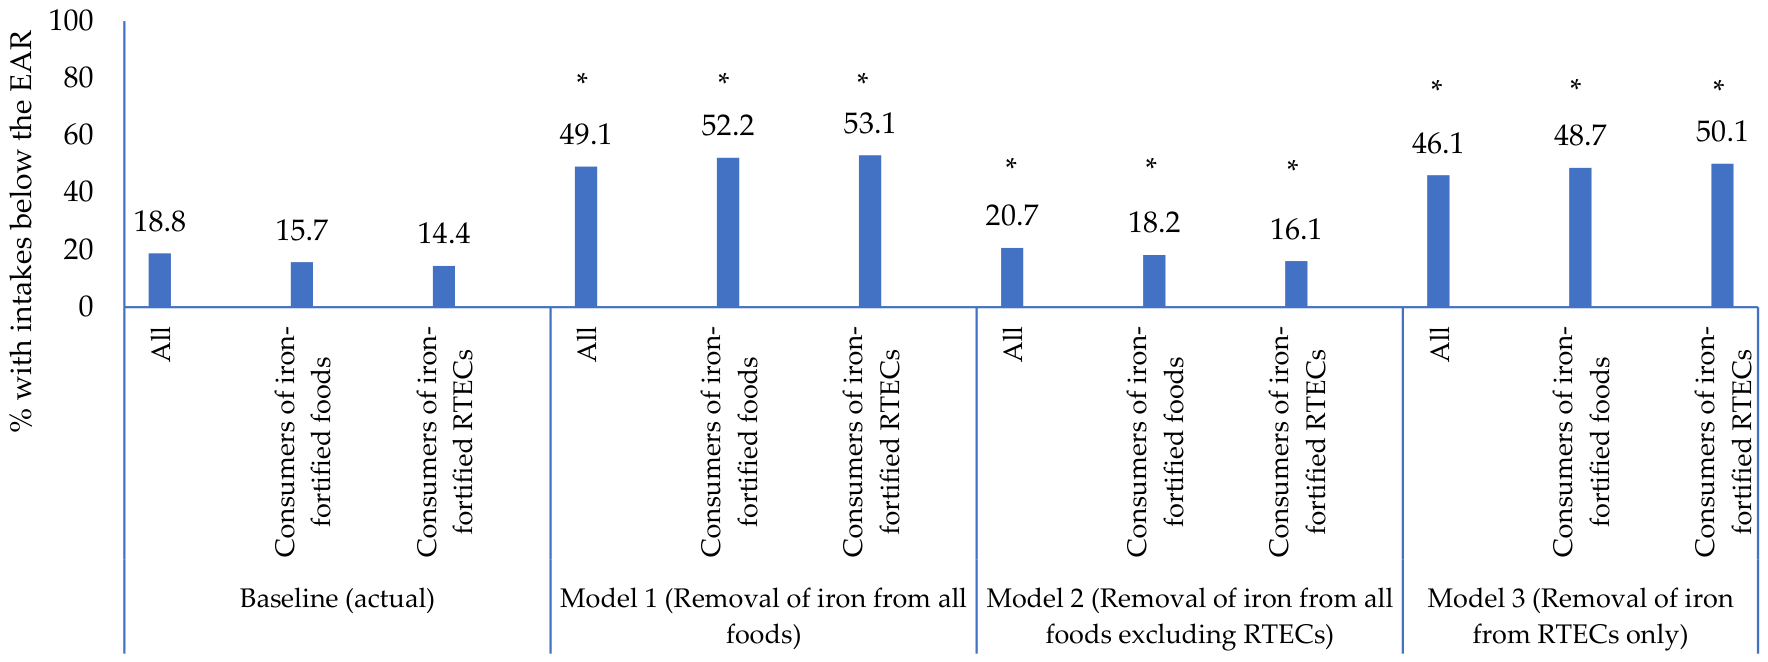
- Model 1 (FeFortFoods_all): Removal of iron fortification from all iron-fortified foods
- Model 2 (FeFortFoods_exclRTEC): Removal of iron fortification from all iron-fortified foods excluding RTECs
- Model 3 (FeFortRTEC_exclother): Removal of iron fortification from RTECs only (excluding all other iron-fortified foods)
2.7. Estimation of Usual Iron Intakes
2.8. Adequacy of Iron Intakes
2.9. Risk of Excessive Intake of Iron
2.10. Statistical Analysis
3. Results
4. Discussion
Strengths and Limitations
5. Conclusions
Author Contributions
Funding
Institutional Review Board Statement
Informed Consent Statement
Data Availability Statement
Conflicts of Interest
Abbreviations
| SMLs | Safe Maximum Levels |
| RTECs | Ready-To-Eat Cereals |
| IDA | Iron Deficiency Anaemia |
| EU | European Union |
| EC | European Commission |
| UL | Tolerable Upper Intake Level |
| EFSA | European Food Safety Authority |
| BfR | German Federal Institute for Risk Assessment |
| NCFS II | National Children’s Food Survey II |
| EAR | Estimated Average Requirement |
| SI | Safe Level Of Intake |
References
- Obeagu, E.I. Iron homeostasis and health: Understanding its role beyond blood health—A narrative review. Ann. Med. Surg. 2025, 87, 3362–3371. [Google Scholar]
- World Health Organisation (WHO). Anaemia Fact Sheet; WHO: Geneva, Switzerland, 2025; Available online: https://www.who.int/news-room/fact-sheets/detail/anaemia (accessed on 3 March 2026).
- Sukwuttichai, P.; Tidwong, N.; Chaipichit, N.; Dhippayom, T.; Dilokthornsakul, W.; Dilokthornsakul, P. Global prevalence of iron deficiency anaemia among children aged 5-12 years: A systematic review and meta-analysis. J. Glob. Health 2026, 16, 04027. [Google Scholar]
- Kehoe, L.; Buffini, M.; McNulty, B.; Kearney, J.M.; Flynn, A.; Walton, J. Food and nutrient intakes and compliance with recommendations in school-aged children in Ireland: Findings from the National Children’s Food Survey II (2017–2018) and changes since 2003–2004. Br. J. Nutr. 2022, 129, 2011–2024. [Google Scholar] [PubMed]
- Samaniego-Vaesken, M.d.L.; Partearroyo, T.; Olza, J.; Aranceta-Bartrina, J.; Gil, Á.; González-Gross, M.; Ortega, R.M.; Serra-Majem, L.; Varela-Moreiras, G. Iron Intake and Dietary Sources in the Spanish Population: Findings from the ANIBES Study. Nutrients 2017, 9, 203. [Google Scholar] [CrossRef] [Scilit] [PubMed]
- Stahl, A.; Vohmann, C.; Richter, A.; Heseker, H.; Mensink, G.B. Changes in food and nutrient intake of 6- to 17-year-old Germans between the 1980s and 2006. Public Health Nutr. 2009, 12, 1912–1923. [Google Scholar] [CrossRef] [Scilit] [PubMed]
- Bates, B.; Collins, D.; Cox, L.; Nicholson, S.; Page, P.; Roberts, C.; Steer, T.; Swan, G. National Diet and Nutrition Survey: Years 1 to 9 of the Rolling Programme (2008/2009–2016/2017): Time Trend and Income Analyses; Food Standards Agency and the Department of Health: London, UK, 2019. Available online: https://assets.publishing.service.gov.uk/government/uploads/system/uploads/attachment_data/file/772434/NDNS_UK_Y1-9_report.pdf (accessed on 3 March 2026).
- Bates, B.; Collins, D.; Jones, K.; Page, P.; Roberts, C.; Steer, T.; Swan, G. National Diet and Nutrition Survey: Rolling Programme Years 9 to 11 (2016/2017 to 2018/2019); Food Standards Agency and the Department of Health: London, UK, 2020. Available online: https://assets.publishing.service.gov.uk/government/uploads/system/uploads/attachment_data/file/943114/NDNS_UK_Y9-11_report.pdf (accessed on 3 March 2026).
- Lopes, C.; Torres, D.; Oliveira, A.; Severo, M.; Alarcao, V.; Guiomar, S.; Mota, J.; Teixeira, P.; Rodrigues, S.; Liliane, L.; et al. National Food and Physical Activity Survey (IAN-AF) Part II; University of Porto: Porto, Portugal, 2017; Available online: https://www.ian-af.up.pt/en (accessed on 3 March 2026).
- Bird, J.K.; Barron, R.; Pigat, S.; Bruins, M.J. Contribution of base diet, voluntary fortified foods and supplements to micronutrient intakes in the UK. J. Nutr. Sci. 2022, 11, e51. [Google Scholar] [CrossRef] [Scilit] [PubMed]
- Berner, L.A.; Keast, D.R.; Bailey, R.L.; Dwyer, J.T. Fortified Foods Are Major Contributors to Nutrient Intakes in Diets of US Children and Adolescents. J. Acad. Nutr. Diet. 2014, 114, 1009–1022.e8. [Google Scholar] [CrossRef] [Scilit] [PubMed]
- de Jong, M.H.; Nawijn, E.L.; Verkaik-Kloosterman, J. Contribution of voluntary fortified foods to micronutrient intake in The Netherlands. Eur. J. Nutr. 2022, 61, 1649–1663. [Google Scholar] [CrossRef] [Scilit] [PubMed]
- Walsh, N.; Walton, J.; Buffini, M.; Kearney, J.M.; McNulty, B.A.; Flynn, A.; Kehoe, L. Characterising the fortified foods consumed by school-aged children (5–12y) in Ireland. Proc. Nutr. Soc. 2021, 80, E174. [Google Scholar] [CrossRef] [Scilit]
- EC. Regulation (EC) No. 1925/2006 of the European Parliament and of the Council of 20 December 2006. Off. J. Eur. Union 2006, L404, 26–38. [Google Scholar]
- Flynn, A.; Moreiras, O.; Stehle, P.; Fletcher, R.J.; Müller, D.J.; Rolland, V. Vitamins and minerals: A model for safe addition to foods. Eur. J. Nutr. 2003, 42, 118–130. [Google Scholar] [CrossRef] [Scilit] [PubMed]
- Kloosterman, J.; Fransen, H.P.; de Stoppelaar, J.; Verhagen, H.; Rompelberg, C. Safe addition of vitamins and minerals to foods: Setting maximum levels for fortification in the Netherlands. Eur. J. Nutr. 2007, 46, 220–229. [Google Scholar] [CrossRef] [Scilit] [PubMed]
- Rasmussen, S.E.; Andersen, N.L.; Dragsted, L.O.; Larsen, J.C. A safe strategy for addition of vitamins and minerals to foods. Eur. J. Nutr. 2006, 45, 123–135. [Google Scholar] [PubMed]
- Dufour, A.; Wetzler, S.; Touvier, M.; Lioret, S.; Gioda, J.; Lafay, L.; Dubuisson, C.; Calamassi-Tran, G.; Kalonji, E.; Margaritis, I.; et al. Comparison of different maximum safe levels in fortified foods and supplements using a probabilistic risk assessment approach. Br. J. Nutr. 2010, 104, 1848–1857. [Google Scholar] [CrossRef] [Scilit] [PubMed]
- Flynn, A.; Kehoe, L.; Hennessy, Á.; Walton, J. Estimating safe maximum levels of vitamins and minerals in fortified foods and food supplements. Eur. J. Nutr. 2017, 56, 2529–2539. [Google Scholar] [PubMed]
- Eurofins. Update: Planned EU Maximum Levels for Vitamins, Minerals and Trace Elements. Available online: https://www.eurofins.de/food-analysis/food-news/food-testing-news/planned-eu-maximum-levels-for-vitamins-minerals-and-trace-elements/ (accessed on 3 March 2026).
- EFSA Panel on Nutrition, Novel Foods and Food Allergens (NDA); Turck, D.; Bohn, T.; Castenmiller, J.; de Henauw, S.; Hirsch-Ernst, K.-I.; Knutsen, H.K.; Maciuk, A.; Mangelsdorf, I.; McArdle, H.J.; et al. Scientific opinion on the tolerable upper intake level for iron. EFSA J. 2024, 22, e8819. [Google Scholar] [CrossRef] [Scilit] [PubMed]
- BfR. Updated Recommended Maximum Levels for the Addition of Vitamins and Minerals to Food Supplements and Conventional Foods. 2021. Available online: https://www.bfr.bund.de/en/opinions/updated-recommended-maximum-levels-for-the-addition-of-vitamins-and-minerals-to-food-supplements-and-conventional-foods/ (accessed on 3 March 2026).
- Irish Universities Nutrition Alliance (IUNA). The National Teens’ Food Survey II (NTFS II) Summary Report; IUNA: Cork, Ireland, 2021; Available online: https://www.iuna.net/surveyreports (accessed on 3 March 2026).
- Irish Universities Nutrition Alliance (IUNA). The Adult Nutrition Survey II (NANS II) Summary Report; IUNA: Cork, Ireland, 2024; Available online: https://www.iuna.net/surveyreports (accessed on 3 March 2026).
- Irish Universities Nutrition Alliance (IUNA). The National Children’s Food Survey II (NCFS II) Main Report. 2020. Available online: https://www.iuna.net/surveyreports (accessed on 3 March 2026).
- Central Statistics Office. Census 2016 Summary Results—Part 1; Central Statistics Office: Dublin, Ireland, 2017. [Google Scholar]
- Foster, E.; Hawkins, A.; Adamson, A. Young Person’s Food Atlas: Primary School; Food Standards Agency: London, UK, 2010.
- Ministry of Agriculture Fisheries and Food. Food Portion Sizes; The Stationary Office: London, UK, 1997. [Google Scholar]
- Lyons, J.; Giltinan, M. The Irish Food Portion Sizes Database, First Edition. 2013. Available online: www.iuna.net (accessed on 3 March 2026).
- Public Health England. McCance and Widdowson’s the Composition of Foods, 7th ed.; Royal Society of Chemistry: Cambridge, UK, 2015. [Google Scholar]
- Food Standards Agency. McCance and Widdowson’s the Composition of Foods, 6th ed.; Royal Society of Chemistry: Cambridge, UK, 2002. [Google Scholar]
- Black, L.J.; Walton, J.; Flynn, A.; Kiely, M. Adequacy of vitamin D intakes in children and teenagers from the base diet, fortified foods and supplements. Public Health Nutr. 2014, 17, 721–731. [Google Scholar] [PubMed]
- Hennessy, Á.; Browne, F.; Kiely, M.; Walton, J.; Flynn, A. The role of fortified foods and nutritional supplements in increasing vitamin D intake in Irish preschool children. Eur. J. Nutr. 2016, 56, 1219–1231. [Google Scholar] [CrossRef] [Scilit] [PubMed]
- Hennessy, Á.; Hannon, E.M.; Walton, J.; Flynn, A. Impact of voluntary food fortification practices in Ireland: Trends in nutrient intakes in Irish adults between 1997–1999 and 2008–2010. Br. J. Nutr. 2015, 113, 310–320. [Google Scholar] [PubMed]
- Hopkins, S.M.; Gibney, M.J.; Nugent, A.P.; McNulty, H.; Molloy, A.M.; Scott, J.M.; Flynn, A.; Strain, J.; Ward, M.; Walton, J.; et al. Impact of voluntary fortification and supplement use on dietary intakes and biomarker status of folate and vitamin B-12 in Irish adults. Am. J. Clin. Nutr. 2015, 101, 1163–1172. [Google Scholar] [CrossRef] [Scilit] [PubMed]
- Tooze, J.A.; Kipnis, V.; Buckman, D.W.; Carroll, R.J.; Freedman, L.S.; Guenther, P.M.; Krebs-Smith, S.M.; Subar, A.F.; Dodd, K.W. A mixed-effects model approach for estimating the distribution of usual intake of nutrients: The NCI method. Stat. Med. 2010, 29, 2857–2868. [Google Scholar] [PubMed]
- EFSA Panel on Dietetic Products Nutrition and Allergies. Scientific Opinion on Dietary Reference Values for iron. EFSA J. 2015, 13, 4254.
- EFSA Panel on Dietetic Products Nutrition and Allergies. Scientific Opinion on principles for deriving and applying Dietary Reference Values. EFSA J. 2010, 8, 1458.
- de Lauzon, B.; Volatier, J.; Martin, A. A Monte Carlo simulation to validate the EAR cut-point method for assessing the prevalence of nutrient inadequacy at the population level. Public Health Nutr. 2004, 7, 893–900. [Google Scholar] [CrossRef] [Scilit] [PubMed]
- Carriquiry, A.L. Assessing the prevalence of nutrient inadequacy. Public Health Nutr. 1999, 2, 23–34. [Google Scholar] [CrossRef] [Scilit] [PubMed]
- Goldberg, G.; Black, A.; Jebb, S.; Cole, T.; Murgatroyd, P.; Coward, W.; Prentice, A. Critical evaluation of energy intake data using fundamental principles of energy physiology: 1. Derivation of cut-off limits to identify under-recording. Eur. J. Clin. Nutr. 1991, 45, 569–581. [Google Scholar] [PubMed]
- Black, A.E. Critical evaluation of energy intake using the Goldberg cut-off for energy intake:basal metabolic rate. A practical guide to its calculation, use and limitations. Int. J. Obes. 2000, 24, 1119–1130. [Google Scholar] [CrossRef] [Scilit]
- Schofield, W.N. Predicting basal metabolic rate, new standards and review of previous work. Hum. Nutr. Clin. Nutr. 1985, 39, 5–41. [Google Scholar] [PubMed]
- European Food Safety Authority. Dietary Reference Values for nutrients Summary report. EFSA Support. Publ. 2017, 14, e15121E. [Google Scholar] [CrossRef] [Scilit]
- EFSA Panel on Dietetic Products Nutrition and Allergies. Tolerable Upper Intake Levels for Vitamins and Minerals; EFSA: Parma, Italy, 2006; Available online: https://www.efsa.europa.eu/sites/default/files/efsa_rep/blobserver_assets/ndatolerableuil.pdf (accessed on 3 March 2026).
- Fagerland, M.W. t-tests, non-parametric tests, and large studies—A paradox of statistical practice? BMC Med. Res. Methodol. 2012, 12, 78. [Google Scholar] [PubMed]
- Moschonis, G.; Papandreou, D.; Mavrogianni, C.; Giannopoulou, A.; Damianidi, L.; Malindretos, P.; Lionis, C.; Chrousos, G.P.; Manios, Y. Association of Iron Depletion with Menstruation and Dietary Intake Indices in Pubertal Girls: The Healthy Growth Study. BioMed Res. Int. 2013, 2013, 423263. [Google Scholar] [CrossRef] [Scilit] [PubMed]
- Smith, J.D.; Jain, N.; Bailey, R.L. Ready-to-eat cereal fortification: A modelling study on the impact of changing ready-to-eat cereal fortification levels on population intake of nutrients. Public Health Nutr. 2020, 23, 2165–2178. [Google Scholar] [PubMed]
- Willett, W.; Rockström, J.; Loken, B.; Springmann, M.; Lang, T.; Vermeulen, S.; Garnett, T.; Tilman, D.; DeClerck, F.; Wood, A.; et al. Food in the Anthropocene: The EAT Lancet Commission on healthy diets from sustainable food systems. Lancet 2019, 393, 447–492. [Google Scholar] [CrossRef] [Scilit] [PubMed]
- Rockström, J.; Thilsted, S.H.; Willett, W.C.; Gordon, L.J.; Herrero, M.; Hicks, C.C.; Mason-D’Croz, D.; Rao, N.; Springmann, M.; Wright, E.C.; et al. The EAT Lancet Commission on healthy, sustainable, and just food systems. Lancet 2025, 406, 1625–1700. [Google Scholar] [CrossRef] [Scilit] [PubMed]
- Irish Universities Nutrition Alliance (IUNA). The National Adult Nutrition Survey II (NANS II) Main Report. 2024. Available online: https://www.iuna.net/surveyreports (accessed on 3 March 2026).
- Irish Universities Nutrition Alliance (IUNA). The National Teens’ Food Survey II (NTFS II) Main Report. 2021. Available online: https://www.iuna.net/surveyreports (accessed on 3 March 2026).
- Bird, J.K.; Bruins, M.J.; Turini, M.E. Micronutrient intakes in the Dutch diet: Foods, fortified foods and supplements in a cross sectional study. Eur. J. Nutr. 2023, 62, 3161–3179. [Google Scholar] [CrossRef] [Scilit] [PubMed]
- Bailey, A.D.L.; Miketinas, D.C.; London, H.E.; Houslay, T.; Bender, T.M.; Patterson, A.C. Usual Nutrient Intake Adequacy and Nutritional Status of US Children and Adolescents: NHANES 2001-March 2020. J. Nutr. 2026, 156, 101377. [Google Scholar] [PubMed]
- Irish Universities Nutrition Alliance. National Pre-School Nutrition Survey. Summary Report; IUNA: Cork, Ireland, 2012; Available online: www.iuna.net (accessed on 3 March 2026).
- Derbyshire, E.J.; Ruxton, C.H.S. A Systematic Review of Evidence on the Role of Ready-to-Eat Cereals in Diet and Non-Communicable Disease Prevention. Nutrients 2025, 17, 1680. [Google Scholar] [PubMed]
- Sanders, L.M.; Zhu, Y.; Jain, N.; Normington, J.; Holschuh, N.; Nechanicky, M.; Tucker, M.; Garcia-Bailo, B. Ready-to-eat cereal consumption is associated with improved nutrient intakes and diet quality in Canadian adults and children across income levels. Front Nutr. 2023, 10, 1282252. [Google Scholar] [PubMed]
- Smith, J.D.; Zhu, Y.; Vanage, V.; Jain, N.; Holschuh, N.; Hermetet Agler, A. Association between Ready-to-Eat Cereal Consumption and Nutrient Intake, Nutritional Adequacy, and Diet Quality among Infants, Toddlers, and Children in the National Health and Nutrition Examination Survey 2015–2016. Nutrients 2019, 11, 1989. [Google Scholar] [PubMed]
- Powers, H.J.; Stephens, M.; Russell, J.; Hill, M.H. Fortified breakfast cereal consumed daily for 12 wk leads to a significant improvement in micronutrient intake and micronutrient status in adolescent girls: A randomised controlled trial. Nutr. J. 2016, 15, 69. [Google Scholar] [PubMed]
- Smith, J.; Jain, N.; Normington, J.; Holschuh, N.; Zhu, Y. Associations of Ready-to-Eat Cereal Consumption and Income with Dietary Outcomes: Results from the National Health and Nutrition Examination Survey 2015–2018. Front Nutr. 2022, 9, 816548. [Google Scholar] [PubMed]
- Michels, N.; De Henauw, S.; Breidenassel, C.; Censi, L.; Cuenca-Garcí, M.; Gonzalez-Gross, M.; Gottrand, F.; Hallstrom, L.; Kafatos, A.; Kersting, M.; et al. European adolescent ready-to-eat-cereal (RTEC) consumers have a healthier dietary intake and body composition compared with non-RTEC consumers. Eur. J. Nutr. 2015, 54, 653–664. [Google Scholar] [PubMed]
- Sanders, L.M.; Dicklin, M.R.; Zhu, Y.; Maki, K.C. The Impact of Ready-to-Eat Cereal Intake on Body Weight and Body Composition in Children and Adolescents: A Systematic Review of Observational Studies and Controlled Trials. Adv. Nutr. 2023, 14, 161–172. [Google Scholar] [PubMed]
- Michels, N.; De Henauw, S.; Beghin, L.; Cuenca-García, M.; Gonzalez-Gross, M.; Hallstrom, L.; Kafatos, A.; Kersting, M.; Manios, Y.; Marcos, A.; et al. Ready-to-eat cereals improve nutrient, milk and fruit intake at breakfast in European adolescents. Eur. J. Nutr. 2016, 55, 771–779. [Google Scholar] [PubMed]
- Fayet-Moore, F.; McConnell, A.; Cassettari, T.; Petocz, P. Breakfast Choice Is Associated with Nutrient, Food Group and Discretionary Intakes in Australian Adults at Both Breakfast and the Rest of the Day. Nutrients 2019, 11, 175. [Google Scholar] [CrossRef] [Scilit] [PubMed]


| Baseline (Actual) | Model 1 (Removal of Iron from All Foods) | Model 2 (Removal of Iron from All Foods Excluding RTECs) | Model 3 (Removal of Iron from RTECs Only) | |||||||||
|---|---|---|---|---|---|---|---|---|---|---|---|---|
| All | Consumers of Iron-Fortified Foods | Consumers of Iron-Fortified RTECs | All | Consumers of Iron-Fortified Foods | Consumers of Iron-Fortified RTECs | All | Consumers of Iron-Fortified Foods | Consumers of Iron-Fortified RTECs | All | Consumers of Iron-Fortified Foods | Consumers of Iron-Fortified RTECs | |
| n 600 | n 493 | n 466 | n 600 | n 493 | n 466 | n 600 | n 493 | n 466 | n 600 | n 493 | n 466 | |
| mg/d | ||||||||||||
| All sources † | ||||||||||||
| Mean | 9.0 | 9.5 | 9.5 | 7.0 * | 6.9 * | 6.9 * | 8.9 * | 9.3 * | 9.4 * | 7.1 * | 7.1 * | 7.0 * |
| SD | 2.4 | 2.3 | 2.3 | 1.8 | 1.7 | 1.7 | 2.4 | 2.4 | 2.3 | 1.8 | 1.7 | 1.7 |
| P5 | 5.5 | 6.1 | 6.2 | 4.4 | 4.4 | 4.5 | 5.4 | 5.9 | 6.0 | 4.6 | 4.6 | 4.6 |
| P25 | 7.3 | 7.8 | 7.9 | 5.7 | 5.7 | 5.7 | 7.2 | 7.6 | 7.7 | 5.8 | 5.9 | 5.8 |
| P50 | 8.8 | 9.2 | 9.3 | 6.8 | 6.7 | 6.7 | 8.6 | 9.0 | 9.1 | 6.9 | 6.9 | 6.8 |
| P75 | 10.5 | 10.9 | 10.9 | 8.0 | 7.9 | 7.9 | 10.3 | 10.7 | 10.7 | 8.2 | 8.1 | 8.0 |
| P95 | 13.5 | 13.7 | 13.6 | 10.2 | 10.0 | 9.9 | 13.3 | 13.5 | 13.5 | 10.4 | 10.2 | 10.0 |
| % | ||||||||||||
| % < EAR [37] ‡ | 18.8 | 15.7 | 14.4 | 49.1 * | 52.2 * | 53.1 * | 20.7 * | 18.2 * | 16.1 * | 46.1 * | 48.7 * | 50.1 * |
| % > SI [21] | 0.2 | 0.2 | 0.2 | 0.0* | 0.0* | 0.0 * | 0.1 * | 0.2 * | 0.1 * | 0.0 * | 0.0 * | 0.0 * |
| mg/d | ||||||||||||
| Food sources † | ||||||||||||
| Mean | 8.8 | 9.2 | 9.2 | 6.7 * | 6.6 * | 6.6 * | 8.6 * | 9.0 * | 9.1 * | 6.8 * | 6.8 * | 6.8 * |
| SD | 2.2 | 2.1 | 2.1 | 1.5 | 1.4 | 1.4 | 2.2 | 2.2 | 2.1 | 1.5 | 1.4 | 1.4 |
| P5 | 5.5 | 6.1 | 6.2 | 4.6 | 4.6 | 4.6 | 5.4 | 5.9 | 6.1 | 4.7 | 4.7 | 4.7 |
| P25 | 7.2 | 7.7 | 7.8 | 5.7 | 5.6 | 5.6 | 7.0 | 7.5 | 7.6 | 5.8 | 5.8 | 5.8 |
| P50 | 8.5 | 9.0 | 9.0 | 6.6 | 6.5 | 6.5 | 8.4 | 8.8 | 8.9 | 6.7 | 6.7 | 6.6 |
| P75 | 10.1 | 10.5 | 10.5 | 7.6 | 7.5 | 7.4 | 9.9 | 10.3 | 10.4 | 7.8 | 7.7 | 7.6 |
| P95 | 12.8 | 13.0 | 13.0 | 9.3 | 9.2 | 9.1 | 12.6 | 12.9 | 12.9 | 9.5 | 9.4 | 9.2 |
| % | ||||||||||||
| % < EAR [37] ‡ | 20.5 | 17.2 | 15.6 | 54.0 * | 57.2 * | 57.6 * | 22.9 * | 19.8 * | 17.6 * | 50.8 * | 53.2 * | 54.6 |
| % > SI [21] | 0.1 | 0.1 | 0.1 | 0.0 * | 0.0 * | 0.0 | 0.0 * | 0.1 * | 0.0 * | 0.0 * | 0.0 * | 0.0 * |
| Baseline (Actual) | Model 1 (Removal of Iron from All Foods) | Model 2 (Removal of Iron from All Foods Excluding RTEC) | Model 3 (Removal of Iron from RTEC Only) | |||||||||||||||||||||
|---|---|---|---|---|---|---|---|---|---|---|---|---|---|---|---|---|---|---|---|---|---|---|---|---|
| All | Consumers of Iron-Fortified Foods | Consumers of Iron-Fortified RTECs | All | Consumers of Iron-Fortified Foods | Consumers of Iron-Fortified RTECs | All | Consumers of Iron-Fortified Foods | Consumers of Iron-Fortified RTECs | All | Consumers of Iron-Fortified Foods | Consumers of Iron-Fortified RTECs | |||||||||||||
| M | F | M | F | M | F | M | F | M | F | M | F | M | F | M | F | M | F | M | F | M | F | M | F | |
| n 300 | n 300 | n 244 | n 249 | n 230 | n 236 | n 300 | n 300 | n 244 | n 249 | n 230 | n 236 | n 300 | n 300 | n 244 | n 249 | n 230 | n 236 | n 300 | n 300 | n 244 | n 249 | n 230 | n 236 | |
| mg/d | ||||||||||||||||||||||||
| All sources † | ||||||||||||||||||||||||
| Mean | 9.8 | 8.4 * | 10.2 | 8.8 * | 10.2 | 8.9 * | 7.5 | 6.5 * | 7.4 | 6.4 * | 7.3 | 6.4 * | 9.6 | 8.2 * | 10.0 | 8.6 * | 10.1 | 8.7 * | 7.7 | 6.6 * | 7.6 | 6.6 * | 7.5 | 6.6 * |
| SD | 2.5 | 2.1 | 2.4 | 2.0 | 2.4 | 2.0 | 1.9 | 1.5 | 1.8 | 1.5 | 1.8 | 1.4 | 2.5 | 2.1 | 2.5 | 2.0 | 2.4 | 2.0 | 1.9 | 1.5 | 1.8 | 1.5 | 1.8 | 1.5 |
| P5 | 6.1 | 5.2 | 6.6 | 5.8 | 6.6 | 5.9 | 4.8 | 4.2 | 4.8 | 4.2 | 4.8 | 4.3 | 5.9 | 5.1 | 6.3 | 5.6 | 6.5 | 5.8 | 5.0 | 4.3 | 4.9 | 4.4 | 4.9 | 4.4 |
| P25 | 8.0 | 6.8 | 8.5 | 7.4 | 8.5 | 7.5 | 6.2 | 5.4 | 6.1 | 5.4 | 6.1 | 5.4 | 7.8 | 6.7 | 8.2 | 7.2 | 8.3 | 7.3 | 6.4 | 5.5 | 6.3 | 5.5 | 6.2 | 5.6 |
| P50 | 9.6 | 8.2 | 10.0 | 8.6 | 10.0 | 8.7 | 7.3 | 6.3 | 7.2 | 6.3 | 7.1 | 6.3 | 9.4 | 8.0 | 9.8 | 8.4 | 9.8 | 8.6 | 7.5 | 6.5 | 7.5 | 6.5 | 7.3 | 6.5 |
| P75 | 11.3 | 9.7 | 11.7 | 10.0 | 11.7 | 10.1 | 8.7 | 7.4 | 8.6 | 7.3 | 8.4 | 7.3 | 11.2 | 9.5 | 11.6 | 9.8 | 11.6 | 10.0 | 8.8 | 7.5 | 8.7 | 7.5 | 8.6 | 7.5 |
| P95 | 14.3 | 12.2 | 14.6 | 12.3 | 14.5 | 12.4 | 10.8 | 9.2 | 10.7 | 9.0 | 10.5 | 9.0 | 14.1 | 12.0 | 14.5 | 12.1 | 14.4 | 12.2 | 11.0 | 9.4 | 10.9 | 9.2 | 10.6 | 9.2 |
| % | ||||||||||||||||||||||||
| % < EAR [37] ‡ | 11.9 | 25.1 * | 9.2 | 21.5 * | 8.9 | 19.3 * | 39.4 | 58.0 * | 42.2 | 61.2 * | 44.1 | 61.2 * | 13.2 | 27.5 * | 11.2 | 24.6 * | 10.1 | 21.7 * | 36.5 | 54.9 * | 38.9 | 57.6 * | 41.4 | 57.9 * |
| % > SI [21] | 0.3 | 0.1 * | 0.3 | 0.1 * | 0.3 | 0.1 * | 0.0 | 0.0 | 0.0 | 0.0 | 0.0 | 0.0 | 0.2 | 0.1 * | 0.3 | 0.0 * | 0.2 | 0.0 * | 0.0 | 0.0 | 0.0 | 0.0 | 0.0 | 0.0 |
| mg/d | ||||||||||||||||||||||||
| Food sources † | ||||||||||||||||||||||||
| Mean | 9.4 | 8.2 * | 9.8 | 8.6 * | 9.9 | 8.7 * | 7.2 | 6.3 * | 7.1 | 6.2 * | 7.0 | 6.2 * | 9.3 | 8.0 * | 9.6 | 8.4 * | 9.7 | 8.5 * | 7.3 | 6.4 * | 7.3 | 6.4 * | 7.1 | 6.4 * |
| SD | 2.3 | 1.9 | 2.3 | 1.8 | 2.2 | 1.8 | 1.5 | 1.2 | 1.5 | 1.2 | 1.4 | 1.2 | 2.3 | 1.9 | 2.3 | 1.8 | 2.2 | 1.8 | 1.5 | 1.3 | 1.5 | 1.2 | 1.4 | 1.2 |
| P5 | 6.0 | 5.3 | 6.5 | 5.8 | 6.6 | 5.9 | 4.9 | 4.4 | 4.8 | 4.4 | 4.8 | 4.5 | 5.9 | 5.2 | 6.2 | 5.6 | 6.4 | 5.8 | 5.0 | 4.5 | 5.0 | 4.5 | 5.0 | 4.6 |
| P25 | 7.8 | 6.8 | 8.2 | 7.3 | 8.3 | 7.4 | 6.1 | 5.4 | 6.0 | 5.4 | 5.9 | 5.4 | 7.6 | 6.6 | 8.0 | 7.1 | 8.1 | 7.3 | 6.2 | 5.5 | 6.2 | 5.5 | 6.1 | 5.6 |
| P50 | 9.2 | 8.0 | 9.6 | 8.5 | 9.7 | 8.5 | 7.0 | 6.2 | 6.9 | 6.1 | 6.8 | 6.1 | 9.1 | 7.8 | 9.4 | 8.3 | 9.5 | 8.4 | 7.2 | 6.3 | 7.1 | 6.3 | 7.0 | 6.3 |
| P75 | 10.8 | 9.3 | 11.3 | 9.8 | 11.2 | 9.8 | 8.1 | 7.0 | 8.0 | 7.0 | 7.9 | 7.0 | 10.7 | 9.2 | 11.1 | 9.6 | 11.1 | 9.7 | 8.3 | 7.2 | 8.2 | 7.2 | 8.1 | 7.1 |
| P95 | 13.5 | 11.6 | 13.9 | 11.8 | 13.8 | 11.9 | 9.9 | 8.4 | 9.8 | 8.3 | 9.6 | 8.3 | 13.4 | 11.4 | 13.8 | 11.6 | 13.6 | 11.7 | 10.1 | 8.6 | 10.0 | 8.6 | 9.7 | 8.5 |
| % | ||||||||||||||||||||||||
| % < EAR [37] ‡ | 13.1 | 27.3 * | 10.6 | 23.2 * | 9.7 | 20.9 * | 44.2 | 63.0 * | 47.3 | 66.2 * | 48.7 | 65.7 * | 14.8 | 30.2 * | 12.6 | 26.5 * | 11.1 | 23.4 * | 41.2 | 59.6 * | 43.5 | 62.0 * | 46.0 | 62.4 * |
| % > SI [21] | 0.1 | 0.0 * | 0.1 | 0.0 * | 0.1 | 0.0 * | 0.0 | 0.0 | 0.0 | 0.0 | 0.0 | 0.0 | 0.1 | 0.0 * | 0.1 | 0.0 * | 0.1 | 0.0 * | 0.0 | 0.0 | 0.0 | 0.0 | 0.0 | 0.0 |
Disclaimer/Publisher’s Note: The statements, opinions and data contained in all publications are solely those of the individual author(s) and contributor(s) and not of MDPI and/or the editor(s). MDPI and/or the editor(s) disclaim responsibility for any injury to people or property resulting from any ideas, methods, instructions or products referred to in the content. |
© 2026 by the authors. Licensee MDPI, Basel, Switzerland. This article is an open access article distributed under the terms and conditions of the Creative Commons Attribution (CC BY) license.
Share and Cite
Kehoe, L.; Walton, J. Would the Removal of Voluntary Iron Fortification Put Vulnerable Populations at Risk? Modelling the Risk of Inadequate and Excess Iron Intakes in Children in Ireland. Nutrients 2026, 18, 2144. https://doi.org/10.3390/nu18132144
Kehoe L, Walton J. Would the Removal of Voluntary Iron Fortification Put Vulnerable Populations at Risk? Modelling the Risk of Inadequate and Excess Iron Intakes in Children in Ireland. Nutrients. 2026; 18(13):2144. https://doi.org/10.3390/nu18132144
Chicago/Turabian StyleKehoe, Laura, and Janette Walton. 2026. "Would the Removal of Voluntary Iron Fortification Put Vulnerable Populations at Risk? Modelling the Risk of Inadequate and Excess Iron Intakes in Children in Ireland" Nutrients 18, no. 13: 2144. https://doi.org/10.3390/nu18132144
APA StyleKehoe, L., & Walton, J. (2026). Would the Removal of Voluntary Iron Fortification Put Vulnerable Populations at Risk? Modelling the Risk of Inadequate and Excess Iron Intakes in Children in Ireland. Nutrients, 18(13), 2144. https://doi.org/10.3390/nu18132144