1. Introduction
Type 2 diabetes (T2D) is a chronic metabolic disorder characterized by insulin resistance and impaired insulin secretion, leading to persistent hyperglycemia. It is associated with a range of complications, including cardiovascular disease, neuropathy, and retinopathy, all of which significantly impact quality of life and reduce life expectancy. One of the less recognized but increasingly prevalent complications of T2D is sarcopenia, a condition defined by the progressive loss of muscle mass and strength. Sarcopenia in T2D patients is particularly concerning, as it not only contributes to physical disability and frailty but also worsens the overall prognosis of T2D, creating a vicious cycle of deteriorating metabolic and muscular health [
1]. The development of sarcopenia in T2D is driven by several factors, primarily metabolic dysregulation, chronic low-grade inflammation, and oxidative stress. Elevated blood glucose and insulin resistance interfere with muscle protein synthesis and promote protein degradation, contributing to muscle atrophy [
2]. Additionally, increased levels of free fatty acids (FFAs) are known to induce lipotoxicity, where excess lipids accumulate in muscle cells as lipid droplets [
3]. This accumulation disrupts cellular functions, impairs muscle regeneration, and exacerbates muscle damage. Studies have shown that lipotoxicity, driven by both elevated glucose and FFA levels, accelerates muscle wasting and impairs the regenerative capacity of muscle fibers, leading to further dysfunction [
4]. This metabolic and lipotoxic cascade perpetuates muscle wasting, complicating T2D and sarcopenia management. Moreover, the activation of catabolic signaling pathways, such as the ubiquitin–proteasome system, is a hallmark of muscle wasting in T2D [
5]. This pathway is regulated by key muscle-specific atrophy markers like atrogin-1 and muscle ring finger-1 (MuRF1), which mediate the breakdown of muscle proteins in response to metabolic stress [
6]. The increased expression of these markers in T2D patients underscores their role in muscle wasting and highlights them as potential therapeutic targets. In addition, markers of muscle differentiation, such as myogenin, myogenic differentiation factor (MyoD), and myosin heavy chain (MyHC), are critical for maintaining muscle integrity. Myogenin and MyoD are essential transcription factors involved in muscle cell differentiation, while MyHC is a structural protein that plays a central role in muscle contractility. Alterations in the expression of these proteins, especially under lipotoxic stress, can significantly impair muscle regeneration and contribute to the progression of sarcopenia [
7,
8].
GLP-1 receptor agonists (GLP-1 RAs), such as liraglutide, have become widely used therapeutic agents for T2D in recent years due to their multiple benefits in managing blood glucose levels and supporting weight loss. Clinical studies have shown that liraglutide not only improves insulin sensitivity but also significantly reduces both body weight and body fat, representing an effective approach for improving the metabolic dysregulation seen in T2D [
9]. However, despite its effectiveness, liraglutide has potential drawbacks. Although it facilitates weight loss, it can lead to muscle mass loss, particularly in patients already at risk of sarcopenia. This is concerning because sarcopenia worsens both metabolic and physical health outcomes in T2D patients [
10]. This effect is exacerbated by elevated FFA levels in T2D, which lead to lipotoxicity, a condition characterized by the accumulation of excessive fat in muscle cells, thereby disrupting their function and regeneration [
11]. To counteract the potential unfavorable effects of GLP-1 RAs on muscle mass, β-hydroxy-β-methylbutyrate (HMB) has gained attention as a potential muscle-preserving supplement. HMB is a metabolite of the branched-chain amino acid leucine, which plays a critical role in reducing muscle protein breakdown while promoting muscle protein synthesis. This dual action helps mitigate muscle loss in conditions of metabolic stress, such as T2D [
12]. In particular, HMB has shown significant promise in combating sarcopenia in individuals with T2D, a population that is particularly vulnerable due to the combined effects of insulin resistance, chronic inflammation, and lipotoxicity [
13]. By inhibiting the activity of catabolic pathways like the ubiquitin–proteasome system, which is often upregulated in response to metabolic stress, HMB can reduce the breakdown of muscle proteins and enhance muscle regeneration [
14]. Moreover, HMB has been found to stimulate the expression of myogenic markers such as myogenin and MyoD, which are critical for muscle differentiation and regeneration [
15]. In T2D patients, where muscle regeneration is impaired by factors like elevated FFAs and insulin resistance, HMB supports the restoration of normal muscle function by promoting muscle protein synthesis. Additionally, HMB can reduce the accumulation of reactive oxygen species (ROS) that is commonly seen in sarcopenia and metabolic diseases, which further contributes to muscle cell damage [
16]. This antioxidant effect helps preserve muscle integrity by mitigating oxidative stress, a key player in the progression of sarcopenia in T2D.
However, whether HMB can serve as a muscle-preserving adjunct during liraglutide treatment under diabetic lipotoxic stress remains unknown. This question is clinically relevant because recent evidence has highlighted protein supplementation, resistance training, creatine, and HMB as potential strategies to support lean mass preservation during GLP-1 RA-associated weight loss [
17]. Therefore, this study aimed to investigate the combined effects of liraglutide and HMB on lipotoxic and atrophic alterations in differentiated C2C12 myotubes exposed to high glucose and free fatty acids. The translational relevance of this study lies in its potential to support future combination strategies aimed at preserving skeletal muscle integrity while maintaining the metabolic benefits of GLP-1 receptor agonist therapy in patients vulnerable to sarcopenia.
2. Materials and Methods
2.1. Chemicals and Materials
Oleic acid (OA), palmitic acid (PA), 3-(4,5-dimethylthiazol-2-yl)-2,5-diphenyltetrazolium bromide (MTT), crystal violet, oil red-O, 4′,6-diamidino-2-phenylindole (DAPI), HMB, Calcein AM, JC-1, and 2′,7′-dichlorodihydrofluorescein diacetate (DCFH-DA) were purchased from Sigma-Aldrich (Munich, Germany). Rapamycin was obtained from Selleck Chemicals (Houston, TX, USA). 2-NBDG (2-Deoxy-2-[(7-nitro-2,1,3-benzoxadiazol-4-yl)amino]-D-glucose) was purchased from Invitrogen (Carlsbad, CA, USA). Liraglutide was purchased from Novo Nordisk (Bagsvaerd, Denmark). Primary antibodies against myogenin (sc-52903), MyoD (sc-32758), and MyHC (sc-376157) were obtained from Santa Cruz Biotechnology (Santa Cruz, CA, USA). Antibodies against pSer
307-IRS1 (GTX133848), IRS1 (GTX31717), pSer
473-Akt (GTX640148), Akt (GTX121937), atrogin-1 (GTX05209), and MuRF1 (GTX33334) were purchased from GeneTex (Irvine, CA, USA). Antibodies against pSer
9-GSK3β (#9336) and GSK3β (#9315) were obtained from Cell Signaling Technology (Danvers, MA, USA). Antibodies against pSer
2448-mTOR (AP0115) and mTOR (A11355) were purchased from ABclonal (Woburn, MA, USA). The antibody against β-actin (NB600-501) was obtained from Novus Biologicals (Littleton, CO, USA). FFAs, consisting of oleic acid and palmitic acid (OA:PA = 2:1), were prepared by dissolving the fatty acids in 0.1 M NaOH at 70 °C and subsequently conjugating them with 10% (
w/
v) bovine serum albumin (BSA) to obtain a stock solution, which was then diluted to the desired concentration for cell treatment as previously described [
18].
2.2. Cell Culture and Viability Assay
The C2C12 mouse myoblast cell line (American Type Culture Collection, ATCC, Manassas, VA, USA) was cultured in Dulbecco’s Modified Eagle Medium (DMEM) supplemented with 10% fetal bovine serum (FBS) and 1% penicillin/streptomycin. Cells were maintained in a humidified incubator at 37 °C with 5% CO
2. Prior to differentiation, the cells were passaged at a ratio of 1:3 for no more than 15 passages to ensure consistency and avoid senescence. Only cells between passages 5 and 15 were used for experimentation to maintain cellular integrity. For differentiation, cells were switched to differentiation medium containing 2% horse serum and incubated for 5 days to allow the formation of myotubes [
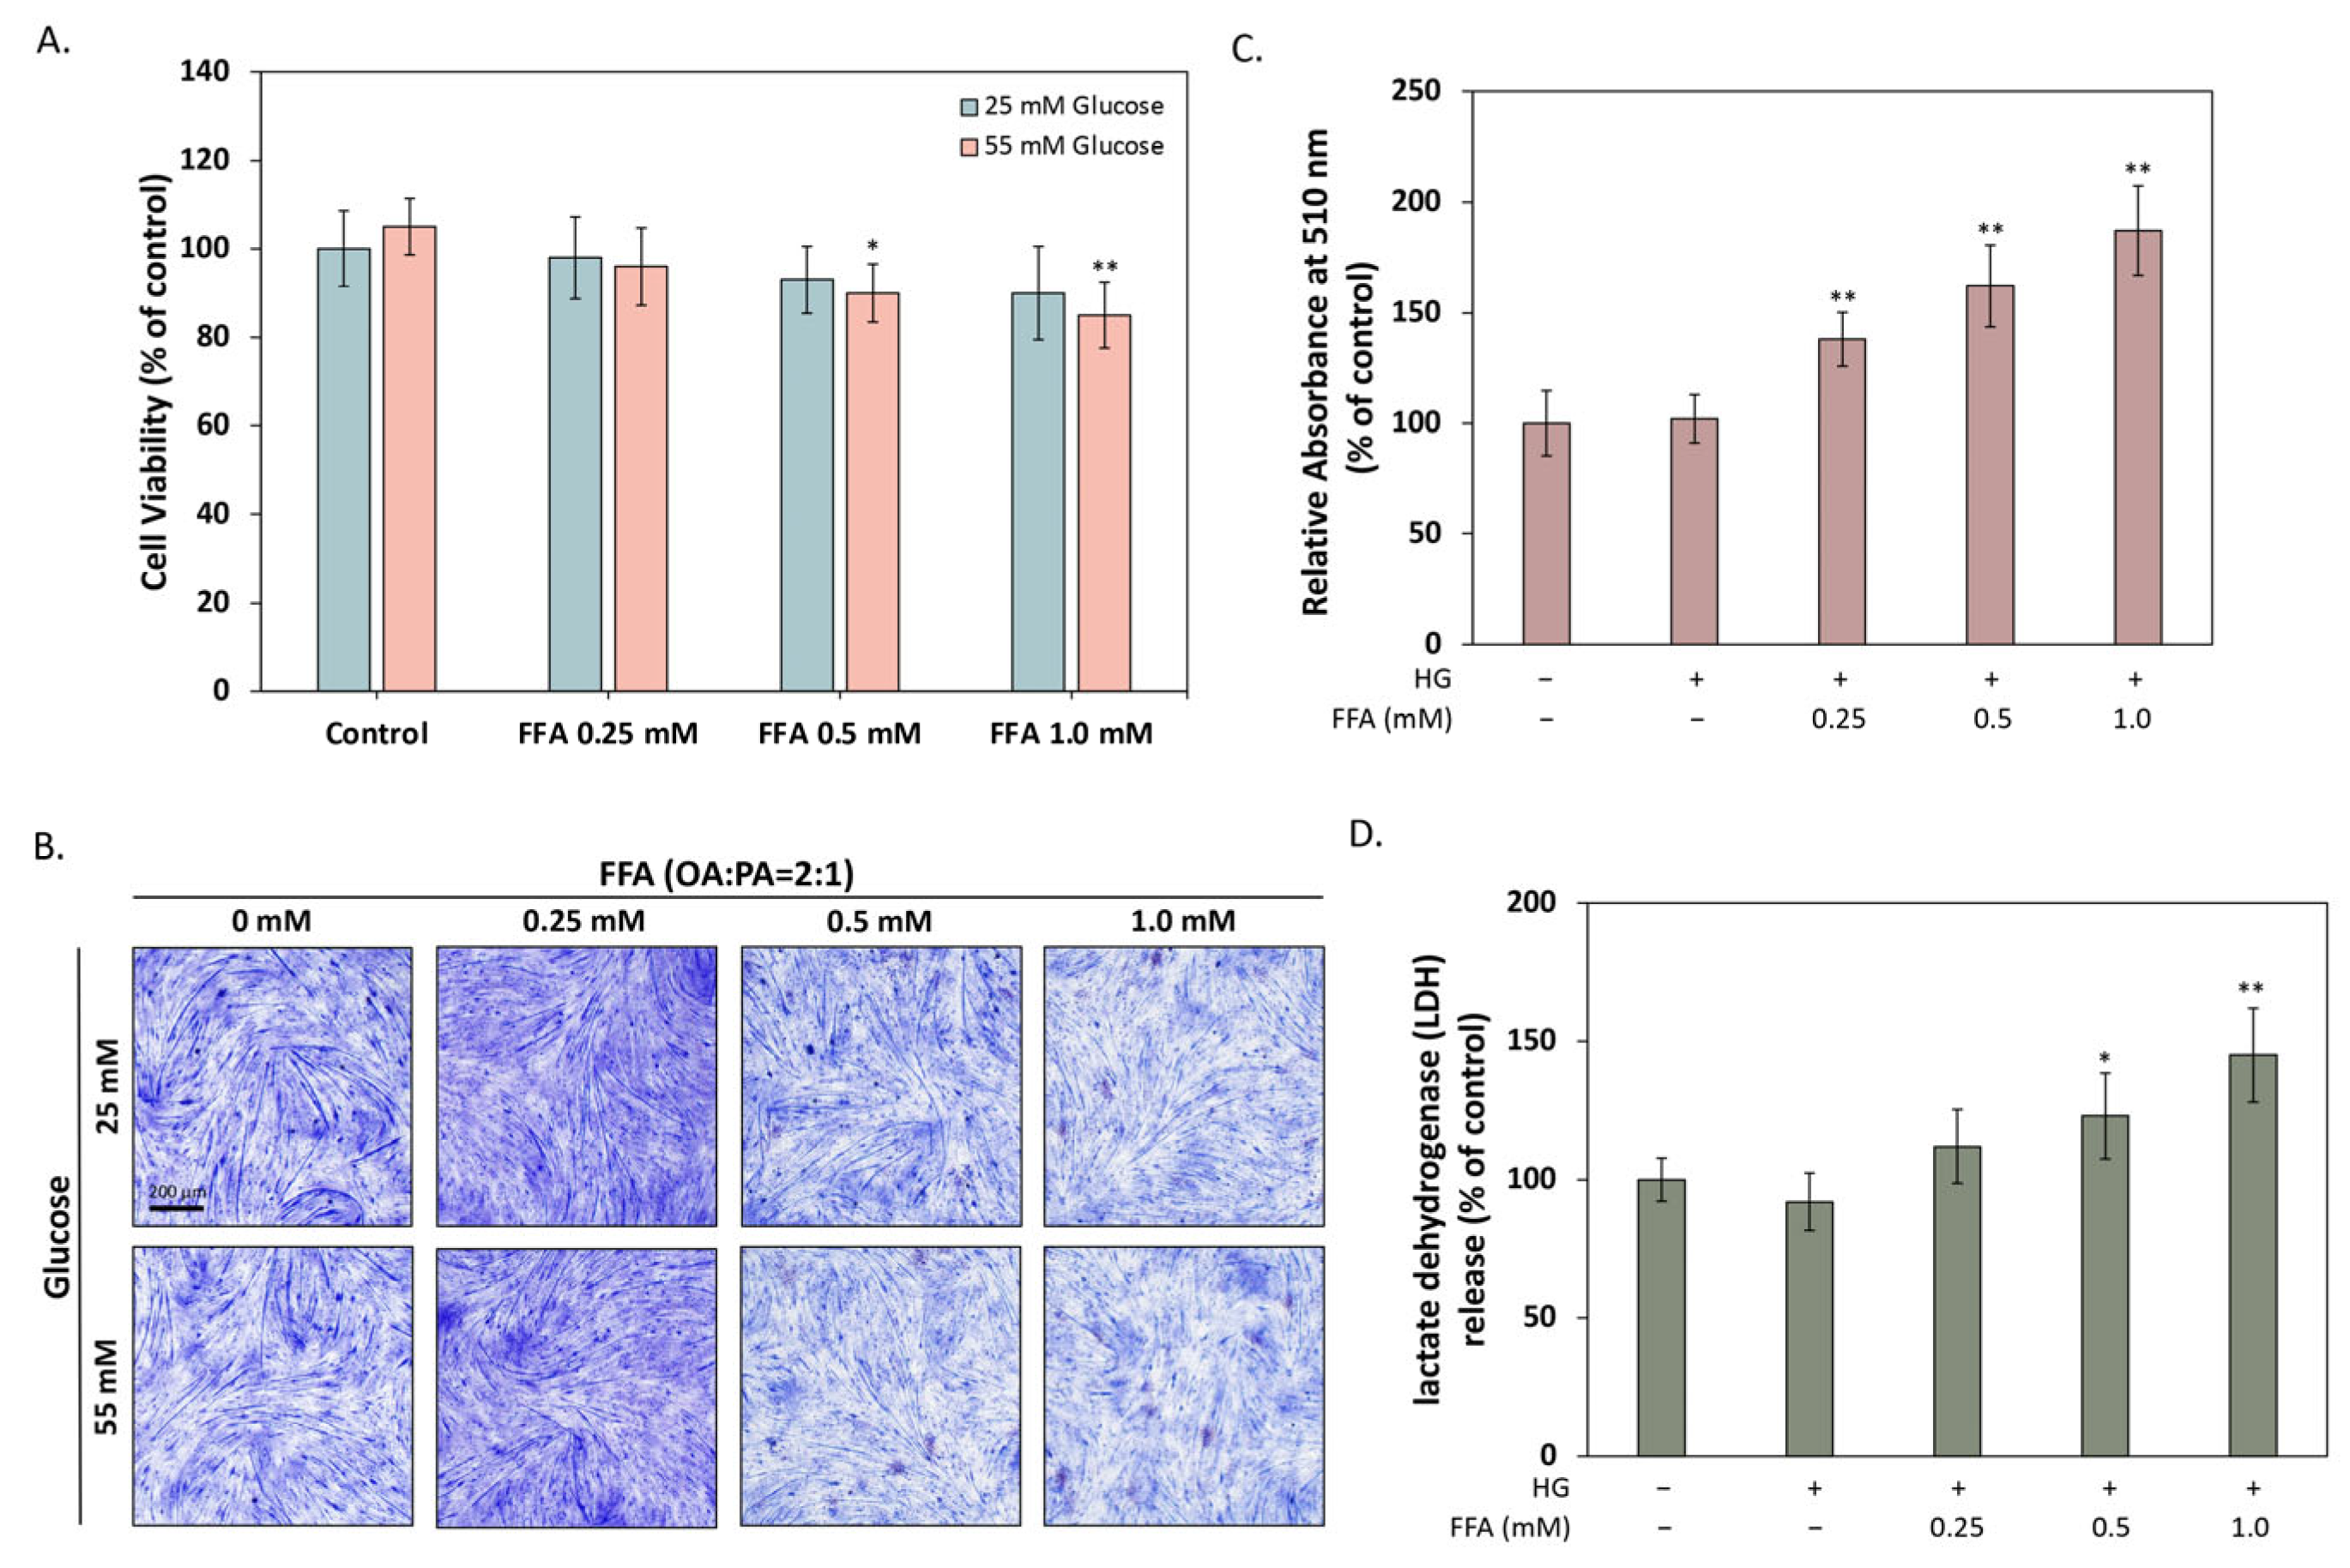
19]. During culture, regular cell quality control was performed, including mycoplasma testing and verification of morphology using phase-contrast microscopy to ensure the absence of contamination and the presence of healthy cells. Cell viability was evaluated using the MTT assay. After treatment, 10 µL of MTT solution (5 mg/mL in phosphate-buffered saline, PBS) was added to the cells, and incubation continued for 4 h at 37 °C. The resulting formazan crystals were solubilized in 100 µL of dimethyl sulfoxide (DMSO). Absorbance was measured at 570 nm using the SpectraMax iD5 multi-mode microplate reader (Molecular Devices, San Jose, CA, USA). The absorbance values were normalized to the untreated control group, and cell viability was expressed as a percentage of the control.
2.3. Crystal Violet Staining
After treatment, C2C12 myotubes were washed twice with PBS to remove any residual media. The cells were then fixed in 4% paraformaldehyde at room temperature for 15 min. Following fixation, the cells were stained with a 0.5% crystal violet solution in methanol for 15 min to allow adequate staining of the cell structures. The cells were then washed thoroughly with distilled water to remove excess stain. The stained myotubes were examined under a light microscope to visually assess morphological changes.
2.4. Oil Red-O Staining
After treatment, C2C12 myotubes were washed twice with phosphate-buffered saline (PBS) to remove any residual medium. The cells were then fixed with 4% paraformaldehyde for 15 min at room temperature. Following fixation, the cells were washed with PBS and incubated with oil red-O solution (0.5% in isopropanol) for 15–20 min at room temperature to stain lipid droplets. After staining, the cells were thoroughly washed with PBS to remove excess dye. For quantitative analysis of intracellular lipid accumulation, the retained dye was eluted with isopropanol, and absorbance was measured at 510 nm using a SpectraMax iD5 multi-mode microplate reader (Molecular Devices, San Jose, CA, USA). The absorbance values were used to quantify the lipid content, with higher absorbance indicating greater lipid accumulation in the cells.
2.5. Lactate Dehydrogenase (LDH) Measurement
Lactate dehydrogenase (LDH) release was measured using the LDH assay kit (ab102526, Abcam, Cambridge, MA, USA). After treatment, the conditioned medium was collected, and the assay was performed according to the manufacturer’s protocol. Briefly, an aliquot of the medium was added to a 96-well plate, and the reaction mixture was prepared by adding the assay reagent. The conversion of the substrate to a formazan product was allowed to occur for a specified time, and absorbance was measured at 490 nm using a SpectraMax iD5 Multi-Mode Microplate Reader (Molecular Devices, Sunnyvale, CA, USA). Cytotoxicity was quantified by calculating the percentage of LDH release in the treated samples relative to the control group, using the following formula:
where max control represents the maximum LDH release obtained from cells subjected to complete lysis.
2.6. Nile Red Staining for Lipid Droplet and High-Content Analysis (HCA)
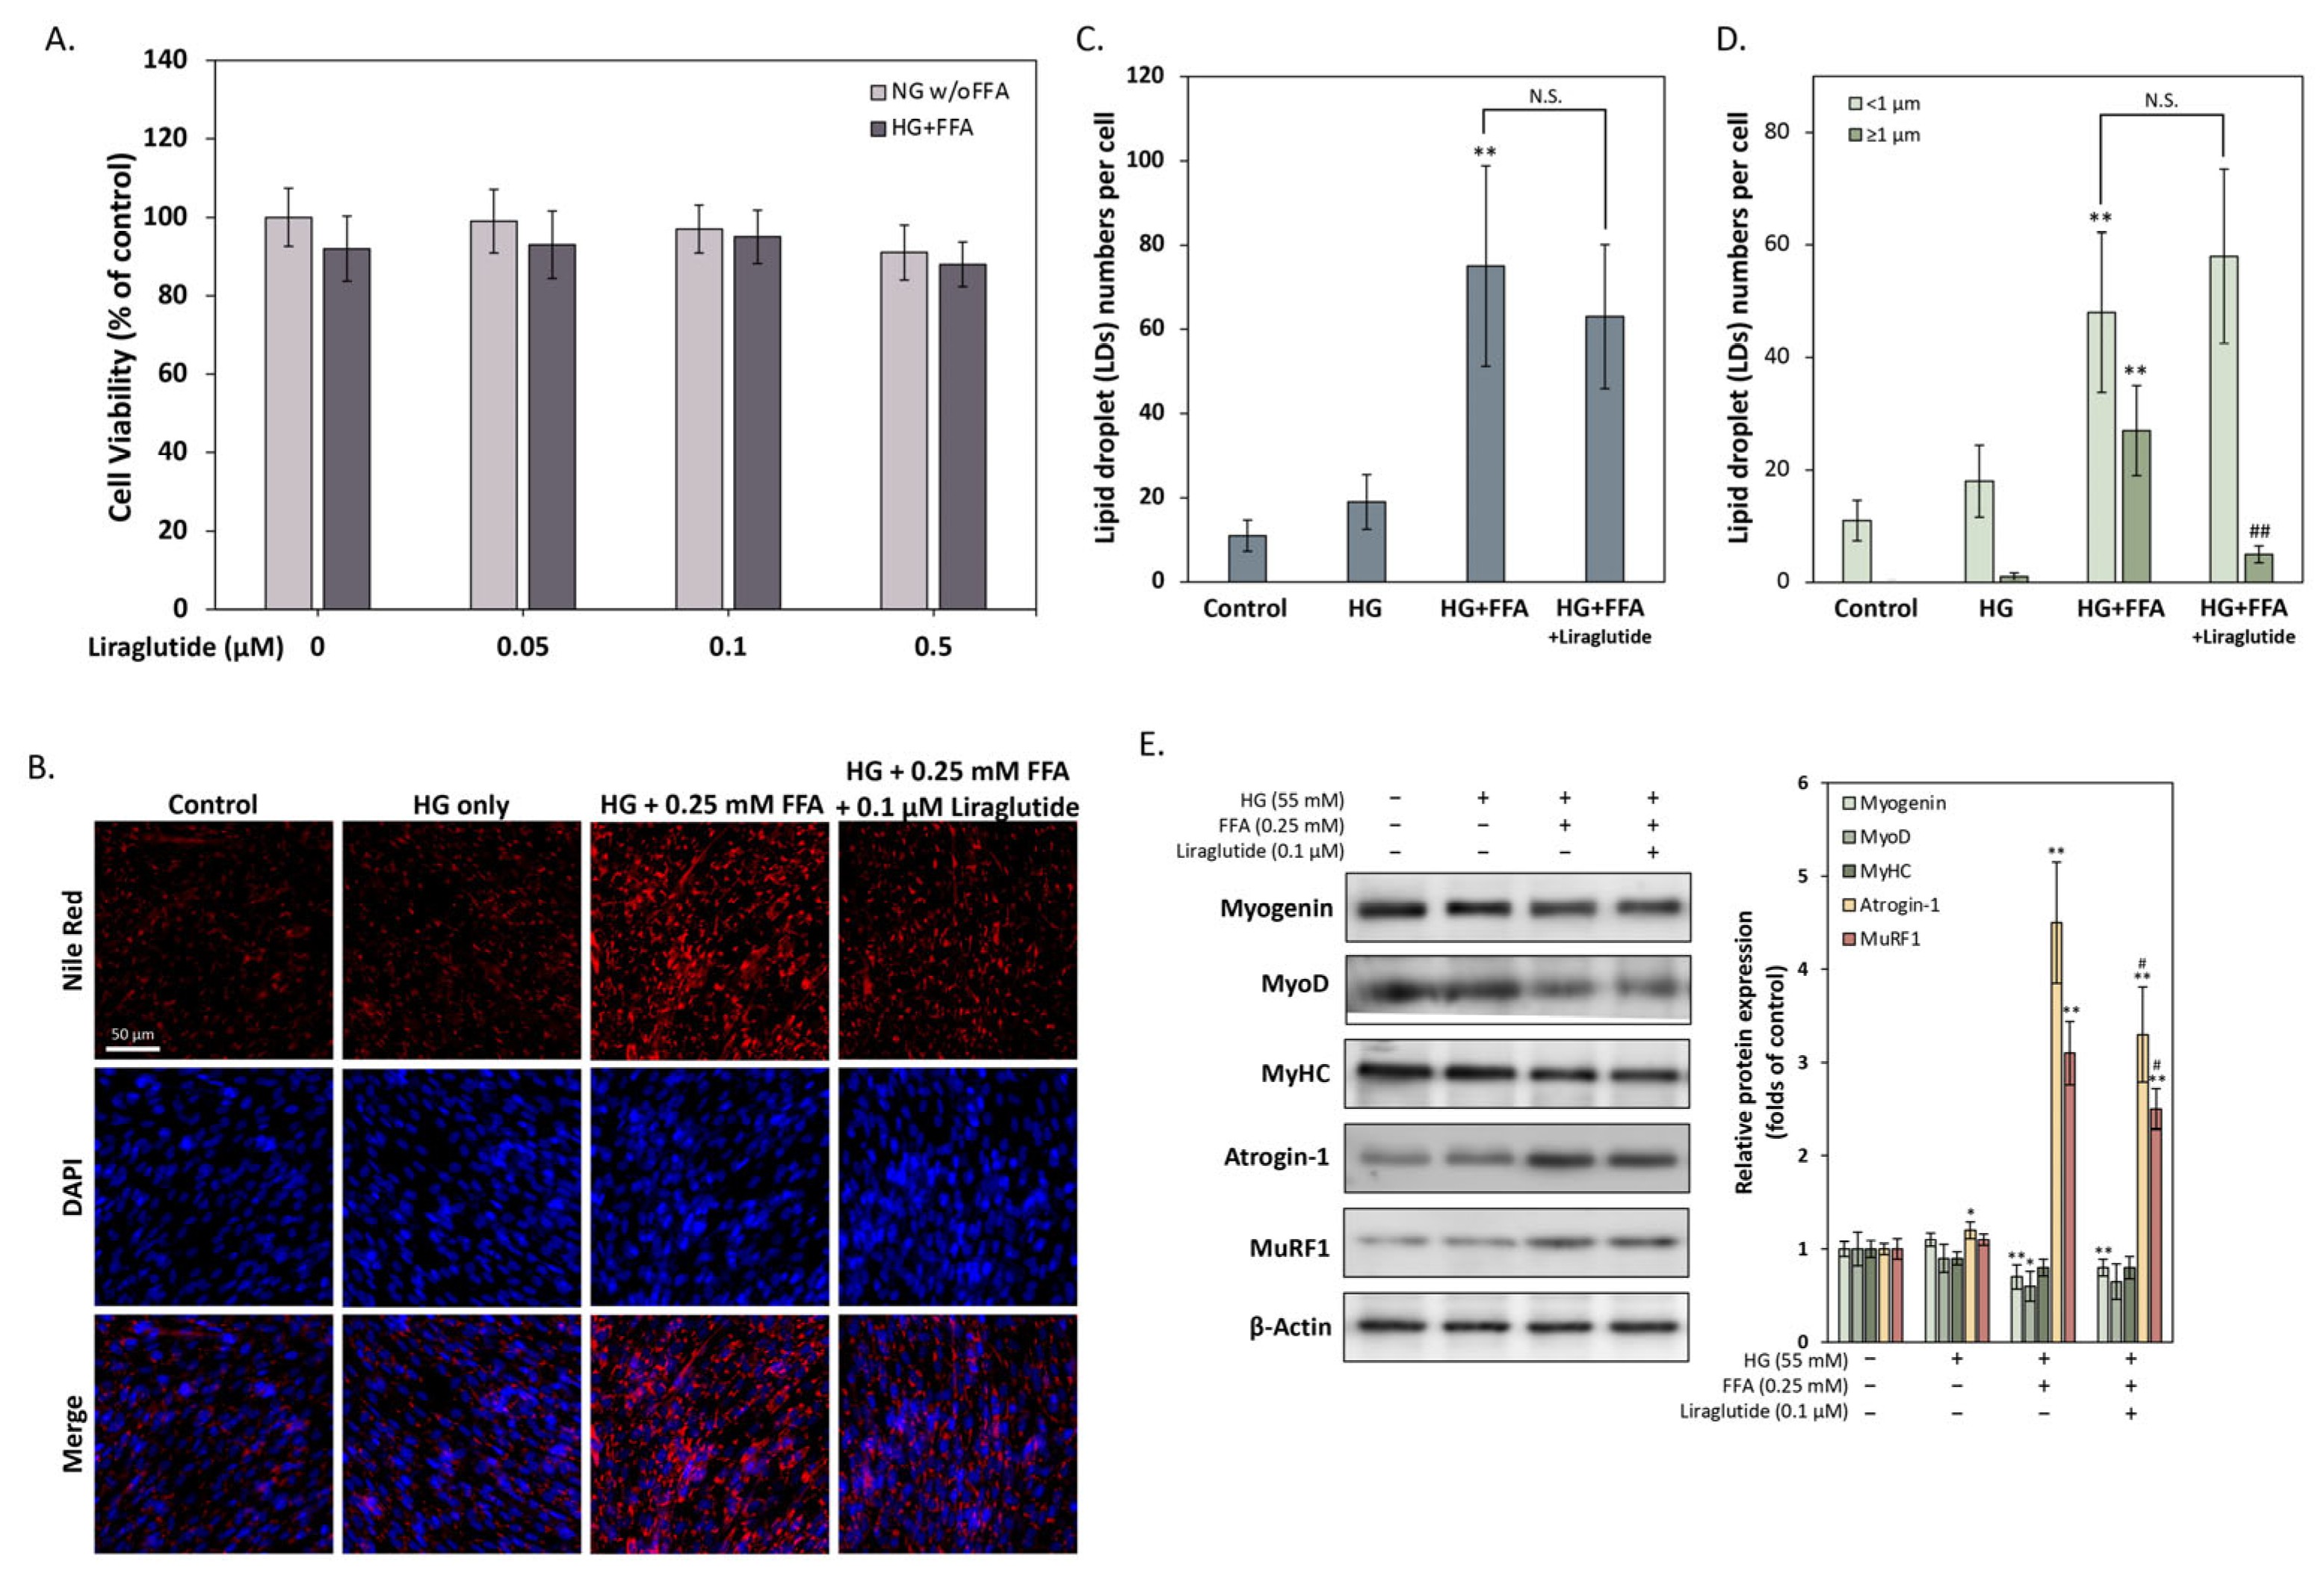
To assess lipid droplet accumulation, C2C12 myotubes were stained with Nile red according to the manufacturer’s protocol. After treatment, cells were washed twice with PBS and fixed with 4% paraformaldehyde for 15 min at room temperature. The cells were then stained with Nile red solution (1 µg/mL in PBS) for 30 min at 37 °C. After staining, the cells were washed twice with PBS to remove excess dye. DAPI was used for nuclear staining to aid in cellular localization. Lipid droplets were visualized using the ImageXpress micro confocal high-content imaging system (Molecular Devices, Sunnyvale, CA, USA). High-resolution images were acquired from at least 5 random fields of view to ensure comprehensive analysis. The MetaXpress software (ver. 6.7.0.211, Molecular Devices, Sunnyvale, CA, USA) was used for automated analysis of lipid droplet number, size, and distribution. The analysis specifically quantified lipid droplets based on their diameter, providing a detailed measure of lipid accumulation and distribution within the cells. DAPI staining was used to visualize cell nuclei for accurate localization and identification of myotubes.
2.7. Western Blot Analysis
Cells were lysed using Gold Lysis Buffer (50 mM Tris-HCl pH 7.4), 150 mM NaCl, 1% Triton X-100, 1 mM EDTA, 1 mM PMSF, 1 µg/mL aprotinin, 1 µg/mL leupeptin, and 1 mM sodium orthovanadate) supplemented with protease and phosphatase inhibitors (Thermo Fisher Scientific, Waltham, MA, USA) to prevent protein degradation. The protein concentration of the lysates was determined using the BCA protein assay kit (Bio-Rad, Hercules, CA, USA). Equal amounts of protein (30 μg) were separated by SDS-PAGE and transferred to polyvinylidene difluoride (PVDF) membranes (Millipore, Bedford, MA, USA) using a wet transfer method. After blocking with 5% bovine serum albumin (BSA) (Sigma-Aldrich, Munich, Germany) in PBST (phosphate-buffered saline with 0.1% Tween-20) for 1 h at room temperature, the membranes were incubated overnight at 4 °C with the appropriate primary antibodies, diluted in blocking solution. After washing with PBST three times, the membranes were incubated with horseradish peroxidase (HRP)-conjugated secondary antibodies for 1 h at room temperature. The protein bands were visualized using chemiluminescence with an enhanced chemiluminescence (ECL) detection kit (Cytiva, Marlborough, MA, USA) according to the manufacturer’s instructions. The intensity of the protein bands was quantified by densitometric analysis using ImageJ software (ver. 1.54). Data were normalized to the corresponding loading control (β-actin) to account for loading variations.
2.8. Calcein AM Staining
To assess myotube morphology and cell viability, C2C12 myotubes were stained with Calcein AM (1 μM), a fluorescent dye that indicates live cell viability. After treatment, the cells were incubated with Calcein AM for 30 min at 37 °C in a humidified incubator. Following incubation, the cells were washed twice with PBS to remove excess dye. The stained cells were visualized using a fluorescence microscope (CKX41 with DP74 camera, Olympus, Tokyo, Japan), with excitation/emission wavelengths set at 494/517 nm to observe the live cells and assess myotube morphology. The myotube area was quantified using ImageJ software (ver. 1.54) by measuring the Calcein AM-positive area as an index of myotube preservation.
2.9. 2-NBDG Uptake
To assess glucose uptake in C2C12 myotubes, cells were treated with 2-NBDG at a concentration of 100 µM for 30 min at 37 °C. After treatment, the cells were washed twice with PBS to remove excess dye. The uptake of 2-NBDG was visualized using a fluorescence microscope (CKX41 with DP74 camera, Olympus, Tokyo, Japan) with excitation/emission wavelengths set at 485/530 nm. The intensity of fluorescence was quantified using ImageJ software (ver. 1.54) to assess glucose uptake, with higher fluorescence indicating greater uptake of 2-NBDG into the myotubes.
2.10. Analysis of Mitochondrial Membrane Potential by JC-1
Mitochondrial membrane potential (ΔΨm) was assessed using JC-1 dye. After treatment, cells were incubated with JC-1 (2 μM) for 30 min at 37 °C. Following incubation, cells were washed twice with PBS to remove any excess dye. The stained cells were visualized using an Olympus CKX41 microscope equipped with a DP74 camera (Olympus, Tokyo, Japan). Fluorescence was captured using the following excitation/emission wavelengths: 490/530 nm for the JC-1 monomer (green fluorescence) and 525/590 nm for the JC-1 aggregate (red fluorescence). The red-to-green fluorescence ratio was used as an indicator of mitochondrial membrane potential. For quantification, the fluorescence images were analyzed using ImageJ software (ver. 1.54). The intensity of both red and green fluorescence was measured, and the red-to-green fluorescence ratio was calculated to assess changes in mitochondrial membrane potential.
2.11. Measurement of Reactive Oxygen Species (ROS)
ROS production was measured using the fluorescent probe DCFH-DA. After treatment, cells were incubated with DCFH-DA (10 μM) for 30 min at 37 °C. The probe was then converted to a fluorescent product (DCF) in the presence of ROS. After incubation, the cells were washed twice with PBS to remove excess probe and analyzed using a Novocyte flow cytometer (ACEA Biosciences, San Diego, CA, USA). ROS levels were assessed by measuring the fluorescence intensity of DCF. Higher fluorescence intensity indicates increased ROS production. For quantitative analysis, the flow cytometry data were processed using FlowJo software (ver. 10, TreeStar, Ashland, OR, USA) to analyze the ROS levels in the treated samples. The fluorescence intensity was normalized to the control group to assess ROS generation.
2.12. mRNA Expression Analysis by Reverse-Transcription Quantitative PCR (qPCR)
Total RNA was extracted from C2C12 cells using the RNeasy Kit (Qiagen, Germantown, MD, USA) according to the manufacturer’s protocol. RNA concentration and purity were assessed using a spectrophotometer to ensure RNA quality. For reverse transcription, 1 µg of total RNA was converted into complementary DNA (cDNA) using a TProfessional Thermocycler (Biometra, Göttingen, Germany) and a commercial reverse transcription kit, under optimized conditions. qPCR was performed using the Power SYBR Green PCR Master Mix (Applied Biosystems, Foster City, CA, USA) on the ABI 7300 Sequence Detection System. Each cDNA sample was analyzed in triplicate using the following cycling conditions: an initial denaturation step at 95 °C for 10 min, followed by 40 amplification cycles of 95 °C for 15 s and 60 °C for 1 min. A final dissociation curve analysis was performed to verify the specificity of the amplification. Relative mRNA expression levels for SOD1 (
Sod1), SOD2 (
Sod2), and catalase (
Cat) were calculated using the 2
−ΔΔCt method and normalized to GAPDH as an internal control. The primers for the target genes and GAPDH (
Gapdh) are listed in
Table 1. Data analysis was performed using the Sequence Detection System software (ver. 2.4, Applied Biosystems, Foster City, CA, USA).
2.13. Immunocytochemistry Staining for MyHC
For immunocytochemical staining, C2C12 myotubes were fixed with 4% paraformaldehyde for 15 min at room temperature. After fixation, the cells were permeabilized with 0.1% Triton X-100 for 10 min to allow antibody access to intracellular targets. The cells were then incubated overnight at 4 °C with primary antibodies against MyHC (1:200 dilution), diluted in PBS containing 1% BSA (bovine serum albumin). After washing with PBS, the cells were incubated with the appropriate fluorescent secondary antibody (1:500 dilution) for 1 h at room temperature. To stain the nuclei, cells were incubated with DAPI (1 µg/mL) for 5 min at room temperature after secondary antibody incubation. After washing with PBS, the stained cells were visualized using the ImageXpress Micro Confocal High-Content Imaging System (Molecular Devices, Sunnyvale, CA, USA) to capture high-resolution images. The images were obtained from at least 5 random fields of view to ensure comprehensive analysis. The intensity of MyHC expression was quantified using MetaXpress software (ver. 6.7.0.211, Molecular Devices, Sunnyvale, CA, USA) to measure fluorescence intensity. The DAPI fluorescence was used to identify cell nuclei and to help localize the MyHC expression. The data were normalized to the background levels.
2.14. FOXO Transcriptional Activity Assay
FOXO (forkhead box O) transcriptional activity was evaluated using a FOXO reporter kit (#60643, BPS Bioscience, San Diego, CA, USA), which contains a firefly luciferase reporter driven by tandem FOXO-responsive elements and a constitutively expressed Renilla luciferase vector as an internal control. Differentiated C2C12 myotubes were transiently transfected with the FOXO reporter construct using Lipofectamine 3000 (Invitrogen, Carlsbad, CA, USA) according to the manufacturer’s instructions. Briefly, cells were seeded in 96-well plates and allowed to reach appropriate confluence prior to transfection. The reporter plasmid mixture, including the FOXO reporter and Renilla control plasmids, was prepared with Lipofectamine 3000 reagent and added to the cells, followed by incubation for 24 h to allow reporter expression. After transfection, cells were subjected to the indicated treatments. Following treatment, luciferase activities were measured using a dual-luciferase reporter assay system. Firefly and Renilla luminescence signals were sequentially detected using a SpectraMax iD5 multi-mode microplate reader (Molecular Devices, Sunnyvale, CA, USA). FOXO transcriptional activity was calculated as the ratio of firefly luciferase activity to Renilla luciferase activity to normalize for transfection efficiency.
2.15. Statistical Analysis
All quantitative data are presented as the mean ± standard deviation (SD) from at least three independent experiments. Statistical analyses were performed using SPSS software (ver. 25, SPSS Inc., Chicago, IL, USA). Comparisons among multiple groups were conducted using one-way analysis of variance (ANOVA), followed by Tukey’s post hoc test for pairwise comparisons when a significant overall difference was detected. A value of p < 0.05 was considered statistically significant.
4. Discussion
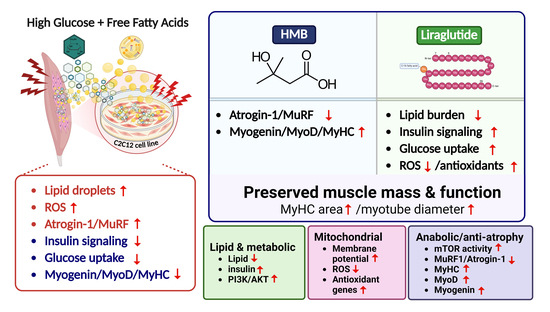
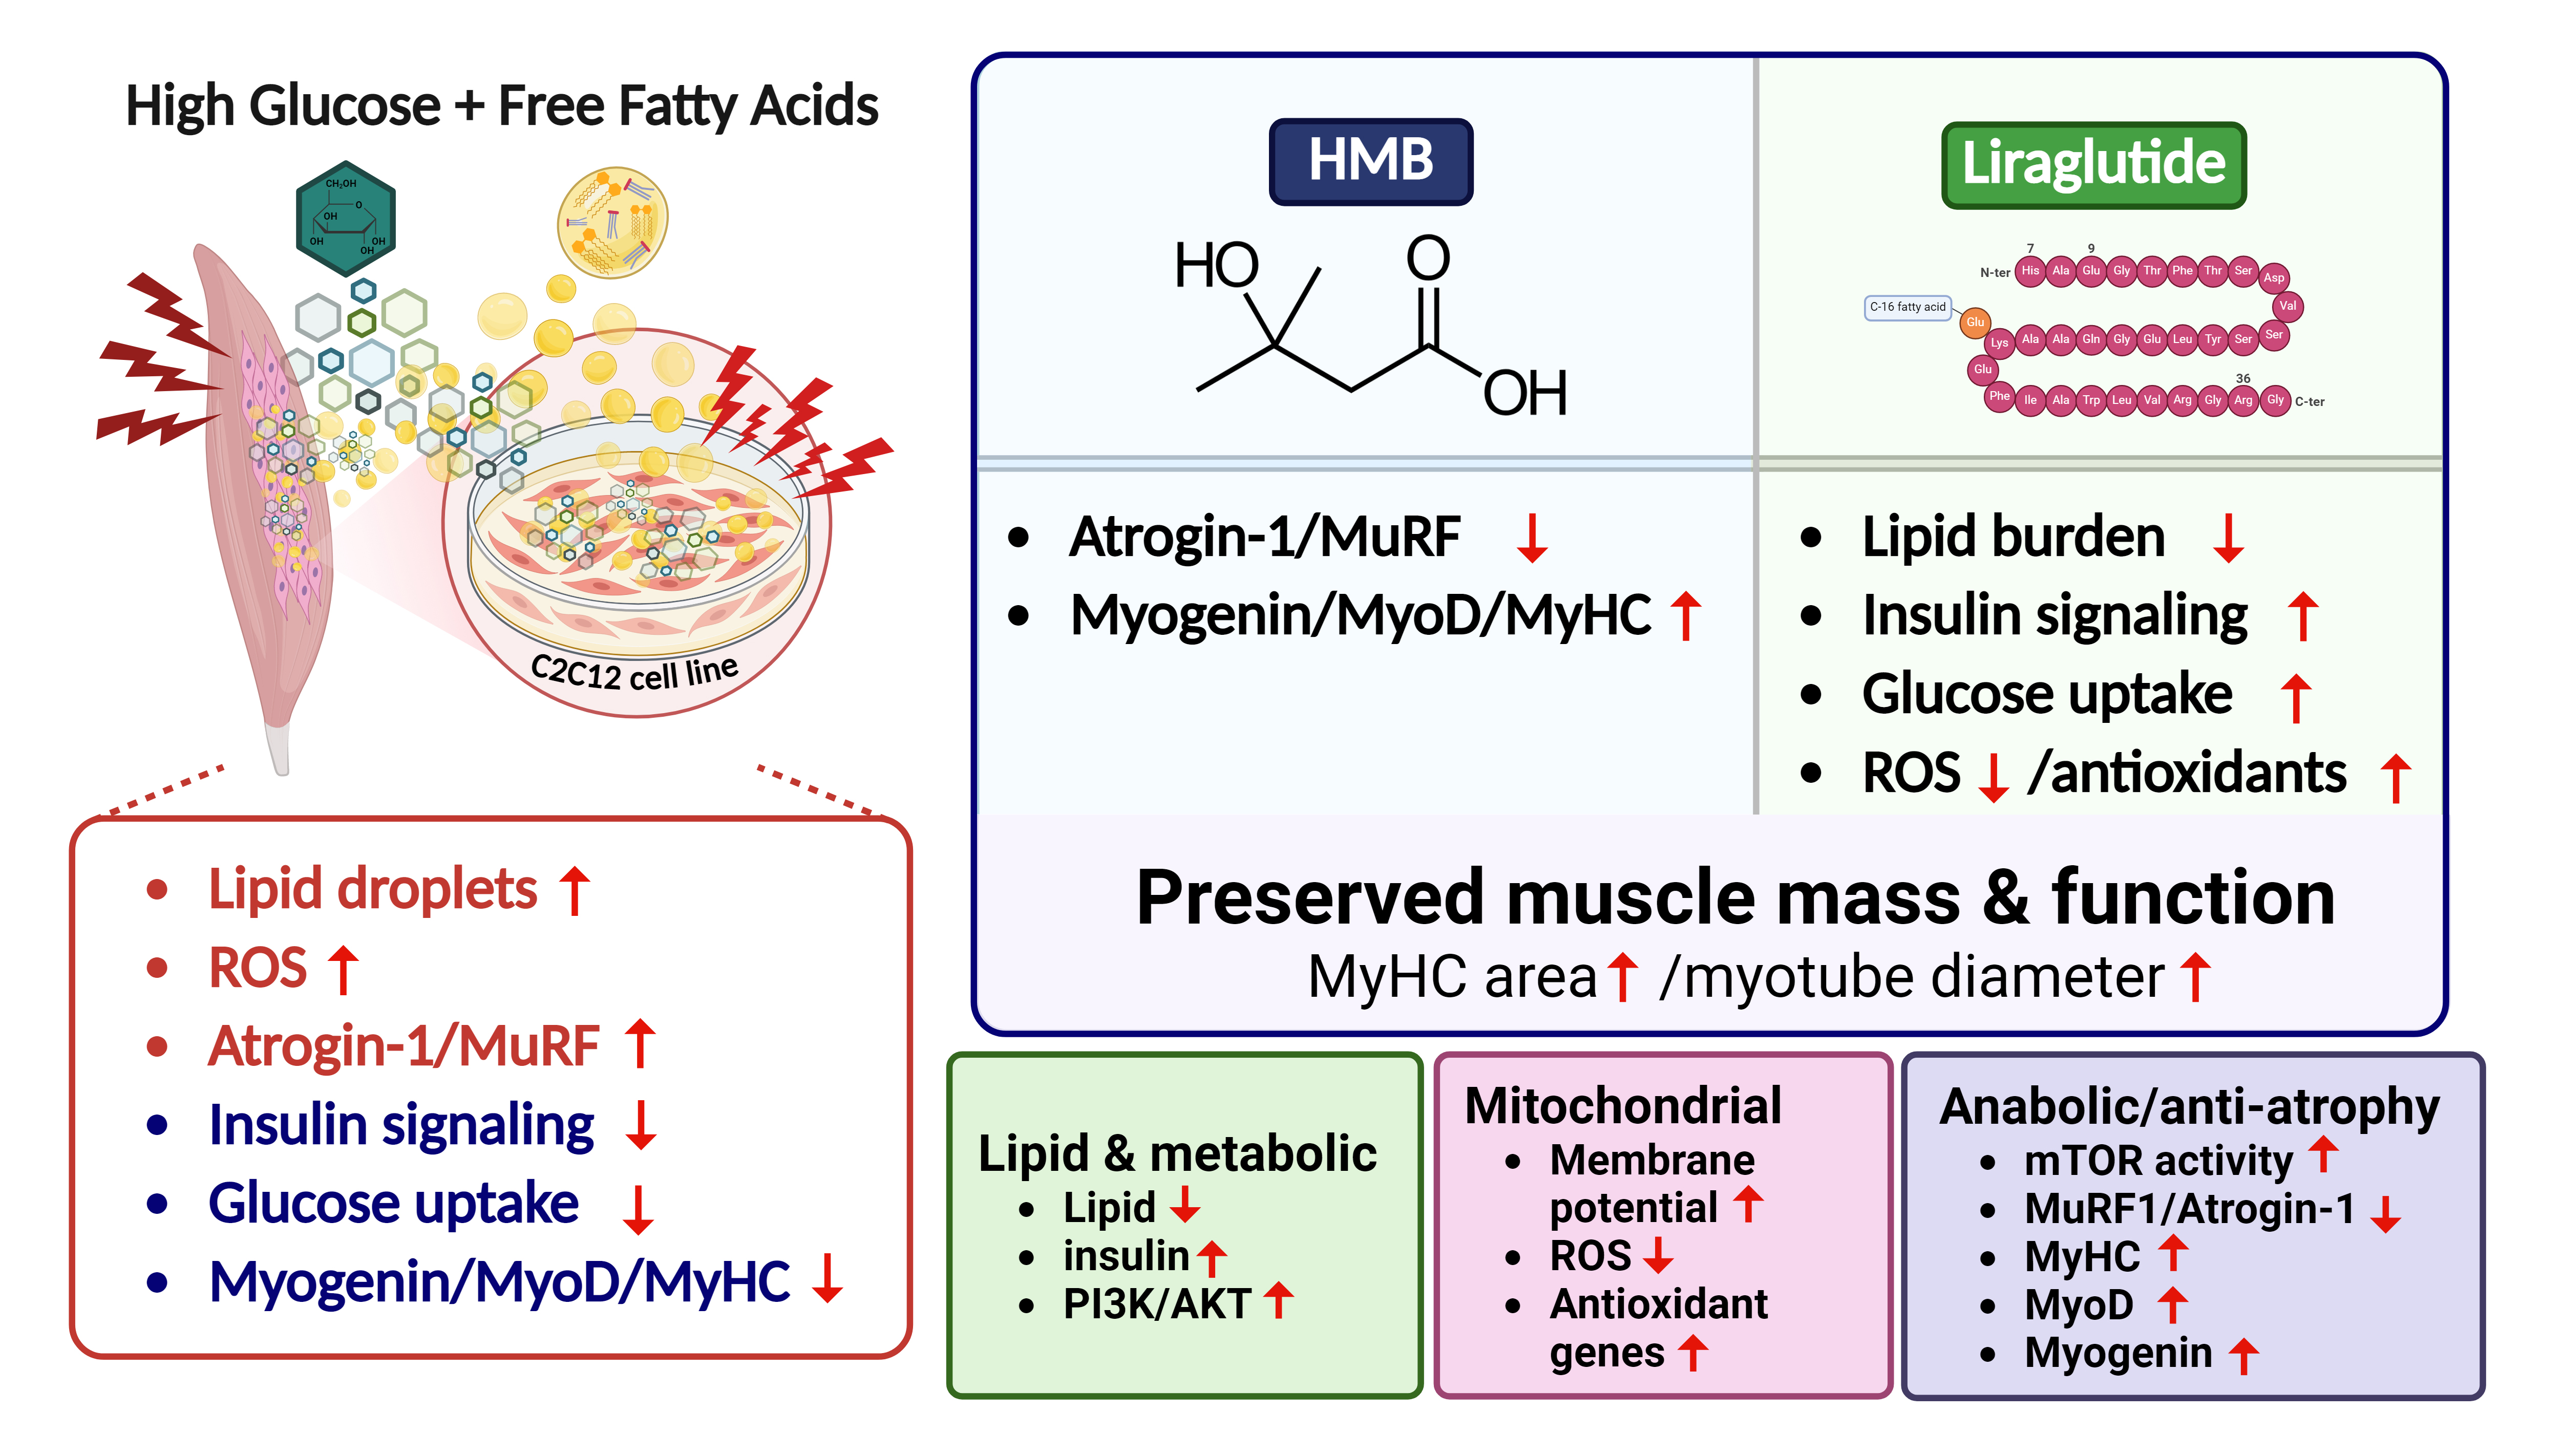
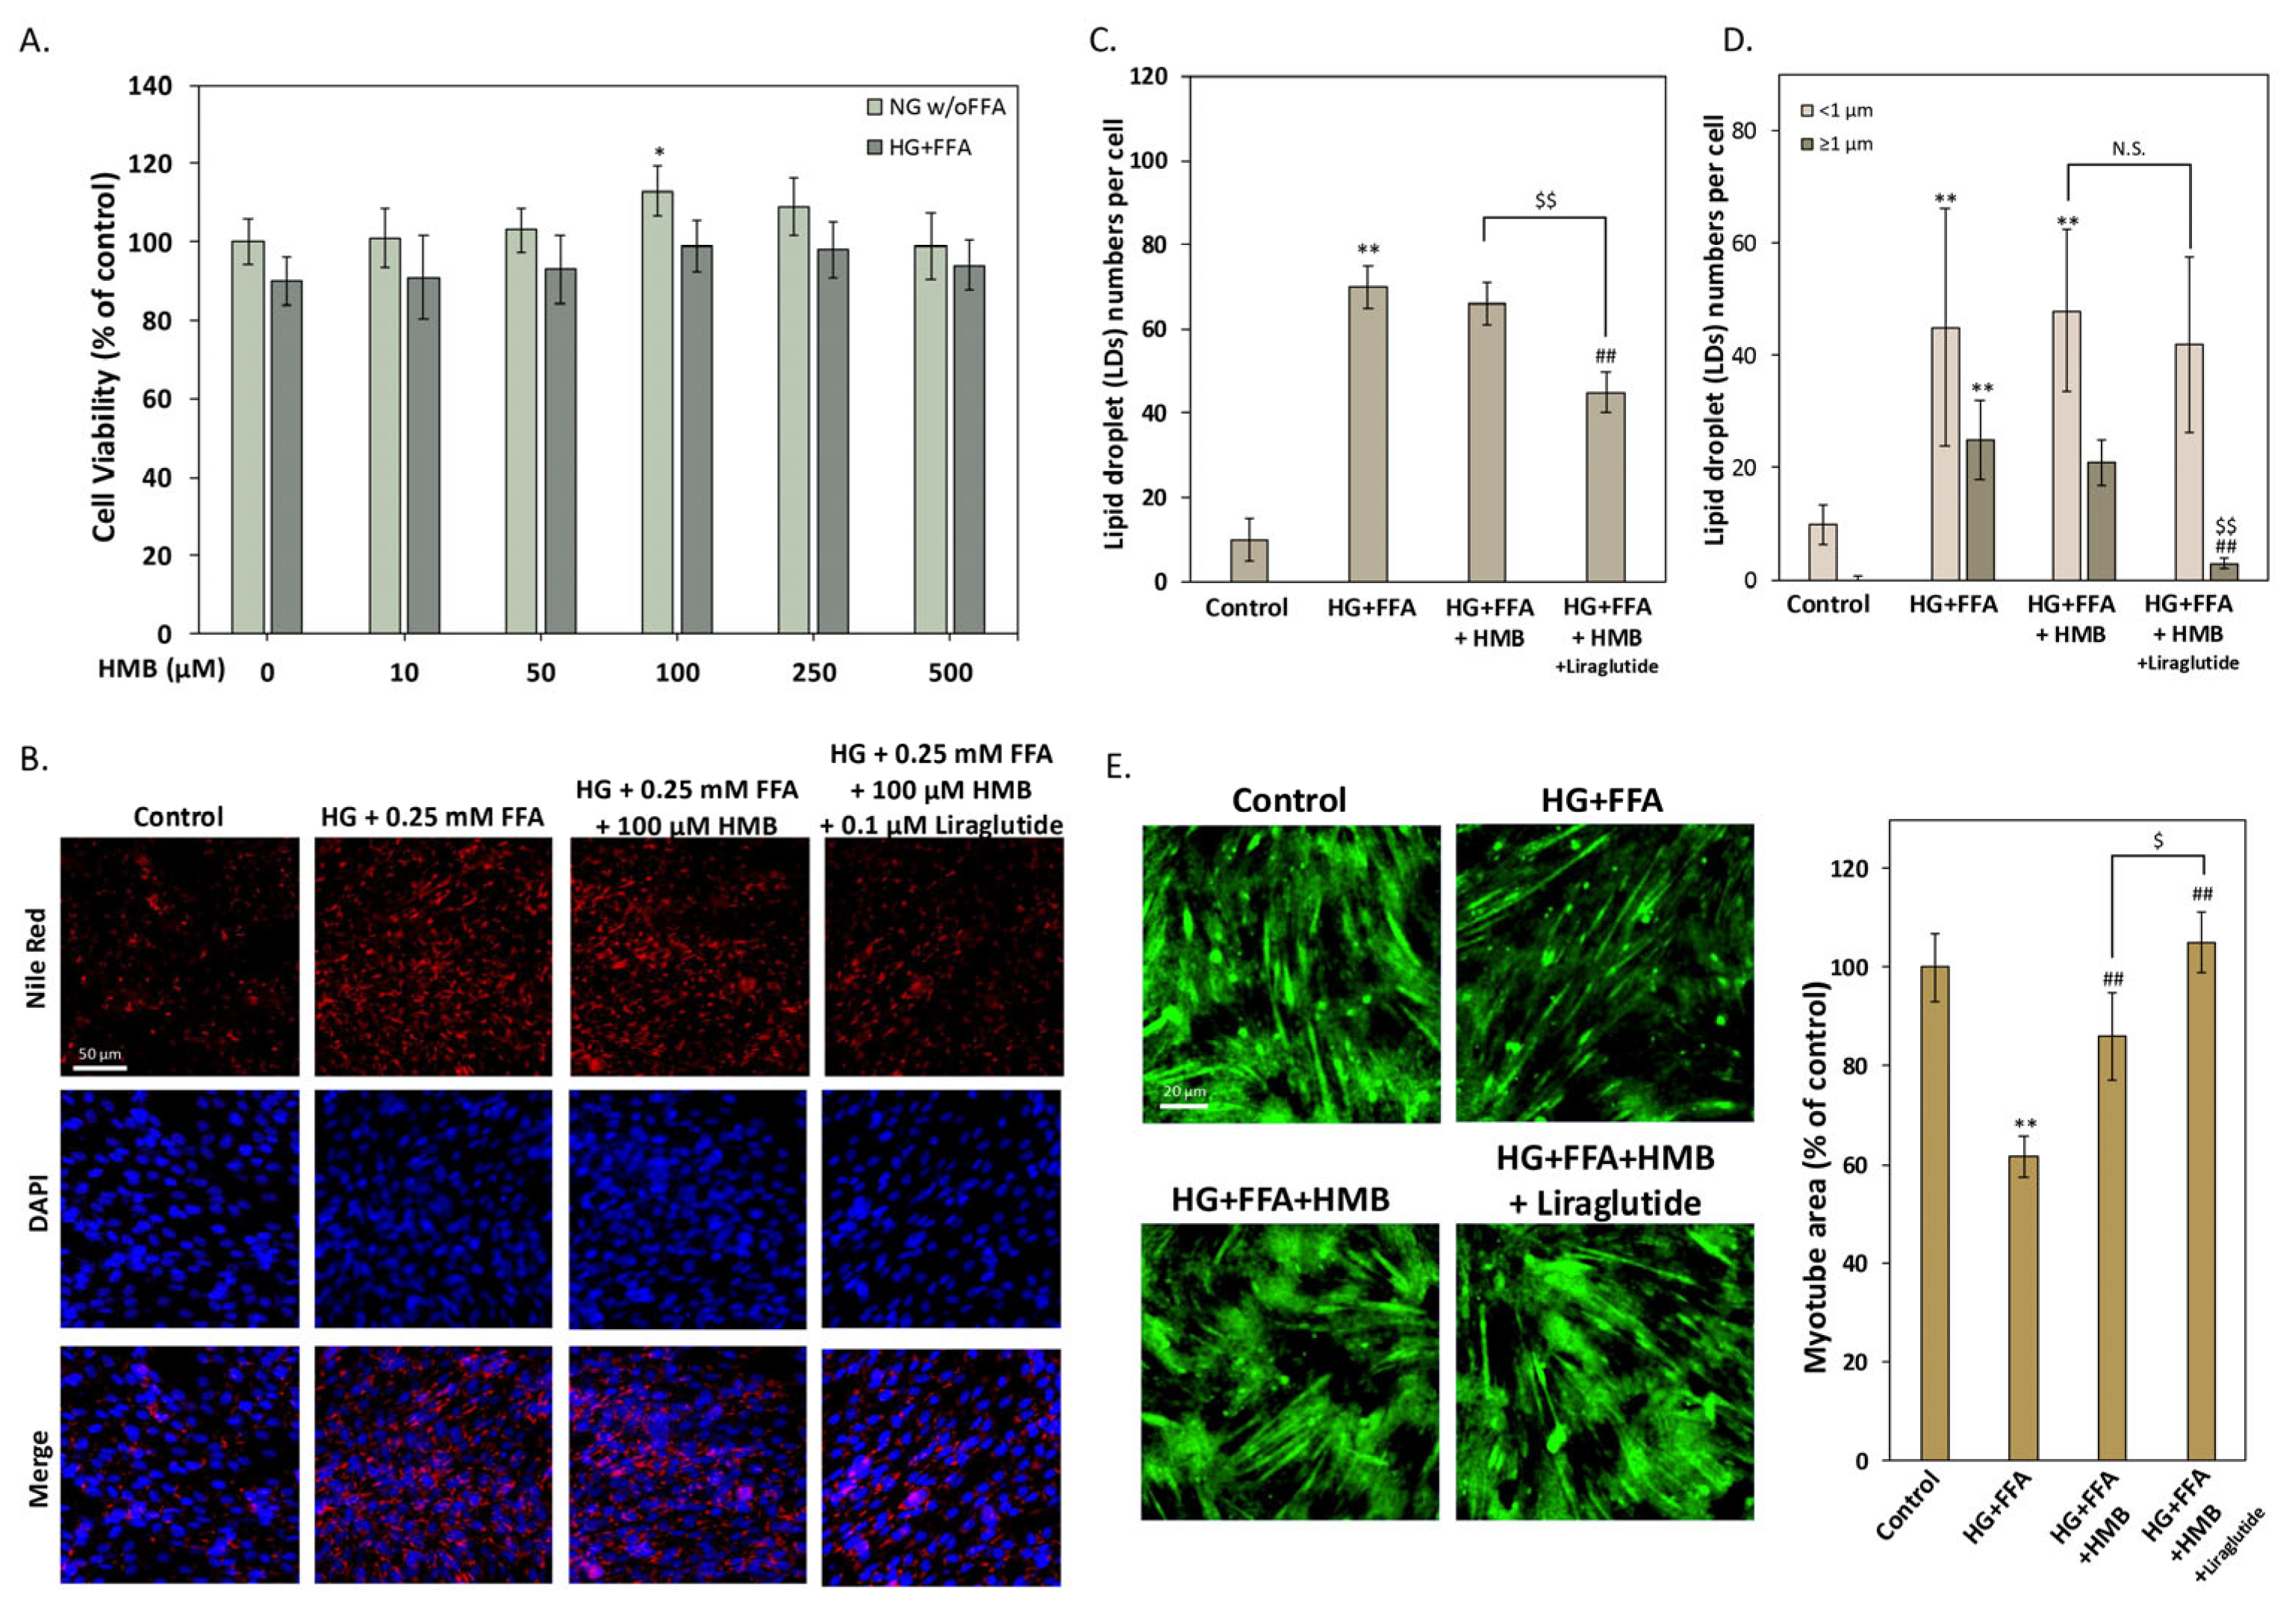
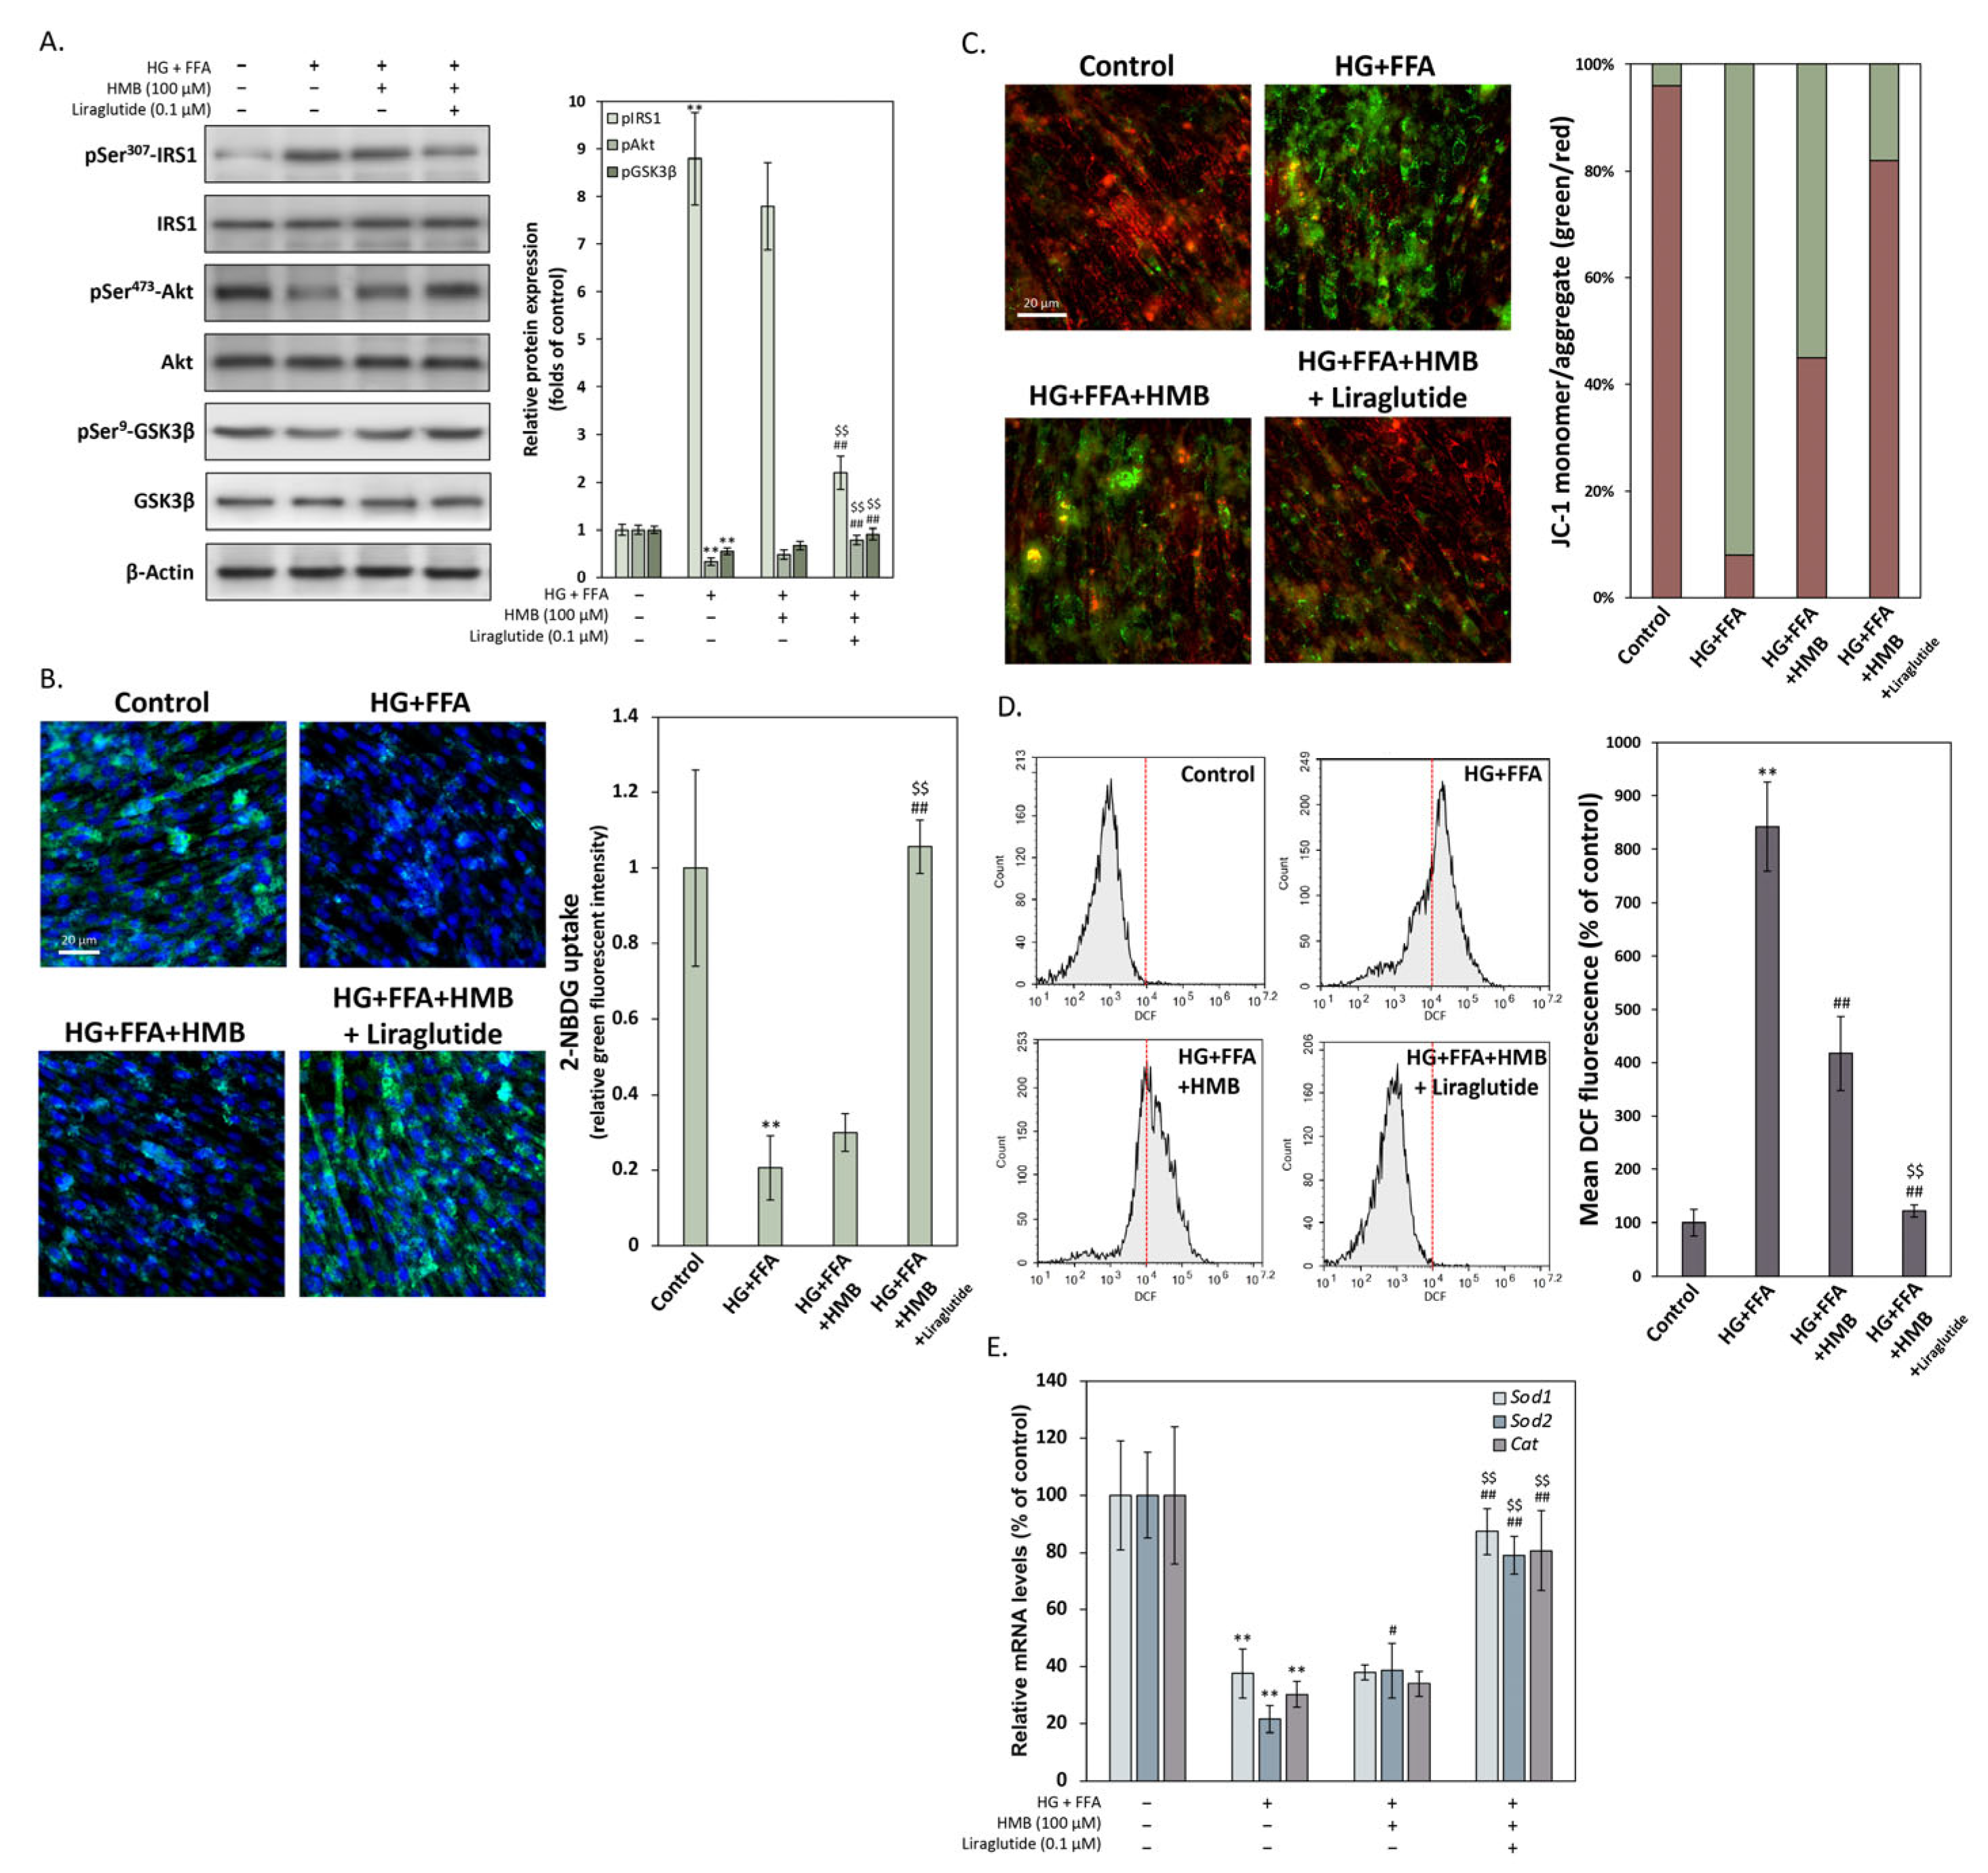
In this study, we investigated the combined effects of the GLP-1 receptor agonist liraglutide and the nutritional metabolite HMB on preserving muscle integrity under a lipotoxic, insulin-resistant environment that models T2D-associated sarcopenia. Our findings demonstrate that while liraglutide alone can alleviate intracellular lipid accumulation and improve insulin signaling, it fails to robustly preserve the myogenic phenotype and muscle integrity in differentiated C2C12 myotubes exposed to HG+FFA. In contrast, HMB exhibits protective effects on myotube morphology and muscle differentiation markers, and when combined with liraglutide, we observe enhanced preservation of muscle structural and functional markers. These effects are accompanied by improved metabolic signaling and reduced oxidative stress. Collectively, our data provide foundational evidence for a novel therapeutic strategy to mitigate sarcopenia in the context of T2D. Although GLP-1 receptor agonists such as liraglutide have gained significant attention for their efficacy in improving glycemic control and promoting weight loss in T2D, their effects on muscle health remain underexplored. The muscle-wasting side effects of liraglutide have been noted in several reports, though their clinical relevance has not been fully investigated, especially in patients with sarcopenia, a condition prevalent in diabetic populations [
20]. Existing studies have primarily focused on the metabolic benefits of liraglutide in controlling blood glucose and reducing fat mass, with limited attention paid to its potential to cause muscle loss. Given that sarcopenia exacerbates both insulin resistance and functional decline, it is crucial to address the negative effects of liraglutide on muscle mass in high-risk patients, particularly those with pre-existing muscle degradation. To our knowledge, our findings provide early evidence supporting HMB supplementation as a potential solution to mitigate muscle loss during liraglutide therapy.
HMB has garnered significant attention in recent years due to its practical application as a muscle-preserving supplement in various contexts such as nutritional stress, disuse atrophy, and oxidative damage. Studies have demonstrated that HMB supplementation is both safe and effective in promoting muscle health in populations at risk of muscle wasting, including older adults, individuals with chronic conditions, and athletes undergoing intense training [
21]. Importantly, HMB has been shown to enhance muscle protein synthesis through the mTOR signaling pathway while inhibiting muscle protein degradation by suppressing the ubiquitin–proteasome system, a key pathway in catabolic processes [
22]. This inhibition of catabolic signaling is critical, as muscle protein degradation is accelerated under conditions of chronic metabolic stress such as T2D [
23]. HMB also reduces ROS and sustains mitochondrial function, both of which are critical in the pathophysiology of muscle degeneration under oxidative stress [
24]. These properties highlight HMB’s versatility and safety profile, making it an attractive adjunctive therapy in clinical settings. Furthermore, HMB has been shown to modulate key anti-catabolic factors in muscle cells, including suppressing the activity of atrophy markers like atrogin-1 and MuRF1, which contribute to muscle wasting under metabolic stress [
15]. In T2D-induced sarcopenia, where lipotoxicity from elevated FFAs exacerbates muscle wasting, our study demonstrates that HMB supplementation significantly reduces muscle degradation under lipotoxic stress. HMB also helps preserve myogenic markers (e.g., myogenin, MyoD, MyHC) in C2C12 myotubes exposed to HG+FFA, suggesting it sustains muscle integrity even under metabolic stress [
15]. Recent studies further support HMB’s potential in counteracting muscle loss in diabetes and sarcopenia models, highlighting its efficacy in maintaining muscle mass and function in catabolic conditions [
25].
On the other hand, liraglutide primarily acts through its glucose-lowering effects and its ability to promote weight loss. It achieves this by enhancing insulin secretion, improving insulin sensitivity, and reducing glucagon levels [
26]. However, while liraglutide is effective in managing hyperglycemia and promoting fat loss, it is associated with muscle loss, especially in sarcopenic T2D patients. This muscle loss, likely due to both direct inhibition of muscle protein synthesis and indirect promotion of muscle atrophy through elevated catabolic signaling, presents a significant challenge when considering the long-term use of liraglutide in populations at risk for sarcopenia [
27]. Our study suggests that HMB and liraglutide, when used together, can complement each other by targeting different mechanisms of muscle preservation and metabolic regulation. While liraglutide primarily addresses hyperglycemia and insulin resistance, HMB directly preserves muscle mass by inhibiting catabolic pathways and enhancing muscle protein synthesis. Together, they may provide complementary benefits by improving metabolic stress while preserving myotube integrity. Notably, liraglutide’s effect on glucose regulation combined with HMB’s anti-catabolic properties provides a multifaceted approach to treating sarcopenic T2D, an area that is currently underexplored in clinical research. However, clinical studies have already indicated that adequate protein supplementation can mitigate the risk of muscle loss associated with GLP-1 RA therapy [
28], a perspective that aligns closely with our current findings. Moreover, while liraglutide has shown efficacy in reducing fat mass, which can potentially reduce muscle damage [
29], it lacks direct muscle-protecting effects, which HMB provides. In our study, we observed that liraglutide could slightly reduce lipid accumulation but did not significantly improve muscle differentiation or regeneration markers in HG+FFA-treated myotubes. In contrast, HMB supplementation in the same conditions improved muscle health, supported myotube formation, and reduced oxidative stress, indicating that HMB’s protective effects are complementary to the benefits of liraglutide.
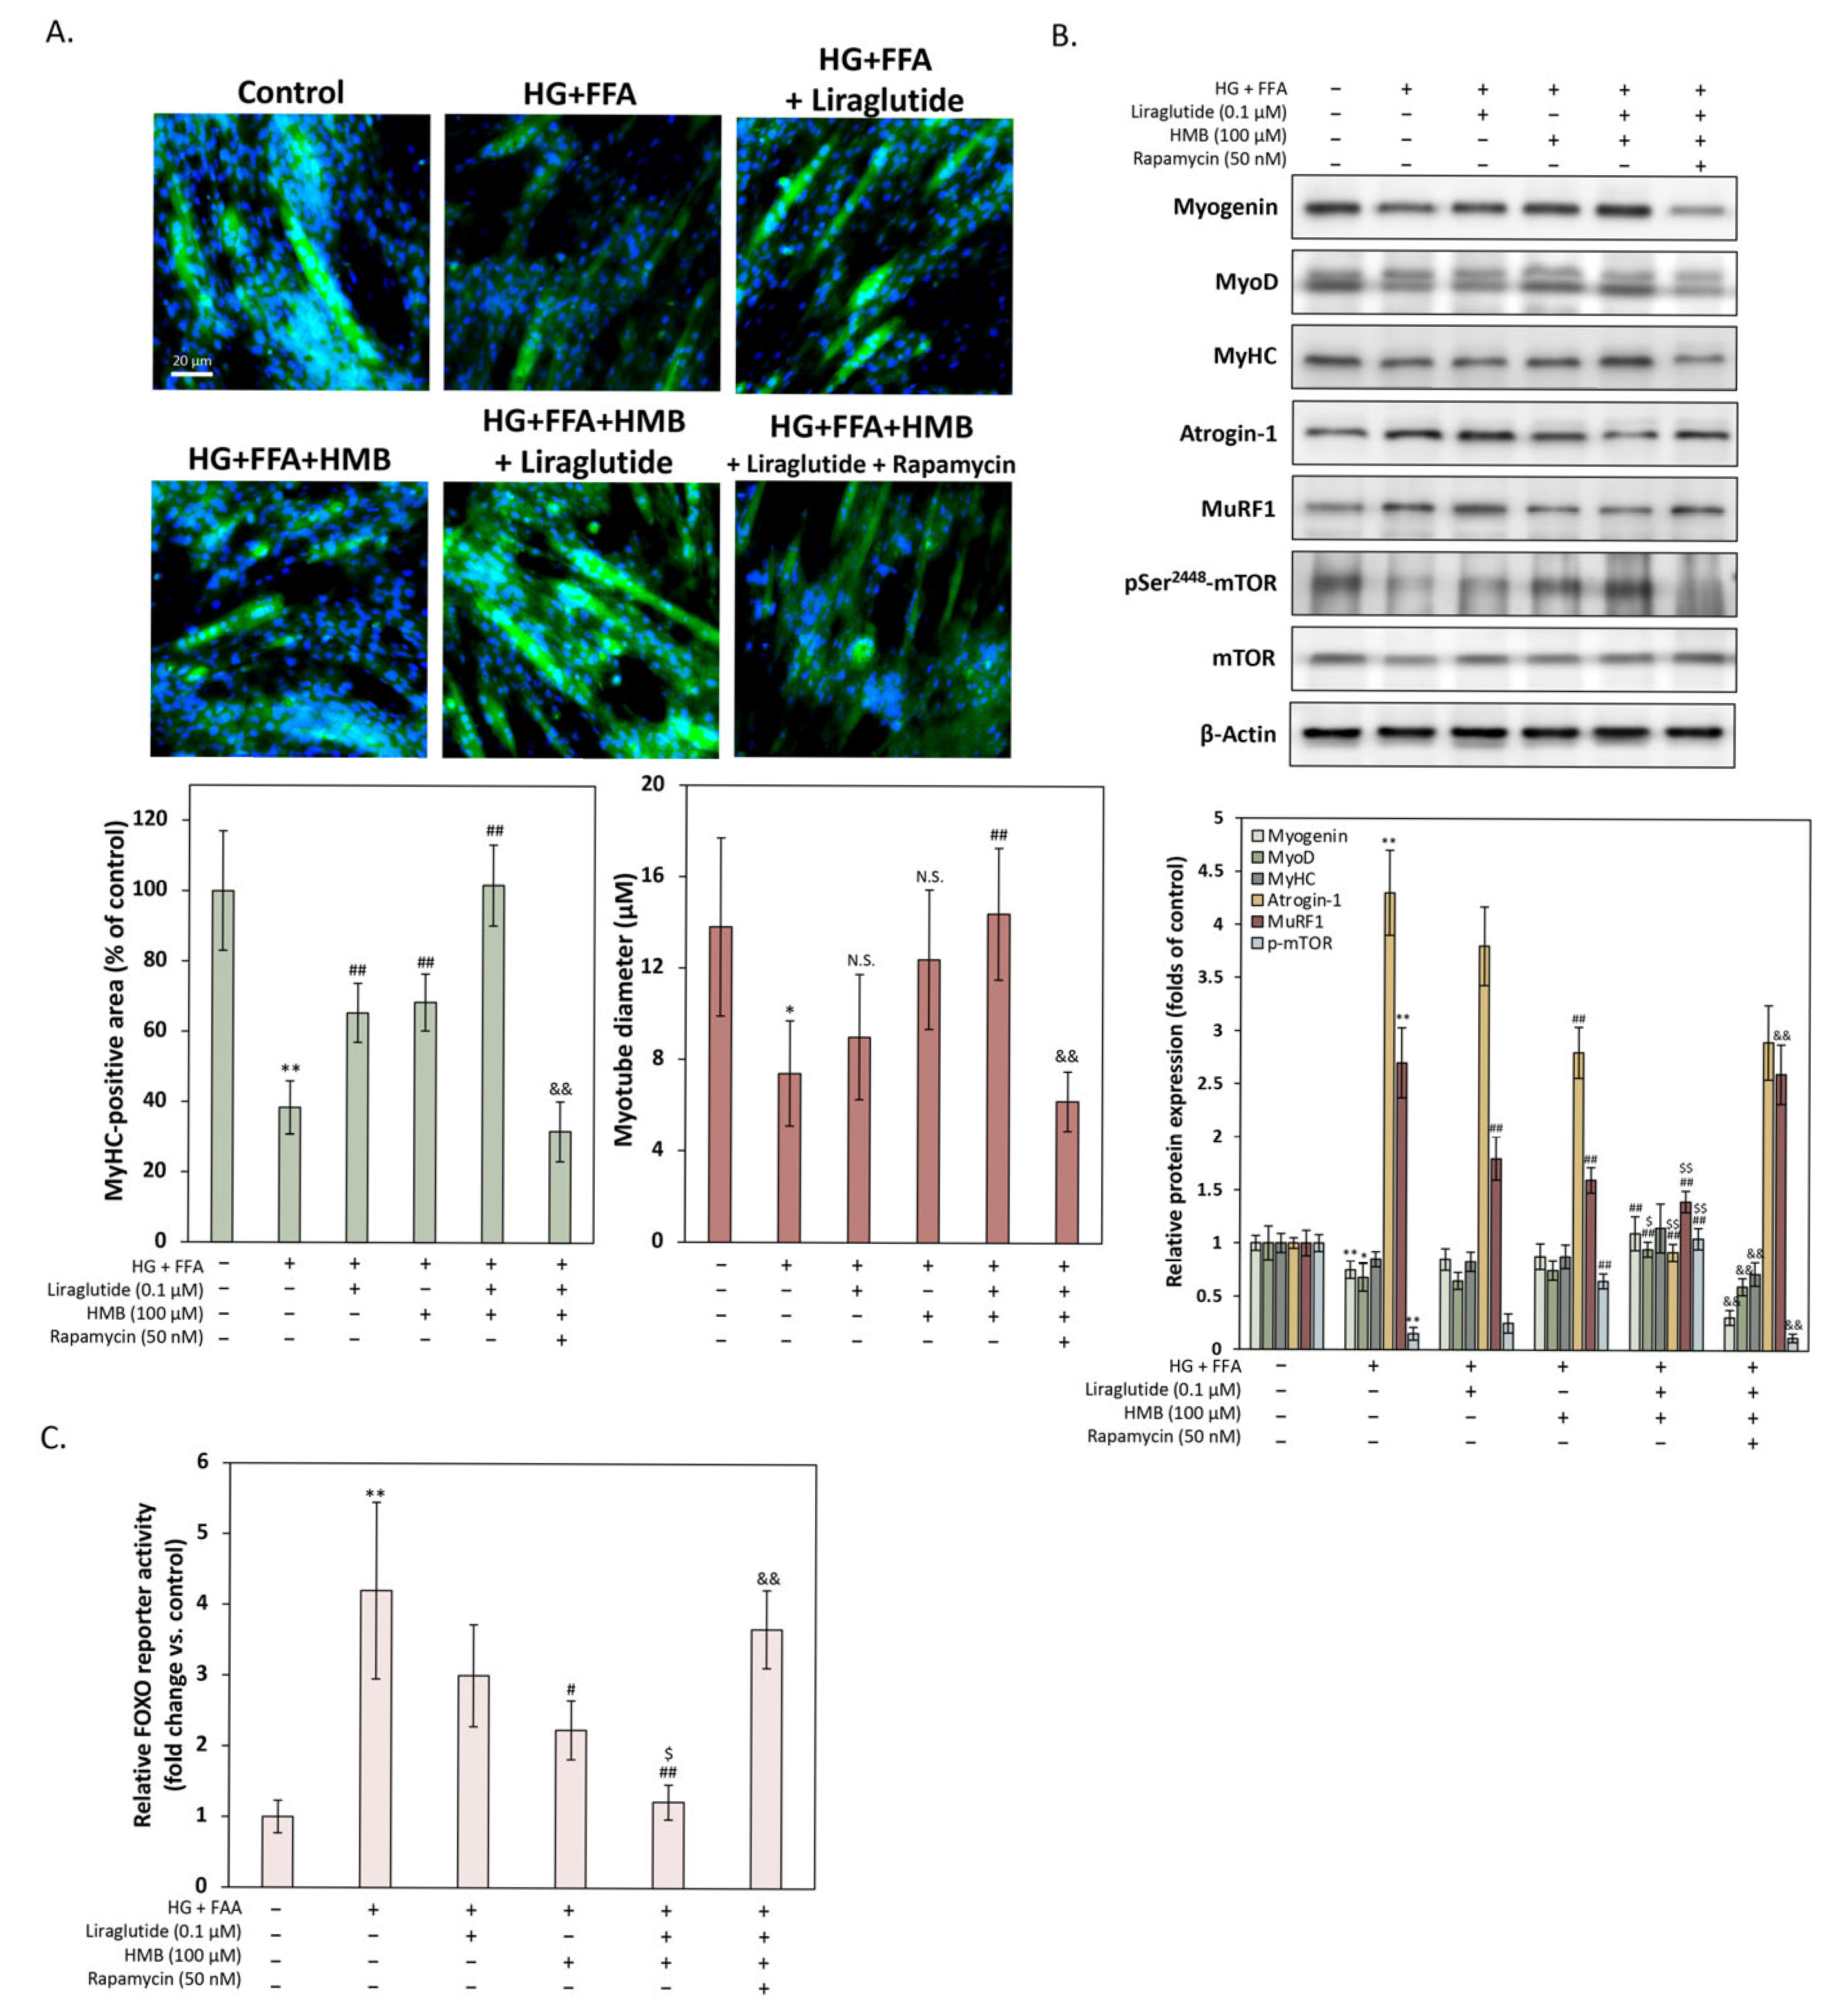
Mechanistically, a simplified interpretation of the present findings is that liraglutide and HMB exert complementary but convergent protective effects under HG+FFA-induced stress. Liraglutide appeared to act primarily on the metabolic component of injury by reducing lipid burden and improving insulin-related signaling, whereas HMB appeared to act more directly on the structural and anti-catabolic component by preserving myotube morphology and myogenic markers. When combined, these upstream effects may converge on the Akt/mTOR–FOXO regulatory axis, resulting in stronger preservation of the myotube phenotype and suppression of atrophy-related signaling. The finding that rapamycin largely attenuated these protective effects suggests that mTOR-associated signaling is a key downstream integration point required for the final muscle-preserving response. In this regulatory axis, HG+FFA impairs insulin-related anabolic signaling, thereby relieving the inhibitory constraint on FOXO-dependent catabolic transcription. In skeletal muscle, Akt functions as a central downstream effector of PI3K and suppresses atrophic signaling by phosphorylating FOXO transcription factors, which promotes their cytoplasmic retention and limits transcription of atrogenes such as atrogin-1 and MuRF1 [
30]. In parallel, Akt positively regulates mTOR signaling to sustain protein synthesis and myogenic maintenance [
31]. Thus, under lipotoxic and insulin-resistant conditions, reduced Akt activity is expected to simultaneously weaken mTOR-driven anabolic signaling and enhance FOXO-mediated catabolic transcription, thereby shifting muscle cells toward an atrophic state. Recent reviews have highlighted this coordinated PI3K/Akt/mTOR–FOXO network as a major regulatory hub governing skeletal muscle growth and atrophy under metabolic stress [
2]. In this context, our data are highly consistent with the proposed pathway model. Combined HMB and liraglutide treatment restored Akt signaling, preserved myogenic markers, suppressed atrogin-1 and MuRF1 expression, and markedly reduced FOXO reporter activity, whereas rapamycin largely reversed these protective effects. These findings indicate that the complementary relationship between liraglutide and HMB should be understood as distinct upstream contributions that ultimately depend, at least in part, on a shared mTOR-associated anabolic pathway, rather than as two completely independent downstream mechanisms. Further studies are needed to clarify the precise interplay among Akt, mTOR, and FOXO in mediating these protective effects in diabetic muscle.
While this study provides valuable insights into the combination of liraglutide and HMB, there are several limitations to consider. First, the use of C2C12 myotube cells in this study, while informative, does not fully replicate the human muscle environment. In vivo studies using diabetic animal models and long-term clinical trials in T2D patients with sarcopenia are necessary to confirm the effectiveness of this combination therapy. In addition, obesity without overt T2D may represent a distinct metabolic condition in which skeletal muscle is exposed predominantly to lipotoxic stress without sustained glucotoxicity. Although the present study focused on T2D-associated glucolipotoxic stress using combined high-glucose and FFA exposure, future studies should evaluate the effects of GLP-1 receptor agonists with or without HMB under FFA-induced lipotoxic conditions alone. This approach would help determine whether HMB can also preserve skeletal muscle integrity during GLP-1 receptor agonist treatment in the context of obesity-associated sarcopenia independent of hyperglycemic stress. Second, while we observed that HMB improved muscle differentiation and preserved muscle markers, further investigation is needed to understand the dose–response relationship and the mechanisms by which HMB enhances muscle regeneration in the context of T2D. Third, while liraglutide’s effects on fat mass are well-documented, its long-term impact on muscle strength in sarcopenic patients remains to be explored. Further research should investigate whether other muscle-preserving agents combined with liraglutide can reduce the adverse effects on muscle mass. Additionally, another limitation of the present study is that the HG+FFA condition used here may better represent an acute and intensified metabolic/lipotoxic stress rather than the chronic, lower-grade metabolic derangement observed in clinical T2D. The use of 55 mM glucose plus 0.25 mM FFAs for 24 h was selected to establish a reproducible sublethal model that could induce robust lipid accumulation and early metabolic and atrophic alterations while avoiding substantial cytotoxicity or overt structural disruption of differentiated myotubes. Therefore, although this model is useful for evaluating early protective responses against diabetic-like lipotoxic stress, it does not fully recapitulate the long-term metabolic environment of T2D-associated sarcopenia. Future studies using lower glucose and FFA concentrations with longer exposure durations, together with chronic in vivo models and clinical investigations, will be needed to validate the translational relevance of these findings and to define appropriate dosing and treatment strategies.




 ,
,