Sex-Specific Effects of Menaquinone-7 (MK-7) Supplementation on Body Composition and Adiposity Markers

 ,
, 
Highlights
- Lower vitamin K status was associated with higher BMI, fat mass, and visceral adiposity—a novel finding linking vitamin K status to fat metabolism.
- One year of menaquinone-7 supplementation reduced BMI and improved body composition markers in the absence of any lifestyle intervention.
- Women benefited more from MK-7 supplementation, demonstrating greater body-composition improvements than men.
Abstract
1. Introduction
2. Methods
2.1. Study Population
2.2. Compliance
2.3. Study Design
2.4. Biomarkers
2.5. Blood Sampling
2.6. Anthropometrics
2.7. Total Body Scan with DXA
2.8. Statistical Analyses
3. Results
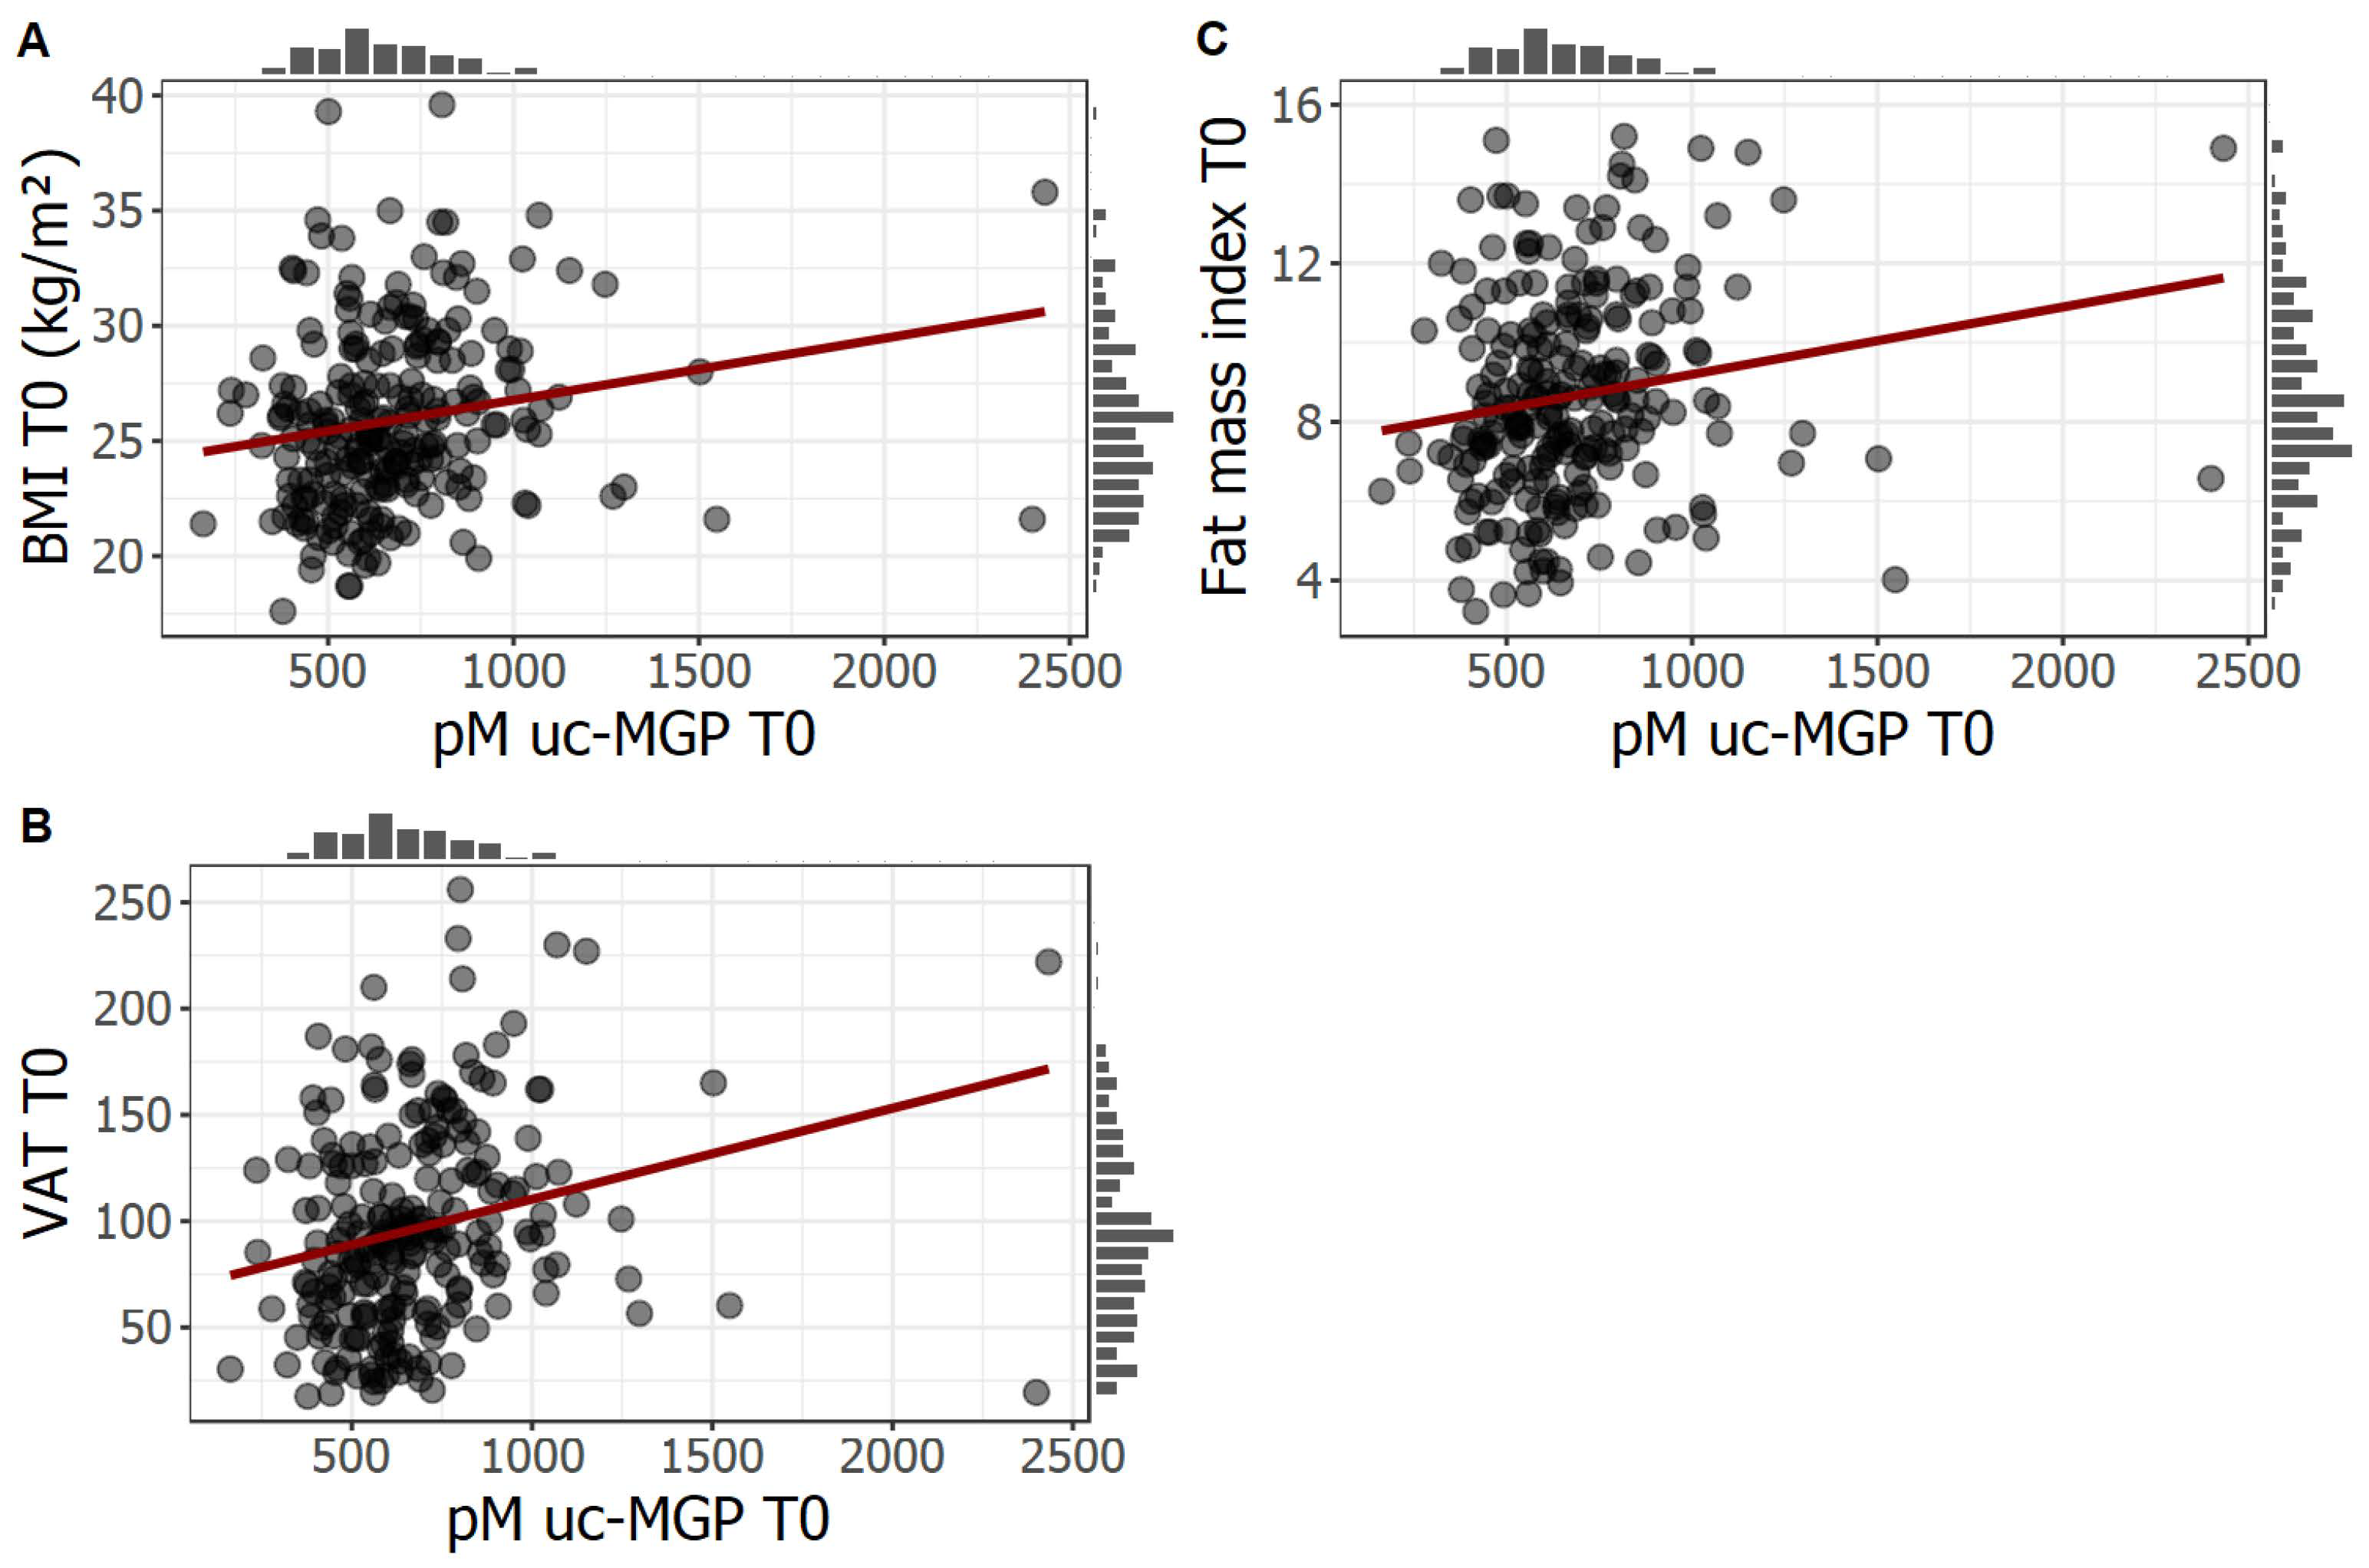
3.1. Poor Vitamin K Status Is Positively Correlated with BMI, VAT and Fat Mass Index at Baseline
3.2. MK-7 Supplementation Decreases BMI
3.3. Women, Especially Pre+Perimenopausal Women Benefit from MK-7 Supplementation
3.4. MK-7 Supplementation Responders Show Significant Increases in Their Body Composition Markers
3.5. Predominantly Women Are Responders and Benefit in Their Body Composition with MK-7 Supplementation
4. Discussion
5. Conclusions
Author Contributions
Funding
Institutional Review Board Statement
Informed Consent Statement
Data Availability Statement
Acknowledgments
Conflicts of Interest
Abbreviations
| MK-7 | Menaquinone-7 |
| MK | Menaquinone |
| VAT | Visceral adipose tissue |
| BMI | Body Mass Index |
| CVD | Cardiovascular Disease |
| MGP | Matrix Gla Protein |
| VKDP | Vitamin K dependent Protein |
| OC | Osteocalcin |
| dp-ucMGP | dephosphorylated-uncarboxylated Matrix Gla Protein |
| FMI | Fat Mass Index |
| FFMI | Fat free mass index |
| DXA | X-ray absorptiometry |
| ANOVA | Analysis of Variance |
| SI | Stiffness Index |
| FSP1 | Ferroptosis Supressing Protein 1 |
| NRF2 | Nuclear factor Erythroid 2 -like2 |
| ROS | Reactive Oxygen Species |
References
- Zhang, Y.; Liu, L.; Wei, C.; Wang, X.; Li, R.; Xu, X.; Zhang, Y.; Geng, G.; Dang, K.; Ming, Z.; et al. Vitamin K2 supplementation improves impaired glycemic homeostasis and insulin sensitivity for type 2 diabetes through gut microbiome and fecal metabolites. BMC Med. 2023, 21, 174. [Google Scholar] [CrossRef] [PubMed]
- Zhang, Y.; Zhou, P.; Kimondo, J.W. Adiponectin and osteocalcin: Relation to insulin sensitivity. Biochem. Cell Biol. 2012, 90, 613–620. [Google Scholar] [CrossRef]
- Otani, T.; Mizokami, A.; Hayashi, Y.; Gao, J.; Mori, Y.; Nakamura, S.; Takeuchi, H.; Hirata, M. Signaling pathway for adiponectin expression in adipocytes by osteocalcin. Cell. Signal. 2015, 27, 532–544. [Google Scholar] [CrossRef] [PubMed]
- Rønn, S.H.; Harsløf, T.; Pedersen, S.B.; Langdahl, B.L. Vitamin K2 (menaquinone-7) increases plasma adiponectin but does not affect insulin sensitivity in postmenopausal women: A randomized controlled trial. Eur. J. Clin. Nutr. 2021, 75, 1661–1667. [Google Scholar] [CrossRef]
- Li, Y.; Chen, J.P.; Duan, L.; Li, S. Effect of vitamin K2 on type 2 diabetes mellitus: A review. Diabetes Res. Clin. Pract. 2018, 136, 39–51. [Google Scholar] [CrossRef]
- O’Connor, E.M.; Durack, E. Osteocalcin: The extra-skeletal role of a vitamin K-dependent protein in glucose metabolism. J. Nutr. Intermed. Metab. 2017, 7, 8–13. [Google Scholar] [CrossRef]
- Rasekhi, H.; Karandish, M.; Jalali, M.T.; Mohammad-Shahi, M.; Zarei, M.; Saki, A.; Shahbazian, H. The effect of vitamin K1 supplementation on sensitivity and insulin resistance via osteocalcin in prediabetic women: A double-blind randomized controlled clinical trial. Eur. J. Clin. Nutr. 2015, 69, 891–895. [Google Scholar] [CrossRef]
- Su, X.; Wang, W.; Fang, C.; Ni, C.; Zhou, J.; Wang, X.; Zhang, L.; Xu, X.; Cao, R.; Lang, H.; et al. Vitamin K2 Alleviates Insulin Resistance in Skeletal Muscle by Improving Mitochondrial Function Via SIRT1 Signaling. Antioxid. Redox Signal. 2021, 34, 99–117. [Google Scholar] [CrossRef] [PubMed]
- Tang, H.; Zheng, Z.; Wang, H.; Wang, L.; Zhao, G.; Wang, P. Vitamin K2 Modulates Mitochondrial Dysfunction Induced by 6-Hydroxydopamine in SH-SY5Y Cells via Mitochondrial Quality-Control Loop. Nutrients 2022, 14, 1504. [Google Scholar] [CrossRef]
- Zhao, P.; Yang, W.; Xiao, H.; Zhang, S.; Gao, C.; Piao, H.; Liu, L.; Li, S. Vitamin K2 protects mice against non-alcoholic fatty liver disease induced by high-fat diet. Sci. Rep. 2024, 14, 3075. [Google Scholar] [CrossRef]
- Knapen, M.H.J.; Jardon, K.M.; Vermeer, C. Vitamin K-induced effects on body fat and weight: Results from a 3-year vitamin K2 intervention study. Eur. J. Clin. Nutr. 2018, 72, 136–141. [Google Scholar] [CrossRef]
- Qu, Z.; Zhang, L.; Huang, W.; Zheng, S. Vitamin K2 Enhances Fat Degradation to Improve the Survival of C. elegans. Front. Nutr. 2022, 9, 858481. [Google Scholar] [CrossRef] [PubMed]
- Buchwald, L.M.; Neess, D.; Hansen, D.; Doktor, T.K.; Ramesh, V.; Steffensen, L.B.; Blagoev, B.; Litchfield, D.W.; Andresen, B.S.; Ravnskjaer, K.; et al. Body weight control via protein kinase CK2: Diet-induced obesity counteracted by pharmacological targeting. Metabolism 2025, 162, 156060. [Google Scholar] [CrossRef]
- Al-Suhaimi, E.A.; Al-Jafary, M.A. Endocrine roles of vitamin K-dependent- osteocalcin in the relation between bone metabolism and metabolic disorders. Rev. Endocr. Metab. Disord. 2020, 21, 117–125. [Google Scholar] [CrossRef]
- Petsophonsakul, P.; Burgmaier, M.; Willems, B.; Heeneman, S.; Stadler, N.; Gremse, F.; Reith, S.; Burgmaier, K.; Kahles, F.; Marx, N.; et al. Nicotine promotes vascular calcification via intracellular Ca2+-mediated, Nox5-induced oxidative stress, and extracellular vesicle release in vascular smooth muscle cells. Cardiovasc. Res. 2021, 118, 2196–2210. [Google Scholar] [CrossRef]
- Manna, P.; Kalita, J. Beneficial role of vitamin K supplementation on insulin sensitivity, glucose metabolism, and the reduced risk of type 2 diabetes: A review. Nutrition 2016, 32, 732–739. [Google Scholar] [CrossRef]
- de Vries, F.; Bittner, R.; Maresz, K.; Machuron, F.; Gåserød, O.; Jeanne, J.-F.; Schurgers, L.J. Effects of One-Year Menaquinone-7 Supplementation on Vascular Stiffness and Blood Pressure in Post-Menopausal Women. Nutrients 2025, 17, 815. [Google Scholar] [CrossRef]
- Vermeer, C.; Vik, H. Effect of Menaquinone-7 (vitamin K2) on vascular elasticity in healthy subjects: Results from a one-year study. Vasc. Dis. Ther. 2020, 5, 815. [Google Scholar] [CrossRef]
- Cranenburg, E.C.M.; Koos, R.; Schurgers, L.J.; Magdeleyns, E.J.; Schoonbrood, T.H.M.; Landewé, R.B.; Brandenburg, V.M.; Bekers, O.; Vermeer, C. Characterisation and potential diagnostic value of circulating matrix Gla protein (MGP) species. Thromb. Haemost. 2010, 104, 811–822. [Google Scholar] [CrossRef]
- Tarkesh, F.; Namavar Jahromi, B.; Hejazi, N.; Tabatabaee, H. Beneficial health effects of Menaquinone-7 on body composition, glycemic indices, lipid profile, and endocrine markers in polycystic ovary syndrome patients. Food Sci. Nutr. 2020, 8, 5612–5621. [Google Scholar] [CrossRef] [PubMed]
- Karamzad, N.; Faraji, E.; Adeli, S.; Sullman, M.J.M.; Pourghassem Gargari, B. The effect of menaquinone-7 supplementation on dp-ucMGP, PIVKAII, inflammatory markers, and body composition in type 2 diabetes patients: A randomized clinical trial. Nutr. Diabetes 2022, 12, 15. [Google Scholar] [CrossRef]
- Sun, Y. Effects of 12-Week Multiple Micronutrient Supplementation on Immune Function, Body Weight, and Metabolic Parameters in Middle-Aged Women: A Retrospective Study. Cureus 2025, 17, e92449. [Google Scholar] [CrossRef]
- Knapen, M.H.J.; Braam, L.A.J.L.M.; Drummen, N.E.; Bekers, O.; Hoeks, A.P.G.; Vermeer, C. Menaquinone-7 supplementation improves arterial stiffness in healthy postmenopausal women: A double-blind randomised clinical trial. Thromb. Haemost. 2015, 113, 1135–1144. [Google Scholar] [CrossRef] [PubMed]
- Ravera, M.; Nickolas, T.; Plebani, M.; Iervasi, G.; Aghi, A.; Khairallah, P.; Gallieni, M.; Mereu, M.C.; Giannini, S.; Sella, S.; et al. Overweight-obesity is associated with decreased vitamin K2 levels in hemodialysis patients. Clin. Chem. Lab. Med. CCLM 2021, 59, 581–589. [Google Scholar] [CrossRef]
- Lauridsen, J.A.; Leth-Møller, K.B.; Møllehave, L.T.; Kårhus, L.L.; Dantoft, T.M.; Kofoed, K.F.; Linneberg, A. Investigating the associations between uncarboxylated matrix gla protein as a proxy for vitamin K status and cardiovascular disease risk factors in a general adult population. Eur. J. Nutr. 2024, 64, 17. [Google Scholar] [CrossRef]
- Li, C.; Li, J.; He, F.; Li, K.; Li, X.; Zhang, Y. Matrix Gla protein regulates adipogenesis and is serum marker of visceral adiposity. Adipocyte 2020, 9, 68–76. [Google Scholar] [CrossRef]
- Shea, M.K.; Booth, S.L.; Gundberg, C.M.; Peterson, J.W.; Waddell, C.; Dawson-Hughes, B.; Saltzman, E. Adulthood Obesity Is Positively Associated with Adipose Tissue Concentrations of Vitamin K and Inversely Associated with Circulating Indicators of Vitamin K Status in Men and Women. J. Nutr. 2010, 140, 1029–1034. [Google Scholar] [CrossRef]
- Santos, E.A.D.; Giudici, K.V.; França, N.A.G.D.; Peters, B.S.E.; Fisberg, R.M.; Martini, L.A. Correlations among vitamin K intake, body fat, lipid profile and glucose homeostasis in adults and the elderly. Arch. Endocrinol. Metab. 2020, 64, 436–444. [Google Scholar] [CrossRef]
- Adeli, S.; Gargari, B.P.; Karamzad, N. The Effects of Vitamin K2 (Menaquinone-7) on the Leptin and Adiponectin Levels in Overweight/Obese Type 2 Diabetes Patients: A Randomized Clinical Trial. Pharm. Sci. 2022, 29, 346–354. [Google Scholar] [CrossRef]
- Fagerberg, L.; Hallström, B.M.; Oksvold, P.; Kampf, C.; Djureinovic, D.; Odeberg, J.; Habuka, M.; Tahmasebpoor, S.; Danielsson, A.; Edlund, K.; et al. Analysis of the human tissue-specific expression by genome-wide integration of transcriptomics and antibody-based proteomics. Mol. Cell. Proteom. MCP 2014, 13, 397–406. [Google Scholar] [CrossRef] [PubMed]
- Zhang, S.; Sun, Z.; Jiang, X.; Lu, Z.; Ding, L.; Li, C.; Tian, X.; Wang, Q. Ferroptosis increases obesity: Crosstalk between adipocytes and the neuroimmune system. Front. Immunol. 2022, 13, 1049936. [Google Scholar] [CrossRef] [PubMed]
- Geleijnse, J.M.; Vermeer, C.; Grobbee, D.E.; Schurgers, L.J.; Knapen, M.H.J.; Van Der Meer, I.M.; Hofman, A.; Witteman, J.C.M. Dietary intake of menaquinone is associated with a reduced risk of coronary heart disease: The Rotterdam Study. J. Nutr. 2004, 134, 3100–3105. [Google Scholar] [CrossRef] [PubMed]


| Relative Change from Baseline (%) Parameter | Placebo N = 122 | MK-7 N = 121 | ||||
|---|---|---|---|---|---|---|
| Mean ± SD 1 | 95% CI 2 of the Mean | p 3 | Mean ± SD 1 | 95% CI 2 of the Mean | p 3 | |
| Visceral adipose tissue | −1.58 ± 19.94 | −5.21; +2.06 | 0.39 | +3.18 ± 17.88 | −0.09; +6.46 | 0.057 |
| Fat Mass | +0.80 ± 10.0 | −1.02; +2.62 | 0.39 | +0.27 ± 8.31 | −1.25; +1.79 | 0.73 |
| Lean Mass | −0.28 ± 5.69 | −1.31; +0.76 | 0.60 | −0.31 ± 2.37 | −0.75; +0.12 | 0.16 |
| Body Mass Index | −0.43 ± 4.48 | −1.25; +0.38 | 0.30 | −0.66 ± 3.45 | −1.29; −0.03 | 0.041 |
| Waist to hip ratio | −0.76 ± 5.30 | −1.73; +0.21 | 0.12 | −0.29 ± 4.72 | −1.15; +0.58 | 0.51 |
| Weight | −0.25 ± 4.28 | −1.04; +0.53 | 0.52 | −0.46 ± 3.38 | −1.08; +0.16 | 0.14 |
| Bone mineral density | −0.33 ± 5.94 | −1.42; +0.75 | 0.54 | −0.39 ± 5.18 | −1.34; +0.56 | 0.42 |
| Relative Change from Baseline (%) Parameter | Pre + Peri N = 34 | Post N = 48 | ||||
|---|---|---|---|---|---|---|
| Mean ± SD 1 | 95% CI 2 of the Mean | p3 | Mean ± SD 1 | 95% CI 2 of the Mean | p 3 | |
| Visceral adipose tissue | −0.36 ± 19.6 | −7.19; +6.45 | 0.91 | +3.73 ± 16.6 | −1.13; +8.59 | 0.13 |
| Fat Mass | −2.10 ± 7.02 | −4.55; +0.35 | 0.090 | −0.12 ± 6.61 | −2.06; +1.82 | 0.90 |
| Lean Mass | −0.54 ± 2.50 | −1.41; +0.34 | 0.22 | −0.56 ± 2.17 | −1.20; +0.08 | 0.085 |
| Body Mass Index | −1.61 ± 3.83 | −2.94; −0.27 | 0.020 | −0.66 ± 3.15 | −1.59; +0.26 | 0.16 |
| Waist to hip ratio | −1.11 ± 4.11 | −2.54; +0.33 | 0.13 | −0.46 ± 5.21 | −1.99; +1.07 | 0.55 |
| Weight | −1.36 ± 3.68 | −2.65; −0.07 | 0.039 | −0.66 ± 3.11 | −1.58; +0.25 | 0.15 |
| Bone mineral density | −0.04 ± 1.71 | −0.63; +0.56 | 0.90 | −1.03 ± 7.92 | −3.35; +1.30 | 0.38 |
| Relative Change from Baseline (%) Parameter | Non-Responders N = 63 | Responders N = 50 | ||||
|---|---|---|---|---|---|---|
| Mean ± SD 1 | 95% CI 2 of the Mean | p 3 | Mean ± SD 1 | 95% CI 2 of the Mean | p 3 | |
| Visceral adipose tissue | +7.27 ± 18.1 | +2.74; +11.9 | 0.002 | −2.34 ± 16.7 | −7.08; +2.40 | 0.33 |
| Fat Mass | +1.81 ± 9.45 | −0.57; +4.19 | 0.13 | −1.93 ± 6.44 | −3.76; −0.10 | 0.039 |
| Lean Mass | −0.25 ± 2.48 | −0.87; +0.38 | 0.43 | −0.48 ± 2.29 | −1.13; +0.18 | 0.15 |
| Body Mass Index | −0.22 ± 3.60 | −1.13; +0.69 | 0.63 | −1.37 ± 3.21 | −2.29; −0.46 | 0.004 |
| Waist to hip ratio | +0.64 ± 5.22 | −0.67; +1.96 | 0.33 | −1.43 ± 3.86 | −2.53; −0.33 | 0.012 |
| Weight | +0.05 ± 3.47 | −0.83; +0.92 | 0.91 | −1.25 ± 3.20 | −2.15; −0.34 | 0.008 |
| Bone mineral density | −0.87 ± 6.83 | −2.59; +0.85 | 0.32 | +0.29 ± 1.92 | −0.26; +0.83 | 0.30 |
| Relative Change from Baseline (%) Parameter | Men N = 13 | Women N = 37 | ||||
|---|---|---|---|---|---|---|
| Mean ± SD 1 | 95% CI 2 of the Mean | p 3 | Mean ± SD 1 | 95% CI 2 of the Mean | p 3 | |
| Visceral adipose tissue | −0.71 ± 9.26 | −6.31; +4.89 | 0.79 | −2.91 ± 18.7 | −9.14; +3.32 | 0.35 |
| Fat Mass | +0.79 ± 4.77 | −2.09; +3.67 | 0.56 | −2.89 ± 6.72 | −5.13; −0.65 | 0.013 |
| Lean Mass | +0.20 ± 2.67 | −1.42; +1.81 | 0.79 | −0.71 ± 2.14 | −1.42; +0.00 | 0.050 |
| Body Mass Index | −0.44 ± 2.52 | −1.96; +1.09 | 0.54 | −1.70 ± 3.39 | −2.83; −0.57 | 0.004 |
| Waist to hip ratio | −0.89 ± 4.36 | −3.53; +1.74 | 0.47 | −1.62 ± 3.72 | −2.86; −0.38 | 0.012 |
| Weight | +0.06 ± 2.65 | −1.54; +1.66 | 0.94 | −1.70 ± 3.28 | −2.80; −0.61 | 0.003 |
| Bone mineral density | +0.39 ± 1.60 | −0.57; +1.36 | 0.39 | +0.25 ± 2.04 | −0.43; +0.93 | 0.46 |
Disclaimer/Publisher’s Note: The statements, opinions and data contained in all publications are solely those of the individual author(s) and contributor(s) and not of MDPI and/or the editor(s). MDPI and/or the editor(s) disclaim responsibility for any injury to people or property resulting from any ideas, methods, instructions or products referred to in the content. |
© 2026 by the authors. Licensee MDPI, Basel, Switzerland. This article is an open access article distributed under the terms and conditions of the Creative Commons Attribution (CC BY) license.
Share and Cite
Bittner, R.; de Vries, F.; Machuron, F.; Maresz, K.; Gåserød, O.; Schurgers, L. Sex-Specific Effects of Menaquinone-7 (MK-7) Supplementation on Body Composition and Adiposity Markers. Nutrients 2026, 18, 1699. https://doi.org/10.3390/nu18111699
Bittner R, de Vries F, Machuron F, Maresz K, Gåserød O, Schurgers L. Sex-Specific Effects of Menaquinone-7 (MK-7) Supplementation on Body Composition and Adiposity Markers. Nutrients. 2026; 18(11):1699. https://doi.org/10.3390/nu18111699
Chicago/Turabian StyleBittner, Rudolf, Femke de Vries, Francois Machuron, Katarzyna Maresz, Olav Gåserød, and Leon Schurgers. 2026. "Sex-Specific Effects of Menaquinone-7 (MK-7) Supplementation on Body Composition and Adiposity Markers" Nutrients 18, no. 11: 1699. https://doi.org/10.3390/nu18111699
APA StyleBittner, R., de Vries, F., Machuron, F., Maresz, K., Gåserød, O., & Schurgers, L. (2026). Sex-Specific Effects of Menaquinone-7 (MK-7) Supplementation on Body Composition and Adiposity Markers. Nutrients, 18(11), 1699. https://doi.org/10.3390/nu18111699