
Assessing the Impact of Removable Prosthetic Restorations on Nutritional Habits in Edentulous Patients Following Surgery for Head and Neck Cancer


Abstract
1. Introduction
2. Materials and Methods
3. Results
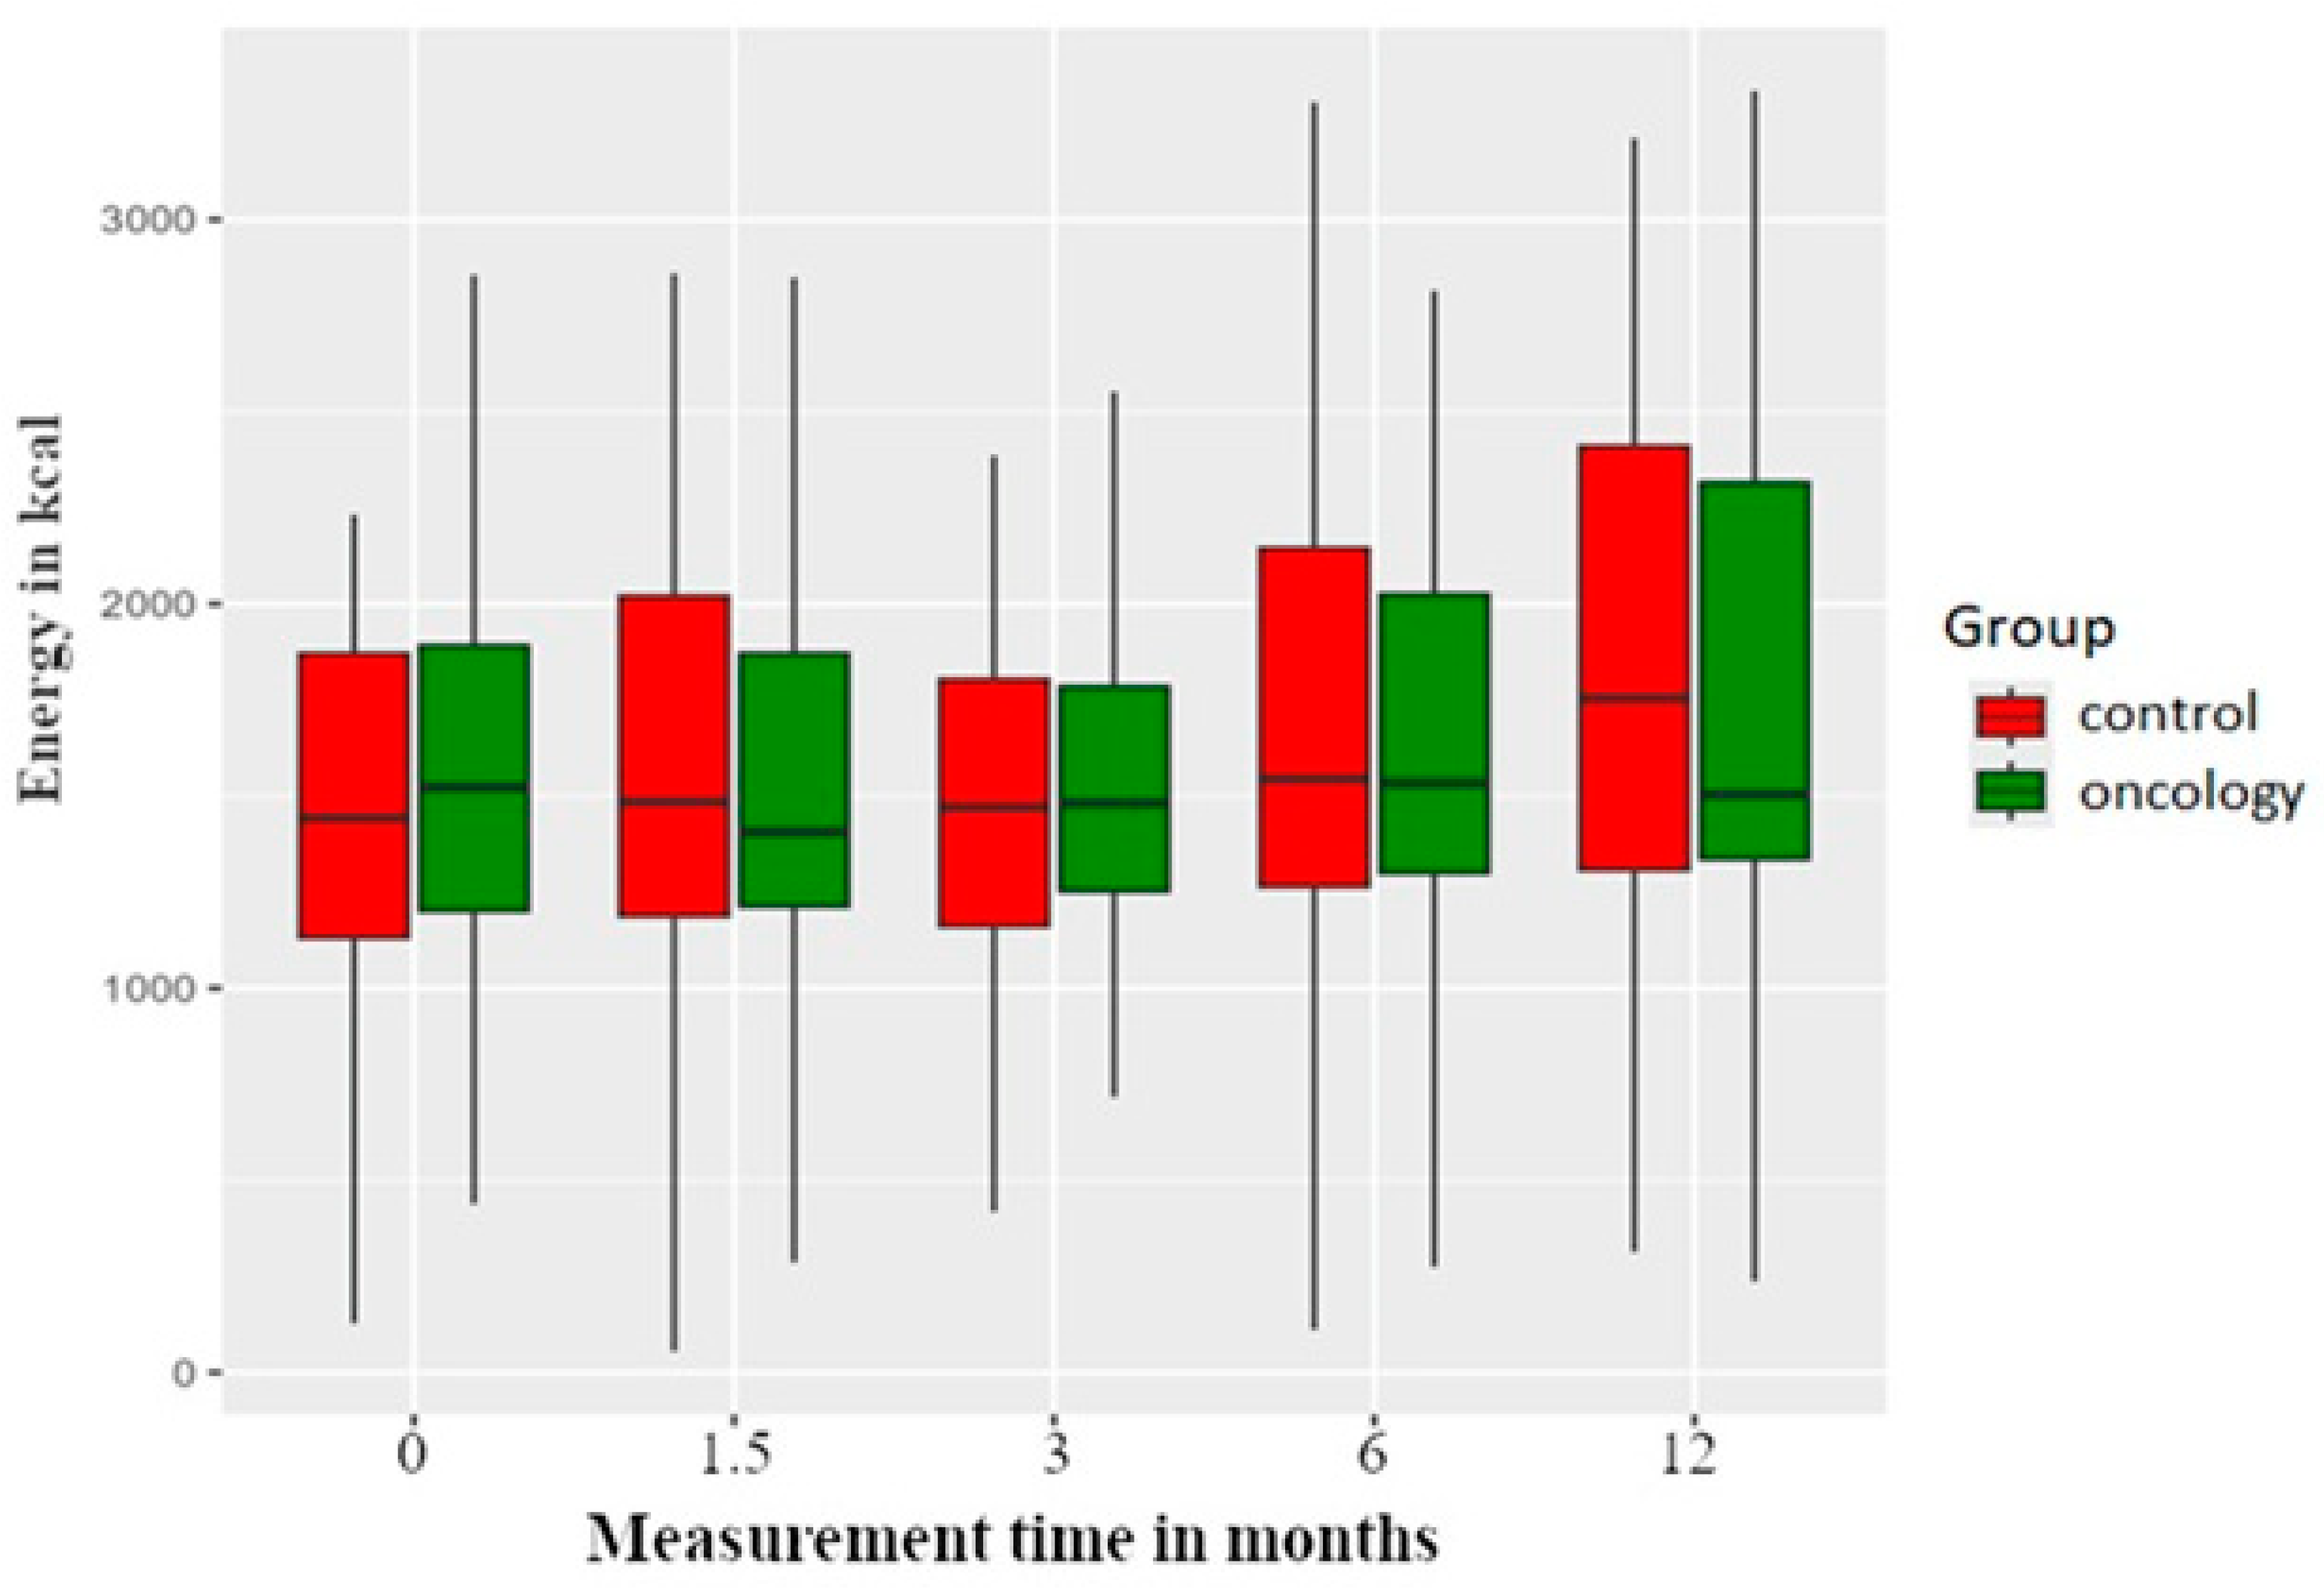
3.1. Energy Value
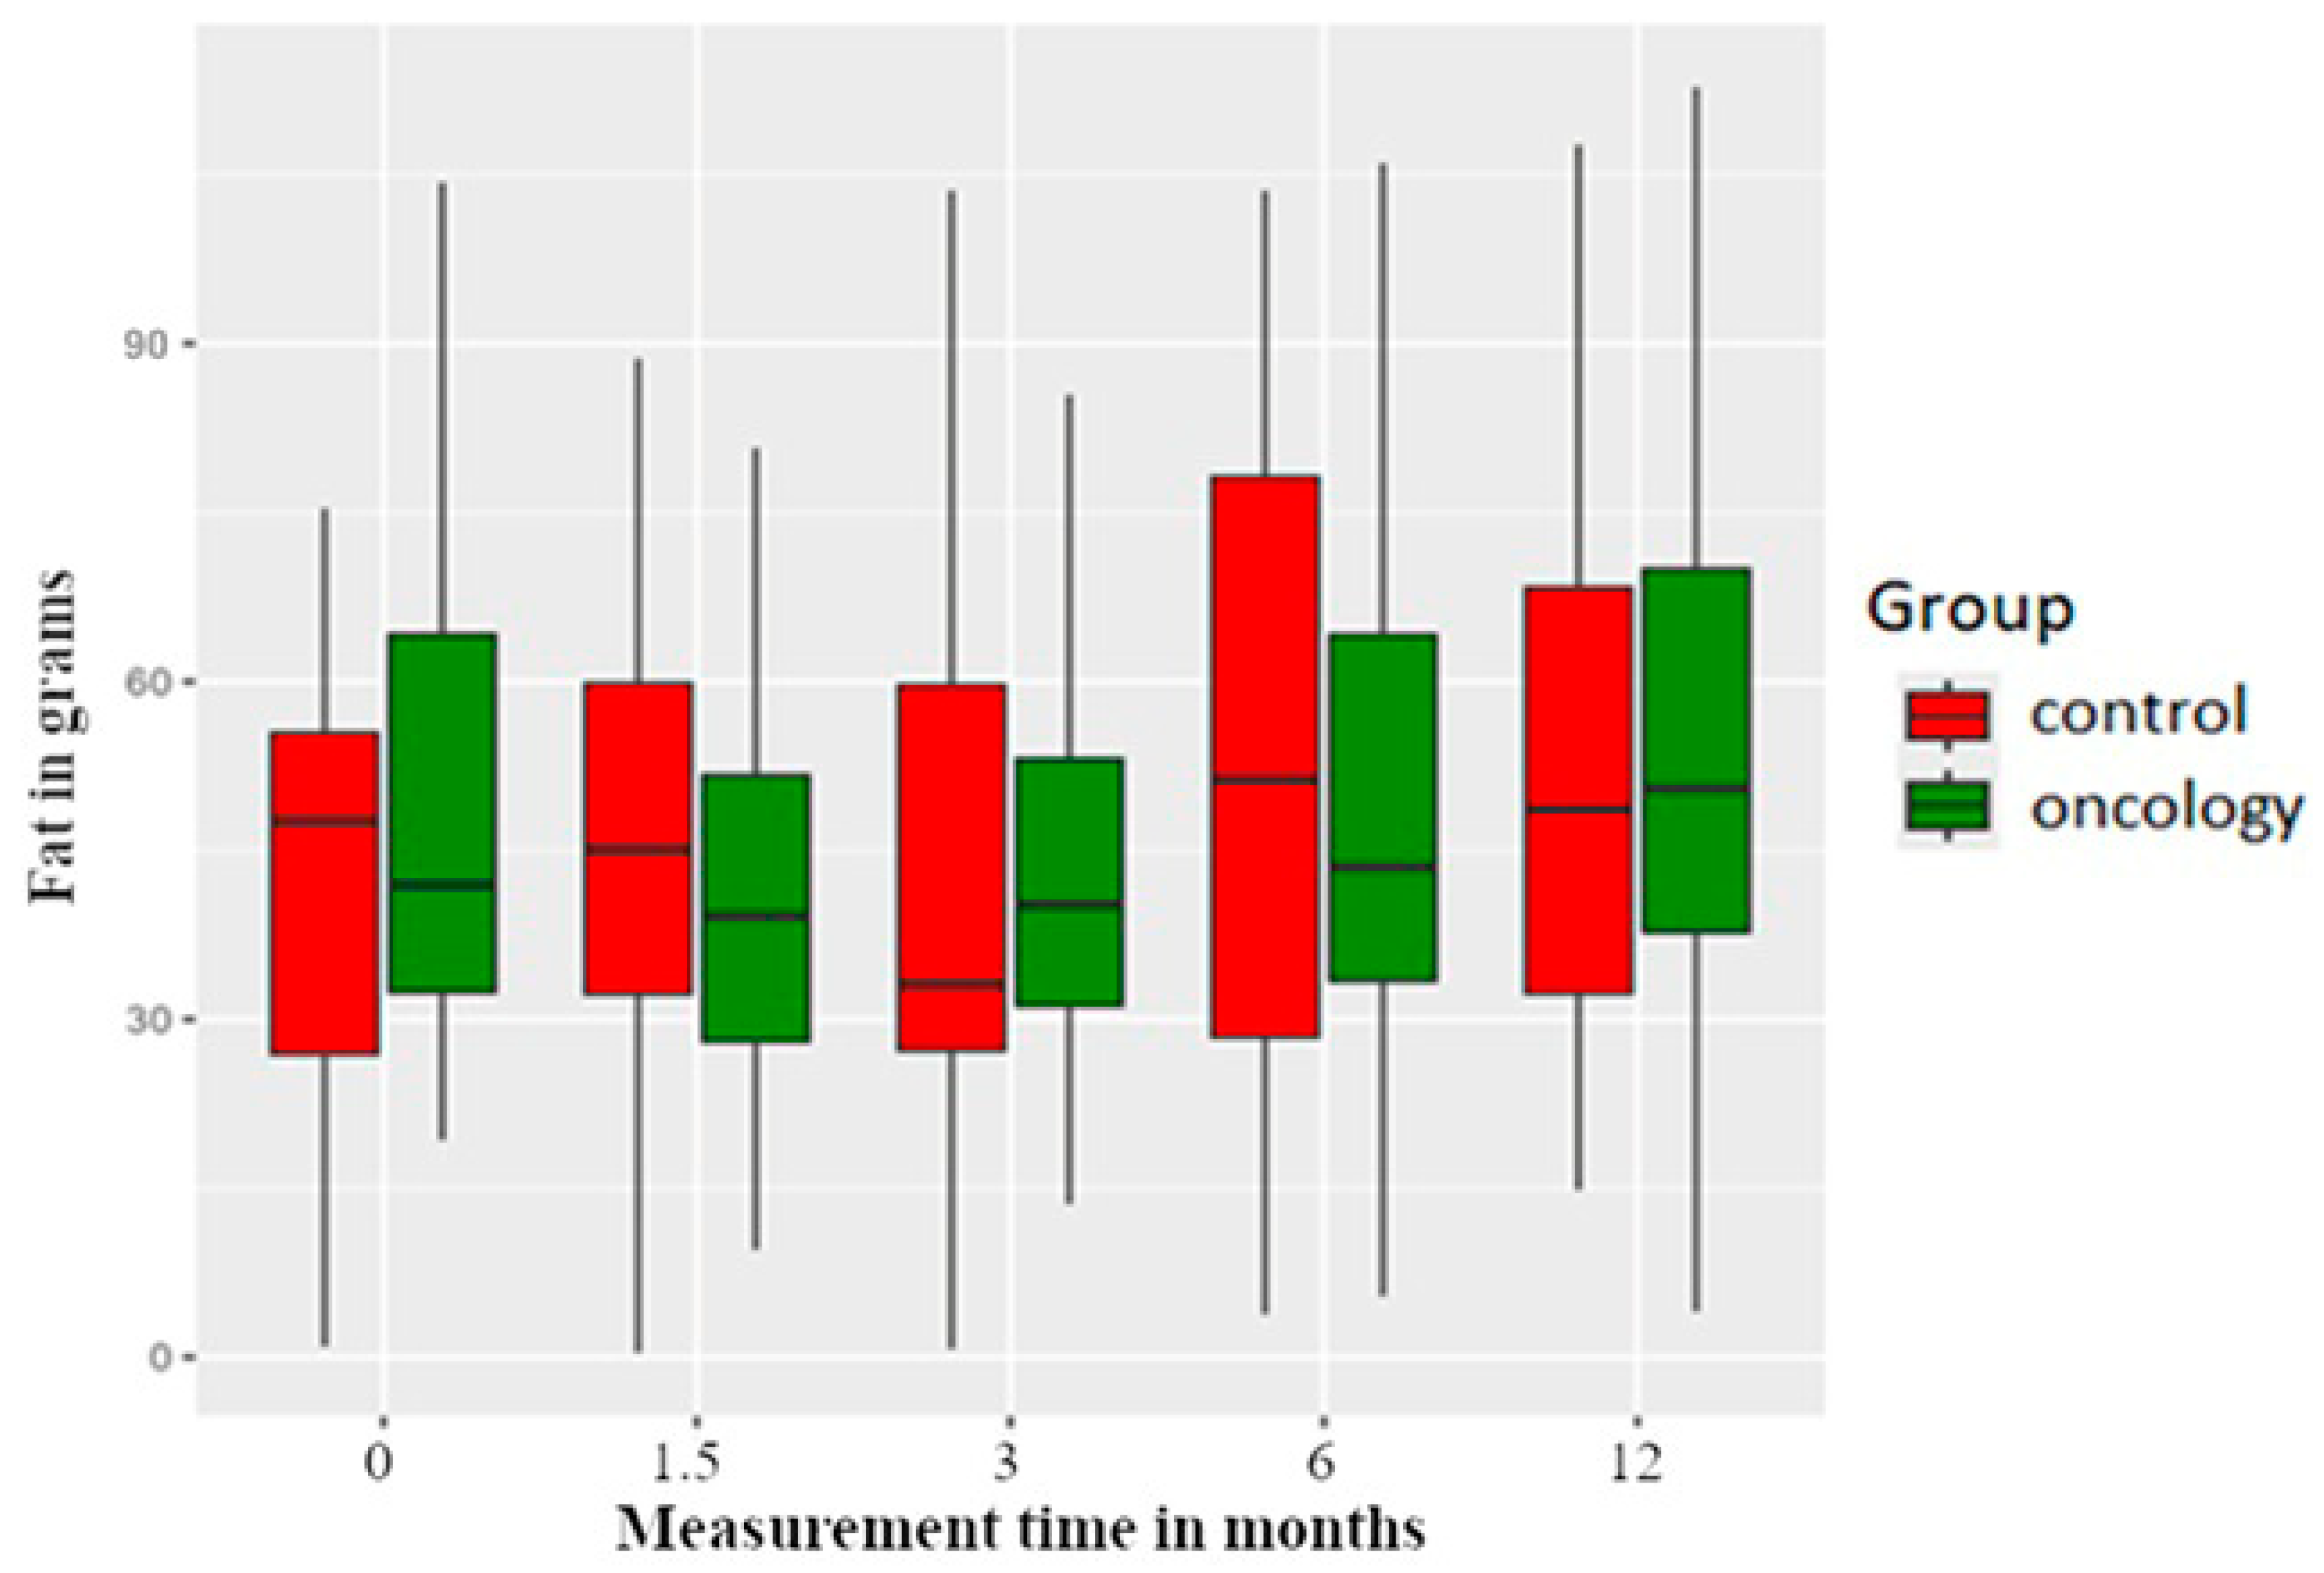
3.2. Macronutrients
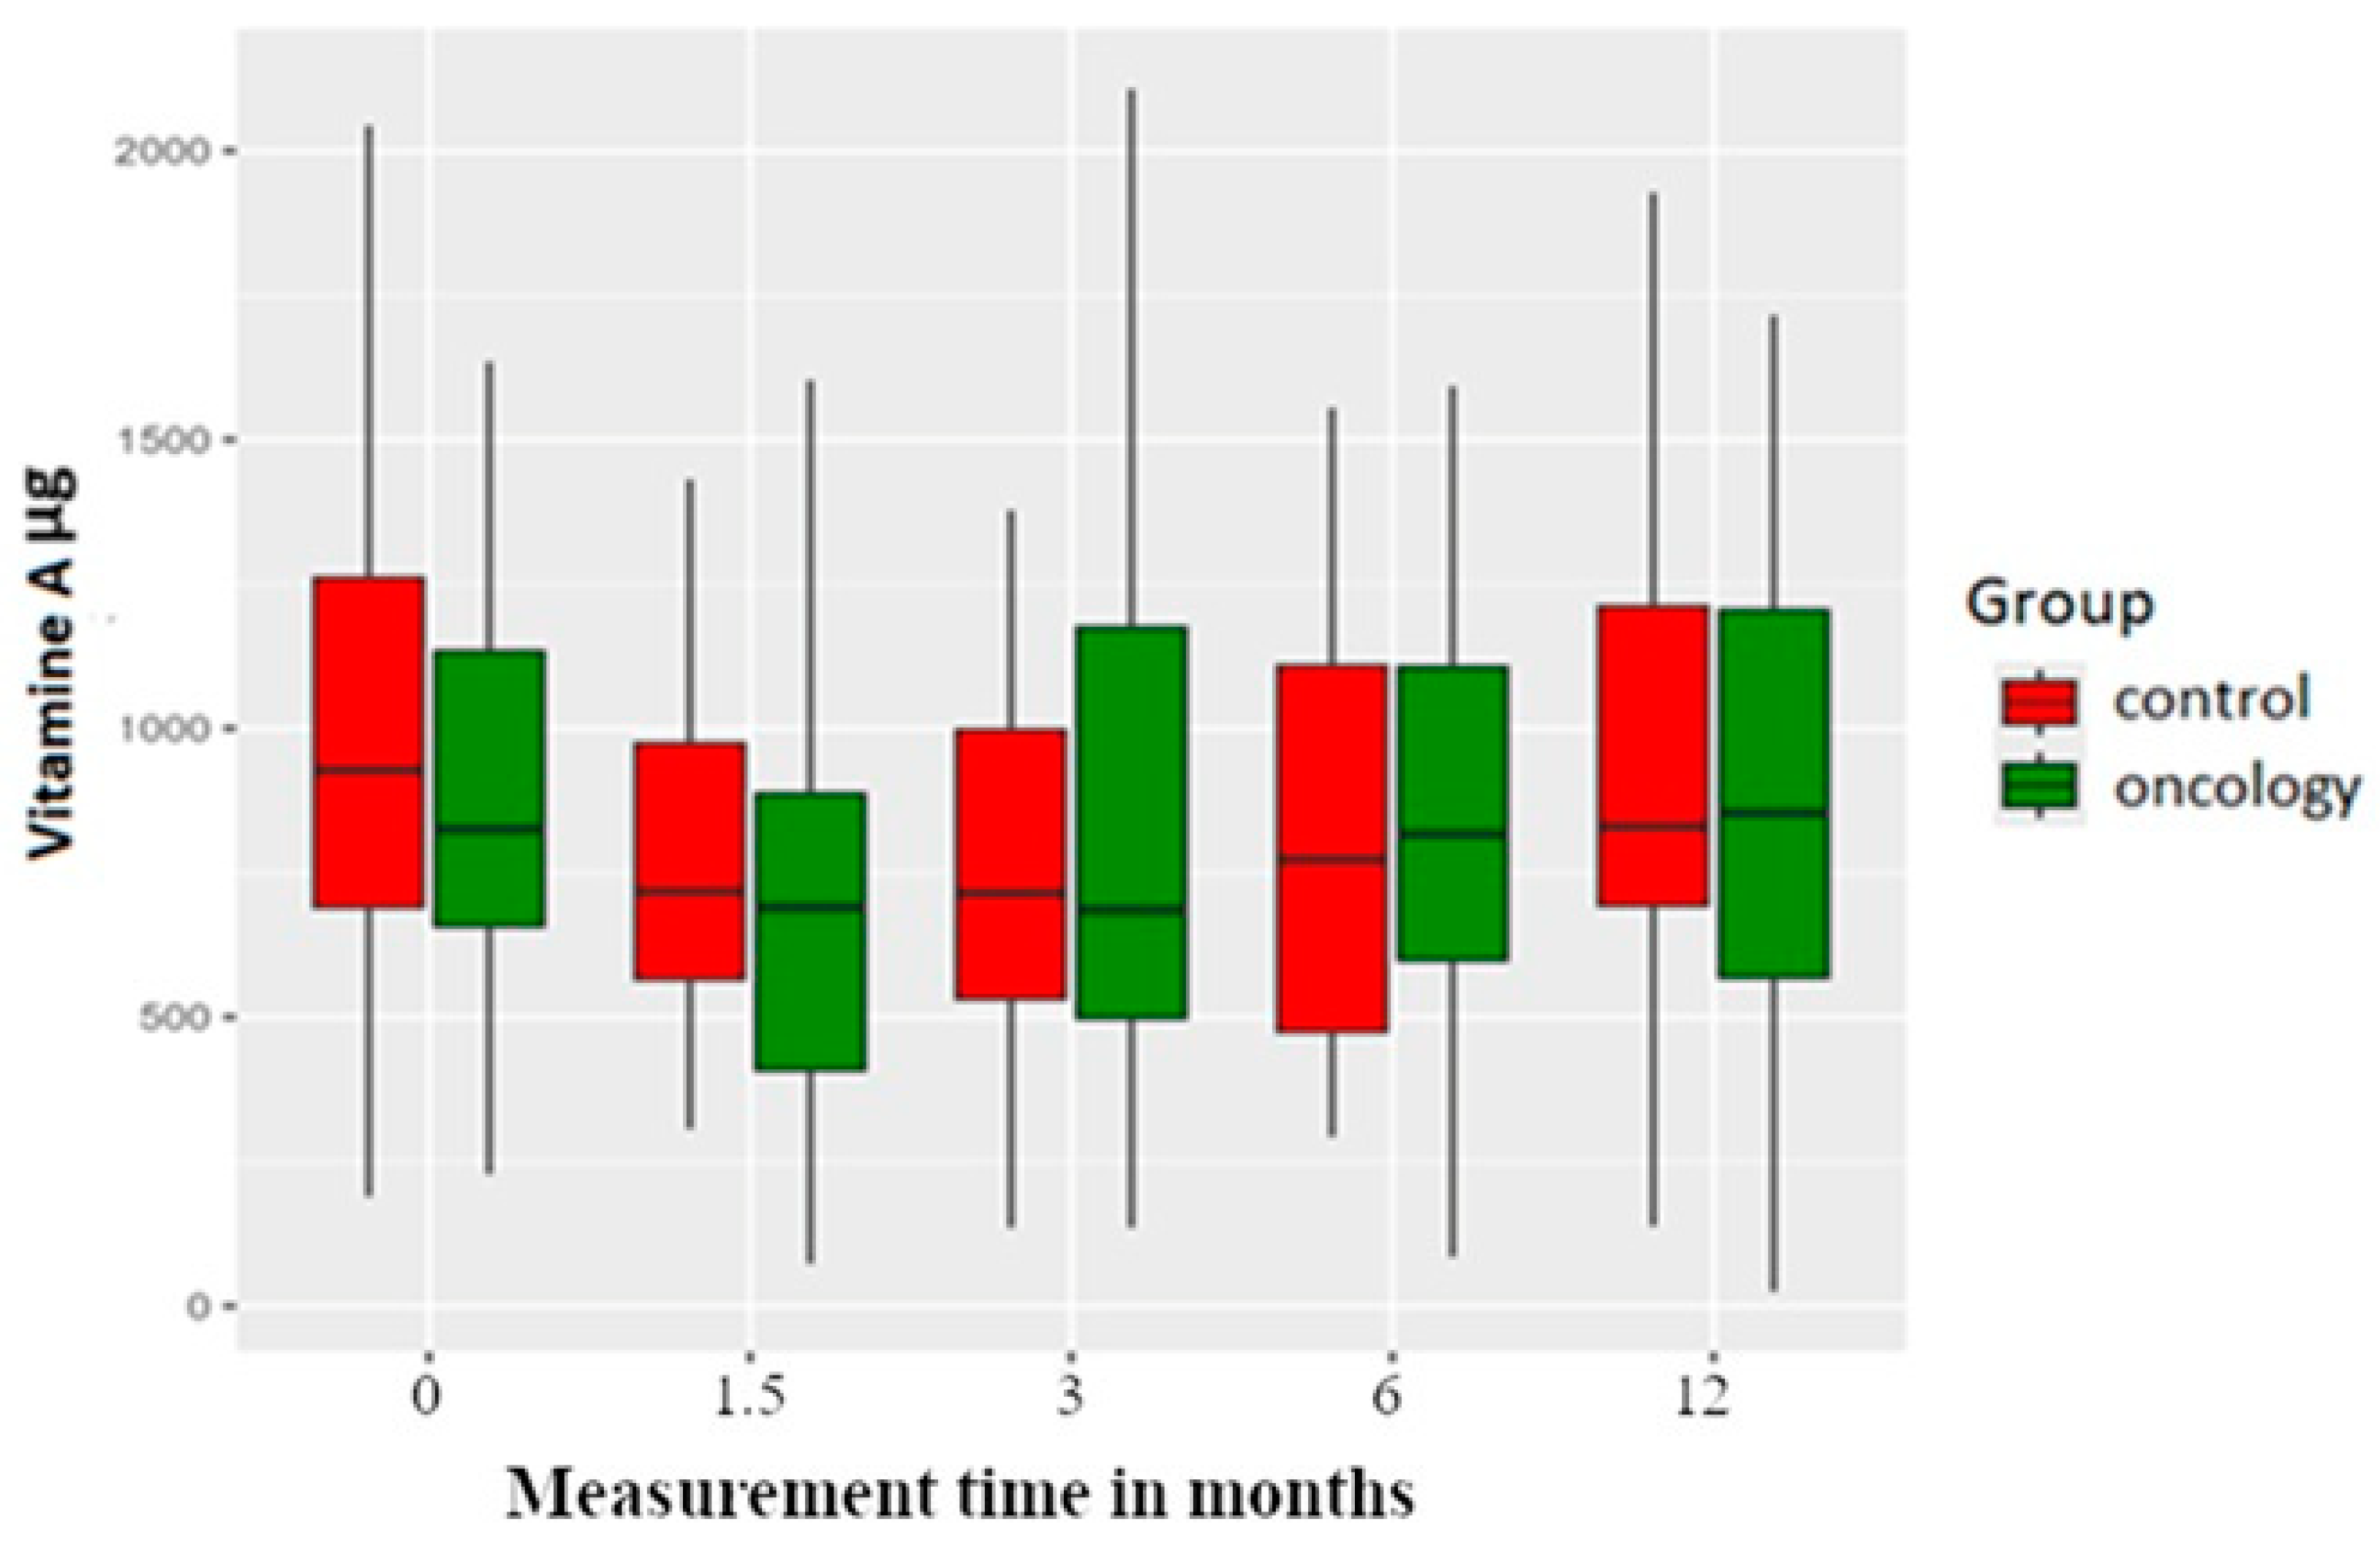
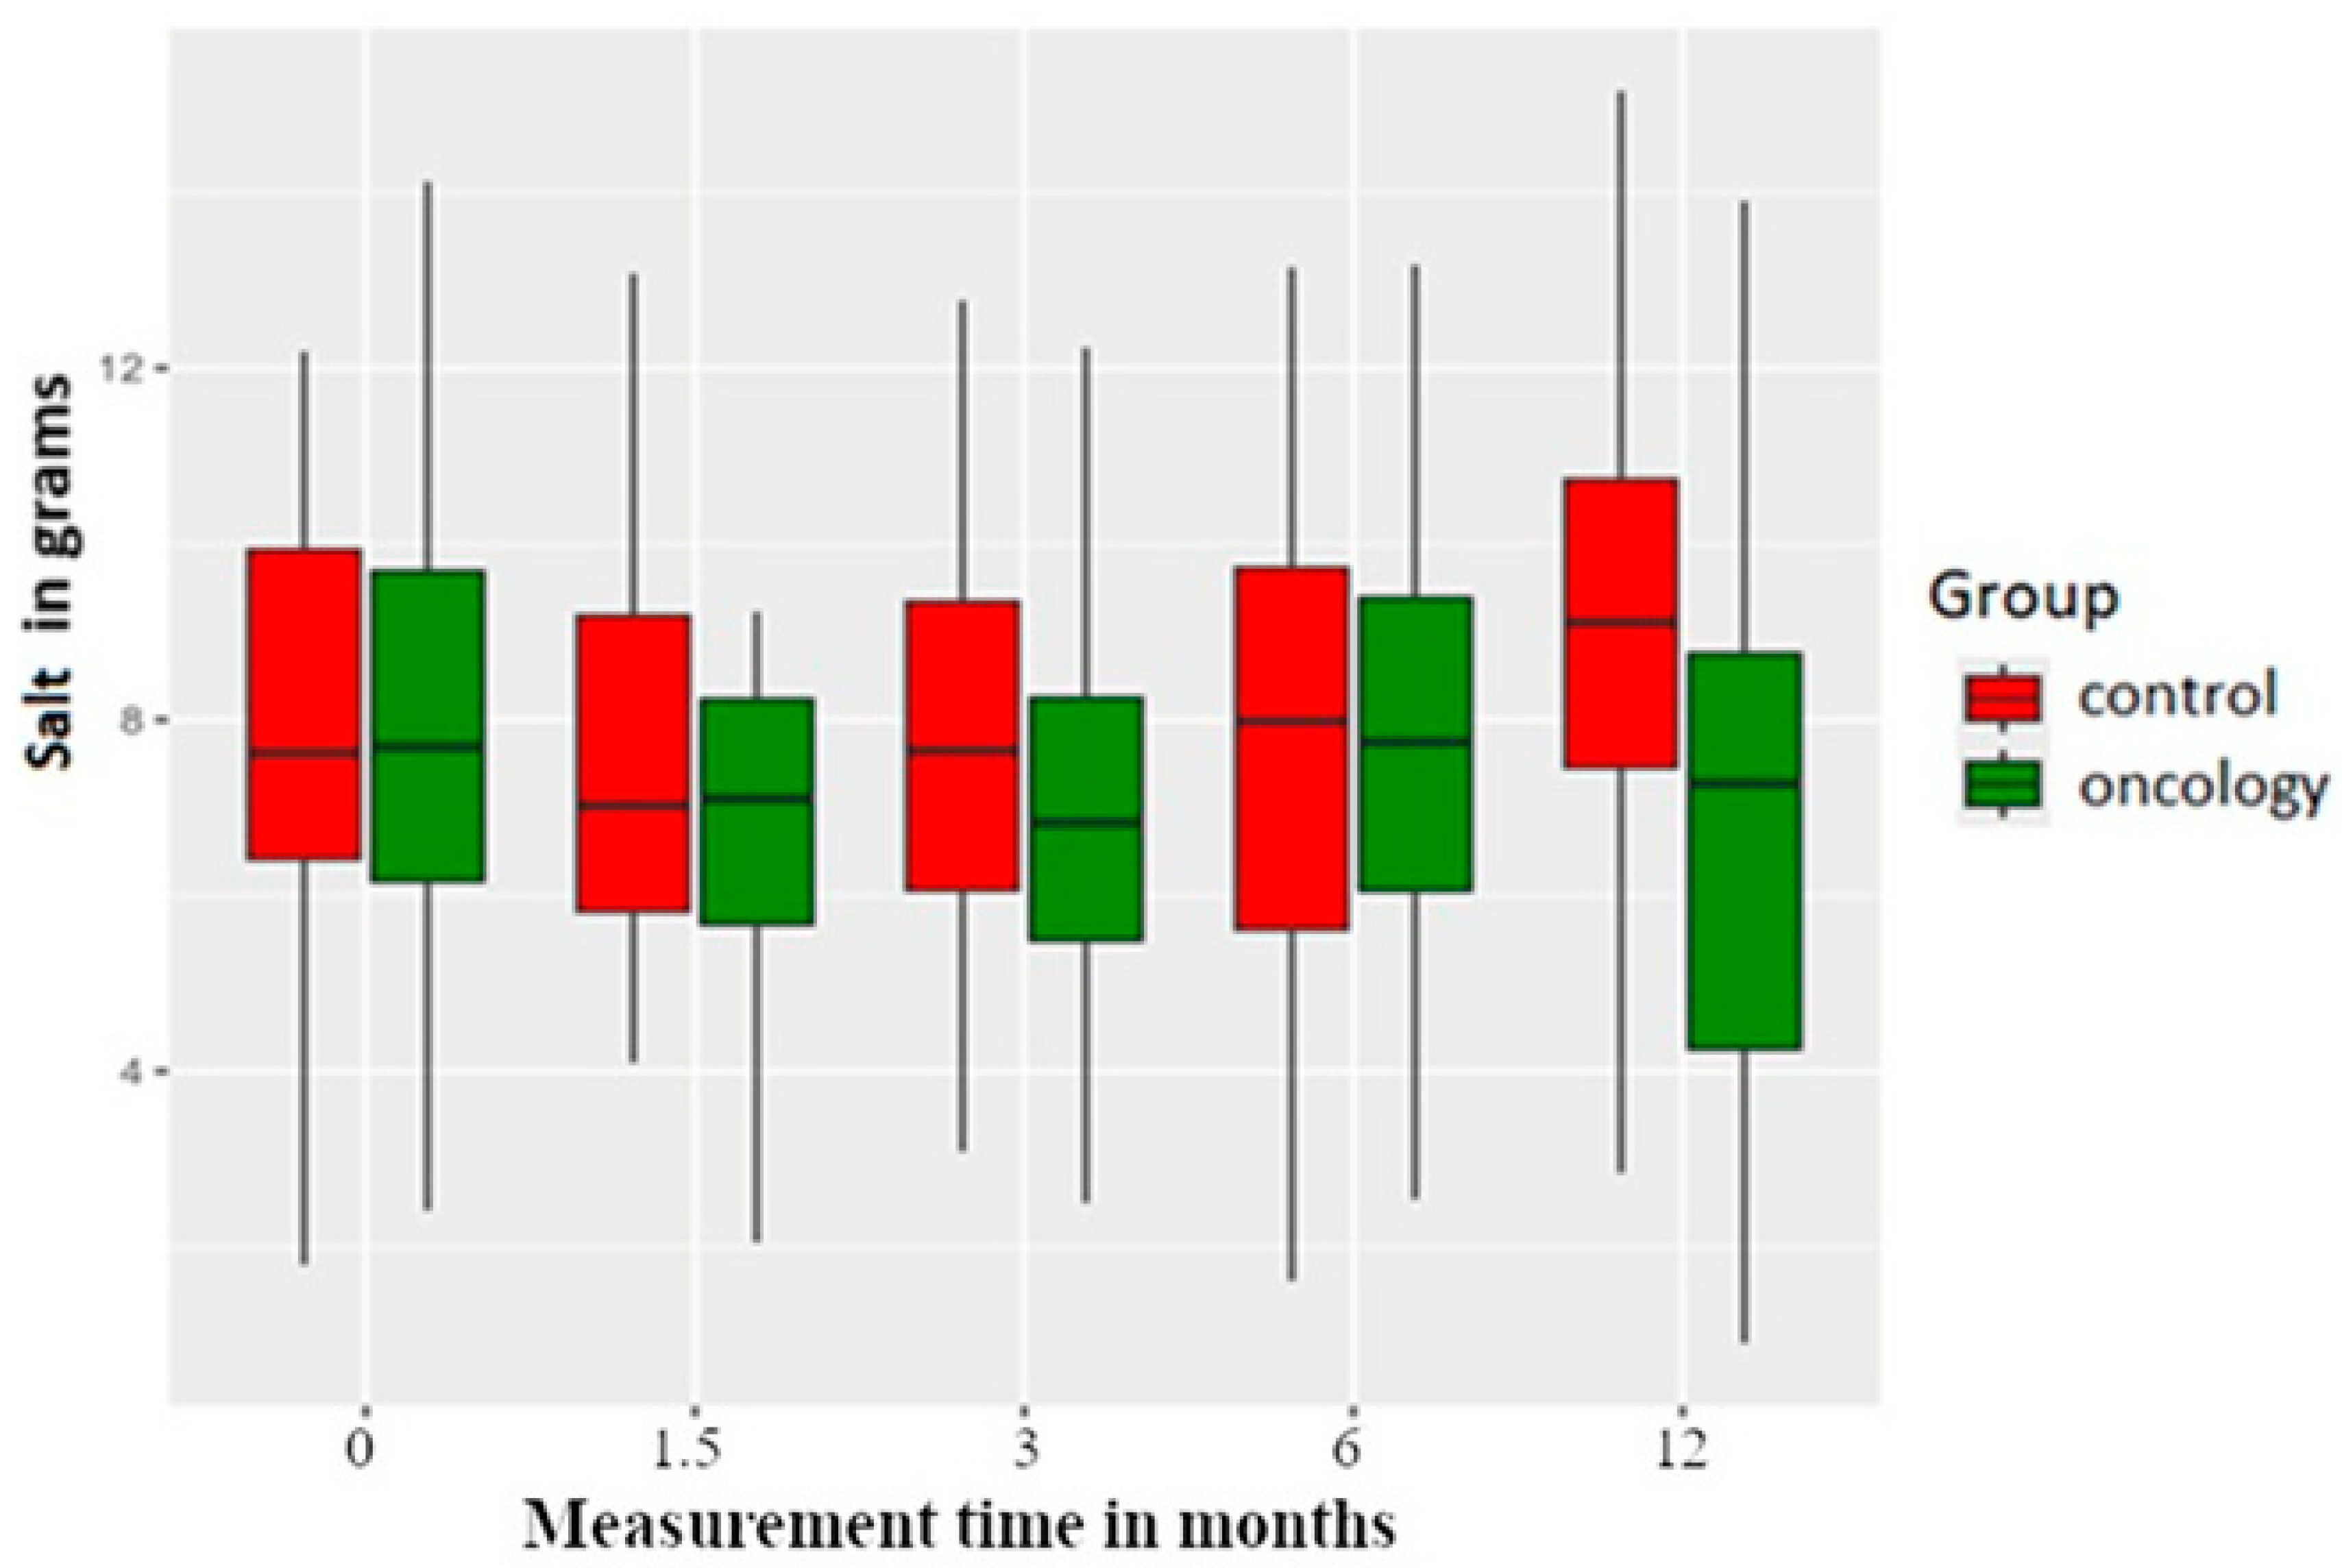
3.3. Micronutrients
3.4. Changes in the Study Group
3.5. Food Frequency
4. Discussion
5. Conclusions
Author Contributions
Funding
Institutional Review Board Statement
Informed Consent Statement
Data Availability Statement
Conflicts of Interest
References
- Siegel, R.L.; Miller, K.D.; Wagle, N.S.; Jemal, A. Cancer statistics, 2023. CA A Cancer J. Clin. 2023, 73, 17–48. [Google Scholar] [CrossRef]
- Fitzmaurice, C.; Allen, C.; Barber, R.M.; Barregard, L.; Bhutta, Z.A.; Brenner, H.; Dicker, D.J.; Chimed-Orchir, O.; Dandona, R.; Dandona, L.; et al. Global, Regional, and National Cancer Incidence, Mortality, Years of Life Lost, Years Lived With Disability, and Disability-Adjusted Life-years for 32 Cancer Groups, 1990 to 2015: A Systematic Analysis for the Global Burden of Disease Study. JAMA Oncol. 2017, 3, 524–548. [Google Scholar] [PubMed]
- Sung, H.; Ferlay, J.; Siegel, R.L.; Laversanne, M.; Soerjomataram, I.; Jemal, A.; Bray, F. Global Cancer Statistics 2020: GLOBOCAN Estimates of Incidence and Mortality Worldwide for 36 Cancers in 185 Countries. CA A Cancer J. clinicians 2021, 71, 209–249. [Google Scholar] [CrossRef]
- Nayar, S. Current concepts and novel techniques in the prosthodontic management of head and neck cancer patients. Br. Dent. J. 2019, 226, 725–737. [Google Scholar] [CrossRef]
- Martinovic, D.; Tokic, D.; Puizina Mladinic, E.; Usljebrka, M.; Kadic, S.; Lesin, A.; Vilovic, M.; Lupi-Ferandin, S.; Ercegovic, S.; Kumric, M.; et al. Nutritional Management of Patients with Head and Neck Cancer-A Comprehensive Review. Nutrients 2023, 15, 1864. [Google Scholar] [CrossRef] [PubMed]
- Ackerman, D.; Laszlo, M.; Provisor, A.; Yu, A. Nutrition Management for the Head and Neck Cancer Patient. Cancer Treat Res 2018, 174, 187–208. [Google Scholar] [PubMed]
- AlSaggaf, A.U.; Alqutub, A.; Almasri, Z.; Khalifah, F.; Khuzaee, F.; Aljuaid, A.; Bukhari, O.; Marghalani, A.A.; Alqutub, A.W. Oral Health-Related Quality of Life Improvement After Treatment With Fixed and Removable Dental Prostheses. Cureus 2024, 16, e71013. [Google Scholar] [CrossRef]
- Sandström, B.; Lindquist, L.W. The effect of different prosthetic restorations on the dietary selection in edentulous patients. A longitudinal study of patients initially treated with optimal complete dentures and finally with tissue-integrated prostheses. Acta Odontol. Scand. 1987, 45, 423–428. [Google Scholar] [CrossRef]
- Prakash, N.; Kalavathy, N.; Sridevi, J.; Premnath, K. Nutritional status assessment in complete denture wearers. Gerodontology 2012, 29, 224–230. [Google Scholar] [CrossRef]
- Moynihan, P.; Varghese, R. Impact of Wearing Dentures on Dietary Intake, Nutritional Status, and Eating: A Systematic Review. JDR Clin. Trans. Res. 2022, 7, 334–351. [Google Scholar] [CrossRef]
- Kowalkowska, J.; Wadolowska, L. The 72-Item Semi-Quantitative Food Frequency Questionnaire (72-Item SQ-FFQ) for Polish Young Adults: Reproducibility and Relative Validity. Nutrients 2022, 14, 2696. [Google Scholar] [CrossRef] [PubMed]
- Food Based Dietary Guidelines—Poland www.fao.org: Food and Agriculture Organisation of the United Nations. 2020. Available online: https://www.fao.org/nutrition/education/food-dietary-guidelines/regions/countries/poland/en/ (accessed on 15 January 2020).
- Lucjan Szponar KW, Ewa Rychlik Album of Photographs of Food Products and Dishes: National Food and Nutrition Institute. 2000. Available online: https://www.goldenmed.pl/wp-content/uploads/2020/11/Album-fotografii-produktow-i-potraw.pdf (accessed on 1 January 2000).
- Seikaly, H.; Idris, S.; Chuka, R.; Jeffery, C.; Dzioba, A.; Makki, F.; Logan, H.; O’Connell, D.A.; Harris, J.; Ansari, K.; et al. The Alberta Reconstructive Technique: An Occlusion-Driven and Digitally Based Jaw Reconstruction. Laryngoscope 2019, 129, S1–S14. [Google Scholar] [CrossRef] [PubMed]
- Banerjee, R.; Chahande, J.; Banerjee, S.; Radke, U. Evaluation of relationship between nutritional status and oral health related quality of life in complete denture wearers. Indian. J. Dent. Res. 2018, 29, 562–567. [Google Scholar] [CrossRef]
- Bessadet, M.; Nicolas, E.; Sochat, M.; Hennequin, M.; Veyrune, J.L. Impact of removable partial denture prosthesis on chewing efficiency. J. Appl. Oral. Sci. 2013, 21, 392–396. [Google Scholar] [CrossRef]
- Nedeljković, Đ.; Milić Lemić, A.; Kuzmanović Pfićer, J.; Stančić, I.; Popovac, A.; Čelebić, A. Subjective and Objective Assessment of Chewing Performance in Older Adults with Different Dental Occlusion. Med. Princ. Pract. 2023, 32, 110–116. [Google Scholar] [CrossRef]
- Diet, Nutrition, Physical Activity and Cancer: A Global Perspective: World Cancer Research Fund/American Institute for Cancer Research. 2012. Available online: https://www.wcrf.org/wp-content/uploads/2024/11/Summary-of-Third-Expert-Report-2018.pdf (accessed on 1 January 2018).
- Jolly, M.; Nobile, S. Vitamin status of patients with oral lichen planus. Aust. Dent. J. 1977, 22, 446–450. [Google Scholar] [CrossRef] [PubMed]
- Ong, D.E.; Goodwin, W.J.; Jesse, R.H.; Griffin, A.C. Presence of cellular retinol and retinoic acid-binding proteins in epidermoid carcinoma of the oral cavity and oropharynx. Cancer 1982, 49, 1409–1412. [Google Scholar] [CrossRef]
- Suda, D.; Schwartz, J.; Shklar, G. Inhibition of experimental oral carcinogenesis by topical beta carotene. Carcinogenesis 1986, 7, 711–715. [Google Scholar] [CrossRef]
- Epstein, J.B.; Gorsky, M. Topical application of vitamin A to oral leukoplakia: A clinical case series. Cancer 1999, 86, 921–927. [Google Scholar] [CrossRef]
- Malaker, K.; Anderson, B.J.; Beecroft, W.A.; Hodson, D.I. Management of oral mucosal dysplasia with beta-carotene retinoic acid: A pilot cross-over study. Cancer Detect. Prev. 1991, 15, 335–340. [Google Scholar]
- Nilesh, K.; Dadhich, A.; Saluja, H.; Patil, D.; Vande, A. Treatment of Oral Submucous Fibrosis with Lycopene, Beta-Carotene, Zinc, Selenium, Copper, Alpha-Lipoic Acid, And Alpha-Tocopheryl Acetate. Ann. Dent. Spec. 2021, 9, 1–6. [Google Scholar] [CrossRef]
- Walls, A.W.G.; Steele, J.G. The relationship between oral health and nutrition in older people. Mech. Ageing Dev. 2004, 125, 853–857. [Google Scholar] [CrossRef] [PubMed]
- Kiani, A.K.; Dhuli, K.; Donato, K.; Aquilanti, B.; Velluti, V.; Matera, G.; Iaconelli, A.; Connelly, S.T.; Bellinato, F.; Gisondi, P.; et al. Main nutritional deficiencies. J. Prev. Med. Hyg. 2022, 63 (Suppl. S3), E93–E101. [Google Scholar] [PubMed]
- Sierpinska, T.; Golebiewska, M.; Dlugosz, J.; Kemona, A.; Laszewicz, W. Connection between masticatory efficiency and pathomorphologic changes in gastric mucosa. Quintessence Int. 2007, 38, 31–37. [Google Scholar]
- Talwar, B.; Donnelly, R.; Skelly, R.; Donaldson, M. Nutritional management in head and neck cancer: United Kingdom National Multidisciplinary Guidelines. J. Laryngol. Otol. 2016, 130, S32–S40. [Google Scholar] [CrossRef]
- The Organisation and Delivery of Healthcare Services for Head and Neck Cancer Patients: Alberta Health Services. 2022. Available online: https://www.albertahealthservices.ca/assets/info/hp/cancer/if-hp-cancer-guide-hn001-organization.pdf (accessed on 1 January 2022).


| Study Arm | Control Arm |
|---|---|
| History of surgical resection due to head and neck cancer | No history of head and neck cancer |
| Never used a removable prosthesis | Never used a removable prosthesis |
| Complete edentulism | Complete edentulism |
| Needs and consents for prosthetic restoration | Needs and consents for prosthetic restoration |
| Study Arm | Control Arm |
|---|---|
| Metabolic disease (obesity, type 1 or 2 diabetes), cardiac disease, autoimmune disease, intestinal tract disease, infectious disease (infection with HIV or HCV), immunity disorder, another neoplasm or a chronic infectious disease. | Metabolic disease (obesity, type 1 or 2 diabetes), cardiac disease, autoimmune disease, intestinal tract disease, infectious disease (infection with HIV or HCV), immunity disorder, another neoplasm or a chronic infectious disease. |
| Radiotherapy, chemotherapy |
| Component | Measurement | Study Group (n = 44) | p * | ||||||
|---|---|---|---|---|---|---|---|---|---|
| Average | Standard Deviation | Minimum | Q1 | Median | Q3 | Maximum | |||
| Energy | 0 | 1642.06 | 638.29 | 438.34 | 1196.14 | 1522.25 | 1945.12 | 3582.07 | |
| A | 1502.56 | 534.54 | 286.97 | 1204.63 | 1406.18 | 1873.40 | 2848.89 | 0.549 | |
| B | 1605.53 | 668.77 | 418.50 | 1245.48 | 1480.61 | 1798.14 | 4189.05 | 0.946 | |
| C | 1709.80 | 616.54 | 274.87 | 1298.44 | 1533.71 | 2030.15 | 3278.26 | 0.603 | |
| D | 1758.89 | 705.79 | 236.96 | 1318.34 | 1503.89 | 2330.26 | 3335.00 | 0.518 | |
| Water | 0 | 1342.01 | 606.36 | 397.17 | 941.67 | 1135.35 | 1794.24 | 2968.84 | |
| A | 1219.84 | 568.15 | 342.25 | 809.57 | 1088.81 | 1596.88 | 2727.19 | 0.187 | |
| B | 1256.34 | 529.74 | 269.30 | 968.86 | 1224.63 | 1475.01 | 2801.34 | 0.187 | |
| C | 1345.65 | 662.95 | 426.99 | 792.71 | 1300.50 | 1671.97 | 3373.44 | 0.831 | |
| D | 1323.14 | 664.47 | 419.83 | 847.57 | 1164.17 | 1760.92 | 3087.89 | 0.831 | |
| Protein | 0 | 74.56 | 25.17 | 23.52 | 59.02 | 73.08 | 84.87 | 156.67 | |
| A | 68.16 | 22.36 | 14.11 | 53.76 | 61.15 | 87.84 | 116.43 | 0.045 | |
| B | 67.59 | 26.20 | 32.15 | 52.94 | 59.07 | 71.80 | 155.21 | 0.045 | |
| C | 75.20 | 25.69 | 29.74 | 54.67 | 70.20 | 96.53 | 146.53 | 0.764 | |
| D | 78.22 | 31.98 | 13.98 | 55.36 | 73.76 | 100.78 | 147.36 | 0.764 | |
| Animal protein | 0 | 49.15 | 17.79 | 8.31 | 36.76 | 48.00 | 60.11 | 118.01 | |
| A | 44.08 | 18.90 | 9.76 | 31.33 | 39.57 | 51.55 | 105.49 | 0.007 | |
| B | 42.14 | 20.37 | 12.66 | 30.94 | 37.90 | 46.72 | 123.37 | 0.003 | |
| C | 47.37 | 19.74 | 10.55 | 31.50 | 43.34 | 64.41 | 95.93 | 0.072 | |
| D | 50.98 | 26.12 | 5.40 | 32.36 | 46.97 | 68.96 | 127.10 | 0.590 | |
| Vegetable proteins | 0 | 24.03 | 11.57 | 3.39 | 16.34 | 21.67 | 28.51 | 59.59 | |
| A | 22.59 | 9.76 | 3.50 | 15.60 | 21.71 | 29.00 | 46.15 | 0.639 | |
| B | 23.30 | 13.97 | 0.15 | 17.49 | 22.56 | 26.63 | 94.84 | 0.893 | |
| C | 25.80 | 12.72 | 4.46 | 18.59 | 24.78 | 29.77 | 81.84 | 0.162 | |
| D | 25.09 | 14.42 | 5.28 | 15.83 | 20.39 | 30.77 | 81.90 | 0.639 | |
| Fat | 0 | 47.12 | 19.91 | 19.27 | 30.76 | 41.92 | 65.23 | 104.29 | |
| A | 44.29 | 23.94 | 9.54 | 26.84 | 39.16 | 54.41 | 114.76 | 0.380 | |
| B | 47.82 | 27.18 | 13.59 | 28.81 | 40.16 | 53.28 | 126.40 | 0.472 | |
| C | 50.16 | 28.60 | 5.43 | 33.32 | 43.50 | 65.81 | 169.24 | 0.590 | |
| D | 54.91 | 27.80 | 4.03 | 37.44 | 50.47 | 72.08 | 132.11 | 0.201 | |
| Carbohydrates | 0 | 238.71 | 112.58 | 28.61 | 155.35 | 225.38 | 302.49 | 601.20 | |
| A | 216.04 | 105.82 | 37.80 | 130.65 | 204.50 | 273.43 | 509.52 | 0.471 | |
| B | 235.18 | 113.82 | 13.35 | 174.76 | 227.49 | 284.10 | 649.35 | 0.840 | |
| C | 248.83 | 108.99 | 29.98 | 182.01 | 228.82 | 297.88 | 499.08 | 0.471 | |
| D | 247.43 | 129.13 | 40.36 | 156.55 | 209.63 | 322.14 | 509.52 | 0.741 | |
| Sodium | 0 | 3229.46 | 1279.82 | 966.55 | 2453.14 | 3075.65 | 3962.52 | 6979.30 | |
| A | 2876.49 | 1447.72 | 438.02 | 2116.94 | 2837.22 | 3299.93 | 9218.69 | 0.056 | |
| B | 2898.94 | 1408.63 | 248.50 | 2200.90 | 2728.50 | 3372.56 | 7934.37 | 0.015 | |
| C | 3179.75 | 1198.37 | 1016.36 | 2412.80 | 3114.67 | 3798.16 | 7109.75 | 0.893 | |
| D | 3023.89 | 1703.07 | 362.15 | 1728.29 | 2981.47 | 3657.61 | 9218.69 | 0.191 | |
| Potassium | 0 | 3173.72 | 1874.41 | 689.06 | 1888.20 | 2368.16 | 3909.33 | 8344.55 | |
| A | 2718.59 | 1342.45 | 518.65 | 1745.58 | 2554.15 | 3518.04 | 7325.31 | 0.615 | |
| B | 3352.59 | 2449.83 | 778.00 | 2061.45 | 2627.27 | 3750.18 | 14,696.06 | 0.893 | |
| C | 3299.51 | 1758.04 | 1024.41 | 2172.54 | 3025.85 | 3903.88 | 9242.59 | 0.615 | |
| D | 3289.35 | 1859.39 | 1363.78 | 1923.69 | 2961.74 | 3887.09 | 9213.08 | 0.615 | |
| Calcium | 0 | 660.38 | 326.28 | 163.70 | 419.07 | 596.31 | 857.82 | 1631.63 | |
| A | 548.13 | 294.43 | 82.86 | 345.08 | 530.24 | 677.57 | 1313.32 | 0.128 | |
| B | 598.11 | 319.99 | 110.24 | 325.53 | 503.03 | 805.48 | 1292.78 | 0.360 | |
| C | 626.48 | 310.33 | 147.69 | 393.99 | 540.28 | 861.74 | 1354.74 | 0.360 | |
| D | 671.39 | 384.06 | 84.05 | 401.88 | 609.60 | 886.21 | 2139.97 | 0.567 | |
| Phosphorus | 0 | 1247.59 | 480.62 | 444.77 | 968.00 | 1142.34 | 1457.96 | 2348.17 | |
| A | 1096.57 | 459.56 | 228.95 | 803.77 | 1032.95 | 1368.22 | 2567.58 | 0.109 | |
| B | 1273.12 | 773.79 | 582.00 | 795.38 | 1016.04 | 1515.80 | 5018.15 | 0.662 | |
| C | 1290.08 | 605.63 | 322.91 | 942.26 | 1102.79 | 1500.30 | 4076.43 | 0.809 | |
| D | 1346.50 | 693.98 | 360.04 | 952.72 | 1180.03 | 1521.44 | 4007.28 | 0.809 | |
| Magnesium | 0 | 262.08 | 118.57 | 55.65 | 171.66 | 241.24 | 312.39 | 586.17 | |
| A | 247.49 | 111.34 | 43.91 | 175.30 | 222.13 | 306.39 | 532.11 | 0.786 | |
| B | 263.36 | 157.17 | 69.00 | 184.10 | 240.44 | 285.90 | 1110.71 | 0.786 | |
| C | 284.00 | 139.97 | 54.92 | 205.32 | 263.21 | 330.53 | 973.21 | 0.591 | |
| D | 283.00 | 157.32 | 99.60 | 169.91 | 249.55 | 370.31 | 973.11 | 0.591 | |
| Iron | 0 | 10.58 | 5.20 | 2.87 | 6.99 | 8.67 | 13.60 | 23.77 | |
| A | 9.56 | 5.23 | 1.39 | 5.89 | 8.66 | 11.04 | 27.43 | 0.174 | |
| B | 11.51 | 9.40 | 2.10 | 7.35 | 9.66 | 12.07 | 63.49 | 0.736 | |
| C | 11.72 | 7.91 | 2.45 | 7.64 | 9.53 | 13.41 | 52.91 | 0.707 | |
| D | 727.38 | 4748.16 | 2.48 | 7.59 | 8.72 | 15.11 | 31,507.25 | 0.707 | |
| Zinc | 0 | 8.88 | 3.56 | 3.05 | 6.71 | 8.01 | 10.60 | 21.19 | |
| A | 8.38 | 3.56 | 1.71 | 6.05 | 7.73 | 9.89 | 17.84 | 0.425 | |
| B | 8.49 | 4.18 | 2.81 | 6.33 | 7.60 | 8.70 | 27.46 | 0.425 | |
| C | 9.41 | 4.33 | 2.35 | 6.82 | 8.37 | 10.98 | 27.49 | 0.425 | |
| D | 9.24 | 4.54 | 2.02 | 6.41 | 8.10 | 11.17 | 26.46 | 0.973 | |
| Copper | 0 | 1.07 | 0.55 | 0.21 | 0.71 | 0.90 | 1.36 | 2.48 | |
| A | 1.06 | 0.62 | 0.20 | 0.65 | 0.93 | 1.32 | 3.40 | 0.672 | |
| B | 1.15 | 0.60 | 0.46 | 0.84 | 1.00 | 1.24 | 3.32 | 0.672 | |
| C | 1.17 | 0.54 | 0.13 | 0.86 | 1.08 | 1.33 | 2.53 | 0.495 | |
| D | 1.18 | 0.65 | 0.27 | 0.73 | 1.01 | 1.41 | 3.57 | 0.495 | |
| Manganese | 0 | 3.40 | 1.87 | 0.36 | 2.11 | 3.12 | 4.55 | 9.04 | |
| A | 3.57 | 2.50 | 0.30 | 1.98 | 3.05 | 4.27 | 13.12 | 0.461 | |
| B | 3.57 | 1.90 | 0.12 | 1.91 | 3.54 | 4.86 | 9.89 | 0.515 | |
| C | 3.86 | 1.51 | 1.43 | 3.02 | 3.84 | 4.54 | 7.81 | 0.403 | |
| D | 3.73 | 2.31 | 0.67 | 1.96 | 3.39 | 4.21 | 13.12 | 0.515 | |
| Vitamin A | 0 | 958.88 | 535.42 | 227.86 | 649.13 | 824.99 | 1145.42 | 3250.81 | |
| A | 757.12 | 507.28 | 72.91 | 406.02 | 689.61 | 904.24 | 3185.59 | 0.007 | |
| B | 873.02 | 566.58 | 135.50 | 478.18 | 685.39 | 1190.31 | 2795.60 | 0.007 | |
| C | 888.08 | 461.74 | 84.78 | 593.73 | 817.00 | 1109.12 | 2293.61 | 0.112 | |
| D | 973.52 | 616.56 | 24.93 | 559.52 | 853.60 | 1252.14 | 2672.49 | 0.544 | |
| Retinol | 0 | 334.25 | 131.49 | 107.19 | 231.83 | 337.04 | 426.07 | 595.31 | |
| A | 349.90 | 477.98 | 38.42 | 165.90 | 233.83 | 339.87 | 3092.28 | 0.216 | |
| B | 451.47 | 513.47 | 68.62 | 183.86 | 312.81 | 439.35 | 2593.43 | 0.412 | |
| C | 337.03 | 201.14 | 28.37 | 183.33 | 341.58 | 453.03 | 897.48 | 0.946 | |
| D | 415.32 | 327.82 | 21.00 | 208.15 | 369.06 | 528.80 | 1732.54 | 0.216 | |
| Beta-carotene | 0 | 3607.64 | 3030.18 | 245.52 | 1537.17 | 3247.70 | 4588.69 | 16,875.82 | |
| A | 2290.56 | 1786.62 | 7.67 | 717.46 | 2149.59 | 3402.52 | 7259.28 | 0.004 | |
| B | 2393.56 | 1941.22 | 56.56 | 746.64 | 1815.53 | 4046.03 | 7082.93 | 0.004 | |
| C | 3171.01 | 2723.27 | 84.40 | 1062.66 | 2536.22 | 3906.33 | 13,279.39 | 0.243 | |
| D | 3222.94 | 3078.22 | 14.02 | 635.04 | 2749.50 | 4763.68 | 13,366.49 | 0.243 | |
| Vitamin E | 0 | 4.98 | 2.56 | 2.03 | 3.30 | 4.59 | 5.88 | 16.72 | |
| A | 4.68 | 2.75 | 1.00 | 2.99 | 3.93 | 5.92 | 15.59 | 0.710 | |
| B | 4.95 | 3.41 | 1.15 | 3.64 | 4.49 | 5.38 | 23.82 | 0.913 | |
| C | 4.97 | 3.10 | 0.62 | 3.43 | 4.23 | 5.36 | 20.94 | 0.913 | |
| D | 5.64 | 4.10 | 1.72 | 3.34 | 4.27 | 6.70 | 21.78 | 0.868 | |
| Thiamine | 0 | 1.05 | 0.54 | 0.20 | 0.70 | 0.89 | 1.40 | 2.59 | |
| A | 0.97 | 0.49 | 0.19 | 0.72 | 0.90 | 1.10 | 2.31 | 0.711 | |
| B | 1.02 | 0.61 | 0.10 | 0.63 | 0.89 | 1.27 | 3.04 | 0.695 | |
| C | 1.10 | 0.52 | 0.16 | 0.79 | 0.96 | 1.40 | 2.56 | 0.248 | |
| D | 1.12 | 0.60 | 0.25 | 0.64 | 0.98 | 1.51 | 2.31 | 0.248 | |
| Riboflavin (B2) | 0 | 1.58 | 0.58 | 0.56 | 1.13 | 1.53 | 1.84 | 2.99 | |
| A | 1.40 | 0.55 | 0.40 | 1.00 | 1.36 | 1.80 | 2.77 | 0.092 | |
| B | 1.55 | 0.61 | 0.54 | 1.06 | 1.39 | 1.95 | 3.29 | 0.893 | |
| C | 1.58 | 0.58 | 0.53 | 1.12 | 1.54 | 1.88 | 3.12 | 0.868 | |
| D | 1.59 | 0.63 | 0.55 | 1.01 | 1.58 | 1.91 | 3.06 | 0.893 | |
| Niacin (B3) | 0 | 18.05 | 11.67 | 3.27 | 9.88 | 14.74 | 22.19 | 51.91 | |
| A | 14.83 | 7.51 | 1.94 | 10.44 | 13.73 | 17.28 | 43.42 | 0.340 | |
| B | 19.13 | 16.77 | 3.50 | 9.09 | 14.53 | 22.32 | 91.37 | 0.707 | |
| C | 18.59 | 11.75 | 6.45 | 10.13 | 14.78 | 22.00 | 50.82 | 0.893 | |
| D | 19.24 | 11.93 | 2.35 | 9.85 | 14.71 | 26.10 | 51.54 | 0.707 | |
| Vitamin B6 | 0 | 1.70 | 0.79 | 0.66 | 1.05 | 1.54 | 2.13 | 3.84 | |
| A | 1.54 | 0.71 | 0.22 | 1.05 | 1.49 | 1.88 | 3.45 | 0.381 | |
| B | 1.71 | 0.88 | 0.54 | 1.05 | 1.54 | 2.35 | 5.01 | 0.893 | |
| C | 1.77 | 0.76 | 0.34 | 1.18 | 1.74 | 2.39 | 3.23 | 0.850 | |
| D | 1.76 | 0.81 | 0.57 | 1.01 | 1.73 | 2.40 | 3.68 | 0.873 | |
| Vitamin C | 0 | 74.20 | 79.43 | 5.44 | 33.72 | 47.52 | 91.51 | 370.20 | |
| A | 72.91 | 73.11 | 10.13 | 22.17 | 47.05 | 97.19 | 352.35 | 0.591 | |
| B | 65.75 | 70.70 | 2.85 | 22.03 | 49.75 | 78.49 | 372.06 | 0.591 | |
| C | 73.52 | 78.22 | 8.72 | 31.34 | 45.33 | 94.22 | 371.04 | 0.711 | |
| D | 74.17 | 68.84 | 6.22 | 32.01 | 53.61 | 93.93 | 358.79 | 0.591 | |
| Total saturated fatty acids | 0 | 20.58 | 10.17 | 5.48 | 12.73 | 17.84 | 28.39 | 51.08 | |
| A | 20.39 | 12.90 | 4.41 | 11.86 | 17.08 | 27.12 | 74.11 | 0.380 | |
| B | 21.42 | 14.23 | 4.41 | 11.92 | 17.13 | 27.14 | 68.56 | 0.380 | |
| C | 21.42 | 14.45 | 2.06 | 11.97 | 19.18 | 25.90 | 81.57 | 0.813 | |
| D | 25.11 | 15.32 | 0.77 | 14.90 | 24.04 | 31.21 | 82.43 | 0.187 | |
| Monosaturated fatty acids | 0 | 15.59 | 6.70 | 4.21 | 10.73 | 13.57 | 19.40 | 31.47 | |
| A | 13.81 | 9.49 | 3.65 | 8.54 | 10.38 | 15.79 | 48.49 | 0.118 | |
| B | 14.83 | 7.96 | 3.78 | 9.90 | 12.39 | 18.19 | 32.00 | 0.472 | |
| C | 16.56 | 9.97 | 1.55 | 10.68 | 14.06 | 20.28 | 62.83 | 0.472 | |
| D | 17.48 | 9.18 | 0.84 | 11.24 | 16.15 | 24.36 | 34.93 | 0.306 | |
| Polyunsaturated fatty acids | 0 | 6.20 | 4.50 | 0.90 | 3.56 | 5.01 | 6.92 | 24.73 | |
| A | 5.76 | 4.55 | 0.80 | 3.38 | 4.29 | 7.01 | 24.93 | 0.866 | |
| B | 6.39 | 7.54 | 1.02 | 3.67 | 4.39 | 6.40 | 49.97 | 0.786 | |
| C | 7.02 | 7.64 | 1.02 | 3.65 | 5.31 | 7.16 | 49.74 | 0.301 | |
| D | 6.79 | 7.59 | 0.47 | 3.37 | 5.42 | 6.85 | 49.88 | 0.483 | |
| Cholesterol | 0 | 297.72 | 144.92 | 69.04 | 176.23 | 288.39 | 377.67 | 696.20 | |
| A | 231.13 | 118.61 | 68.71 | 144.29 | 189.13 | 325.97 | 637.21 | 0.248 | |
| B | 264.56 | 182.62 | 28.80 | 147.50 | 217.77 | 320.84 | 1053.77 | 0.273 | |
| C | 292.32 | 172.75 | 72.83 | 159.55 | 225.05 | 419.99 | 717.54 | 0.973 | |
| D | 291.12 | 159.07 | 12.00 | 160.35 | 228.15 | 414.51 | 660.05 | 0.431 | |
| Saccharose | 0 | 31.45 | 20.30 | 1.26 | 16.08 | 29.72 | 46.32 | 78.19 | |
| A | 30.73 | 25.12 | 1.43 | 10.20 | 25.70 | 36.76 | 99.15 | 0.853 | |
| B | 31.39 | 28.44 | 1.88 | 11.33 | 24.91 | 41.35 | 140.05 | 0.853 | |
| C | 34.59 | 32.79 | 2.53 | 15.00 | 24.79 | 42.93 | 149.64 | 0.853 | |
| D | 35.25 | 25.48 | 2.52 | 14.52 | 30.85 | 53.34 | 100.05 | 0.853 | |
| Lactose | 0 | 9.17 | 7.12 | 0.06 | 3.24 | 8.02 | 13.36 | 32.94 | |
| A | 8.65 | 7.31 | 0.05 | 2.10 | 7.25 | 13.54 | 26.05 | 0.919 | |
| B | 9.24 | 7.15 | 0.00 | 2.96 | 6.73 | 15.24 | 30.34 | 0.495 | |
| C | 8.02 | 6.41 | 0.00 | 1.92 | 7.90 | 12.34 | 25.04 | 0.831 | |
| D | 9.28 | 7.44 | 0.00 | 2.46 | 8.81 | 14.87 | 27.83 | 0.495 | |
| Starch | 0 | 134.58 | 63.91 | 18.04 | 94.73 | 123.69 | 152.43 | 340.94 | |
| A | 125.70 | 60.27 | 15.76 | 84.15 | 114.68 | 161.33 | 273.35 | 0.425 | |
| B | 119.65 | 49.99 | 0.00 | 100.82 | 128.62 | 150.01 | 214.06 | 0.571 | |
| C | 140.07 | 72.57 | 6.58 | 97.04 | 134.58 | 166.44 | 426.73 | 0.571 | |
| D | 129.84 | 70.83 | 6.79 | 81.25 | 115.77 | 179.78 | 308.19 | 0.571 | |
| Fibre | 0 | 17.73 | 9.83 | 2.09 | 11.11 | 15.03 | 24.36 | 41.19 | |
| A | 16.57 | 8.95 | 2.74 | 9.74 | 15.56 | 21.97 | 45.00 | 0.764 | |
| B | 18.27 | 13.28 | 0.45 | 10.25 | 15.96 | 24.22 | 83.84 | 0.764 | |
| C | 18.98 | 10.28 | 4.66 | 13.24 | 16.80 | 23.54 | 64.88 | 0.265 | |
| D | 19.13 | 11.53 | 5.81 | 12.06 | 15.53 | 22.21 | 64.88 | 0.483 | |
| Folates | 0 | 233.26 | 113.67 | 50.47 | 166.23 | 211.59 | 267.46 | 605.01 | |
| A | 209.96 | 107.72 | 61.35 | 127.16 | 193.07 | 255.49 | 641.71 | 0.265 | |
| B | 226.35 | 103.69 | 17.95 | 178.15 | 206.11 | 260.38 | 648.70 | 0.840 | |
| C | 239.15 | 96.38 | 72.03 | 179.22 | 227.16 | 273.99 | 656.63 | 0.380 | |
| D | 4294.88 | 26,887.92 | 102.87 | 164.28 | 212.97 | 310.52 | 178,594.35 | 0.558 | |
| Vitamin B12 | 0 | 3.76 | 2.02 | 0.52 | 2.29 | 3.57 | 4.36 | 10.57 | |
| A | 2.92 | 1.68 | 0.51 | 1.73 | 2.59 | 3.65 | 8.31 | 0.018 | |
| B | 4.06 | 4.86 | 0.87 | 1.69 | 2.84 | 4.17 | 26.53 | 0.227 | |
| C | 3.17 | 1.33 | 1.14 | 1.99 | 2.97 | 4.32 | 6.32 | 0.786 | |
| D | 3.36 | 1.60 | 0.75 | 2.15 | 3.31 | 4.22 | 8.31 | 0.786 | |
| Vitamin D | 0 | 3.17 | 2.95 | 0.17 | 1.34 | 2.05 | 3.34 | 13.50 | |
| A | 1.95 | 2.00 | 0.21 | 0.80 | 1.35 | 2.24 | 10.72 | 0.018 | |
| B | 3.36 | 6.17 | 0.08 | 0.86 | 1.69 | 2.88 | 38.02 | 0.066 | |
| C | 2.53 | 1.95 | 0.19 | 1.20 | 2.26 | 3.07 | 10.73 | 0.741 | |
| D | 3.24 | 3.38 | 0.05 | 1.22 | 2.19 | 3.60 | 12.37 | 0.741 | |
| Iodine | 0 | 147.18 | 65.55 | 42.64 | 94.18 | 140.39 | 176.91 | 360.65 | |
| A | 117.06 | 64.06 | 8.38 | 73.21 | 113.02 | 154.63 | 344.39 | 0.004 | |
| B | 124.82 | 63.41 | 2.76 | 87.63 | 115.33 | 155.00 | 329.44 | 0.004 | |
| C | 135.89 | 70.38 | 19.49 | 87.01 | 119.59 | 181.67 | 350.21 | 0.106 | |
| D | 127.59 | 77.66 | 9.08 | 79.04 | 103.40 | 173.92 | 384.95 | 0.091 | |
| LCPUFAs | 0 | 0.28 | 0.54 | 0.00 | 0.03 | 0.08 | 0.15 | 2.73 | |
| A | 0.15 | 0.34 | 0.00 | 0.02 | 0.04 | 0.11 | 2.03 | 0.741 | |
| B | 0.22 | 0.56 | 0.00 | 0.02 | 0.05 | 0.10 | 2.78 | 0.440 | |
| C | 0.15 | 0.29 | 0.00 | 0.02 | 0.07 | 0.14 | 1.50 | 0.741 | |
| D | 0.23 | 0.43 | 0.00 | 0.04 | 0.08 | 0.13 | 2.03 | 0.128 | |
| Digestible carbohydrates | 0 | 220.98 | 105.16 | 26.53 | 143.09 | 210.06 | 289.39 | 561.93 | |
| A | 199.47 | 99.31 | 34.42 | 120.91 | 192.83 | 248.42 | 464.52 | 0.425 | |
| B | 216.91 | 103.27 | 12.90 | 162.59 | 210.55 | 262.44 | 565.50 | 1.000 | |
| C | 229.85 | 103.12 | 25.32 | 167.36 | 211.23 | 272.83 | 489.84 | 0.425 | |
| D | 228.30 | 121.02 | 31.68 | 148.56 | 197.12 | 301.35 | 468.66 | 0.873 | |
| Folic acids | 0 | 7.55 | 45.38 | 0.00 | 0.00 | 0.00 | 0.00 | 300.00 | |
| A | 8.64 | 46.54 | 0.00 | 0.00 | 0.00 | 0.00 | 300.00 | 0.987 | |
| B | 9.99 | 46.71 | 0.00 | 0.00 | 0.00 | 0.00 | 300.00 | 0.987 | |
| C | 8.89 | 46.52 | 0.00 | 0.00 | 0.00 | 0.00 | 300.00 | 0.987 | |
| D | 2395.77 | 15,827.96 | 0.00 | 0.00 | 0.00 | 0.00 | 105,000.00 | 0.987 | |
| Omega 3 fatty acids | 0 | 1.52 | 2.70 | 0.13 | 0.53 | 0.66 | 1.42 | 15.62 | |
| A | 1.28 | 2.62 | 0.13 | 0.42 | 0.60 | 1.01 | 16.53 | 0.448 | |
| B | 1.78 | 5.13 | 0.16 | 0.42 | 0.72 | 1.10 | 34.05 | 0.637 | |
| C | 1.76 | 5.10 | 0.07 | 0.54 | 0.75 | 1.04 | 33.94 | 0.448 | |
| D | 1.85 | 5.13 | 0.21 | 0.54 | 0.73 | 1.07 | 33.99 | 0.448 | |
| Omega 6 fatty acids | 0 | 4.39 | 2.14 | 1.40 | 2.95 | 3.60 | 5.46 | 10.01 | |
| A | 4.10 | 2.50 | 0.62 | 2.74 | 3.56 | 4.95 | 15.14 | 0.893 | |
| B | 4.22 | 2.47 | 0.43 | 2.83 | 3.71 | 5.36 | 15.91 | 0.893 | |
| C | 4.85 | 2.89 | 0.53 | 3.12 | 4.23 | 5.68 | 15.83 | 0.381 | |
| D | 4.62 | 2.70 | 0.24 | 2.85 | 4.42 | 5.68 | 15.89 | 0.617 | |
| Glucose | 0 | 7.36 | 6.52 | 0.42 | 2.21 | 6.24 | 9.45 | 30.09 | |
| A | 6.49 | 6.69 | 0.33 | 1.76 | 3.99 | 10.02 | 26.46 | 0.045 | |
| B | 6.59 | 6.91 | 0.00 | 1.47 | 4.89 | 9.48 | 35.87 | 0.045 | |
| C | 7.01 | 7.64 | 0.08 | 2.10 | 5.19 | 8.93 | 36.81 | 0.189 | |
| D | 6.49 | 6.06 | 0.00 | 1.88 | 5.31 | 9.27 | 24.56 | 0.084 | |
| Fructose | 0 | 9.23 | 7.97 | 0.55 | 2.48 | 7.88 | 12.07 | 32.49 | |
| A | 8.41 | 8.35 | 0.35 | 2.09 | 4.59 | 13.35 | 27.17 | 0.265 | |
| B | 8.92 | 8.83 | 0.00 | 1.56 | 6.70 | 13.09 | 39.39 | 0.265 | |
| C | 7.94 | 7.64 | 0.08 | 2.30 | 6.43 | 9.65 | 32.41 | 0.265 | |
| D | 8.65 | 8.27 | 0.00 | 1.89 | 7.00 | 11.55 | 28.39 | 0.266 | |
| Salt | 0 | 8.08 | 3.20 | 2.42 | 6.14 | 7.69 | 9.92 | 17.46 | |
| A | 7.20 | 3.62 | 1.10 | 5.30 | 7.10 | 8.25 | 23.05 | 0.066 | |
| B | 7.22 | 3.54 | 0.62 | 5.47 | 6.83 | 8.44 | 19.84 | 0.012 | |
| C | 7.93 | 3.00 | 2.54 | 6.04 | 7.74 | 9.50 | 17.78 | 0.893 | |
| D | 7.36 | 4.31 | 0.91 | 4.21 | 7.28 | 8.95 | 23.05 | 0.097 | |
Disclaimer/Publisher’s Note: The statements, opinions and data contained in all publications are solely those of the individual author(s) and contributor(s) and not of MDPI and/or the editor(s). MDPI and/or the editor(s) disclaim responsibility for any injury to people or property resulting from any ideas, methods, instructions or products referred to in the content. |
© 2025 by the authors. Licensee MDPI, Basel, Switzerland. This article is an open access article distributed under the terms and conditions of the Creative Commons Attribution (CC BY) license (https://creativecommons.org/licenses/by/4.0/).
Share and Cite
Sawczuk, B.; Nayar, S.; Szutko, P.; Sierpińska, T. Assessing the Impact of Removable Prosthetic Restorations on Nutritional Habits in Edentulous Patients Following Surgery for Head and Neck Cancer. Nutrients 2025, 17, 1483. https://doi.org/10.3390/nu17091483
Sawczuk B, Nayar S, Szutko P, Sierpińska T. Assessing the Impact of Removable Prosthetic Restorations on Nutritional Habits in Edentulous Patients Following Surgery for Head and Neck Cancer. Nutrients. 2025; 17(9):1483. https://doi.org/10.3390/nu17091483
Chicago/Turabian StyleSawczuk, Beata, Suresh Nayar, Paweł Szutko, and Teresa Sierpińska. 2025. "Assessing the Impact of Removable Prosthetic Restorations on Nutritional Habits in Edentulous Patients Following Surgery for Head and Neck Cancer" Nutrients 17, no. 9: 1483. https://doi.org/10.3390/nu17091483
APA StyleSawczuk, B., Nayar, S., Szutko, P., & Sierpińska, T. (2025). Assessing the Impact of Removable Prosthetic Restorations on Nutritional Habits in Edentulous Patients Following Surgery for Head and Neck Cancer. Nutrients, 17(9), 1483. https://doi.org/10.3390/nu17091483