
Network Pharmacology-Based Elucidation of the Hypoglycemic Mechanism of Grifola frondosa GF5000 Polysaccharides via GCK modulation in Diabetic Rats

 ,
, Highlights
- Grifola frondosa polysaccharides GF5000 upregulated protein/mRNA expression in glucokinase/Gck by 2.86/2.18-fold compared with diabetic control rats.
- GF5000 exerted regulatory effects on metabolic pathways related to amino acid metabolism.
- The role of glucokinase in the hypoglycemic activity of GF5000 was highlighted.
- The main findings also demonstrated the potential application of GF5000 as a novel dietary supplement for the prevention of diabetes.
Abstract
1. Introduction
2. Materials and Methods
2.1. G. frondosa Fraction GF5000
2.2. Hypoglycemic Mechanism of GF5000 in Diabetic Rats
2.3. RNA-Seq-Based Transcriptomic Analysis
2.4. ITRAQ-Based Proteomic Analysis
2.5. Gene-Set Enrichment Analysis (GSEA)
2.6. Connectivity MAP (cMAP) Analysis
2.7. Gene Ontology (GO) and KEGG Pathway Enrichment Analysis of DEGs and DEPs with the Same Trends
2.8. Metascape Analysis
2.9. Cytoscape and GeneMANIA Analysis
2.10. Construction of a Stable GCK-Knockdown HepG2 Cell Line with a GCK shRNA Expression Lentiviral System
2.11. Effect of GF5000 on GCK-Knockdown HepG2 Cells
2.12. Statistical Analysis
3. Results
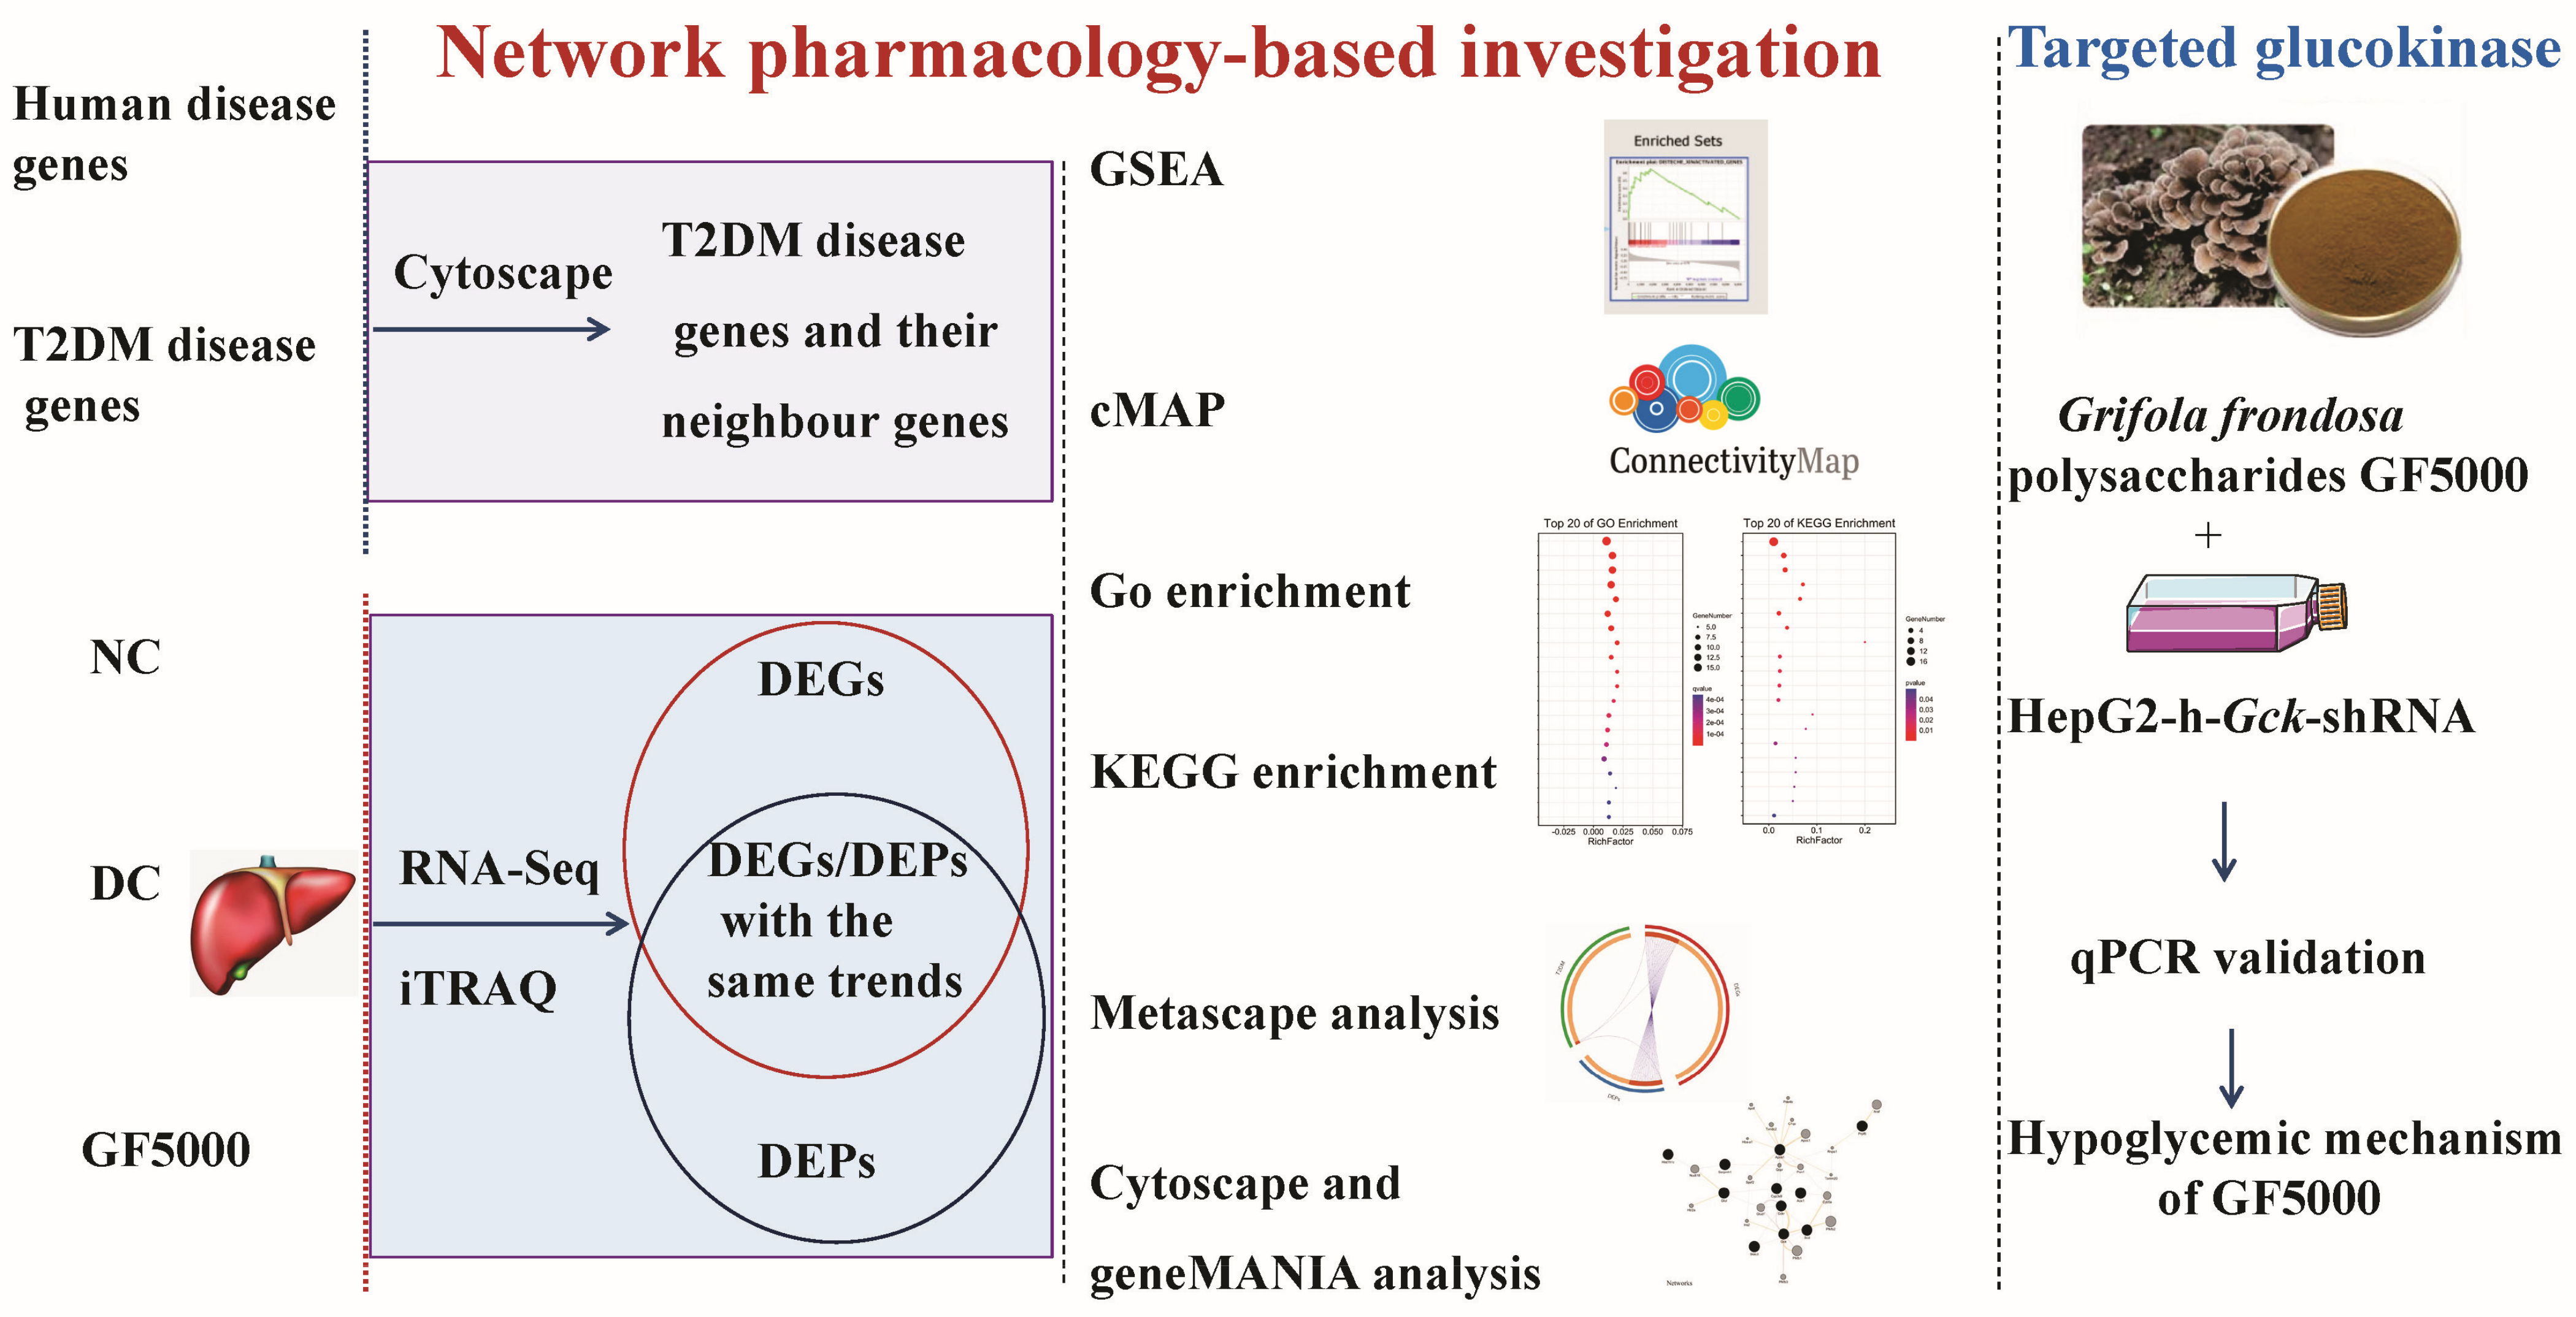
3.1. Overview
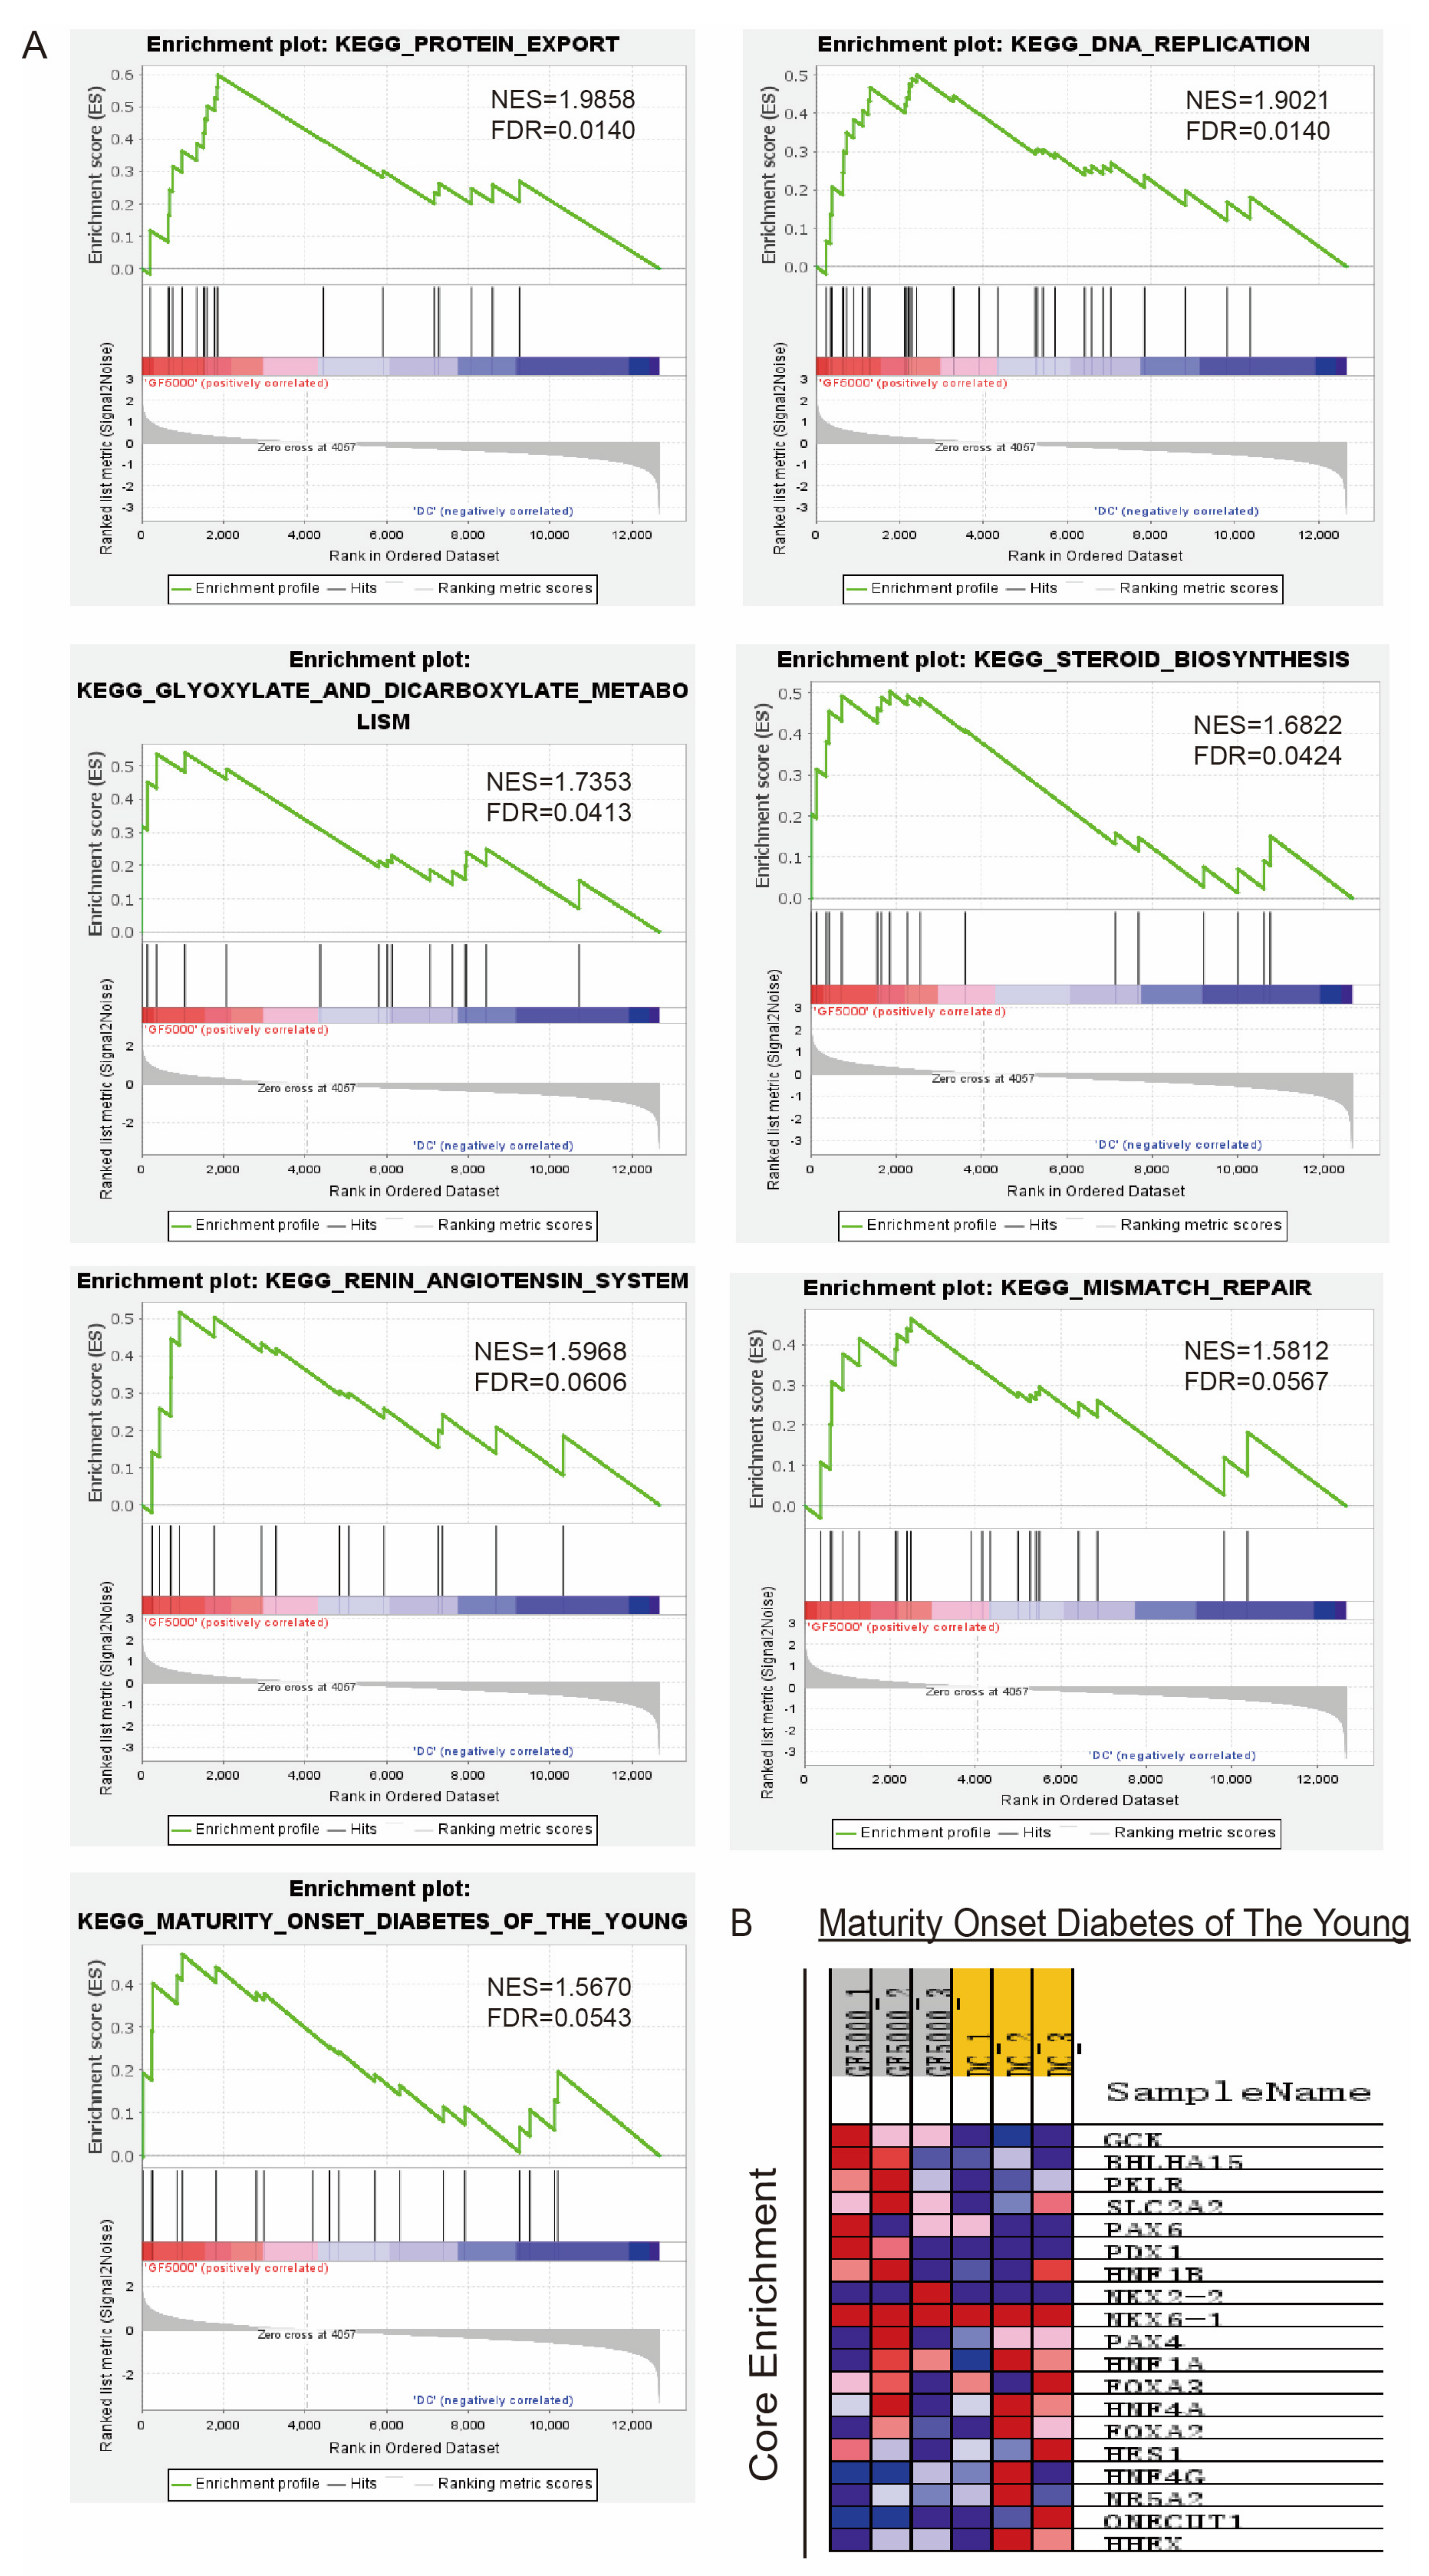
3.2. GSEA
3.3. Identification of Drugs with Similar Effects Using cMAP Analysis
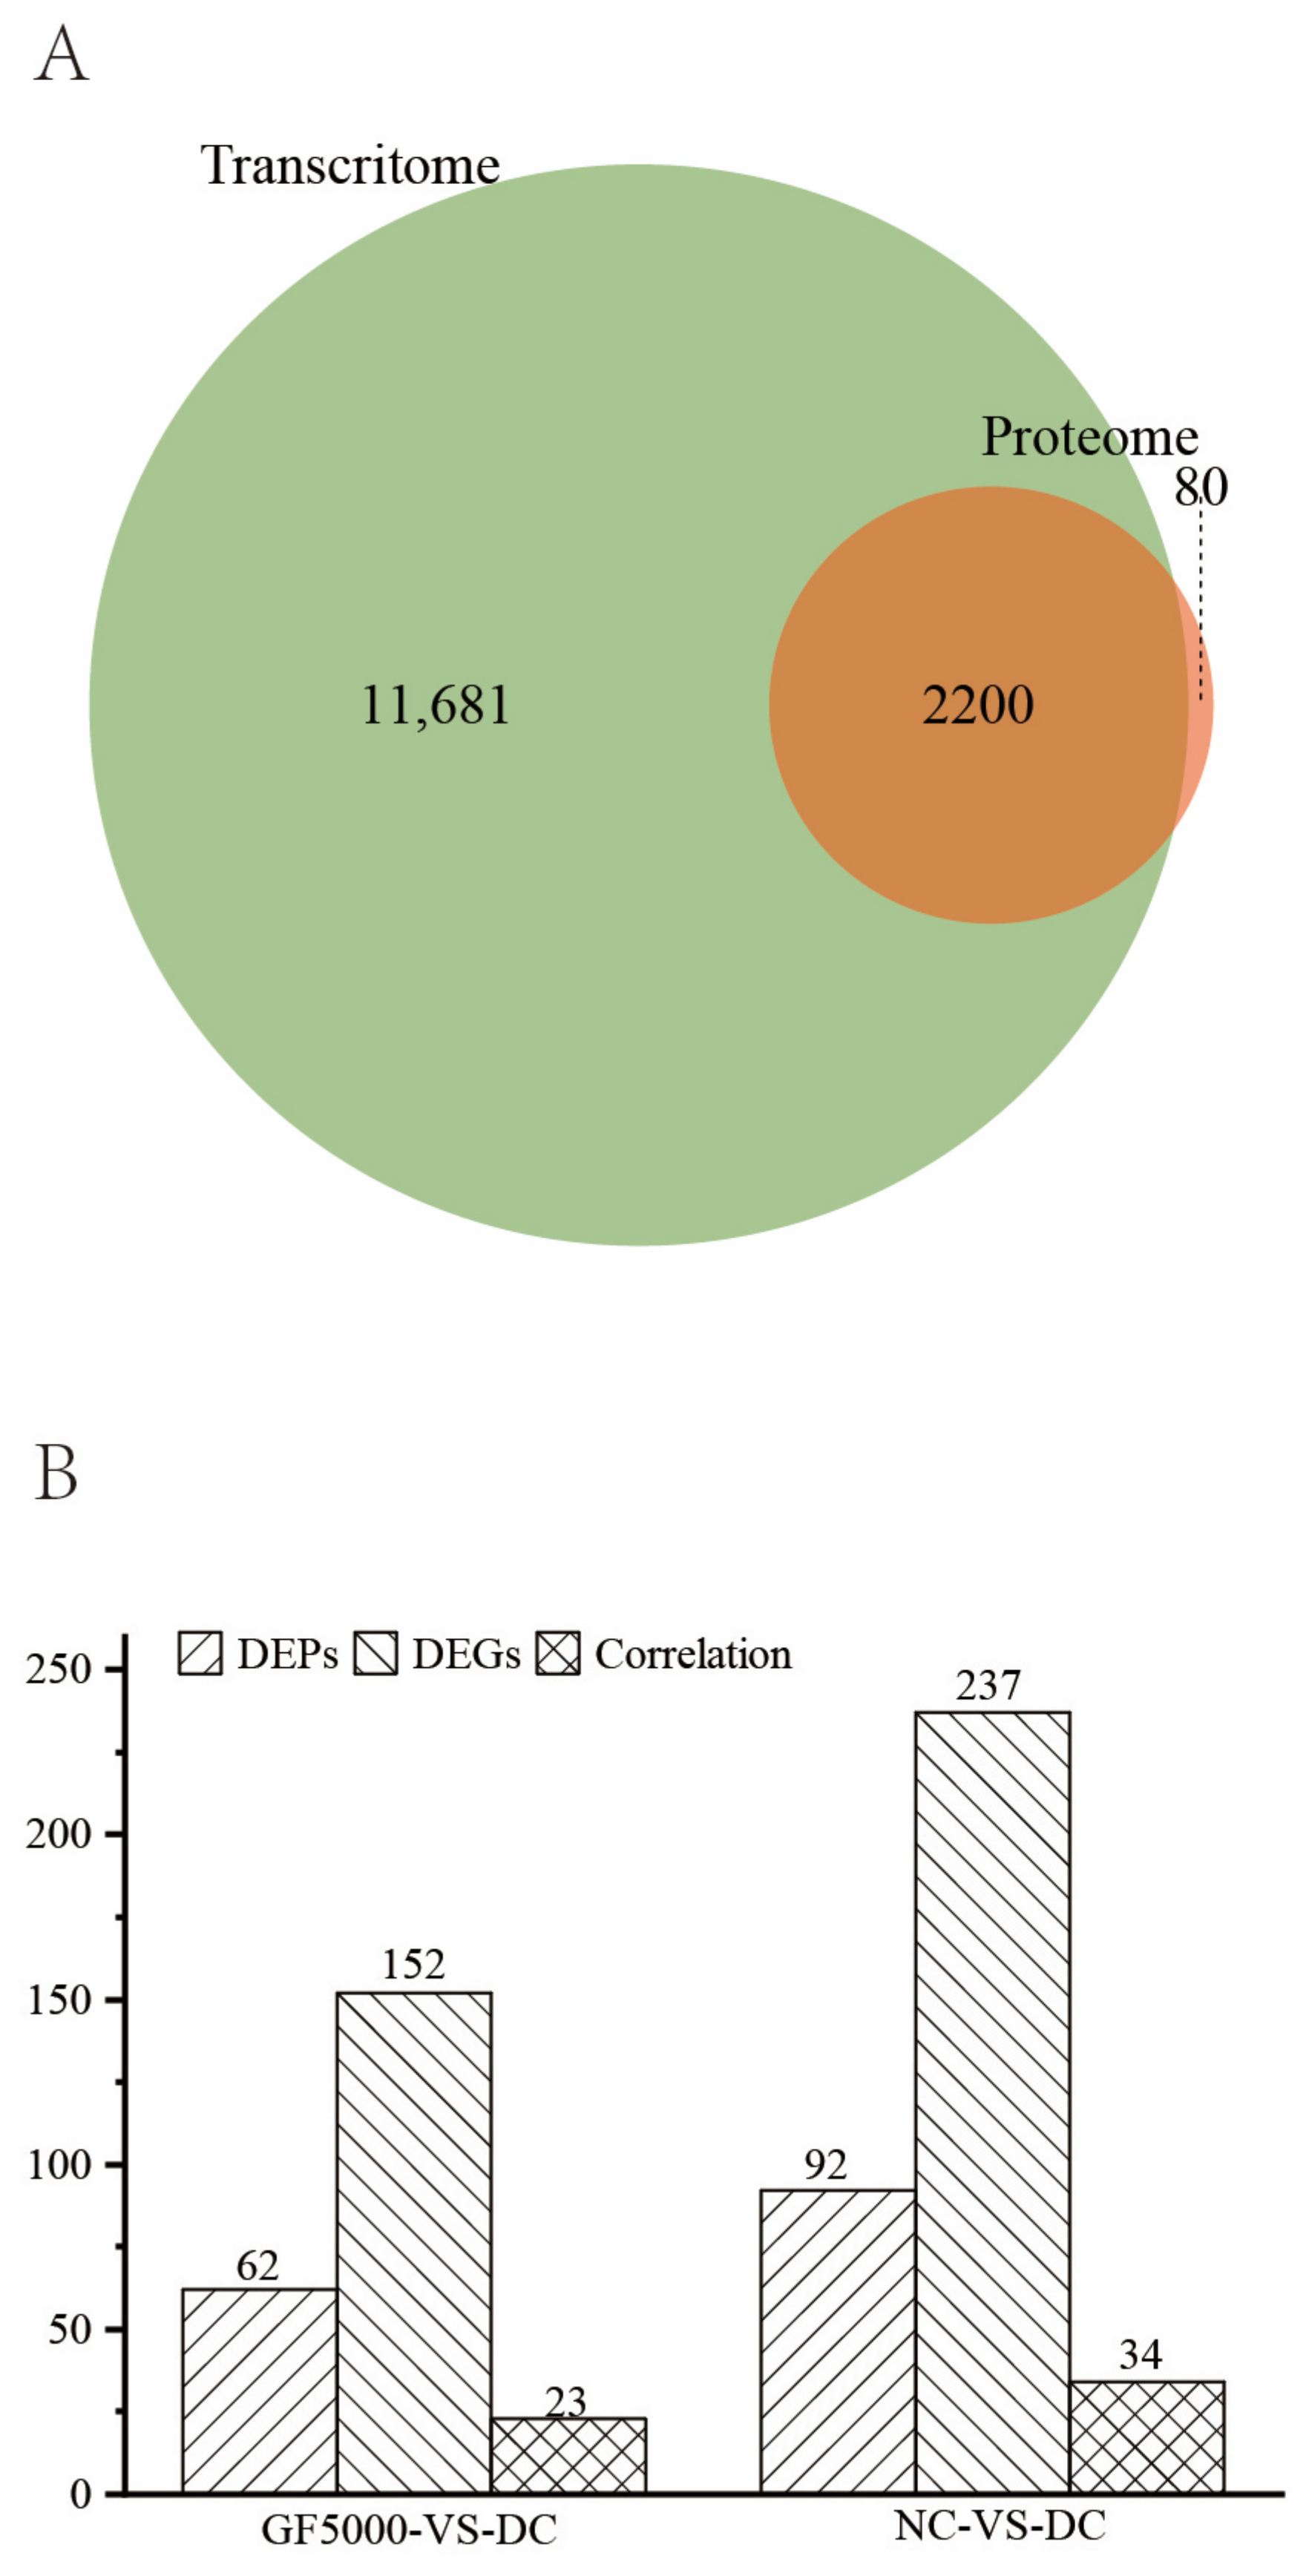
3.4. DEGs and DEPs Showing the Same Trends in the GF5000-VS-DC Comparison
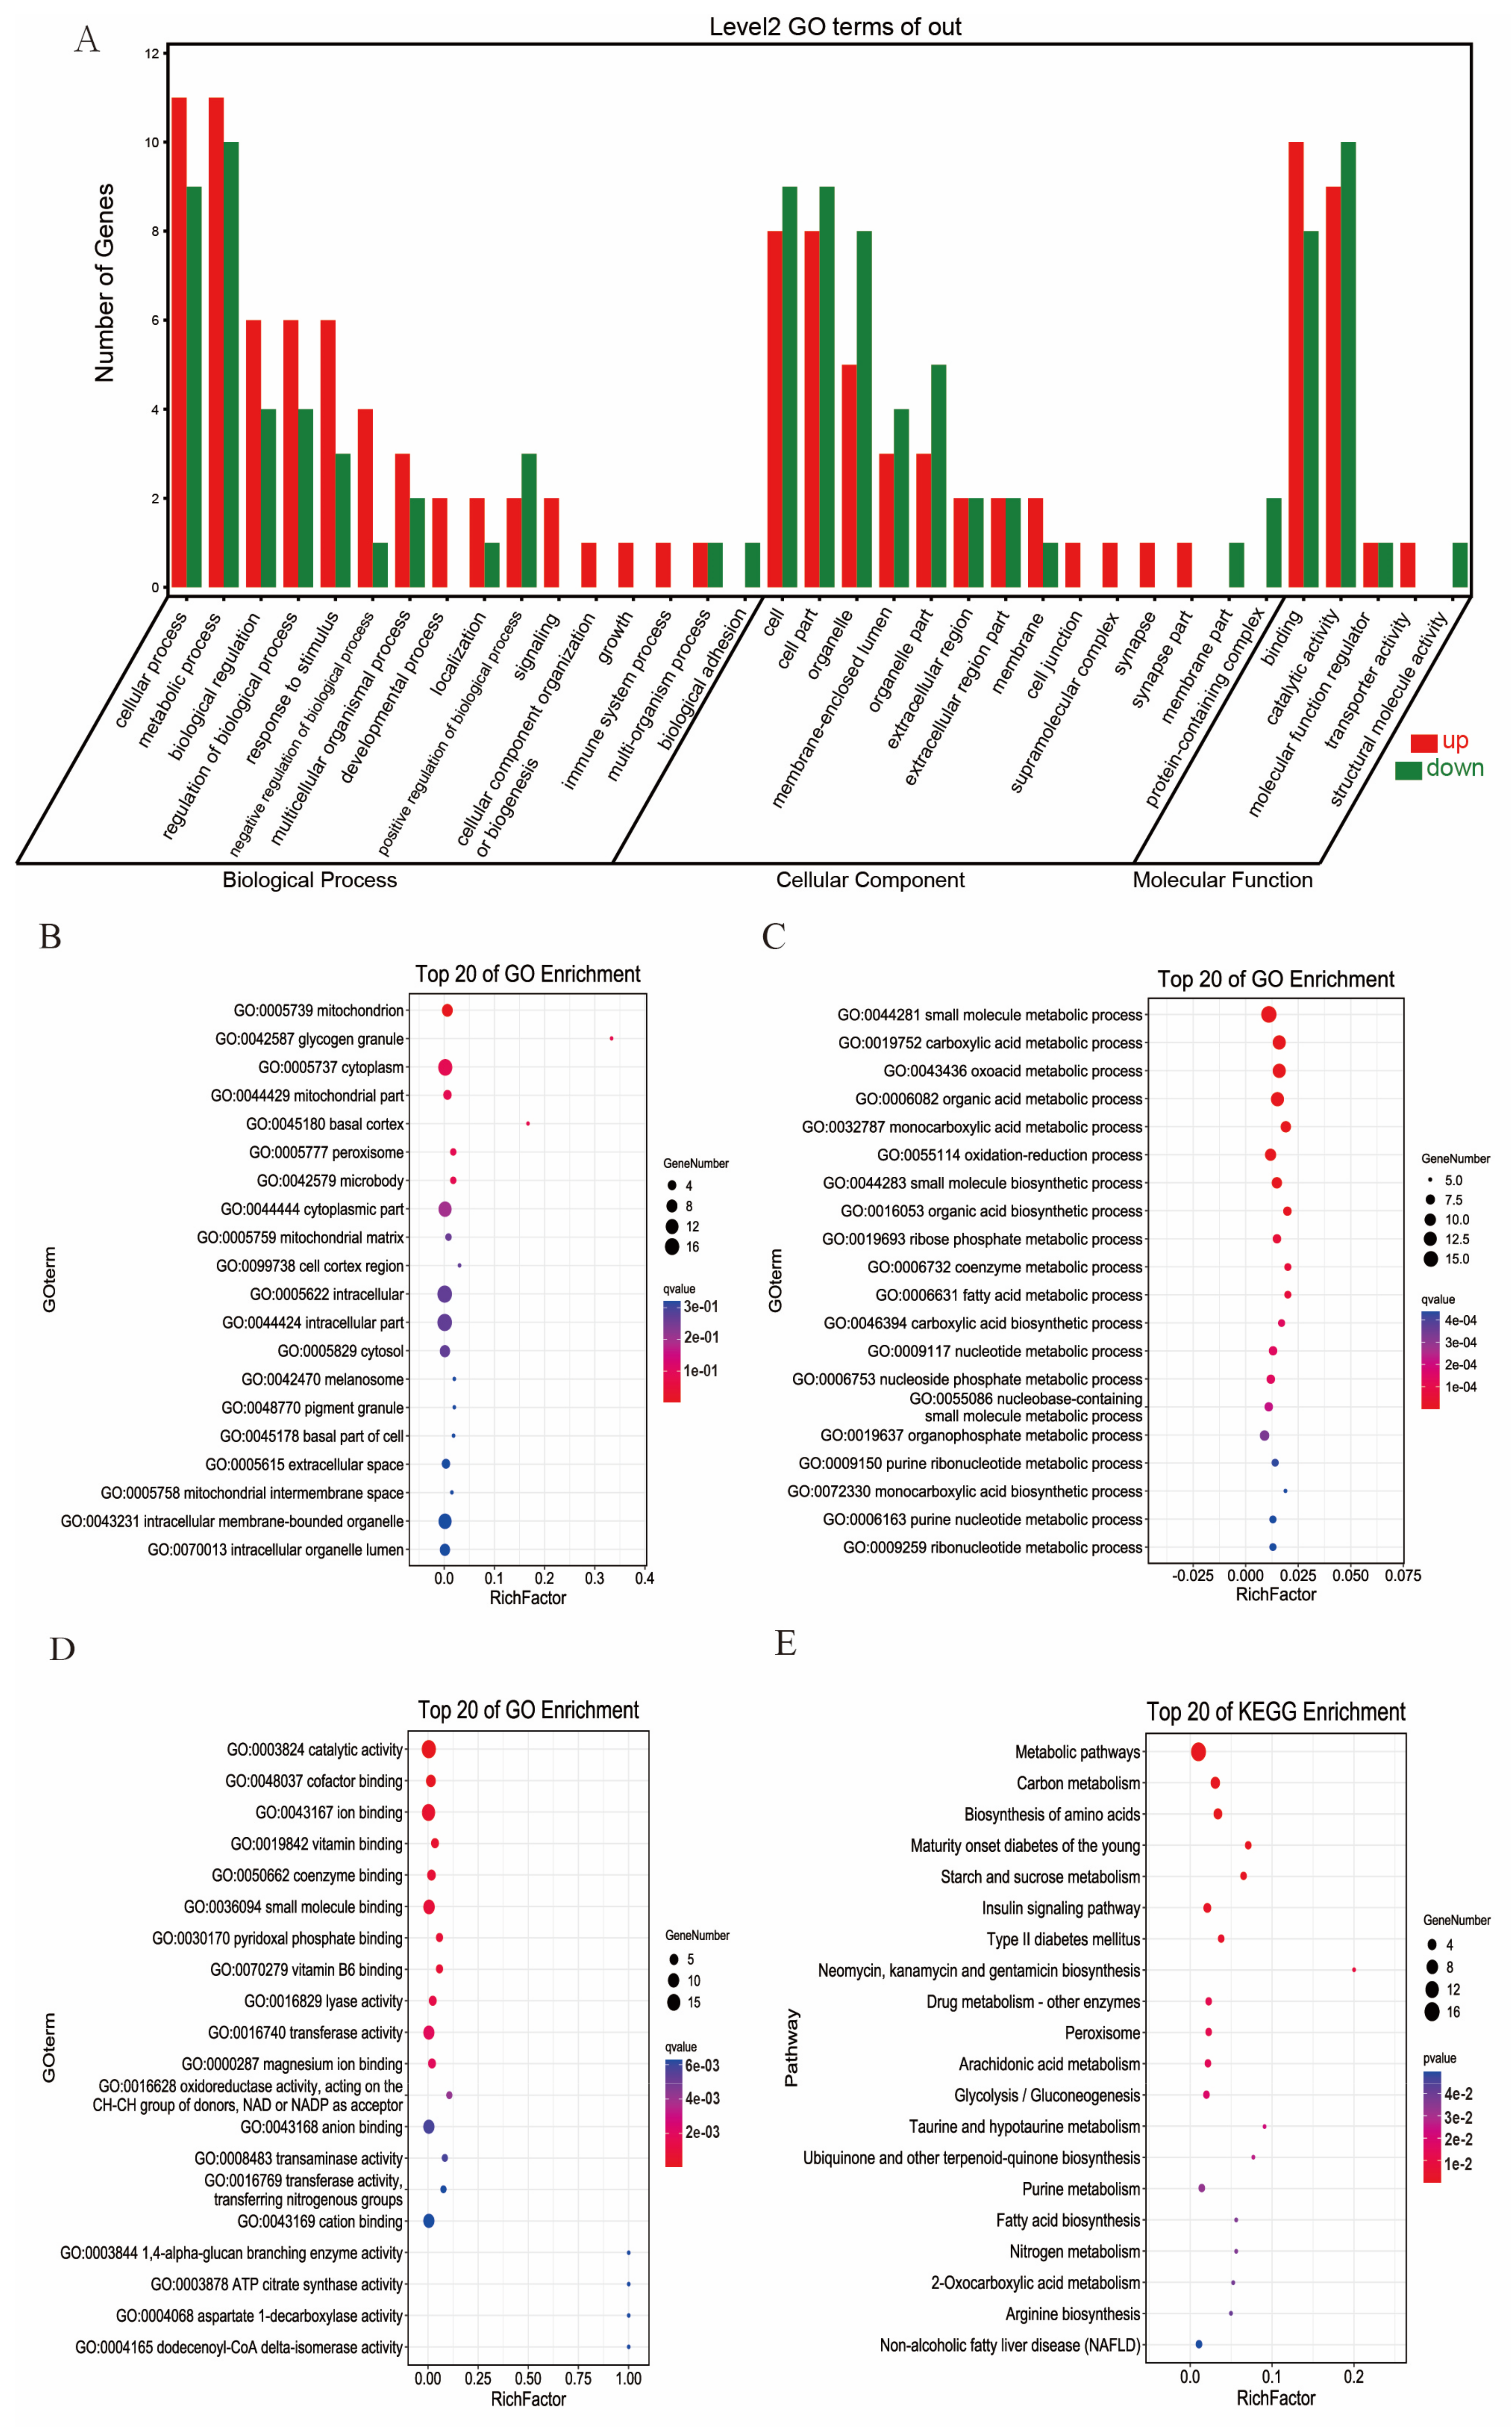
3.5. GO and KEGG Pathway Enrichment Analysis of DEGs and DEPs with the Same Trends
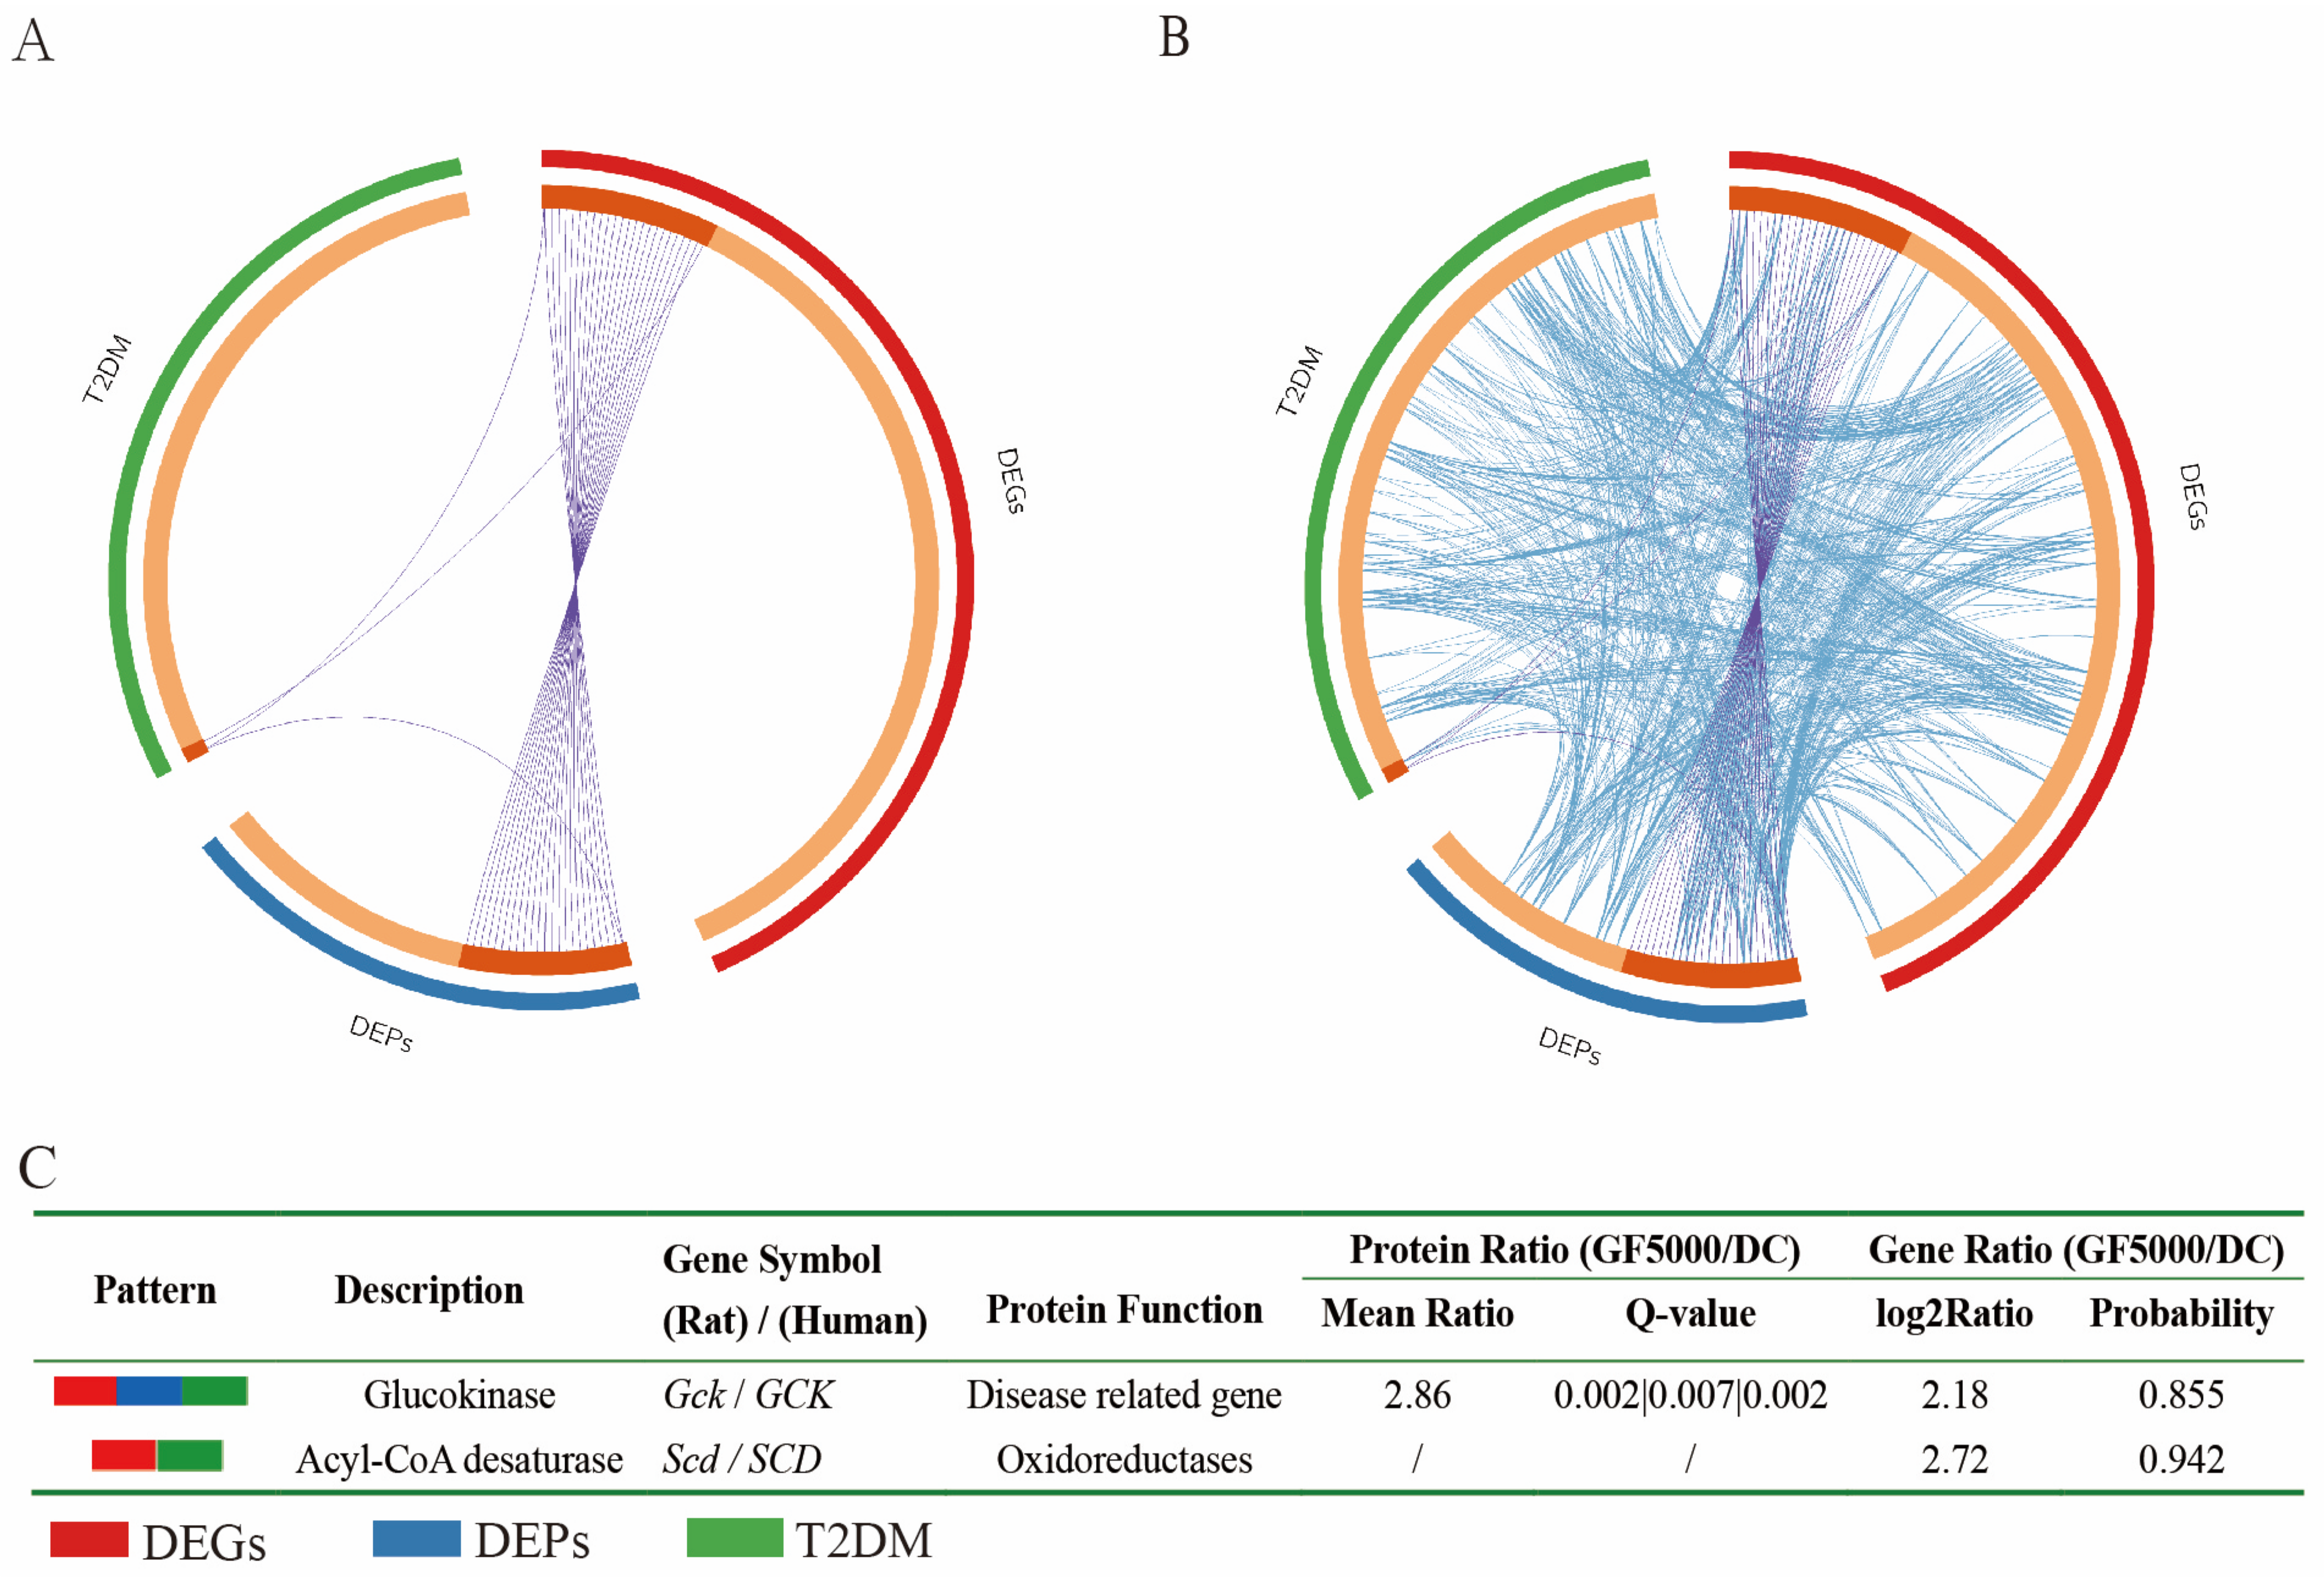
3.6. Relationships Among T2DM Disease Genes, DEGs (Human), and DEPs (Human)
3.7. Analysis of the Genes Common to the Identified DEGs and DEPs in Combination with T2DM Targets
3.8. Cytoscape GeneMANIA Network Analysis
3.9. qPCR Analysis of GF5000-Treated GCK-Knockdown HepG2 Cells
4. Discussion
5. Conclusions
Supplementary Materials
Author Contributions
Funding
Institutional Review Board Statement
Data Availability Statement
Conflicts of Interest
Abbreviations
| AMPK-α | Activated protein kinase-α |
| APOA-1 | Apolipoprotein A-I |
| BMI | Body mass index |
| cMAP | Connectivity MAP analysis |
| GCK | Glucokinase |
| GCKR | Glucokinase regulatory protein |
| GLUT4 | Glucose transporter 4 |
| GO | Gene ontology |
| GSEA | Gene-set enrichment analysis |
| GSK-3 | Glycogen synthase kinase 3 |
| HbA1c | Hemoglobin A1c |
| IR | Insulin receptor |
| IRS1 | Insulin receptor substrate 1 |
| KEGG | Kyoto Encyclopedia of Genes and Genomes |
| PKB | Protein kinase B |
| PI3K | Phosphatidylinositol-3-kinase |
| T2DM | Type 2 diabetes mellitus |
| TG | Triglyceride |
| STZ | Streptozotocin |
References
- Sun, H.; Saeedi, P.; Karuranga, S.; Pinkepank, M.; Ogurtsova, K.; Duncan, B.B.; Stein, C.; Basit, A.; Chan, J.C.N.; Mbanya, J.C.; et al. IDF Diabetes Atlas: Global, regional and country-level diabetes prevalence estimates for 2021 and projections for 2045. Diabetes Res. Clin. Pract. 2022, 183, 109119. [Google Scholar] [CrossRef] [PubMed]
- ElSayed, N.A.; Aleppo, G.; Bannuru, R.R.; Bruemmer, D.; Collins, B.S.; Ekhlaspour, L.; Hilliard, M.E.; Johnson, E.L.; Khunti, K.; Lingvay, I.; et al. Summary of revisions: Standards of care in diabetes—2024. Diabetes Care 2024, 47, S5–S10. [Google Scholar]
- Téllez-Téllez, M.; Díaz-Godínez, G. Mushrooms and fungi and their biological compounds with antidiabetic activity: A review. Int. J. Med. Mushrooms 2024, 26, 13–24. [Google Scholar] [CrossRef] [PubMed]
- Wu, J.Y.; Siu, K.C.; Geng, P. Bioactive ingredients and medicinal values of Grifola frondosa (Maitake). Foods 2021, 10, 10010095. [Google Scholar] [CrossRef]
- Ren, B.; Wei, S.X.; Huang, H. Recent advances in Grifola frondosa polysaccharides: Production, properties, and bioactivities. Curr. Opin. Food Sci. 2023, 49, 100946. [Google Scholar] [CrossRef]
- Liu, X.F.; Luo, D.H.; Guan, J.J.; Chen, J.; Xu, X.F. Mushroom polysaccharides with potential in anti-diabetes: Biological mechanisms, extraction, and future perspectives: A review. Front. Nutr. 2022, 9, 1087826. [Google Scholar] [CrossRef]
- Lei, H.; Ma, X.; Wu, W.T. Anti-diabetic effect of an alpha-glucan from fruit body of maitake (Grifola frondosa) on KK-Ay mice. J. Pharm. Pharmacol. 2007, 59, 575–582. [Google Scholar]
- Lei, H.; Zhang, M.; Wang, Q.; Guo, S.; Han, J.; Sun, H.; Wu, W. MT-alpha-glucan from the fruit body of the maitake medicinal mushroom Grifola frondosa (higher Basidiomyetes) shows protective effects for hypoglycemic pancreatic beta-cells. Int. J. Med. Mushrooms 2013, 15, 373–381. [Google Scholar] [CrossRef]
- Lei, H.; Guo, S.; Han, J.; Wang, Q.; Zhang, X.; Wu, W. Hypoglycemic and hypolipidemic activities of MT-α-glucan and its effect on immune function of diabetic mice. Carbohydr. Polym. 2012, 89, 245–250. [Google Scholar] [CrossRef]
- Kubo, K.; Aoki, H.; Nanba, H. Antidiabetic activity present in the fruit body of Grifola frondosa (Maitake). I. Biol. Pharm. Bull. 1994, 17, 1106–1110. [Google Scholar] [CrossRef]
- Manohar, V.; Talpur, N.A.; Echard, B.W.; Lieberman, S.; Preuss, H.G. Effects of a water-soluble extract of maitake mushroom on circulating glucose/insulin concentrations in KK mice. Diabetes Obes. Metab. 2002, 4, 43–48. [Google Scholar] [CrossRef] [PubMed]
- Preuss, H.G.; Echard, B.; Bagchi, D.; Perricone, N.V.; Zhuang, C. Enhanced insulin-hypoglycemic activity in rats consuming a specific glycoprotein extracted from maitake mushroom. Mol. Cell Biochem. 2007, 306, 105–113. [Google Scholar] [CrossRef] [PubMed]
- Konno, S.; Alexander, B.; Zade, J.; Choudhury, M. Possible hypoglycemic action of SX-fraction targeting insulin signal transduction pathway. Int. J. Gen. Med. 2013, 6, 181–187. [Google Scholar] [CrossRef] [PubMed]
- Chen, Y.; Liu, D.; Wang, D.; Lai, S.; Zhong, R.; Liu, Y.; Yang, C.; Liu, B.; Sarker, M.R.; Zhao, C. Hypoglycemic activity and gut microbiota regulation of a novel polysaccharide from Grifola frondosa in type 2 diabetic mice. Food Chem. Toxicol. 2019, 126, 295–302. [Google Scholar] [CrossRef]
- Ma, X.; Zhou, F.; Chen, Y.; Zhang, Y.; Hou, L.; Cao, X.; Wang, C. A polysaccharide from Grifola frondosa relieves insulin resistance of HepG2 cell by Akt-GSK-3 pathway. Glycoconj. J. 2014, 31, 355–363. [Google Scholar] [CrossRef]
- Chen, Y.; Liu, Y.; Sarker, M.M.R.; Yan, X.; Yang, C.; Zhao, L.; Lv, X.; Liu, B.; Zhao, C. Structural characterization and antidiabetic potential of a novel heteropolysaccharide from Grifola frondosa via IRS1/PI3K-JNK signaling pathways. Carbohydr. Polym. 2018, 198, 452–461. [Google Scholar] [CrossRef]
- Pan, Y.Y.; Wan, X.Z.; Zeng, F.; Zhong, R.T.; Guo, W.L.; Lv, X.C.; Zhao, C.; Liu, B. Regulatory effect of Grifola frondosa extract rich in polysaccharides and organic acids on glycolipid metabolism and gut microbiota in rats. Int. J. Biol. Macromol. 2020, 155, 1030–1039. [Google Scholar] [CrossRef]
- Guo, W.L.; Deng, J.C.; Pan, Y.Y.; Xu, J.X.; Hong, J.L.; Shi, F.F.; Liu, G.L.; Qian, M.; Bai, W.D.; Zhang, W.; et al. Hypoglycemic and hypolipidemic activities of Grifola frondosa polysaccharides and their relationships with the modulation of intestinal microflora in diabetic mice induced by high-fat diet and streptozotocin. Int. J. Biol. Macromol. 2020, 153, 1231–1240. [Google Scholar] [CrossRef]
- Xiao, C.; Wu, Q.; Xie, Y.; Zhang, J.; Tan, J. Hypoglycemic effects of Grifola frondosa (Maitake) polysaccharides F2 and F3 through improvement of insulin resistance in diabetic rats. Food Funct. 2015, 6, 3567–3575. [Google Scholar] [CrossRef]
- Xiao, C.; Jiao, C.W.; Xie, Y.Z.; Ye, L.H.; Li, Q.Q.; Wu, Q.P. Grifola frondosa GF5000 improves insulin resistance by modulation the composition of gut microbiota in diabetic rats. J. Funct. Foods 2021, 77, 104313. [Google Scholar] [CrossRef]
- Hansen, K.D.; Brenner, S.E.; Dudoit, S. Biases in Illumina transcriptome sequencing caused by random hexamer priming. Nucleic Acids Res. 2010, 38, e131. [Google Scholar] [CrossRef] [PubMed]
- Tarazona, S.; García-Alcalde, F.; Dopazo, J.; Ferrer, A.; Conesa, A. Differential expression in RNA-seq: A matter of depth. Genome Res. 2011, 21, 2213–2223. [Google Scholar] [CrossRef] [PubMed]
- Xu, P.; Duong, D.M.; Peng, J. Systematical optimization of reverse-phase chromatography for shotgun proteomics. J. Proteome Res. 2009, 8, 3944–3950. [Google Scholar] [CrossRef] [PubMed]
- Fang, W.; Xie, D.; Zhu, H.; Li, W.; Xu, Z.; Yang, L.; Li, Z.; Sun, L.; Wang, J.; Nie, L.; et al. Comparative proteomic analysis of Gossypium thurberi in response to Verticillium dahliae inoculation. Int. J. Mol. Sci. 2015, 16, 25121-25140. [Google Scholar] [CrossRef]
- Liu, J.Y.; Wang, D.M.; Xie, Z.Y.; Ding, L.; Li, S.H.; Ma, X.M.; Liu, J.; Ren, J.; Xiao, C.; Yang, C.R.; et al. Combination of pioglitazone and metformin actions on liver lipid metabolism in obese mice. Biomolecules 2023, 13, 1199. [Google Scholar] [CrossRef]
- Fu, J.F.; Xiao, W.X.; Gao, X.L.; Xu, J.; Yang, W.J.; Liu, J.R.; He, Q.Z.; Ma, K.Y.; Lian, J.X.; Chen, T.X.; et al. Effect and safety of pioglitazone-metformin tablets in the treatment of newly diagnosed type 2 diabetes patients with nonalcoholic fatty liver disease in Shaanxi province: A randomized, double-blinded, double-simulated multicenter study. J. Diabetes Res. 2023, 2023, 2044090. [Google Scholar]
- Gan, Z.D.; Zhao, M.Y.; Xia, Y.Y.; Yan, Y.Q.; Ren, W.K. Carbon metabolism in the regulation of macrophage functions. Trends Endocrin. Met. 2024, 35, 62–73. [Google Scholar] [CrossRef]
- Dang, S.; Jain, A.; Dhanda, G.; Bhattacharya, N.; Bhattacharya, A.; Senapati, S. One carbon metabolism and its implication in health and immune functions. Cell Biochem. Funct. 2024, 42, e3926. [Google Scholar] [CrossRef]
- Ling, Z.N.; Jiang, Y.F.; Ru, J.N.; Lu, J.H.; Ding, B.; Wu, J. Amino acid metabolism in health and disease. Signal Transduct. Target. Ther. 2023, 8, 345. [Google Scholar] [CrossRef]
- Chen, Y.; Wang, N.; Dong, X.L.; Zhu, J.F.; Chen, Y.; Jiang, Q.W.; Fu, C.W. Associations between serum amino acids and incident type 2 diabetes in Chinese rural adults. Nutr. Metab. Cardiovasc. Dis. 2021, 31, 2416–2425. [Google Scholar] [CrossRef]
- Sankanagoudar, S.; Shukla, R.; Shukla, K.K.; Sharma, P. Positive association of branched-chain amino acids with triglyceride and glycated haemoglobin in Indian patients with type 2 diabetes mellitus. Diabetes Metab. Syndr. 2022, 16, 102481. [Google Scholar] [CrossRef] [PubMed]
- Hameed, A.; Mojsak, P.; Buczynska, A.; Suleria, H.A.R.; Kretowski, A.; Ciborowski, M. Altered metabolome of lipids and amino acids species: A source of early signature biomarkers of T2DM. J. Clin. Med. 2020, 9, 2257. [Google Scholar] [CrossRef] [PubMed]
- King, T.W.; Cochran, B.J.; Rye, K.A. ApoA-I and diabetes. Arterioscl. Thromb. Vasc. Biol. 2023, 43, 1362–1368. [Google Scholar] [CrossRef] [PubMed]
- Ren, Y.X.; Li, L.; Wan, L.; Huang, Y.; Cao, S. Glucokinase as an emerging anti-diabetes target and recent progress in the development of its agonists. J. Enzyme Inhib. Med. Chem. 2022, 37, 606–615. [Google Scholar] [CrossRef]
- Nakamura, A.; Omori, K.; Terauchi, Y. Glucokinase activation or inactivation: Which will lead to the treatment of type 2 diabetes? Diabetes Obes. Metab. 2021, 23, 2199–2206. [Google Scholar] [CrossRef]
- Thilagavathi, R.; Hosseini-Zare, M.S.; Malini, M.; Selvam, C. A comprehensive review on glucokinase activators: Promising agents for the treatment of type 2 diabetes. Chem. Biol. Drug Des. 2022, 99, 247–263. [Google Scholar] [CrossRef]
- Kaminski, M.T.; Schultz, J.; Waterstradt, R.; Tiedge, M.; Lenzen, S.; Baltrusch, S. Glucose-induced dissociation of glucokinase from its regulatory protein in the nucleus of hepatocytes prior to nuclear export. BBA Mol. Cell Res. 2014, 1843, 554–564. [Google Scholar] [CrossRef]
- Zhang, Z.Q.; Ji, G.; Li, M. Glucokinase regulatory protein: A balancing act between glucose and lipid metabolism in NAFLD. Front. Endocrinol. 2023, 14, 1247611. [Google Scholar] [CrossRef]
- Wang, K.; Shi, M.; Luk, A.O.Y.; Kong, A.P.S.; Ma, R.C.W.; Li, C.; Chen, L.; Chow, E.; Chan, J.C.N. Impaired GK-GKRP interaction rather than direct GK activation worsens lipid profiles and contributes to long-term complications: A Mendelian randomization study. Cardiovasc. Diabetol. 2024, 23, 228. [Google Scholar] [CrossRef]
- Paliwal, A.; Paliwal, V.; Jain, S.; Paliwal, S.; Sharma, S. Current insight on the role of glucokinase and glucokinase regulatory protein in diabetes. Mini-Rev. Med. Chem. 2024, 24, 674–688. [Google Scholar] [CrossRef]
- Haeusler, R.A.; Camastra, S.; Astiarraga, B.; Nannipieri, M.; Anselmino, M.; Ferrannini, E. Decreased expression of hepatic glucokinase in type 2 diabetes. Mol. Metab. 2015, 4, 222–226. [Google Scholar] [CrossRef]
- Hu, X.; Guo, F. Amino acid sensing in metabolic homeostasis and health. Endocr. Rev. 2021, 42, 56–76. [Google Scholar] [CrossRef]


| Rank | Perturbagen | Score | Dose | Cell | Up | Down | ATC |
|---|---|---|---|---|---|---|---|
| 1 | Enalapril | 0.865 | 8 µM | MCF7 | 0.233 | −0.216 | C |
| 2 | Tribenoside | 0.857 | 8 µM | HL60 | 0.303 | −0.142 | C |
| 3 | Metformin | 0.854 | 24 µM | HL60 | 0.204 | −0.24 | A |
| 4 | Biotin | 0.832 | 16 µM | PC3 | 0.332 | −0.1 | A |
| 5 | Methotrexate | 0.827 | 9 µM | HL60 | 0.275 | −0.154 | L |
| 6 | Furosemide | 0.797 | 12 µM | HL60 | 0.24 | −0.173 | C |
| 7 | Chenodeoxycholic acid | 0.796 | 10 µM | MCF7 | 0.233 | −0.18 | A |
| 8 | Pindolol | 0.792 | 16 µM | PC3 | 0.249 | −0.162 | C |
| 9 | Lomustine | 0.791 | 100 µM | PC3 | 0.232 | −0.179 | L |
| 10 | Lomustine | 0.789 | 100 µM | MCF7 | 0.249 | −0.16 | L |
| 11 | Mesalazine | 0.787 | 26 µM | MCF7 | 0.245 | −0.164 | A |
| 12 | Cyclopenthiazide | 0.782 | 11 µM | HL60 | 0.194 | −0.212 | C |
| 13 | Rosiglitazone | 0.779 | 10 µM | MCF7 | 0.235 | −0.169 | A |
| 14 | Troglitazone | 0.777 | 10 µM | PC3 | 0.278 | −0.125 | A |
| 15 | Nifedipine | 0.772 | 12 µM | PC3 | 0.144 | −0.257 | C |
| 16 | Ciclosporin | 0.768 | 3 µM | PC3 | 0.204 | −0.194 | L |
| 17 | Vinblastine | 0.762 | 100 nM | MCF7 | 0.197 | −0.199 | L |
| 18 | Rescinnamine | 0.755 | 6 µM | HL60 | 0.225 | −0.166 | C |
| 19 | Sirolimus | 0.755 | 100 nM | HL60 | 0.209 | −0.182 | L |
| 20 | Rilmenidine | 0.751 | 8 µM | PC3 | 0.197 | −0.193 | C |
| No. | Protein/Gene ID | Protein/Gene Name | Protein Ratio (GF5000/DC) | Gene Ratio (GF5000/DC) | ||
|---|---|---|---|---|---|---|
| Mean Ratio | Q-Value | Log2 Ratio | Probability | |||
| 1 | O08651/58835 | D-3-phosphoglycerate dehydrogenase/Phgdh | 3.38 | 0.002|0.191|0.004 | 3.19 | 0.898 |
| 2 | P12785/50671 | Fatty acid synthase/Fasn | 2.77 | 0.002|0.004|0.002 | 2.43 | 0.880 |
| 3 | Q64611/60356 | Cysteine sulfinic acid decarboxylase/Csad | 1.85 | 0.002|0.009|0.008 | 2.37 | 0.917 |
| 4 | P17712/24385 | Glucokinase/Gck | 2.86 | 0.002|0.007|0.002 | 2.18 | 0.855 |
| 5 | P55053/140868 | Fatty acid-binding protein/Fabp5 | 1.73 | 0.002|0.659|0.002 | 1.99 | 0.880 |
| 6 | P14141/54232 | Carbonic anhydrase 3/Car3 | 1.92 | 0.002|0.004|0.002 | 1.84 | 0.901 |
| 7 | P16638/24159 | ATP-citrate synthase/Acly | 1.9 | 0.002|0.081|0.002 | 1.47 | 0.830 |
| 8 | P14046/297568 | alpha-1-inhibitor III/LOC297568 | 1.61 | 0.002|0.004|0.002 | 1.32 | 0.865 |
| 9 | B1WBN9/24651 | pyruvate kinase PKLR/Pklr | 2.05 | 0.002|0.013|0.002 | 1.17 | 0.841 |
| 10 | P50137/64524 | Transketolase/Tkt | 1.47 | 0.002|0.841|0.002 | 1.06 | 0.824 |
| 11 | A0A096MJY6/288333 | 1,4-alpha-glucan-branching enzyme 1/Gbe1 | 1.58 | 0.002|0.004|0.002 | 1.05 | 0.811 |
| 12 | P04182/64313 | Ornithine aminotransferase/Oat | 0.43 | 0.282|0.607|0.414 | −1.58 | 0.876 |
| 13 | P05182/25086 | Cytochrome P450 2E1/Cyp2e1 | 0.47 | 0.003|0.091|0.004 | −1.87 | 0.904 |
| 14 | P25409/81670 | Alanine aminotransferase 1/Gpt | 0.44 | 0.003|0.049|0.002 | −1.23 | 0.850 |
| 15 | P32755/29531 | 4-hydroxyphenylpyruvate dioxygenase/Hpd | 0.61 | 0.002|0.004|0.002 | −1.24 | 0.856 |
| 16 | Q9Z2M4/64461 | Peroxisomal 2,4-dienoyl-CoA reductase/Decr2 | 0.58 | 0.018|0.004|0.072 | −1.06 | 0.818 |
| 17 | Q63581/24903 | T-kininogen 1/Kng1 | 0.79 | 0.033|0.831|0.012 | −1.08 | 0.836 |
| 18 | Q4V8F9/313200 | Hydroxysteroid dehydrogenase-like protein 2/Hsdl2 | 0.43 | 0.002|0.126|0.009 | −1.11 | 0.804 |
| 19 | G3V734/117543 | 2,4-dienoyl CoA reductase 1/Decr1 | 0.61 | 0.004|0.017|0.058 | −1.19 | 0.844 |
| 20 | Q6SKG1/24763 | Acyl-coenzyme A synthetase ACSM3, mitochondrial/Acsm3 | 0.55 | 0.002|0.206|0.004 | −1.32 | 0.833 |
| 21 | Q62651/64526 | Delta(3,5)-Delta(2,4)-dienoyl-CoA isomerase, mitochondrial/Ech1 | 0.73 | 0.002|0.795|0.002 | −1.43 | 0.869 |
| 22 | P80299/65030 | Bifunctional epoxide hydrolase 2/Ephx2 | 0.57 | 0.002|0.024|0.004 | −1.93 | 0.892 |
| 23 | Q68G41/29740 | Enoyl-CoA delta isomerase 1, mitochondrial/Eci1 | 0.55 | 0.002|0.004|0.002 | −1.94 | 0.902 |
| Number | Protein Description | Gene Symbol
(Rat)/(Human) | Protein Ratio (GF5000/DC) | Gene Ratio (GF5000/DC) | ||
|---|---|---|---|---|---|---|
| Mean Ratio | Q-Value | Log2 Ratio | Probability | |||
| 1 | Bile salt export Pump | Abcb4/ABCB11 | / | −2.20 | 0.889129025 | |
| 2 | Acetyl-CoA Carboxylase 1 | Acaca/ACACB | 2.23 | 0.002|0.135|0.002 | −1.94 | 0.902120404 |
| 3 | Aldehyde oxidase | Aox1/AOX1 | 1.15 | 0.172|0.018|0.002 | / | |
| 4 | Apolipoprotein A-I | Apoa1/APOA1 | 0.57 | 0.002|0.021|0.002 | / | |
| 5 | Glucokinase | Gck/GCK | 2.86 | 0.002|0.007|0.002 | 2.18 | 0.855341834 |
| 6 | Glucokinase regulatory protein | Gckr/GCKR | 1.39 | 0.004|0.770|0.037 | / | |
| 7 | Glutamine synthetase | Glul/GLUL | / | −1.26 | 0.853012511 | |
| 8 | Acyl-CoA desaturase 1 | Scd/SCD | / | 2.72 | 0.94223519 | |
| 9 | Histone cluster 1 H1 family member c | Hist1h1c/HIST1H1B | 1.27 | 0.002|0.004|0.002 | / | |
| 10 | Pre-mRNA-processing factor 6 | Prpf6/PRPF6 | 1.90 | 0.008|0.004|0.243 | / | |
| 11 | Serpin H1 | Serpinh1/SERPINH1 | 0.56 | 0.003|0.781|0.020 | / | |
| 12 | SH3 and cysteine rich domain 3 | Stac3/STAC3 | / | 3.09 | 0.94514084 | |
| 13 | Cytochrome P450 3A9 | Cyp3a9/TBXAS1 | / | −3.15 | 0.936207766 | |
| Type of Interaction | Interaction (%) |
|---|---|
| Predicted | 63.97% |
| Co-expression | 22.02% |
| Physical Interactions | 12.81% |
| Co-localization | 1.19% |
| Gene | Protein Description | Degree Centrality | Interacting Gene | Interaction Type of Networks * |
|---|---|---|---|---|
| Apoa1 | Apolipoprotein A-I | 13 | Gckr, Cyp3a9, Pon1, Apoc1, Txndc2, Spef2, Qdpr, C1qa, Pde4b, Tomm20, Hba-a1, Apof | 1,3,4 |
| Gckr | Glucokinase regulatory protein | 10 | Stac3, Qdpr, Scd, Apoa1, Cyp3a9, Gck, Glud1 | 1,2,3 |
| Gck | Glucokinase | 9 | Ins2, Gckr, Pfkfb1, Glud1, Pfkfb3, Pfkfb2, | 1,2,3 |
| Cyp3a9 | Cytochrome P450 3A9 | 6 | Glud1, Pon1, Aox1, Glul, Gckr, Apoa1 | 1,4 |
| Scd | Acyl-CoA desaturase 1 | 4 | Stac3, Gckr, Pfkfb1, Cyb5a | 1,3 |
| Glul | Glutamine synthetase | 4 | Cyp3a9, Htr2a, Glud1, Nudt18 | 1,3 |
| Aox1 | Aldehyde oxidase 1 | 2 | Cyp3a9, Cyb5a | 1 |
| Serpinh1 | Serpin H1 | 2 | Nudt18, Qdpr | 1 |
| Stac3 | SH3 and cysteine rich domain 3 | 2 | Scd, Gckr | 1 |
| Prpf6 | Pre-mRNA-processing factor 6 | 2 | Araf, Rnps1 | 3 |
| Hist1h1c | Histone cluster 1 H1 family member c | 1 | Nudt18 | 3 |
Disclaimer/Publisher’s Note: The statements, opinions and data contained in all publications are solely those of the individual author(s) and contributor(s) and not of MDPI and/or the editor(s). MDPI and/or the editor(s) disclaim responsibility for any injury to people or property resulting from any ideas, methods, instructions or products referred to in the content. |
© 2025 by the authors. Licensee MDPI, Basel, Switzerland. This article is an open access article distributed under the terms and conditions of the Creative Commons Attribution (CC BY) license (https://creativecommons.org/licenses/by/4.0/).
Share and Cite
Xiao, C.; Jiao, C.; Huang, L.; Hu, H.; Xie, Y.; Wu, Q. Network Pharmacology-Based Elucidation of the Hypoglycemic Mechanism of Grifola frondosa GF5000 Polysaccharides via GCK modulation in Diabetic Rats. Nutrients 2025, 17, 964. https://doi.org/10.3390/nu17060964
Xiao C, Jiao C, Huang L, Hu H, Xie Y, Wu Q. Network Pharmacology-Based Elucidation of the Hypoglycemic Mechanism of Grifola frondosa GF5000 Polysaccharides via GCK modulation in Diabetic Rats. Nutrients. 2025; 17(6):964. https://doi.org/10.3390/nu17060964
Chicago/Turabian StyleXiao, Chun, Chunwei Jiao, Longhua Huang, Huiping Hu, Yizhen Xie, and Qingping Wu. 2025. "Network Pharmacology-Based Elucidation of the Hypoglycemic Mechanism of Grifola frondosa GF5000 Polysaccharides via GCK modulation in Diabetic Rats" Nutrients 17, no. 6: 964. https://doi.org/10.3390/nu17060964
APA StyleXiao, C., Jiao, C., Huang, L., Hu, H., Xie, Y., & Wu, Q. (2025). Network Pharmacology-Based Elucidation of the Hypoglycemic Mechanism of Grifola frondosa GF5000 Polysaccharides via GCK modulation in Diabetic Rats. Nutrients, 17(6), 964. https://doi.org/10.3390/nu17060964