


Relationship Between Metabolic Age Determined by Bioimpedance and Insulin Resistance Risk Scales in Spanish Workers

 , , ,
, , ,
Abstract
1. Introduction
2. Materials and Methods
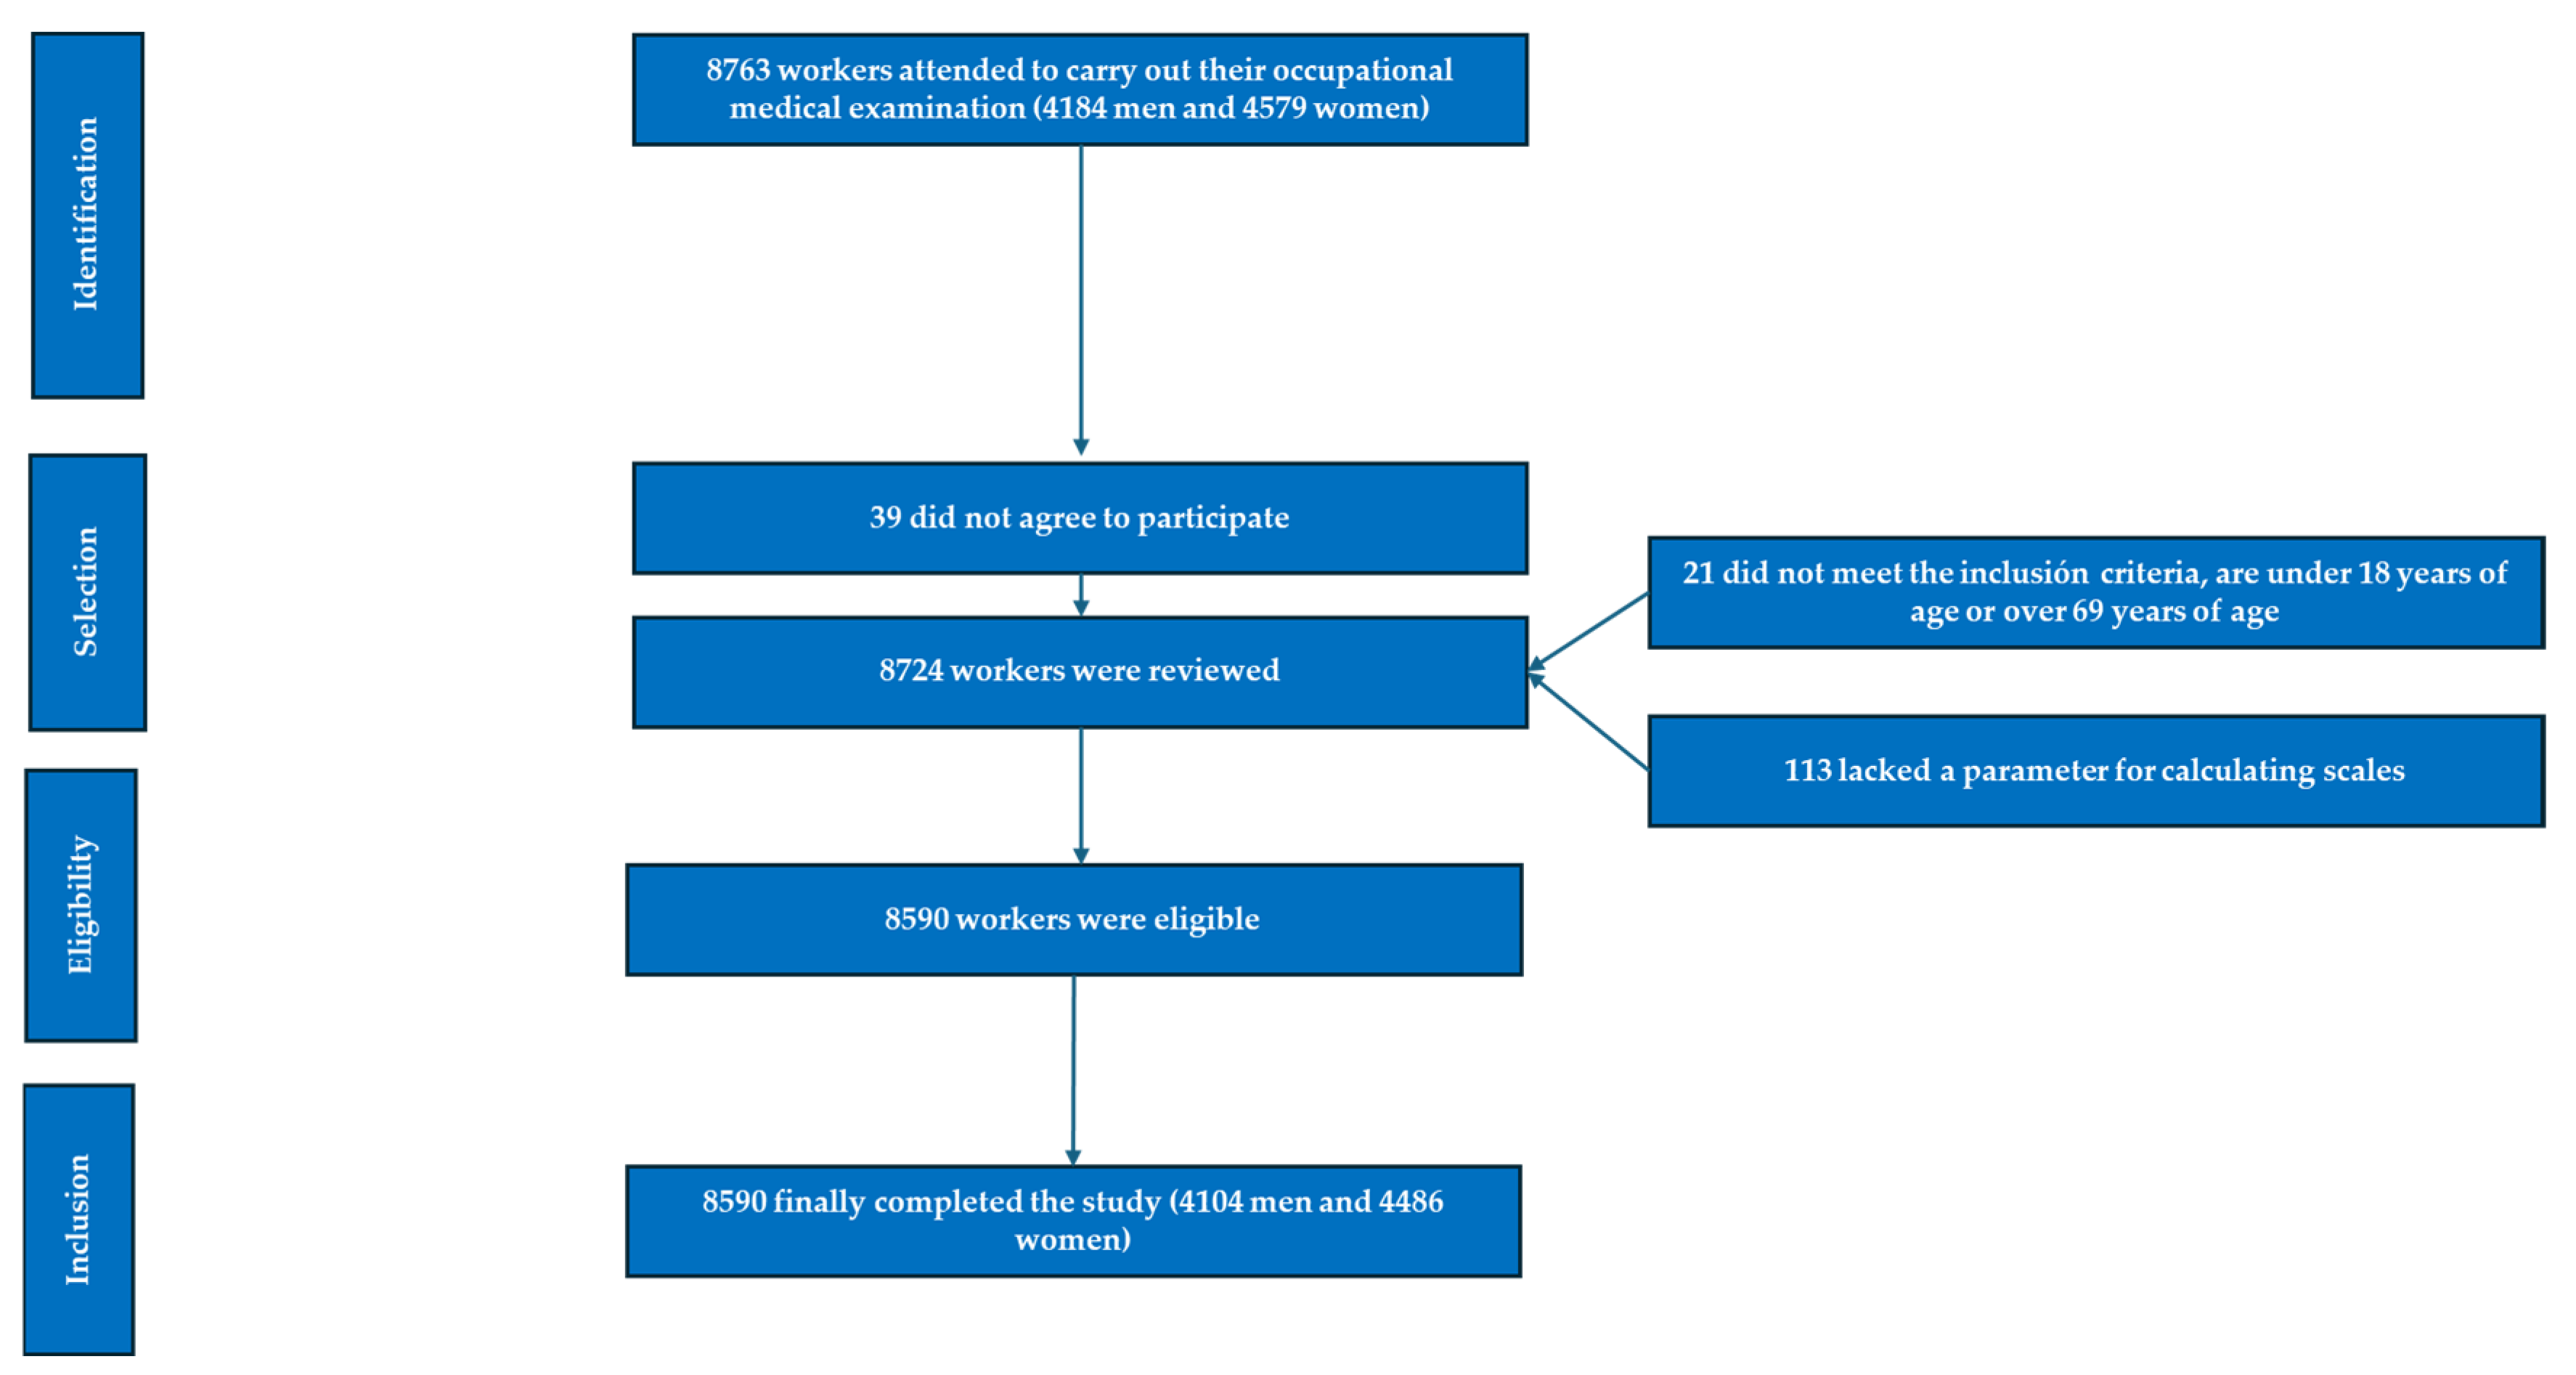
2.1. Participants
- Individuals aged 18–69 years.
- Voluntary participation in the study.
- Consent to the use of personal data for epidemiological purposes.
- Employment within one of the participating companies, without being on temporary disability leave during the study period.
- Individuals below 18 or above 69 years of age.
- Non-employees of participating companies.
- Refusal to participate in the study.
- Declined consent for data usage in epidemiological studies.
- Missing parameters required for scale calculations.
- Patients diagnosed with diabetes mellitus.
2.2. Variable Determination
- Anamnesis:
- Anthropometric and Clinical Measurements:
- Laboratory Analyses:
2.2.1. Anthropometric Measurements
2.2.2. Clinical Measurements
2.2.3. Laboratory Analyses
2.2.4. Risk Scales
2.3. Statistical Analysis
3. Results
4. Discussion
5. Strengths and Limitations
6. Conclusions
Author Contributions
Funding
Institutional Review Board Statement
Informed Consent Statement
Data Availability Statement
Conflicts of Interest
References
- DeFilippis, A.P.; Young, R.; McEvoy, J.W.; Michos, E.D.; Sandfort, V.; Kronmal, R.A.; McClelland, R.L.; Blaha, M.J. Risk score overestimation: The impact of individual cardiovascular risk factors and preventive therapies on the performance of the American Heart Association-American College of Cardiology-Atherosclerotic Cardiovascular Disease risk score in a modern multi-ethnic cohort. Eur. Heart J. 2017, 38, 598–608. [Google Scholar] [PubMed]
- Kain, P. COVID-19 Pandemic and Metabolic Aging. Acta Sci. Neurol. 2022, 5, 30–33. [Google Scholar] [CrossRef] [PubMed] [PubMed Central]
- Majzoub, A.; Elbardisi, H.; Madani, S.; Leisegang, K.; Mahdi, M.; Agarwal, A.; Henkel, R.; Khalafalla, K.; ElSaid, S.; Arafa, M. Impact of body composition analysis on male sexual function: A metabolic age study. Front. Endocrinol. 2023, 13, 1050441. [Google Scholar] [CrossRef] [PubMed] [PubMed Central]
- Vásquez-Alvarez, S.; Bustamante-Villagomez, S.K.; Vazquez-Marroquin, G.; Porchia, L.M.; Pérez-Fuentes, R.; Torres-Rasgado, E.; Herrera-Fomperosa, O.; Montes-Arana, I.; Gonzalez-Mejia, M.E. Metabolic Age, an Index Based on Basal Metabolic Rate, Can Predict Individuals That are High Risk of Developing Metabolic Syndrome. High Blood Press. Cardiovasc. Prev. 2021, 28, 263–270. [Google Scholar] [CrossRef]
- Aging Biomarker Consortium; Bao, H.; Cao, J.; Chen, M.; Chen, M.; Chen, W.; Chen, X.; Chen, Y.; Chen, Y.; Chen, Y.; et al. Biomarkers of aging. Sci. China Life Sci. 2023, 66, 893–1066. [Google Scholar] [CrossRef] [PubMed] [PubMed Central]
- Wang, J.G.; Zhang, Y.; Chen, H.E.; Li, Y.; Cheng, X.G.; Xu, L.; Guo, Z.; Zhao, X.-S.; Sato, T.; Cao, Q.-Y.; et al. Comparison of two bioelectrical impedance analysis devices with dual energy X-ray absorptiometry and magnetic resonance imaging in the estimation of body composition. J. Strength Cond. Res. 2013, 27, 236–243. [Google Scholar] [CrossRef] [PubMed]
- Roubenoff, R. Applications of bioelectrical impedance analysis for body composition to epidemiologic studies. Am. J. Clin. Nutr. 1996, 64, 459S–462S. [Google Scholar] [CrossRef] [PubMed]
- Kreissl, A.; Jorda, A.; Truschner, K.; Skacel, G.; Greber-Platzer, S. Clinically relevant body composition methods for obese pediatric patients. BMC Pediatr. 2019, 19, e84. [Google Scholar] [CrossRef]
- Coufalová, K.; Komarc, M.; Cochrane, D.J. Comparación de Análisis de Impedancia Bioeléctrica y Pletismografía de Desplazamiento de Aire. Int. J. Morphol. 2019, 37, 985–990. [Google Scholar] [CrossRef]
- Lührmann, P.M.; Herbert, B.M.; Neuhäuser-Berthold, M. Efectos de la masa grasa y la distribución de la grasa corporal en la tasa metabólica en reposo en ancianos. Metabolism 2001, 50, 972–975. [Google Scholar]
- Tanita Corporation of America Inc. Tanita Technical Bulletin: Regression Formula for Basal Metabolic Rate (BMR); Report No: TBRFLT1013.2013; Tanita Corporation of America Inc.: Arlington Heights, IL, USA, 2013. [Google Scholar]
- Day, K.; Kwok, A.; Evans, A.; Mata, F.; Verdejo-Garcia, A.; Hart, K.; Ward, L.C.; Truby, H. Comparison of a Bioelectrical Impedance Device against the Reference Method Dual Energy X-Ray Absorptiometry and Anthropometry for the Evaluation of Body Composition in Adults. Nutrients 2018, 10, 1469. [Google Scholar] [CrossRef] [PubMed]
- Rudnev, S.G.; Godina, E.Z. Studies on human body composition in Russia: Past and present. J. Physiol. Anthropol. 2022, 41, 18. [Google Scholar] [CrossRef] [PubMed] [PubMed Central]
- Feng, Q.; Bešević, J.; Conroy, M.; Omiyale, W.; Lacey, B.; Allen, N. Comparison of body composition measures assessed by bioelectrical impedance analysis versus dual-energy X-ray absorptiometry in the United Kingdom Biobank. Clin. Nutr. ESPEN 2024, 63, 214–225. [Google Scholar] [CrossRef] [PubMed]
- Cretescu, I.; Horhat, R.; Mocanu, V.; Munteanu, O. Bioelectrical Impedance Versus Air-Displacement Plethysmography for Body Fat Measurements in Subjects with Abdominal Obesity: A Comparative Study. Appl. Sci. 2025, 15, 2056. [Google Scholar] [CrossRef]
- Elguezabal-Rodelo, R.; Ochoa-Précoma, R.; Vazquez-Marroquin, G.; Porchia, L.M.; Montes-Arana, I.; Torres-Rasgado, E.; Méndez-Fernández, E.; Pérez-Fuentes, R.; Gonzalez-Mejia, M.E. Metabolic age correlates better than chronological age with waist-to-height ratio, a cardiovascular risk index. Med. Clin. 2021, 157, 409–417. [Google Scholar] [CrossRef]
- Wang, T.; Beyene, H.B.; Yi, C.; Cinel, M.; Mellett, N.A.; Olshansky, G.; Meikle, T.G.; Wu, J.; Dakic, A.; Watts, G.F.; et al. A lipidomic based metabolic age score captures cardiometabolic risk independent of chronological age. EBioMedicine 2024, 105, 105199. [Google Scholar] [CrossRef] [PubMed] [PubMed Central]
- Hertel, J.; Friedrich, N.; Wittfeld, K.; Pietzner, M.; Budde, K.; Van der Auwera, S.; Lohmann, T.; Teumer, A.; Völzke, H.; Nauck, M.; et al. Measuring Biological Age via Metabonomics: The Metabolic Age Score. J. Proteome Res. 2016, 15, 400–410. [Google Scholar] [CrossRef] [PubMed]
- Więch, P.; Sałacińska, I.; Walat, K.; Kózka, M.; Bazaliński, D. Can Singing in a Choir Be a Key Strategy for Lifelong Health? A Cross-sectional Study. J. Voice 2023, 37, 146.e11–146.e18. [Google Scholar] [CrossRef]
- Ślązak, A.; Przybylska, I.; Paprocka-Borowicz, M. Evaluation of Change in Body Composition, including Phase Angle, in Post-Myocardial Infarction Patients Rehabilitated under the KOS-Zawał (MC-AMI) Programme. J. Clin. Med. 2024, 13, 2784. [Google Scholar] [CrossRef] [PubMed] [PubMed Central]
- Munguía, L.; Camacho-Barcia, L.; Gaspar-Pérez, A.; Granero, R.; Galiana, C.; Jiménez-Murcia, S.; Dieguez, C.; Gearhardt, A.N.; Fernández-Aranda, F. Food addiction in Bulimia Nervosa: Analysis of body composition, psychological and problematic foods profile. Front. Psychiatry 2022, 13, 1032150. [Google Scholar] [CrossRef]
- Burlyaeva, E.A.; Prunceva, T.A.; Semenov, M.M.; Stakhanova, A.A.; Korotkova, T.N.; Elizarova, E.V. Body composition and basal metabolic rate in overweight and obese patients. Vopr. Pitan. 2022, 91, 78–86. [Google Scholar] [CrossRef] [PubMed]
- Kyle, U.G.; Bosaeus, I.; De Lorenzo, A.D.; Deurenberg, P.; Elia, M.; Gomez, J.M.; Heitmann, B.L.; Kent-Smith, L.; Melchior, J.-C.; Pirlich, M.; et al. Bioelectrical impedance analysis—Part I: Review of principles and methods. Clin. Nutr. 2004, 23, 1226–1243. [Google Scholar] [CrossRef] [PubMed]
- Ramírez-Gallegos, I.; Marina-Arroyo, M.; López-González, Á.A.; Vallejos, D.; Martínez-Almoyna-Rifá, E.; López, P.J.T.; Ramírez-Manent, J.I. Associations Between Metabolic Age, Sociodemographic Variables, and Lifestyle Factors in Spanish Workers. Nutrients 2024, 16, 4207. [Google Scholar] [CrossRef] [PubMed] [PubMed Central]
- Pelc, A.; Walicka-Cupryś, K.; Puszkarz, G.; Styś, K.; Chmiel, E.; Wilk, S.; Ludwikowski, G.; Placek, K. Evaluation of the relationship between body composition and dietary habits of physically active people with disabilities. Sci. Rep. 2024, 14, 10247. [Google Scholar] [CrossRef] [PubMed] [PubMed Central]
- Wu, Z.; Qu, J.; Zhang, W.; Liu, G.H. Stress, epigenetics, and aging: Unraveling the intricate crosstalk. Mol. Cell 2024, 84, 34–54. [Google Scholar] [CrossRef] [PubMed]
- Garcia-Rubira, J.C.; Cano-Garcia, F.J.; Bullon, B.; Seoane, T.; Villar, P.V.; Cordero, M.D.; Bullon, P. Body fat and metabolic age as indicators of inflammation and cardiovascular risk. Eur. J. Prev. Cardiol. 2018, 25, 233–234. [Google Scholar] [CrossRef] [PubMed]
- Goldberg, T.; Brener, A.; Levy, S.; Interator, H.; Laurian, I.; Dorfman, A.; Chorna, E.; Oren, A.; Eyal, O.; Lebenthal, Y. Association between age at type 1 diabetes diagnosis and metabolic outcome at young adulthood: A real-life observational study. Diabetes Metab. Res. Rev. 2021, 37, e3356. [Google Scholar] [CrossRef] [PubMed]
- Martín-Peláez, S.; Fito, M.; Castaner, O. Mediterranean Diet Effects on Type 2 Diabetes Prevention, Disease Progression, and Related Mechanisms. A Review. Nutrients 2020, 12, 2236. [Google Scholar] [CrossRef]
- Sastre-Alzamora, T.; Tomás-Gil, P.; Paublini, H.; Pallarés, L.; Ramírez-Manent, J.I.; López-González, A.A. Relationship between heart age and insulin resistance risk scales in 139634 Spanish workers. Acad. J. Health Sci. 2024, 39, 16–22. [Google Scholar] [CrossRef]
- Hutchison, A.L.; Tavaglione, F.; Romeo, S.; Charlton, M. Endocrine aspects of metabolic dysfunction-associated steatotic liver disease (MASLD): Beyond insulin resistance. J. Hepatol. 2023, 79, 1524–1541. [Google Scholar] [CrossRef] [PubMed]
- Zhao, J.; Duan, L.; Li, J.; Yao, C.; Wang, G.; Mi, J.; Yu, Y.; Ding, L.; Zhao, Y.; Yan, G.; et al. New insights into the interplay between autophagy, gut microbiota and insulin resistance in metabolic syndrome. Biomed. Pharmacother. 2024, 176, 116807. [Google Scholar] [CrossRef] [PubMed]
- Zhao, Y.; Yue, R. Aging adipose tissue, insulin resistance, and type 2 diabetes. Biogerontology 2024, 25, 53–69. [Google Scholar] [CrossRef] [PubMed]
- Oliveri, A.; Rebernick, R.J.; Kuppa, A.; Pant, A.; Chen, Y.; Du, X.; Cushing, K.C.; Bell, H.N.; Raut, C.; Prabhu, P.; et al. Comprehensive genetic study of the insulin resistance marker TG:HDL-C in the UK Biobank. Nat. Genet. 2024, 56, 212–221. [Google Scholar] [CrossRef] [PubMed] [PubMed Central]
- Mestre Font, M.; Busquets-Cortés, C.; Ramírez-Manent, J.I.; Tomás-Gil, P.; Paublini, H.; López-González, Á.A. Influence of Sociodemographic Variables and Healthy Habits on the Values of Insulin Resistance Indicators in 386,924 Spanish Workers. Nutrients 2023, 15, 5122. [Google Scholar] [CrossRef] [PubMed] [PubMed Central]
- Aguiló Juanola, M.C.; López-González, A.A.; Tomás-Gil, P.; Paublini, H.; Tárraga-López, P.J.; Ramírez-Manent, J.I. Influence of tobacco consumption on the values of different insulin resistance risk scales and non-alcoholic fatty liver disease and hepatic fibrosis scales in 418,343 spanish people. Acad. J. Health Sci. 2024, 39, 9–15. [Google Scholar] [CrossRef]
- Ladeira, L.L.C.; Ladeira, L.L.C.; Nascimento, G.G.; Nascimento, G.G.; Leite, F.R.M.; Leite, F.R.M.; Alves-Costa, S.; Alves-Costa, S.; Barbosa, J.M.A.; Barbosa, J.M.A.; et al. Obesity, Insulin Resistance, Caries, and Periodontitis: Syndemic Framework. Nutrients 2023, 15, 3512. [Google Scholar] [CrossRef] [PubMed] [PubMed Central]
- Hu, H.; Nakagawa, T.; Honda, T.; Yamamoto, S.; Mizoue, T. Should insulin resistance (HOMA-IR), insulin secretion (HOMA-β), and visceral fat area be considered for improving the performance of diabetes risk prediction models. BMJ Open Diabetes Res. Care. 2024, 12, e003680. [Google Scholar] [CrossRef] [PubMed] [PubMed Central]
- Suren Garg, S.; Kushwaha, K.; Dubey, R.; Gupta, J. Association between obesity, inflammation and insulin resistance: Insights into signaling pathways and therapeutic interventions. Diabetes Res. Clin. Pract. 2023, 200, 110691. [Google Scholar] [CrossRef] [PubMed]
- Kasai, S.; Kokubu, D.; Mizukami, H.; Itoh, K. Mitochondrial Reactive Oxygen Species, Insulin Resistance, and Nrf2-Mediated Oxidative Stress Response-Toward an Actionable Strategy for Anti-Aging. Biomolecules 2023, 13, 1544. [Google Scholar] [CrossRef] [PubMed] [PubMed Central]
- Paoli, A.; Bianco, A.; Moro, T.; Mota, J.F.; Coelho-Ravagnani, C.F. The Effects of Ketogenic Diet on Insulin Sensitivity and Weight Loss, Which Came First: The Chicken or the Egg? Nutrients 2023, 15, 3120. [Google Scholar] [CrossRef] [PubMed] [PubMed Central]
- Pinto, A.J.; Bergouignan, A.; Dempsey, P.C.; Roschel, H.; Owen, N.; Gualano, B.; Dunstan, D.W. Physiology of sedentary behavior. Physiol. Rev. 2023, 103, 2561–2622. [Google Scholar] [CrossRef] [PubMed] [PubMed Central]
- Kolb, H.; Kempf, K.; Martin, S. Insulin and aging—A disappointing relationship. Front. Endocrinol. 2023, 14, 1261298. [Google Scholar] [CrossRef] [PubMed] [PubMed Central]
- Saklayen, M.G. The Global Epidemic of the Metabolic Syndrome. Curr. Hypertens. Rep. 2018, 20, 12. [Google Scholar] [CrossRef] [PubMed] [PubMed Central]
- Amaravadi, S.K.; Maiya, G.A.; Vaishali, K.; Shastry, B.A. Effectiveness of structured exercise program on insulin resistance and quality of life in type 2 diabetes mellitus-A randomized controlled trial. PLoS ONE 2024, 19, e0302831. [Google Scholar] [CrossRef] [PubMed] [PubMed Central]
- Gonzalez-Chávez, A.; Chávez-Fernández, J.A.; Elizondo-Argueta, S.; González-Tapia, A.; León-Pedroza, J.I.; Ochoa, C. Metabolic Syndrome and Cardiovascular Disease: A Health Challenge. Arch. Med. Res. 2018, 49, 516–521. [Google Scholar] [CrossRef] [PubMed]
- Clayton, Z.S.; Murray, K.O. Aerobic Exercise and Obesity-related Insulin Resistance: Using Molecular Patterns to Inform Individualized Prescription. J. Clin. Endocrinol. Metab. 2024, 109, e1800–e1801. [Google Scholar] [CrossRef] [PubMed]
- Mirabelli, M.; Chiefari, E.; Arcidiacono, B.; Corigliano, D.M.; Brunetti, F.S.; Maggisano, V.; Russo, D.; Foti, D.P.; Brunetti, A. Mediterranean Diet Nutrients to Turn the Tide Against Insulin Resistance and Related Diseases. Nutrients 2020, 12, 1066. [Google Scholar] [CrossRef] [PubMed] [PubMed Central]
- Wang, J.; Sun, L.; You, J.; Peng, H.; Yan, H.; Wang, J.; Sun, F.; Cui, M.; Wang, S.; Zhang, Z.; et al. Role and mechanism of PVN-sympathetic-adipose circuit in depression and insulin resistance induced by chronic stress. EMBO Rep. 2023, 24, e57176. [Google Scholar] [CrossRef] [PubMed] [PubMed Central]
- Hashemipour, S.; Ghorbani, A.; Khashayar, A.; Olfati, H. Association of sleep quality with insulin resistance in obese or overweight subjects. Sleep Sci. 2021, 14, 75–78. [Google Scholar] [CrossRef] [PubMed] [PubMed Central]
- Khanal, M.K.; Karimi, L.; Saunders, P.; Schneider, R.H.; Salerno, J.; Livesay, K.; Hallam, K.T.; de Courten, B. The promising role of Transcendental Meditation in the prevention and treatment of cardiometabolic diseases: A systematic review. Obes. Rev. 2024, 25, e13800. [Google Scholar] [CrossRef] [PubMed]
- Dhali, B.; Chatterjee, S.; Sundar Das, S.; Cruz, M.D. Effect of Yoga and Walking on Glycemic Control for the Management of Type 2 Diabetes: A Systematic Review and Meta-analysis. J. ASEAN Fed. Endocr. Soc. 2023, 38, 113–122. [Google Scholar] [CrossRef] [PubMed] [PubMed Central]
- Gulley, L.D.; Shomaker, L.B.; Kelly, N.R.; Chen, K.Y.; Olsen, C.H.; Tanofsky-Kraff, M.; Yanovski, J.A. Examining cognitive-behavioral therapy change mechanisms for decreasing depression, weight, and insulin resistance in adolescent girls at risk for type 2 diabetes. J. Psychosom. Res. 2022, 157, 110781. [Google Scholar] [CrossRef] [PubMed] [PubMed Central]
- Huang, L.; Liu, Y.; Geng, T.; Zhang, N.; Sun, L.; Wu, S.; Gao, X. Healthy Sleep Pattern, Metabolic Diseases, and Risk of Stroke: The Kailuan Cohort Study. Nat. Sci. Sleep 2024, 16, 1169–1178. [Google Scholar] [CrossRef] [PubMed] [PubMed Central]
- van der Hooft, J.J.J.; Mohimani, H.; Bauermeister, A.; Dorrestein, P.C.; Duncan, K.R.; Medema, M.H. Linking genomics and metabolomics to chart specialized metabolic diversity. Chem. Soc. Rev. 2020, 49, 3297–3314. [Google Scholar] [CrossRef] [PubMed]
- Fan, Y.; Pedersen, O. Gut microbiota in human metabolic health and disease. Nat. Rev. Microbiol. 2021, 19, 55–71. [Google Scholar] [CrossRef] [PubMed]
- Petri, C.; Campa, F.; Holway, F.; Pengue, L.; Arrones, L.S. ISAK-Based Anthropometric Standards for Elite Male and Female Soccer Players. Sports 2024, 12, 69. [Google Scholar] [CrossRef] [PubMed] [PubMed Central]
- Ramírez-Manent, J.I.; Tomás-Gil, P.; Coll-Villalonga, J.L.; Marti-Lliteras, P.; López-González, A.A.; Paublini, H. Relationship between atherogenic dyslipidemia and lipid triad with scales that assess non alcoholic liver disease in 418,343 spanish workers. Acad. J. Health Sci. 2023, 38, 66–73. [Google Scholar] [CrossRef]
- Celada Roldán, C.; López Diez, J.; Rider, F.; Tárraga Marcos, A.; Tárraga Marcos, M.L.; Tárraga López, P.J.; Gallegos, I.R.; Arroyo, M.M.; Ramírez Manent, J.I.; Arturo, Á. Impact of adherence to the Mediterranean diet on health-related quality of life in poorly controlled diabetics. Acad. J. Health Sci. 2024, 39, 103–112. [Google Scholar] [CrossRef]
- Mestre-Font, M.; Busquets-Cortés, C.; Ramírez-Manent, J.I.; Tomás-Gil, P.; Paublini, H.; López-González, A.A. Influence of sociodemographic variables and healthy habits on the values of overweight and obesity scales in 386,924 Spanish workers. Acad. J. Health Sci. 2024, 39, 27–35. [Google Scholar] [CrossRef]
- Mestre-Font, M.; Busquets-Cortés, C.; Ramírez-Manent, J.I.; Tomás-Gil, P.; Paublini, H.; López-González, A.A. Influence of sociodemographic variables and healthy habits on the values of type 2 diabetes risk scales. Acad. J. Health Sci. 2024, 39, 99–106. [Google Scholar] [CrossRef]
- Gallegos, I.R.; Arroyo, M.M.; López-González, Á.A.; Vicente-Herrero, M.T.; Vallejos, D.; Sastre-Alzamora, T.; Ramírez-Manent, J.I. The Effect of a Program to Improve Adherence to the Mediterranean Diet on Cardiometabolic Parameters in 7034 Spanish Workers. Nutrients 2024, 16, 1082. [Google Scholar] [CrossRef] [PubMed]
- Vicente-Herrero, M.T.; Gordito Soler, M.; García Agudo, S.; Vallejos, D.; López-González, A.A.; Ramírez-Manent, J.I. Cardiometabolic risk level in 1136 Spanish professional musicians. Acad. J. Health Sci. 2024, 39, 59–66. [Google Scholar] [CrossRef]
- Ala-Korpela, M.; Lehtimäki, T.; Kähönen, M.; Viikari, J.; Perola, M.; Salomaa, V.; Kettunen, J.; Raitakari, O.T.; Mäkinen, V.-P. Cross-sectionally Calculated Metabolic Aging Does Not Relate to Longitudinal Metabolic Changes-Support for Stratified Aging Models. J. Clin. Endocrinol. Metab. 2023, 108, 2099–2104. [Google Scholar] [CrossRef] [PubMed] [PubMed Central]
- He, M.; Chiang, H.-H.; Luo, H.; Zheng, Z.; Qiao, Q.; Wang, L.; Tan, M.; Ohkubo, R.; Mu, W.-C.; Zhao, S.; et al. An Acetylation Switch of the NLRP3 Inflammasome Regulates Aging-Associated Chronic Inflammation and Insulin Resistance. Cell Metab. 2020, 31, 580–591.e5. [Google Scholar] [CrossRef] [PubMed] [PubMed Central]
- Cheng, X.; Jiang, S.; Pan, B.; Xie, W.; Meng, J. Ectopic and visceral fat deposition in aging, obesity, and idiopathic pulmonary fibrosis: An interconnected role. Lipids Health Dis. 2023, 22, 201. [Google Scholar] [CrossRef] [PubMed] [PubMed Central]
- Kim, B.; Kim, G.; Lee, Y.; Taniguchi, K.; Isobe, T.; Oh, S. Triglyceride-Glucose Index as a Potential Indicator of Sarcopenic Obesity in Older People. Nutrients 2023, 15, 555. [Google Scholar] [CrossRef] [PubMed] [PubMed Central]
- Garrido Sepúlveda, L.; Vicente-Herrero, M.T.; Garrido, J.A.; López-González, A.A. Prevalencia de los índices de adiposidad corporal (BAI) y volumen abdominal (AVI). Según características metabólicas y factores de riesgo. Acad. J. Health Sci. 2024, 39, 93–100. [Google Scholar] [CrossRef]
- Santos, T.W.D.; Pereira, Q.C.; Fortunato, I.M.; Oliveira, F.S.; Alvarez, M.C.; Ribeiro, M.L. Body Composition and Senescence: Impact of Polyphenols on Aging-Associated Events. Nutrients 2024, 16, 3621. [Google Scholar] [CrossRef] [PubMed] [PubMed Central]
- Cappola, A.R.; Auchus, R.J.; Fuleihan, G.E.-H.; Handelsman, D.J.; Kalyani, R.R.; McClung, M.; Stuenkel, C.A.; Thorner, M.O.; Verbalis, J.G. Hormones and Aging: An Endocrine Society Scientific Statement. J. Clin. Endocrinol. Metab. 2023, 108, 1835–1874. [Google Scholar] [CrossRef] [PubMed] [PubMed Central]
- De Paoli, M.; Zakharia, A.; Werstuck, G.H. The Role of Estrogen in Insulin Resistance: A Review of Clinical and Preclinical Data. Am. J. Pathol. 2021, 191, 1490–1498. [Google Scholar] [CrossRef] [PubMed]
- Marlatt, K.L.; Pitynski-Miller, D.R.; Gavin, K.M.; Moreau, K.L.; Melanson, E.L.; Santoro, N.; Kohrt, W.M. Body composition and cardiometabolic health across the menopause transition. Obesity 2022, 30, 14–27. [Google Scholar] [CrossRef] [PubMed] [PubMed Central]
- Opoku, A.A.; Abushama, M.; Konje, J.C. Obesity and menopause. Best. Pract. Res. Clin. Obstet. Gynaecol. 2023, 88, 102348. [Google Scholar] [CrossRef] [PubMed]
- Alam, F.; Silveyra, P. Sex Differences in E-Cigarette Use and Related Health Effects. Int. J. Environ. Res. Public. Health 2023, 20, 7079. [Google Scholar] [CrossRef] [PubMed] [PubMed Central]
- Rein, M.; Elkan, M.; Godneva, A.; Dolev, N.C.; Segal, E. Sex-specific dietary habits and their association with weight change in healthy adults. BMC Med. 2024, 22, 512. [Google Scholar] [CrossRef] [PubMed] [PubMed Central]
- Reyes-Ortiz, C.A.; Marín-Vargas, E.; Ocampo-Chaparro, J.M. Social determinants of health and metabolic syndrome in Colombian older adults. Nutr. Metab. Cardiovasc. Dis. 2024, 34, 1751–1760. [Google Scholar] [CrossRef] [PubMed]
- Mackenbach, J.P. Persistence of social inequalities in modern welfare states: Explanation of a paradox. Scand. J. Public Health 2017, 45, 113–120. [Google Scholar] [CrossRef] [PubMed]
- Volaco, A.; Cavalcanti, A.M.; Filho, R.P.; Précoma, D.B. Socioeconomic Status: The Missing Link Between Obesity and Diabetes Mellitus? Curr. Diabetes Rev. 2018, 14, 321–326. [Google Scholar] [CrossRef] [PubMed]
- Paudel, S.; Ahmadi, M.; Phongsavan, P.; Hamer, M.; Stamatakis, E. Do associations of physical activity and sedentary behaviour with cardiovascular disease and mortality differ across socioeconomic groups? A prospective analysis of device-measured and self-reported UK Biobank data. Br. J. Sports Med. 2023, 57, 921–929. [Google Scholar] [CrossRef] [PubMed] [PubMed Central]
- Li, R.; Xie, J.; Chen, J.; Liu, S.; Pan, A.; Liu, G. Associations of socioeconomic status and healthy lifestyle with incident early-onset and late-onset dementia: A prospective cohort study. Lancet Healthy Longev. 2023, 4, e693–e702. [Google Scholar] [CrossRef] [PubMed]
- Aguiló Juanola, M.C.; López-González, A.A.; Tomás-Gil, P.; Paublini, H.; Tárraga-López, P.J.; Ramírez-Manent, J.I. Influence of tobacco consumption on the values of different cardiometabolic risk scales in 418,343 spanish workers. Acad. J. Health Sci. 2024, 39, 92–98. [Google Scholar] [CrossRef]
- Caliri, A.W.; Tommasi, S.; Besaratinia, A. Relationships among smoking, oxidative stress, inflammation, macromolecular damage, and cancer. Mutat. Res. Rev. Mutat. Res. 2021, 787, 108365. [Google Scholar] [CrossRef] [PubMed] [PubMed Central]
- Kopa-Stojak, P.N.; Pawliczak, R. Comparison of the effects of active and passive smoking of tobacco cigarettes, electronic nicotine delivery systems and tobacco heating products on the expression and secretion of oxidative stress and inflammatory response markers. A systematic review. Inhal. Toxicol. 2024, 36, 75–89. [Google Scholar] [CrossRef] [PubMed]
- Rouland, A.; Thuillier, P.; Al-Salameh, A.; Benzerouk, F.; Bahougne, T.; Tramunt, B.; Berlin, I.; Clair, C.; Thomas, D.; Le Faou, A.-L.; et al. Smoking and diabetes. Ann. Endocrinol. 2024, 85, 614–622. [Google Scholar] [CrossRef] [PubMed]
- Tsigalou, C.; Konstantinidis, T.; Paraschaki, A.; Stavropoulou, E.; Voidarou, C.; Bezirtzoglou, E. Mediterranean Diet as a Tool to Combat Inflammation and Chronic Diseases. An Overview. Biomedicines 2020, 8, 201. [Google Scholar] [CrossRef] [PubMed] [PubMed Central]
- Gualtieri, P.; Marchetti, M.; Frank, G.; Smeriglio, A.; Trombetta, D.; Colica, C.; Cianci, R.; De Lorenzo, A.; Di Renzo, L. Antioxidant-Enriched Diet on Oxidative Stress and Inflammation Gene Expression: A Randomized Controlled Trial. Genes 2023, 14, 206. [Google Scholar] [CrossRef] [PubMed] [PubMed Central]
- Vetrani, C.; Verde, L.; Colao, A.; Barrea, L.; Muscogiuri, G. The Mediterranean Diet: Effects on Insulin Resistance and Secretion in Individuals with Overweight or Obesity. Nutrients 2023, 15, 4524. [Google Scholar] [CrossRef] [PubMed] [PubMed Central]
- Lewis, M.Y.; Yonemori, K.; Ross, A.; Wilkens, L.R.; Shepherd, J.; Cassel, K.; Stenger, A.; Rettenmeier, C.; Lim, U.; Boushey, C.; et al. Effect of Intermittent vs. Continuous Energy Restriction on Visceral Fat: Protocol for The Healthy Diet and Lifestyle Study 2 (HDLS2). Nutrients 2024, 16, 1478. [Google Scholar] [CrossRef] [PubMed] [PubMed Central]
- Del Bo’, C.; Perna, S.; Allehdan, S.; Rafique, A.; Saad, S.; AlGhareeb, F.; Rondanelli, M.; Tayyem, R.F.; Marino, M.; Martini, D.; et al. Does the Mediterranean Diet Have Any Effect on Lipid Profile, Central Obesity and Liver Enzymes in Non-Alcoholic Fatty Liver Disease (NAFLD) Subjects? A Systematic Review and Meta-Analysis of Randomized Control Trials. Nutrients 2023, 15, 2250. [Google Scholar] [CrossRef] [PubMed] [PubMed Central]
- Barrea, L.; Verde, L.; Annunziata, G.; Camajani, E.; Caprio, M.; Sojat, A.S.; Marina, L.V.; Guarnotta, V.; Colao, A.; Muscogiuri, G. Role of Mediterranean diet in endocrine diseases: A joint overview by the endocrinologist and the nutritionist. J. Endocrinol. Investig. 2024, 47, 17–33. [Google Scholar] [CrossRef] [PubMed] [PubMed Central]
- Laffond, A.; Rivera-Picón, C.; Rodríguez-Muñoz, P.M.; Juárez-Vela, R.; de Viñaspre-Hernández, R.R.; Navas-Echazarreta, N.; Sánchez-González, J.L. Mediterranean Diet for Primary and Secondary Prevention of Cardiovascular Disease and Mortality: An Updated Systematic Review. Nutrients 2023, 15, 3356. [Google Scholar] [CrossRef] [PubMed] [PubMed Central]
- Marini, H.R. Mediterranean Diet and Soy Isoflavones for Integrated Management of the Menopausal Metabolic Syndrome. Nutrients 2022, 14, 1550. [Google Scholar] [CrossRef] [PubMed] [PubMed Central]
- Franceschi, C.; Garagnani, P.; Parini, P.; Giuliani, C.; Santoro, A. Inflammaging: A new immune-metabolic viewpoint for age-related diseases. Nat. Rev. Endocrinol. 2018, 14, 576–590. [Google Scholar] [CrossRef] [PubMed]
- Cryan, J.F.; O’Riordan, K.J.; Cowan, C.S.M.; Sandhu, K.V.; Bastiaanssen, T.F.S.; Boehme, M.; Codagnone, M.G.; Cussotto, S.; Fulling, C.; Golubeva, A.V.; et al. The Microbiota-Gut-Brain Axis. Physiol. Rev. 2019, 99, 1877–2013. [Google Scholar] [CrossRef] [PubMed]
- Kim, J.E.; Kim, J.S.; Jo, M.J.; Cho, E.; Ahn, S.Y.; Kwon, Y.J.; Ko, G.J. The Roles and Associated Mechanisms of Adipokines in Development of Metabolic Syndrome. Molecules 2022, 27, 334. [Google Scholar] [CrossRef] [PubMed] [PubMed Central]
- Andersen, M.K.; Ängquist, L.; Bork-Jensen, J.; Jonsson, A.E.; Stinson, S.E.; Sandholt, C.H.; Thodberg, M.; Pikkupeura, L.M.; Ongstad, E.L.; Grarup, N.; et al. Physical Activity and Insulin Sensitivity Independently Attenuate the Effect of FTO rs9939609 on Obesity. Diabetes Care 2023, 46, 985–992. [Google Scholar] [CrossRef] [PubMed]
- Fernández-Verdejo, R.; Sanchez-Delgado, G.; Ravussin, E. Energy Expenditure in Humans: Principles, Methods, and Changes Throughout the Life Course. Annu. Rev. Nutr. 2024, 44, 51–76. [Google Scholar] [CrossRef] [PubMed]
- Recchia, F.; Recchia, F.; Leung, C.K.; Leung, C.K.; Yu, A.P.; Yu, A.P.; Leung, W.; Leung, W.; Yu, D.J.; Yu, D.J.; et al. Dose-response effects of exercise and caloric restriction on visceral adiposity in overweight and obese adults: A systematic review and meta-analysis of randomised controlled trials. Br. J. Sports Med. 2023, 57, 1035–1041. [Google Scholar] [CrossRef] [PubMed] [PubMed Central]
- Mcleod, J.C.; Currier, B.S.; Lowisz, C.V.; Phillips, S.M. The influence of resistance exercise training prescription variables on skeletal muscle mass, strength, and physical function in healthy adults: An umbrella review. J. Sport. Health Sci. 2024, 13, 47–60. [Google Scholar] [CrossRef] [PubMed] [PubMed Central]
- Rajado, A.T.; Silva, N.; Esteves, F.; Brito, D.; Binnie, A.; Araújo, I.M.; Nóbrega, C.; Bragança, J.; Castelo-Branco, P.; ALFA Score Consortium. How can we modulate aging through nutrition and physical exercise? An epigenetic approach. Aging 2023, 15, 3191–3217. [Google Scholar] [CrossRef] [PubMed] [PubMed Central]
- Yang, W.; Jiang, W.; Guo, S. Regulation of Macronutrients in Insulin Resistance and Glucose Homeostasis during Type 2 Diabetes Mellitus. Nutrients 2023, 15, 4671. [Google Scholar] [CrossRef] [PubMed] [PubMed Central]
- Kosmas, C.E.; Bousvarou, M.D.; Kostara, C.E.; Papakonstantinou, E.J.; Salamou, E.; Guzman, E. Insulin resistance and cardiovascular disease. J. Int. Med. Res. 2023, 51, 3000605231164548. [Google Scholar] [CrossRef] [PubMed] [PubMed Central]
- Liu, W.; Wang, J.; Wang, M.; Hou, H.; Ding, X.; Ma, L.; Liu, M. Oxidative Stress Factors Mediate the Association Between Life’s Essential 8 and Accelerated Phenotypic Aging: NHANES 2005–2018. J. Gerontol. Ser. A 2024, 79, glad240. [Google Scholar] [CrossRef] [PubMed]

| Formula | Cut-Off | |
|---|---|---|
| TyG Index [63] | LN (triglycerides × glycaemia/2) | >8.5 |
| METS-IR [63] | LN (2× Glycaemia + triglycerides) × BMI/LN(HDL-c) | >50 |
| SPISE [63] | (=600 × HDL 0.185/Triglycerides 0.2 × BMI 1.338) | 6.14 |
| Men n = 4104 | Women n = 4486 | ||
|---|---|---|---|
| Mean (SD) | Mean (SD) | p-Value | |
| Age (years) | 41.6 (10.6) | 41.5 (10.5) | 0.492 |
| Height (cm) | 175.8 (7.2) | 162.5 (6.1) | <0.001 |
| Weight (kg) | 81.2 (14.8) | 63.9 (13.6) | <0.001 |
| Waist circumference (cm) | 89.8 (12.5) | 77.0 (12.0) | <0.001 |
| Hip circumference (cm) | 101.8 (8.7) | 99.6 (10.9) | <0.001 |
| Systolic blood pressure (mmHg) | 128.6 (13.3) | 117.2 (14.1) | <0.001 |
| Diastolic blood pressure (mmHg) | 79.9 (10.2) | 74.9 (9.9) | <0.001 |
| Glycaemia (mg/dL) | 93.4 (17.8) | 88.9 (12.6) | <0.001 |
| Total cholesterol (mg/dL) | 191.8 (36.0) | 189.0 (34.8) | <0.001 |
| HDL-c (mg/dL) | 49.2 (11.3) | 59.5 (12.8) | <0.001 |
| LDL-c (mg/dL) | 124.0 (54.6) | 113.8 (30.7) | <0.001 |
| Triglycerides (mg/dL) | 107.8 (69.4) | 81.5 (46.3) | <0.001 |
| GGT (UI) | 31.5 (30.0) | 18.5 (15.9) | <0.001 |
| AST (UI) | 24.4 (17.3) | 18.2 (7.7) | <0.001 |
| ALT (UI) | 29.3 (34.9) | 17.3 (13.4) | <0.001 |
| % | % | p-value | |
| 18–29 years | 15.5 | 16.8 | 0.005 |
| 30–39 years | 27.8 | 25.1 | |
| 40–49 years | 32.7 | 34.4 | |
| 50–59 years | 19.0 | 19.7 | |
| 60–69 years | 5.0 | 4.0 | |
| Social class I | 57.1 | 50.8 | <0.001 |
| Social class II | 20.2 | 23.8 | |
| Social class III | 22.7 | 25.4 | |
| Non-smokers | 84.5 | 84.2 | 0.348 |
| Smokers | 15.5 | 15.8 | |
| Non-physical activity | 25.9 | 35.1 | <0.001 |
| Physical activity 1–3 days/week | 27.0 | 26.5 | |
| Physical activity more 3 days/week | 47.1 | 38.4 | |
| Non-Mediterranean diet | 44.5 | 41.6 | <0.001 |
| Mediterranean diet | 55.5 | 58.4 |
| Men | Women | |||||
|---|---|---|---|---|---|---|
| Metabolic Age | n | Mean (SD) | p-Value | n | Mean (SD) | p-Value |
| 18–29 years | 636 | −4.7 (10.1) | <0.001 | 754 | −6.0 (10.7) | <0.001 |
| 30–39 years | 1140 | −4.3 (11.0) | 1126 | −5.2 (9.8) | ||
| 40–49 years | 1344 | −4.1 (11.0) | 1544 | −4.8 (11.4) | ||
| 50–59 years | 780 | −2.3 (11.3) | 882 | −4.7 (11.5) | ||
| 60–69 years | 204 | −1.5 (11.4) | 180 | −4.3 (10.2) | ||
| Social class I | 2346 | −5.5 (10.4) | <0.001 | 2278 | −7.5 (9.6) | <0.001 |
| Social class II | 828 | −2.3 (10.6) | 1068 | −3.0 (11.9) | ||
| Social class III | 930 | −0.8 (12.0) | 1140 | −2.7 (11.8) | ||
| Non-smokers | 3468 | −4.1 (10.9) | <0.001 | 3776 | −5.3 (10.9) | <0.001 |
| Smokers | 636 | −1.7 (11.3) | 710 | −4.8 (11.4) | ||
| Non-physical activity | 1062 | 3.1 (10.9) | <0.001 | 1574 | −0.7 (11.9) | <0.001 |
| Physical activity 1–3 days/week | 1110 | −3.4 (10.1) | 1187 | −5.9 (10.0) | ||
| Physical activity more 3 days/week | 1932 | −7.8 (9.5) | 1725 | −8.7 (9.2) | ||
| Non-Mediterranean diet | 1827 | 0.1 (11.9) | 1866 | −3.3 (11.8) | ||
| Mediterranean diet | 2277 | −6.8 (9.1) | 2620 | −6.5 (10.2) | ||
| TyG Index normal | 3318 | −5.2 (10.5) | <0.001 | 4140 | −6.0 (10.6) | <0.001 |
| TyG Index high | 786 | 2.1 (11.2) | 346 | 4.1 (11.1) | ||
| METS-IR normal | 3650 | −5.7 (9.8) | <0.001 | 4250 | −6.2 (10.3) | <0.001 |
| METS-IR high | 454 | 11.4 (7.7) | 236 | 13.7 (4.2) | ||
| SPISE normal | 3540 | −6.1 (9.5) | <0.001 | 4202 | −6.4 (10.2) | <0.001 |
| SPISE high | 564 | 10.8 (8.1) | 284 | 13.3 (4.8) |
| MA High Men | MA High Women | |||||
|---|---|---|---|---|---|---|
| Metabolic Age | n | % | p-Value | n | % | p-Value |
| 18–29 years | 636 | 18.9 | <0.001 | 754 | 19.6 | <0.001 |
| 30–39 years | 1140 | 24.7 | 1126 | 19.7 | ||
| 40–49 years | 1344 | 27.7 | 1544 | 23.3 | ||
| 50–59 years | 780 | 28.5 | 882 | 23.6 | ||
| 60–69 years | 204 | 31.0 | 180 | 25.4 | ||
| Social class I | 2346 | 19.9 | <0.001 | 2278 | 14.7 | <0.001 |
| Social class II | 828 | 26.1 | 1068 | 30.3 | ||
| Social class III | 930 | 39.4 | 1140 | 32.6 | ||
| Non-smokers | 3468 | 24.7 | <0.001 | 3776 | 22.6 | <0.001 |
| Smokers | 636 | 30.2 | 710 | 25.1 | ||
| Non-physical activity | 1062 | 49.2 | <0.001 | 1574 | 38.4 | <0.001 |
| Physical activity 1–3 days/week | 1110 | 23.2 | 1187 | 18.0 | ||
| Physical activity more 3 days/week | 1932 | 14.0 | 1725 | 12.4 | ||
| Non-Mediterranean diet | 1827 | 40.4 | 1866 | 29.7 | ||
| Mediterranean diet | 2277 | 13.7 | 2620 | 18.2 | ||
| TyG Index normal | 3318 | 21.0 | <0.001 | 4140 | 20.4 | <0.001 |
| TyG Index high | 786 | 45.0 | 346 | 53.8 | ||
| METS-IR normal | 3650 | 17.8 | <0.001 | 4250 | 19.0 | <0.001 |
| METS-IR high | 454 | 88.1 | 236 | 95.8 | ||
| SPISE normal | 3540 | 15.9 | <0.001 | 4202 | 18.1 | <0.001 |
| SPISE high | 564 | 86.2 | 284 | 95.1 |
| MA High | MA High | MA High | |
|---|---|---|---|
| OR (95% CI) | OR (95% CI) | OR (95% CI) | |
| Women | 1 | 1 | 1 |
| Men | 1.13 (1.10–1.17) | 1.09 (1.06–1.12) | 1.15 (1.10–1.21) |
| 18–29 years | 1 | 1 | 1 |
| 30–39 years | 1.15 (1.12–1.18) | 1.20 (1.16–1.24) | 1.24 (1.19–1.30) |
| 40–49 years | 1.29 (1.24–1.35) | 1.31 (1.26–1.37) | 1.45 (1.38–1.52) |
| 50–59 years | 1.42 (1.34–1.50) | 1.58 (1.49–1.68) | 1.49 (1.40–1.59) |
| 60–69 years | 1.45 (1.37–1.53) | 1.73 (1.62–1.84) | 1.55 (1.45–1.66) |
| Social class I | 1 | 1 | 1 |
| Social class II | 1.42 (1.33–1.51) | 1.11 (0.07–1.16) | 1.18 (1.12–1.25) |
| Social class III | 2.58 (2.27–2.89) | 2.45 (2.12–4.79) | 2.38 (2.06–2.71) |
| Non-smokers | 1 | 1 | 1 |
| Smokers | 1.07 (1.05–1.10) | 1.08 (1.05–1.12) | 1.07 (1.05–1.10) |
| Physical activity more 3 days/week | 1 | 1 | 1 |
| Physical activity 1–3 days/week | 1.21 (1.17–1.26) | 1.75 (1.60–1.91) | 1.38 (1.30–1.47) |
| Non-physical activity | 3.66 (3.21–4.12) | 3.16 (2.90–3.43) | 3.10 (2.61–3.60) |
| Mediterranean diet | 1 | 1 | 1 |
| Non-Mediterranean diet | 2.12 (1.89–2.35) | 2.33 (2.02–2.64) | 2.22 (1.98–2.47) |
| TyG Index normal | 1 | ||
| TyG Index high | 3.42 (2.97–3.87) | ||
| METS-IR normal | 1 | ||
| METS-IR high | 4.88 (4.12–5.65) | ||
| SPISE normal | 1 | ||
| SPISE high | 4.42 (3.70–5.15) |
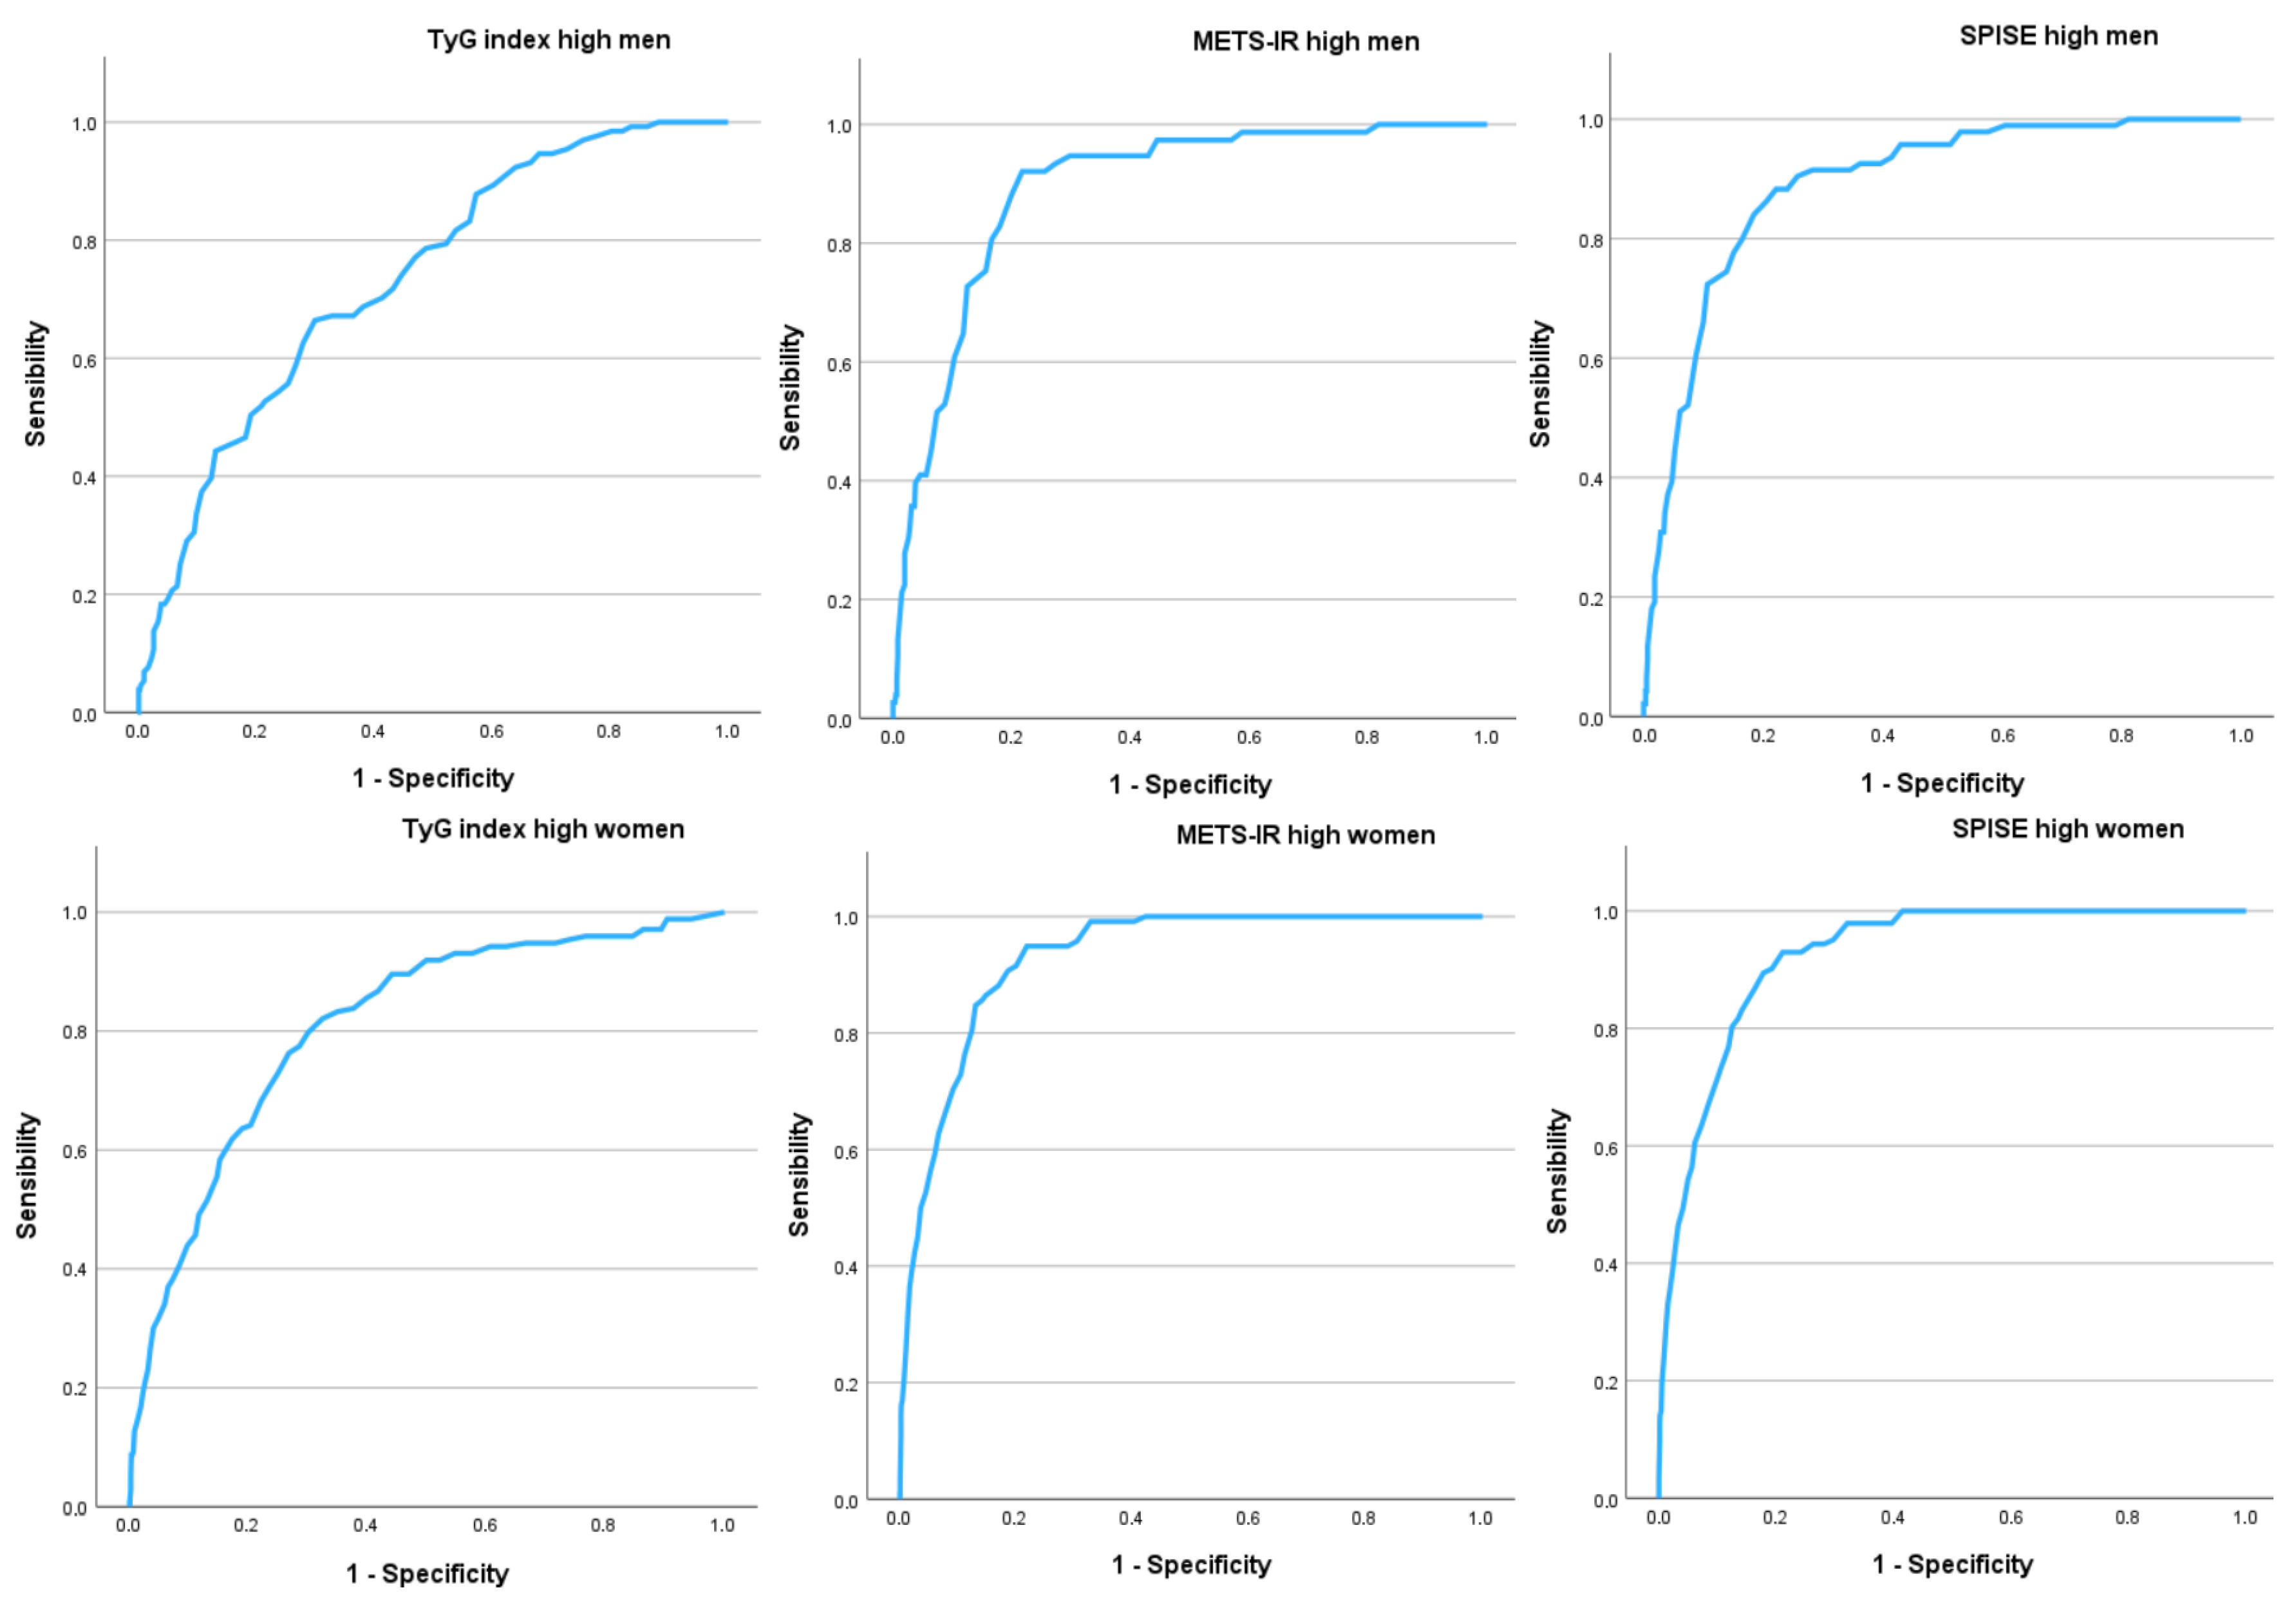
| Men n = 4104 | Women n = 4486 | |
|---|---|---|
| AUC (95% CI) | AUC (95% CI) | |
| TyG Index high | 0.679 (0.658–0.701) | 0.742 (0.715–0.769) |
| METS-IR high | 0.888 (0.870–0.906) | 0.936 (0.926–0.947) |
| SPISE high | 0.886 (0.869–0.903) | 0.935 (0.924–0.946) |
| Cut-off–sensitivity–specificity–Youden | Cut-off–sensitivity–specificity–Youden | |
| TyG Index high | -4.0-67.9-62.3-0.302 | -1.0-71.0-70.2-0.412 |
| METS-IR high | 6.0-84.6-84.2-0.688 | 11.0-88.5-88.3-0.768 |
| SPISE high | 5.0-84.8-84.6-0.694 | 10.0-88.7-88.0-0.767 |
Disclaimer/Publisher’s Note: The statements, opinions and data contained in all publications are solely those of the individual author(s) and contributor(s) and not of MDPI and/or the editor(s). MDPI and/or the editor(s) disclaim responsibility for any injury to people or property resulting from any ideas, methods, instructions or products referred to in the content. |
© 2025 by the authors. Licensee MDPI, Basel, Switzerland. This article is an open access article distributed under the terms and conditions of the Creative Commons Attribution (CC BY) license (https://creativecommons.org/licenses/by/4.0/).
Share and Cite
Ramírez-Gallegos, I.; Tárraga López, P.J.; Paublini Oliveira, H.; López-González, Á.A.; Martorell Sánchez, C.; Martínez-Almoyna-Rifá, E.; Ramírez-Manent, J.I. Relationship Between Metabolic Age Determined by Bioimpedance and Insulin Resistance Risk Scales in Spanish Workers. Nutrients 2025, 17, 945. https://doi.org/10.3390/nu17060945
Ramírez-Gallegos I, Tárraga López PJ, Paublini Oliveira H, López-González ÁA, Martorell Sánchez C, Martínez-Almoyna-Rifá E, Ramírez-Manent JI. Relationship Between Metabolic Age Determined by Bioimpedance and Insulin Resistance Risk Scales in Spanish Workers. Nutrients. 2025; 17(6):945. https://doi.org/10.3390/nu17060945
Chicago/Turabian StyleRamírez-Gallegos, Ignacio, Pedro Juan Tárraga López, Hernán Paublini Oliveira, Ángel Arturo López-González, Cristina Martorell Sánchez, Emilio Martínez-Almoyna-Rifá, and José Ignacio Ramírez-Manent. 2025. "Relationship Between Metabolic Age Determined by Bioimpedance and Insulin Resistance Risk Scales in Spanish Workers" Nutrients 17, no. 6: 945. https://doi.org/10.3390/nu17060945
APA StyleRamírez-Gallegos, I., Tárraga López, P. J., Paublini Oliveira, H., López-González, Á. A., Martorell Sánchez, C., Martínez-Almoyna-Rifá, E., & Ramírez-Manent, J. I. (2025). Relationship Between Metabolic Age Determined by Bioimpedance and Insulin Resistance Risk Scales in Spanish Workers. Nutrients, 17(6), 945. https://doi.org/10.3390/nu17060945