


Dietary Behavioural Preferences of Spanish and German Adults and Their Translation to the Dietary Recommendations of a Personalised Nutrition App in the Framework of the Stance4Health Project

 ,
,  , , ,
, , ,  ,
,  and
and
Abstract

1. Introduction
2. Materials and Methods
2.1. Study Participants
2.2. Dietary Behaviours and Questionnaire Construction
2.3. Data Statistical Analysis
3. Results
3.1. Characteristics of the Subjects and Dietary Habits
3.2. Portion Size Results
4. Discussion
4.1. Dietary Behaviour of the Subjects and Comparative Portion Size Estimation
4.2. Essential Features to Enhance the Usability and Accuracy of the i-Diet App
4.3. Study Limitations
5. Conclusions
Author Contributions
Funding
Institutional Review Board Statement
Informed Consent Statement
Data Availability Statement
Acknowledgments
Conflicts of Interest
References
- Gracia-Arnaiz, M. Eating Issues in a Time of Crisis: Re-Thinking the New Food Trends and Challenges in Spain. Trends Food Sci. Technol. 2021, 116, 1179–1185. [Google Scholar] [CrossRef]
- Bradley, J.; Rowland, M.K.; Matthews, J.N.S.; Adamson, A.J.; Spence, S. A Comparison of Food Portion Size Estimation Methods among 11–12 Year Olds: 3D Food Models vs. an Online Tool Using Food Portion Photos (Intake24). BMC Nutr. 2021, 7, 10. [Google Scholar] [CrossRef] [PubMed]
- Lillford, P.; Hermansson, A.-M. Global Missions and the Critical Needs of Food Science and Technology. Trends Food Sci. Technol. 2021, 111, 800–811. [Google Scholar] [CrossRef]
- Ververis, E.; Ackerl, R.; Azzollini, D.; Colombo, P.A.; de Sesmaisons, A.; Dumas, C.; Fernandez-Dumont, A.; da Costa, L.F.; Germini, A.; Goumperis, T. Novel Foods in the European Union: Scientific Requirements and Challenges of the Risk Assessment Process by the European Food Safety Authority. Food Res. Int. 2020, 137, 109515. [Google Scholar] [CrossRef]
- Alabduljabbar, S.; Zaidan, S.A.; Lakshmanan, A.P.; Terranegra, A. Personalized Nutrition Approach in Pregnancy and Early Life to Tackle Childhood and Adult Non-Communicable Diseases. Life 2021, 11, 467. [Google Scholar] [CrossRef]
- Torres, N.; Tovar, A.R. The Present and Future of Personalized Nutrition. Rev. Investig. Clín. 2021, 73, 321–325. [Google Scholar] [CrossRef]
- Sempionatto, J.R.; Montiel, V.R.-V.; Vargas, E.; Teymourian, H.; Wang, J. Wearable and Mobile Sensors for Personalized Nutrition. ACS Sens. 2021, 6, 1745–1760. [Google Scholar] [CrossRef]
- Conrad, J.; Koch, S.A.; Nöthlings, U. New Approaches in Assessing Food Intake in Epidemiology. Curr. Opin. Clin. Nutr. Metab. Care 2018, 21, 343–351. [Google Scholar] [CrossRef]
- Bailey, R.L. Overview of Dietary Assessment Methods for Measuring Intakes of Foods, Beverages, and Dietary Supplements in Research Studies. Curr. Opin. Biotechnol. 2021, 70, 91–96. [Google Scholar] [CrossRef]
- Vasiloglou, M.F.; Christodoulidis, S.; Reber, E.; Stathopoulou, T.; Lu, Y.; Stanga, Z.; Mougiakakou, S. Perspectives and Preferences of Adult Smartphone Users Regarding Nutrition and Diet Apps: Web-Based Survey Study. JMIR MHealth UHealth 2021, 9, e27885. [Google Scholar] [CrossRef]
- Suryadevara, C.K. Revolutionizing Dietary Monitoring: A Comprehensive Analysis of the Innovative Mobile App for Tracking Dietary Composition. Int. J. Innov. Eng. Res. Technol. 2023, 10, 9. [Google Scholar]
- Cunha, C.A.S.; Duarte, R.P. Multi-Device Nutrition Control. Sensors 2022, 22, 2617. [Google Scholar] [CrossRef] [PubMed]
- Kusuma, J.D.; Yang, H.-L.; Yang, Y.-L.; Chen, Z.-F.; Shiao, S.-Y.P.K. Validating Accuracy of a Mobile Application against Food Frequency Questionnaire on Key Nutrients with Modern Diets for mHealth Era. Nutrients 2022, 14, 537. [Google Scholar] [CrossRef] [PubMed]
- Yuan, D.; Hu, X.; Zhang, H.; Jia, W.; Mao, Z.-H.; Sun, M. An Automatic Electronic Instrument for Accurate Measurements of Food Volume and Density. Public Health Nutr. 2021, 24, 1248–1255. [Google Scholar] [CrossRef]
- Shinozaki, N.; Murakami, K.; Asakura, K.; Masayasu, S.; Sasaki, S. Development of a Digital Photographic Food Atlas as a Portion Size Estimation Aid in Japan. Nutrients 2022, 14, 2218. [Google Scholar] [CrossRef]
- Villena-esponera, M.P.; Moreno-rojas, R.; Mateos-marcos, S.; Salazar-donoso, M.V.; Molina-Recio, G. Validation of a Photographic Atlas of Food Portions Designed as a Tool to Visually Estimate Food Amounts in Ecuador. Nutr. Hosp. 2018, 36, 363–371. [Google Scholar] [CrossRef]
- Al Marzooqi, H.M.; Burke, S.J.; Al Ghazali, M.R.; Duffy, E.; Yousuf, M.H.S.A. The Development of a Food Atlas of Portion Sizes for the United Arab Emirates. J. Food Compos. Anal. 2015, 43, 140–148. [Google Scholar] [CrossRef]
- Chapman, S.; Rawcliffe, A.; Smith, L.; Izard, R.; Roberts, J. Evaluation of the Current Methods Used for Assessing Dietary Intake in Military Research Settings: A Scoping Review. BMJ Mil. Health 2021, 167, 126–130. [Google Scholar] [CrossRef]
- Dello Russo, M.; Russo, P.; Rufián-Henares, J.Á.; Hinojosa-Nogueira, D.; Pérez-Burillo, S.; de la Cueva, S.P.; Rohn, S.; Fatouros, A.; Douros, K.; González-Vigil, V. The Stance4Health Project: Evaluating a Smart Personalised Nutrition Service for Gut Microbiota Modulation in Normal-and Overweight Adults and Children with Obesity, Gluten-Related Disorders or Allergy/Intolerance to Cow’s Milk. Foods 2022, 11, 1480. [Google Scholar] [CrossRef]
- Hinojosa-Nogueira, D.; Ortiz-Viso, B.; Navajas-Porras, B.; Pérez-Burillo, S.; González-Vigil, V.; de la Cueva, S.P.; Rufián-Henares, J.Á. Stance4Health Nutritional APP: A Path to Personalized Smart Nutrition. Nutrients 2023, 15, 276. [Google Scholar] [CrossRef]
- Remiro-Azócar, A.; Heath, A.; Baio, G. Methods for Population Adjustment with Limited Access to Individual Patient Data: A Review and Simulation Study. Res. Synth. Methods 2021, 12, 750–775. [Google Scholar] [CrossRef]
- Jiménez Lorente, C.P.; Pineda Morales, J.; Lama Herrera, C.; Rodríguez Martínez, P.; Escudero Uribe, M.L.; Melo Salor, J.A.; Arrabal Martín, A.; Cravioto Manrique, I.; Muñoz Alonso, A.; Hernández Cubero, P. Recomendaciones Sobre Hábitos Saludables En Atención Primaria: Modelo de Atención Para Promover La Actividad Física y La Alimentación Equilibrada En El Sistema Sanitario Público de Andalucía; Junta de Andalucia: Sevilla, Spain, 2020. [Google Scholar]
- Safefood. Consumer Understanding of Food Portion Sizes; Safefood: Little Island, Ireland, 2014; ISBN 978-1-905767-46-5. Available online: https://www.safefood.net/admin/getmedia/fe9482e5-1108-44d4-9f50-0361eae38931/portion-size-report_final201114.aspx?ext=.pdf (accessed on 19 January 2025).
- Benhammou, S.; Heras-González, L.; Ibáñez-Peinado, D.; Barceló, C.; Hamdan, M.; Rivas, A.; Mariscal-Arcas, M.; Olea-Serrano, F.; Monteagudo, C. Comparison of Mediterranean Diet Compliance between European and Non-European Populations in the Mediterranean Basin. Appetite 2016, 107, 521–526. [Google Scholar] [CrossRef]
- Haftenberger, M.; Heuer, T.; Heidemann, C.; Kube, F.; Krems, C.; Mensink, G.B. Relative Validation of a Food Frequency Questionnaire for National Health and Nutrition Monitoring. Nutr. J. 2010, 9, 36. [Google Scholar] [CrossRef] [PubMed]
- Keller, K.; Rodríguez López, S.; Carmenate Moreno, M.M.; Acevedo Cantero, P. Associations between Food Consumption Habits with Meal Intake Behaviour in Spanish Adults. Appetite 2014, 83, 63–68. [Google Scholar] [CrossRef]
- Lyons, J.; Giltinan, M. The Irish Food Portion Sizes Database; Irish Universities Nutrition Alliance at University College Cork: Cork, Ireland, 2013. [Google Scholar]
- Probst, Y.; Jones, H.; Sampson, G.; Smith, K. Development of Australian Portion Size Photographs to Enhance Self-administered Online Dietary Assessments for Adults. Nutr. Diet. 2010, 67, 275–280. [Google Scholar] [CrossRef]
- Salvesen, L.; Engeset, D.; Øverby, N.C.; Medin, A.C. Development and Evaluation of Image-Series for Portion Size Estimation in Dietary Assessment among Adults. J. Nutr. Sci. 2021, 10, e3. [Google Scholar] [CrossRef]
- Staudigel, M.; Brandl, B.; Roosen, J.; Kiesswetter, E.; Siebentritt, H.M.; Wawro, N.; Linseisen, J.; Skurk, T.; Volkert, D.; Hauner, H. Association of Eating Motives with Anthropometry, Body Composition, and Dietary Intake in Healthy German Adults. Appetite 2022, 170, 105865. [Google Scholar] [CrossRef]
- Weichselbaum, E.; Benelam, B.; Soares Costa, H. Traditional Foods in Europe; EuroFIR: Brussels, Belgium, 2009. [Google Scholar]
- Foster, E.; Hawkins, A.; Barton, K.L.; Stamp, E.; Matthews, J.N.S.; Adamson, A.J. Development of Food Photographs for Use with Children Aged 18 Months to 16 Years: Comparison against Weighed Food Diaries—The Young Person’s Food Atlas (UK). PLoS ONE 2017, 12, e0169084. [Google Scholar] [CrossRef]
- Folson, G.; Bannerman, B.; Ador, G.; Atadze, V.; Akoto, S.; Asante, S.; Abbeyquaye, J.; Anang-Tetteh, A.; Guri, E.; Ibrahim, G.; et al. A Photographic Food Atlas with Portion Sizes of Commonly Consumed Foods in Accra, Ghana; International Food Policy Research Institute: Washington, DC, USA, 2022. [Google Scholar]
- Nelson, M.; Haraldsdóttir, J. Food Photographs: Practical Guidelines II. Development and Use of Photographic Atlases for Assessing Food Portion Size. Public Health Nutr. 1998, 1, 231–237. [Google Scholar] [CrossRef] [PubMed]
- Walsh, H. Development of a Photographic Food Atlas to Support Food Portion Estimation Among Children and Adolescents Aged 9–14 Years in Nairobi, Kenya. Master’s Thesis, University of Helsinki, Helsinki, Finland, 2020. [Google Scholar]
- Nguyen, P.H.; Tran, L.M.; Hoang, N.T.; Trương, D.T.; Tran, T.H.; Huynh, P.N.; Koch, B.; McCloskey, P.; Gangupantulu, R.; Hughes, D.; et al. A Photographic Food Atlas with Portion Sizes of Commonly Consumed Foods in Thai Nguyen, Viet Nam; International Food Policy Research Institute: Washington, DC, USA, 2021. [Google Scholar]
- Jalil, A.J.; Tasoff, J.; Bustamante, A.V. Eating to Save the Planet: Evidence from a Randomized Controlled Trial Using Individual-Level Food Purchase Data. Food Policy 2020, 95, 101950. [Google Scholar] [CrossRef]
- Steenhuis, I.; Poelman, M. Portion Size: Latest Developments and Interventions. Curr. Obes. Rep. 2017, 6, 10–17. [Google Scholar] [CrossRef] [PubMed]
- Timon, C.M.; Cooper, S.E.; Barker, M.E.; Astell, A.J.; Adlam, T.; Hwang, F.; Williams, E.A. A Comparison of Food Portion Size Estimation by Older Adults, Young Adults and Nutritionists. J. Nutr. Health Aging 2018, 22, 230–236. [Google Scholar] [CrossRef]
- Lauria, F.; Dello Russo, M.; Formisano, A.; De Henauw, S.; Hebestreit, A.; Hunsberger, M.; Krogh, V.; Intemann, T.; Lissner, L.; Molnar, D.; et al. Ultra-Processed Foods Consumption and Diet Quality of European Children, Adolescents and Adults: Results from the I.Family Study. Nutr. Metab. Cardiovasc. Dis. 2021, 31, 3031–3043. [Google Scholar] [CrossRef]
- Lazarte, C.E.; Encinas, M.E.; Alegre, C.; Granfeldt, Y. Validation of Digital Photographs, as a Tool in 24-h Recall, for the Improvement of Dietary Assessment among Rural Populations in Developing Countries. Nutr. J. 2012, 11, 61. [Google Scholar] [CrossRef]
- Grams, L.; Nelius, A.-K.; Pastor, G.G.; Sillero-Quintana, M.; Veiga, Ó.L.; Homeyer, D.; Kück, M. Comparison of Adherence to Mediterranean Diet between Spanish and German School-Children and Influence of Gender, Overweight, and Physical Activity. Nutrients 2022, 14, 4697. [Google Scholar] [CrossRef] [PubMed]
- Mertens, E.; Colizzi, C.; Peñalvo, J.L. Ultra-Processed Food Consumption in Adults across Europe. Eur. J. Nutr. 2022, 61, 1521–1539. [Google Scholar] [CrossRef]
- Westenbrink, S.; Van Der Vossen-Wijmenga, W.; Toxopeus, I.; Milder, I.; Ocké, M. LEDA, the Branded Food Database in the Netherlands: Data Challenges and Opportunities. J. Food Compos. Anal. 2021, 102, 104044. [Google Scholar] [CrossRef]
- He, J.; Mao, R.; Shao, Z.; Wright, J.L.; Kerr, D.A.; Boushey, C.J.; Zhu, F. An End-to-End Food Image Analysis System. arXiv 2021, arXiv:2102.00645. [Google Scholar] [CrossRef]
- Jakob, R.; Harperink, S.; Rudolf, A.M.; Fleisch, E.; Haug, S.; Mair, J.L.; Salamanca-Sanabria, A.; Kowatsch, T. Factors Influencing Adherence to mHealth Apps for Prevention or Management of Noncommunicable Diseases: Systematic Review. J. Med. Internet Res. 2022, 24, e35371. [Google Scholar] [CrossRef]


| Type of Food | XXS | XS | S | M | L | XL | |
|---|---|---|---|---|---|---|---|
| Portion Range | |||||||
| Rices (g) | 39 | 85 | 131 | 224 | 316 | 362 | |
| Beverages (mL) | 100 | 200 | 300 | 400 | 500 | 600 | |
| Raw vegetables (g) | 32 | 49 | 67 | 101 | 136 | 153 | |
| Meat (g) | 56 | 108 | 168 | 246 | 308 | 400 | |
| Breakfast cereals (g) | 16 | 23 | 31 | 45 | 60 | 67 | |
| Salad (g) | 88 | 150 | 213 | 338 | 463 | 525 | |
| Nuts (g) | 15 | 49 | 82 | 116 | 183 | 250 | |
| Stew dish (g) | 93 | 158 | 222 | 352 | 481 | 546 | |
| Bread (g) | 22 | 34 | 48 | 63 | 94 | 126 | |
| Lasagne (g) | 135 | 187 | 238 | 341 | 444 | 496 | |
| Legumes dish (g) | 80 | 140 | 200 | 320 | 440 | 500 | |
| Fruit salad (g) | 39 | 64 | 89 | 139 | 189 | 214 | |
| Cooked vegetables (g) | 26 | 56 | 85 | 145 | 204 | 234 | |
| Fruit portion (g) | 53 | 83 | 166 | 266 | 376 | 532 | |
| Pasta (g) | 55 | 108 | 161 | 266 | 372 | 425 | |
| Potatoes (g) | 61 | 97 | 131 | 204 | 275 | 311 | |
| Fish (g) | 43 | 58 | 82 | 245 | 345 | 560 | |
| Pizza (g) | 42 | 84 | 168 | 335 | 502 | 670 | |
| Cheese (g) | 13 | 25 | 36 | 60 | 83 | 95 | |
| Sliced fruit (g) | 28 | 56 | 83 | 139 | 194 | 222 | |
| Soup dish (mL) | 33 | 89 | 145 | 257 | 369 | 425 | |
| Cakes (g) | 67 | 83 | 98 | 129 | 160 | 176 | |
| Feature | Spain | Germany | Total | |
|---|---|---|---|---|
| Population | 84 | 140 | 224 | |
| Age (years) | Average ± SD | 26.3 ± 10.2 | 40.8 ± 14.9 | 35.4 ± 15.1 |
| Gender | Male | 31 | 46 | 77 |
| Female | 53 | 94 | 147 | |
| Origin | Asian | 0 | 1 | 1 |
| European | 80 | 138 | 218 | |
| Latin | 4 | 1 | 5 | |
| Allergies and Intolerances | No | 64 | 116 | 180 |
| Nuts | 0 | 8 | 8 | |
| Dairy | 5 | 9 | 14 | |
| Others | 15 | 3 | 18 | |
| Education | Primary | 4 | 3 | 7 |
| Secondary | 10 | 25 | 35 | |
| Higher | 70 | 112 | 182 | |
| Employment | Unemployed | 1 | 1 | 2 |
| Employed | 18 | 90 | 108 | |
| working part-time | 8 | 18 | 26 | |
| Studying | 55 | 26 | 81 | |
| Retired | 2 | 5 | 7 | |
| Marital status | Married | 6 | 54 | 60 |
| Divorced | 0 | 6 | 6 | |
| Other | 4 | 36 | 40 | |
| Single | 74 | 44 | 118 | |
| Share home | With friends | 25 | 16 | 41 |
| With family | 43 | 41 | 84 | |
| With partner | 8 | 55 | 63 | |
| Other | 1 | 0 | 1 | |
| Alone | 7 | 28 | 35 | |
| Housing | Rented | 36 | 75 | 111 |
| Owned | 34 | 60 | 94 | |
| Other | 14 | 5 | 19 | |
| Living in | Urban areas | 66 | 102 | 168 |
| Rural areas | 18 | 38 | 56 | |
| Eating habits | Vegetarians | 0 | 23 | 23 |
| Omnivores | 98 | 103 | 201 | |
| Dietary behaviour | Eat in company | 61 | 100 | 161 |
| Alone | 23 | 40 | 63 | |
| Use spices | Sometimes | 14 | 3 | 17 |
| Never | 5 | 1 | 6 | |
| Always | 65 | 136 | 201 | |
| Dishes during meals | Other | 5 | 6 | 11 |
| Single dish | 61 | 128 | 189 | |
| First and second dish | 18 | 6 | 24 | |
| Eat dessert | Sometimes | 18 | 63 | 81 |
| Never | 20 | 66 | 86 | |
| Always | 46 | 11 | 57 | |
| Bread consumption | Sometimes | 24 | 43 | 67 |
| Never | 28 | 71 | 99 | |
| Always | 32 | 26 | 58 | |
| Drink during meal | Water | 69 | 75 | 144 |
| Sparkling water | 1 | 41 | 42 | |
| Beer/Wine | 4 | 3 | 7 | |
| Never | 6 | 6 | 12 | |
| Other | 0 | 5 | 5 | |
| Soft drink | 4 | 2 | 6 | |
| Juices | 0 | 8 | 8 | |
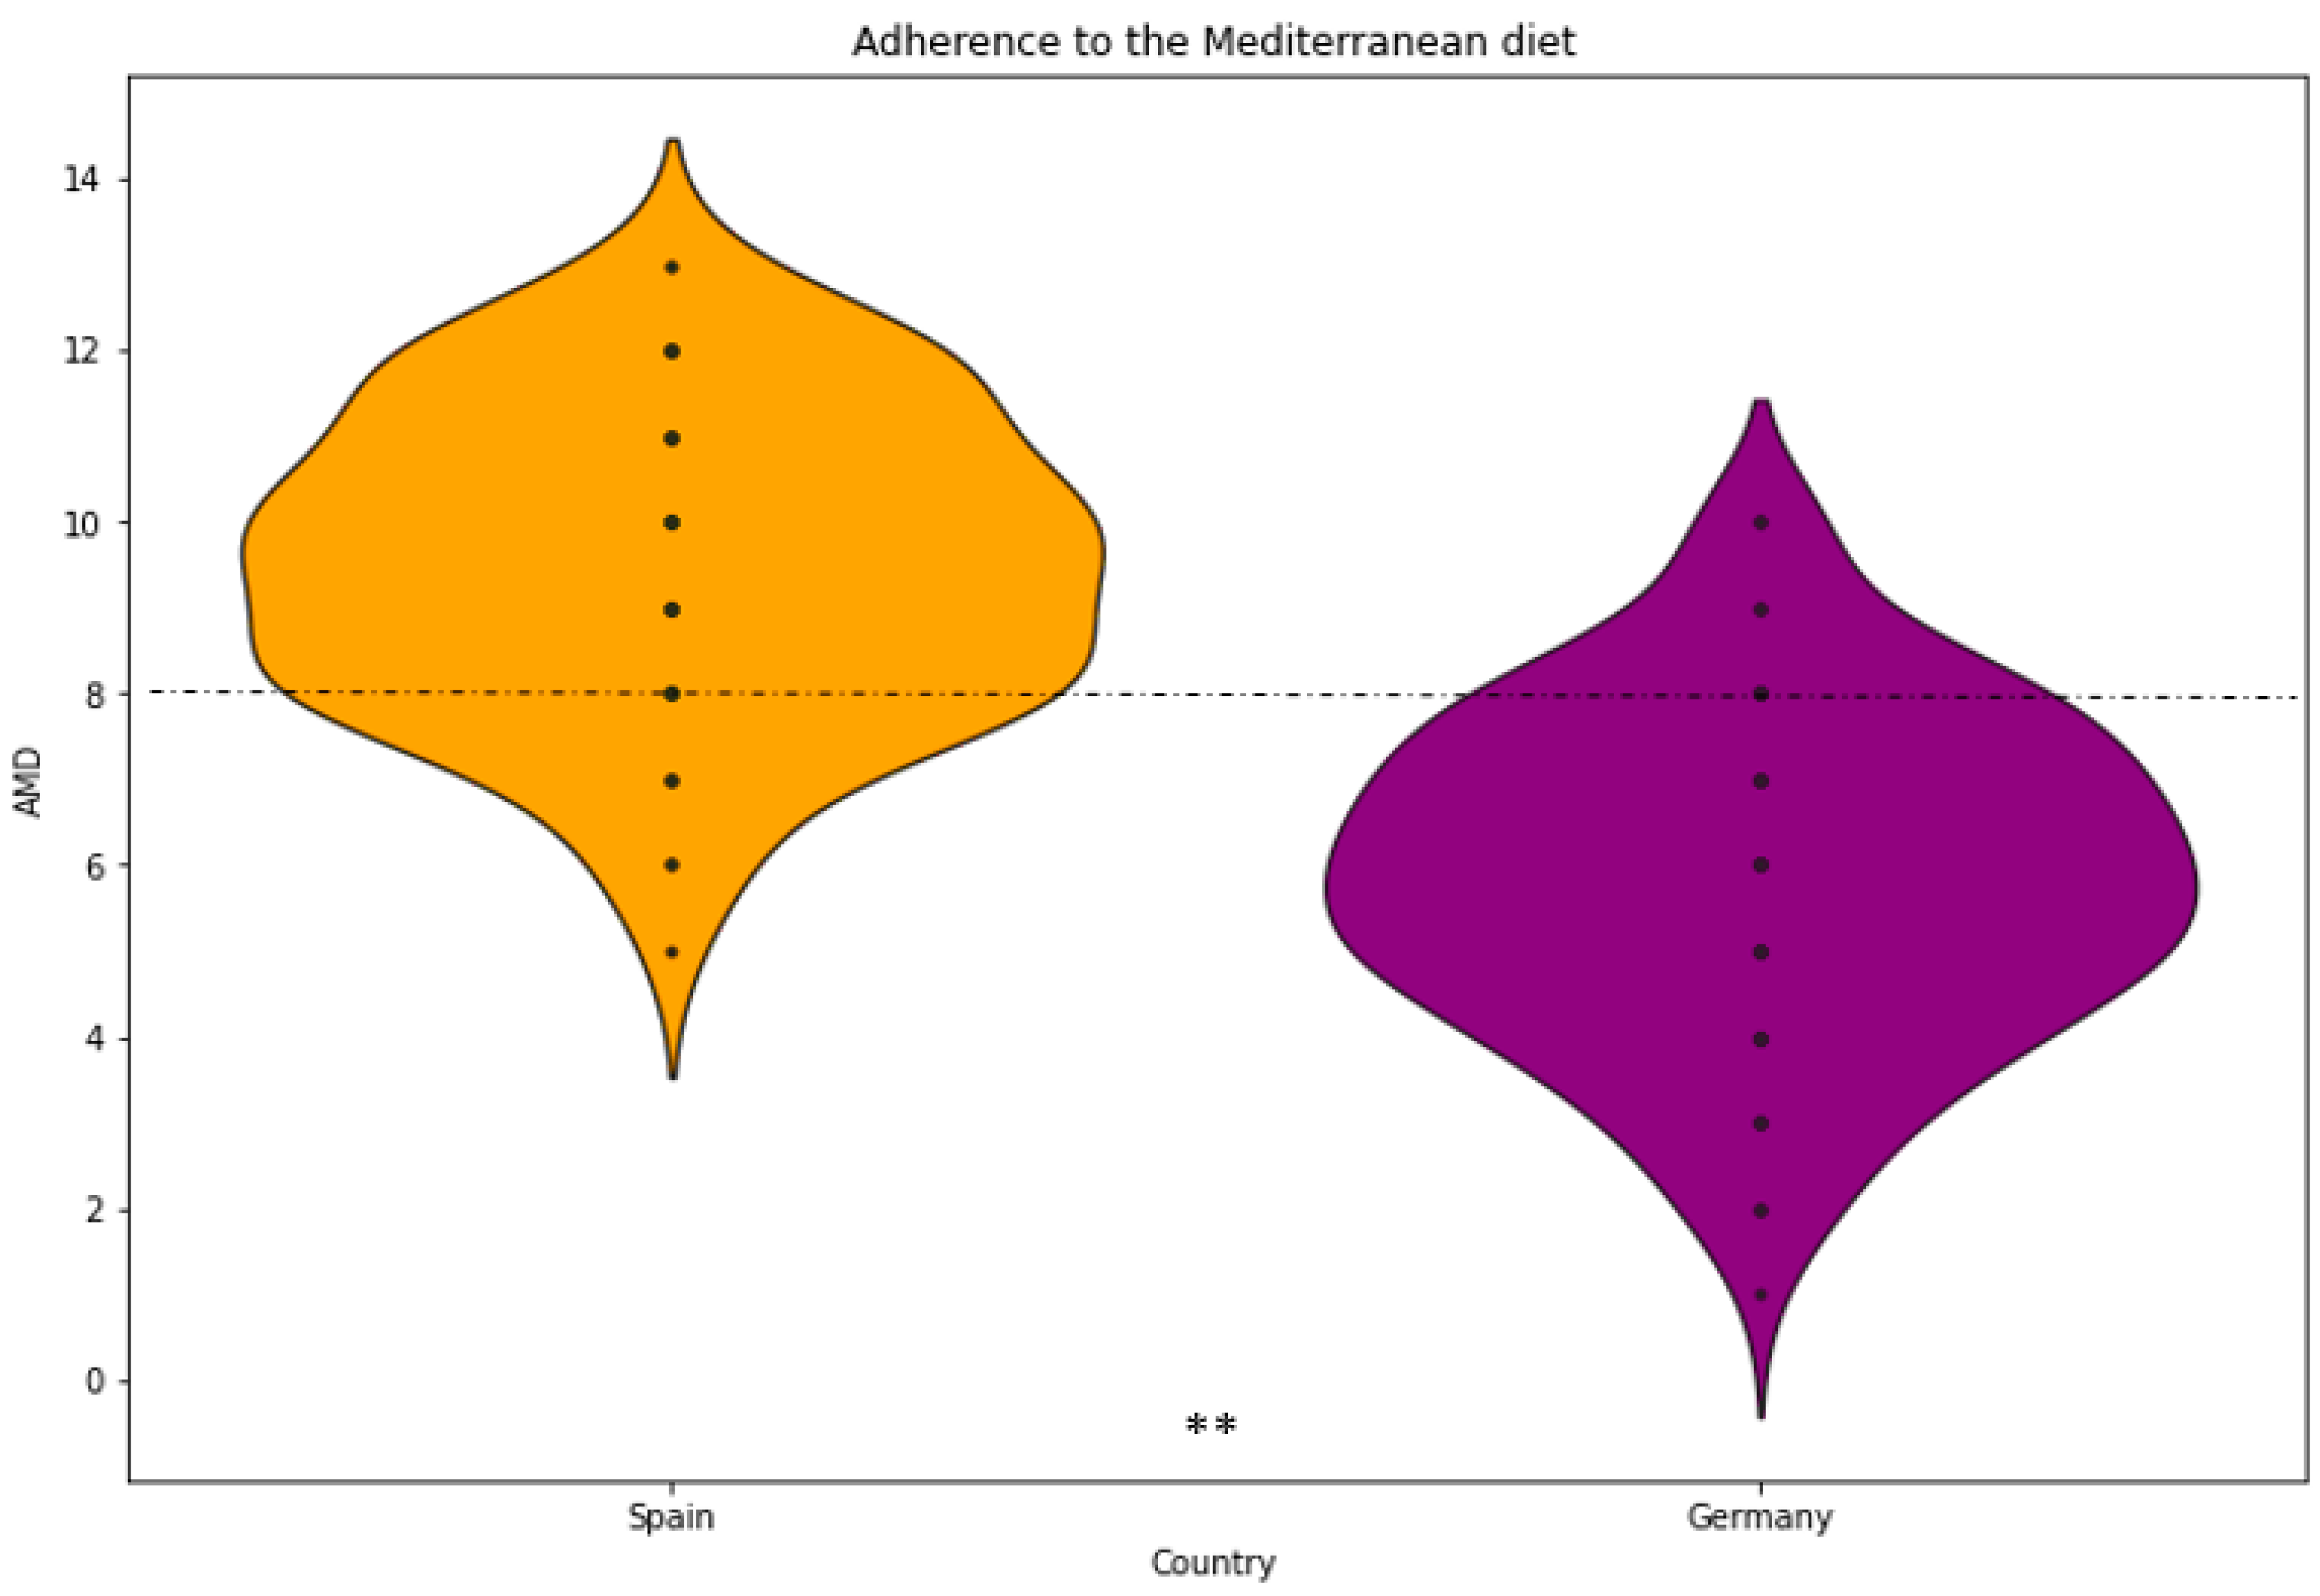
| AMD | Average ± SD | 9.63 ± 1.72 | 6.09 ± 1.99 | 7.42 ± 2.56 |
| Physical activity | Intense (>5 times/week) | 13 | 17 | 30 |
| Light (walking) | 26 | 48 | 74 | |
| Moderate (3 times/week) | 39 | 57 | 96 | |
| Very intense (2 h/day) | 4 | 1 | 5 | |
| Very light | 2 | 17 | 19 | |
| BMI (kg/m2) | Average ± SD | 23.07 ± 3.92 | 24.23 ± 4.43 | 23.79 ± 4.27 |
| Food | Country | Average ± SD | Portion Size Group | p < 0.05 * |
|---|---|---|---|---|
| Rices (g) | Germany | 127.43 ± 60.96 | S | 0.0003 |
| Spain | 165.42 ± 83.85 | M | ||
| Beverages (mL) | Germany | 355.40 ± 138.40 | M | 0.4067 |
| Spain | 328.57 ± 193.62 | M | ||
| Raw vegetables (g) | Germany | 121.36 ± 33.38 | L | 0.7752 |
| Spain | 121.19 ± 35.53 | L | ||
| Meat (g) | Germany | 175.66 ± 75.77 | M | 0.0123 |
| Spain | 202.90± 81.65 | M | ||
| Breakfast cereals (g) | Germany | 29.30 ± 11.12 | S | 0.2453 |
| Spain | 27.92 ± 12.64 | S | ||
| Salad (g) | Germany | 287.36 ± 119.60 | M | 0.1556 |
| Spain | 264.88 ± 109.29 | M | ||
| Nuts (g) | Germany | 52.17 ± 39.51 | S | 0.4533 |
| Spain | 52.38 ± 46.91 | S | ||
| Stew dish (g) | Germany | 372.79 ± 127.04 | L | 0.0021 |
| Spain | 318.64 ± 123.26 | M | ||
| Bread (g) | Germany | 62.43 ± 34.18 | M | 0.0001 |
| Spain | 35.12 ± 27.52 | S | ||
| Lasagne (g) | Germany | 402.66 ± 89.62 | L | 0.0005 |
| Spain | 350.80 ± 112.04 | L | ||
| Legumes dish (g) | Germany | 243.48 ± 105.75 | M | 0.0001 |
| Spain | 314.88 ± 112.03 | L | ||
| Fruit salad (g) | Germany | 147.93 ± 47.10 | M | 0.0198 |
| Spain | 163.43 ± 42.77 | M | ||
| Cooked vegetables (g) | Germany | 141.55 ± 48.20 | L | 0.8939 |
| Spain | 142.07 ± 49.35 | L | ||
| Fruit portion (g) | Germany | 284.60 ± 165.06 | L | 0.1463 |
| Spain | 315.48 ± 176.33 | L | ||
| Pasta (g) | Germany | 227.11 ± 76.05 | M | 0.8626 |
| Spain | 229.70 ± 76.24 | M | ||
| Potatoes (g) | Germany | 159.04 ± 65.14 | M | 0.0033 |
| Spain | 135.62 ± 51.37 | M | ||
| Fish (g) | Germany | 136.83 ± 94.33 | M | 0.1700 |
| Spain | 164.94 ± 114.80 | M | ||
| Pizza (g) | Germany | 481.39 ± 174.19 | L | 0.0001 |
| Spain | 353.23 ± 171.75 | M | ||
| Cheese (g) | Germany | 49.68 ± 22.53 | M | 0.0258 |
| Spain | 42.76 ± 21.83 | M | ||
| Sliced fruit (g) | Germany | 160.14 ± 48.72 | M | 0.0288 |
| Spain | 176.91 ± 33.36 | L | ||
| Soup dish (mL) | Germany | 296.36 ± 86.22 | L | 0.9097 |
| Spain | 297.63 ± 90.79 | L | ||
| Cakes (g) | Germany | 102.46 ± 31.02 | M | 0.2586 |
| Spain | 97.30 ± 29.55 | M |
Disclaimer/Publisher’s Note: The statements, opinions and data contained in all publications are solely those of the individual author(s) and contributor(s) and not of MDPI and/or the editor(s). MDPI and/or the editor(s) disclaim responsibility for any injury to people or property resulting from any ideas, methods, instructions or products referred to in the content. |
© 2025 by the authors. Licensee MDPI, Basel, Switzerland. This article is an open access article distributed under the terms and conditions of the Creative Commons Attribution (CC BY) license (https://creativecommons.org/licenses/by/4.0/).
Share and Cite
Hinojosa-Nogueira, D.; Navajas-Porras, B.; Pastoriza, S.; Delgado-Osorio, A.; Toledano-Marín, Á.; Rohn, S.; Rufián-Henares, J.Á.; Quesada-Granados, J.J. Dietary Behavioural Preferences of Spanish and German Adults and Their Translation to the Dietary Recommendations of a Personalised Nutrition App in the Framework of the Stance4Health Project. Nutrients 2025, 17, 912. https://doi.org/10.3390/nu17050912
Hinojosa-Nogueira D, Navajas-Porras B, Pastoriza S, Delgado-Osorio A, Toledano-Marín Á, Rohn S, Rufián-Henares JÁ, Quesada-Granados JJ. Dietary Behavioural Preferences of Spanish and German Adults and Their Translation to the Dietary Recommendations of a Personalised Nutrition App in the Framework of the Stance4Health Project. Nutrients. 2025; 17(5):912. https://doi.org/10.3390/nu17050912
Chicago/Turabian StyleHinojosa-Nogueira, Daniel, Beatriz Navajas-Porras, Silvia Pastoriza, Adriana Delgado-Osorio, Ángela Toledano-Marín, Sascha Rohn, José Ángel Rufián-Henares, and José Javier Quesada-Granados. 2025. "Dietary Behavioural Preferences of Spanish and German Adults and Their Translation to the Dietary Recommendations of a Personalised Nutrition App in the Framework of the Stance4Health Project" Nutrients 17, no. 5: 912. https://doi.org/10.3390/nu17050912
APA StyleHinojosa-Nogueira, D., Navajas-Porras, B., Pastoriza, S., Delgado-Osorio, A., Toledano-Marín, Á., Rohn, S., Rufián-Henares, J. Á., & Quesada-Granados, J. J. (2025). Dietary Behavioural Preferences of Spanish and German Adults and Their Translation to the Dietary Recommendations of a Personalised Nutrition App in the Framework of the Stance4Health Project. Nutrients, 17(5), 912. https://doi.org/10.3390/nu17050912