
Relationship of Wine Neophobia Levels with Demographic Factors and Wine Consumption Behavior in Spanish Consumers

 ,
,  , ,
, ,  and
and 
Abstract

1. Introduction
2. Materials and Methods
2.1. Survey
2.1.1. Section 1: Demographic Information
2.1.2. Section 2: Wine Consumption Behavior
2.1.3. Section 3: Wine Neophobia (WN)
2.1.4. Section 4: Food Neophobia (FN)
2.2. Data Analysis
3. Results
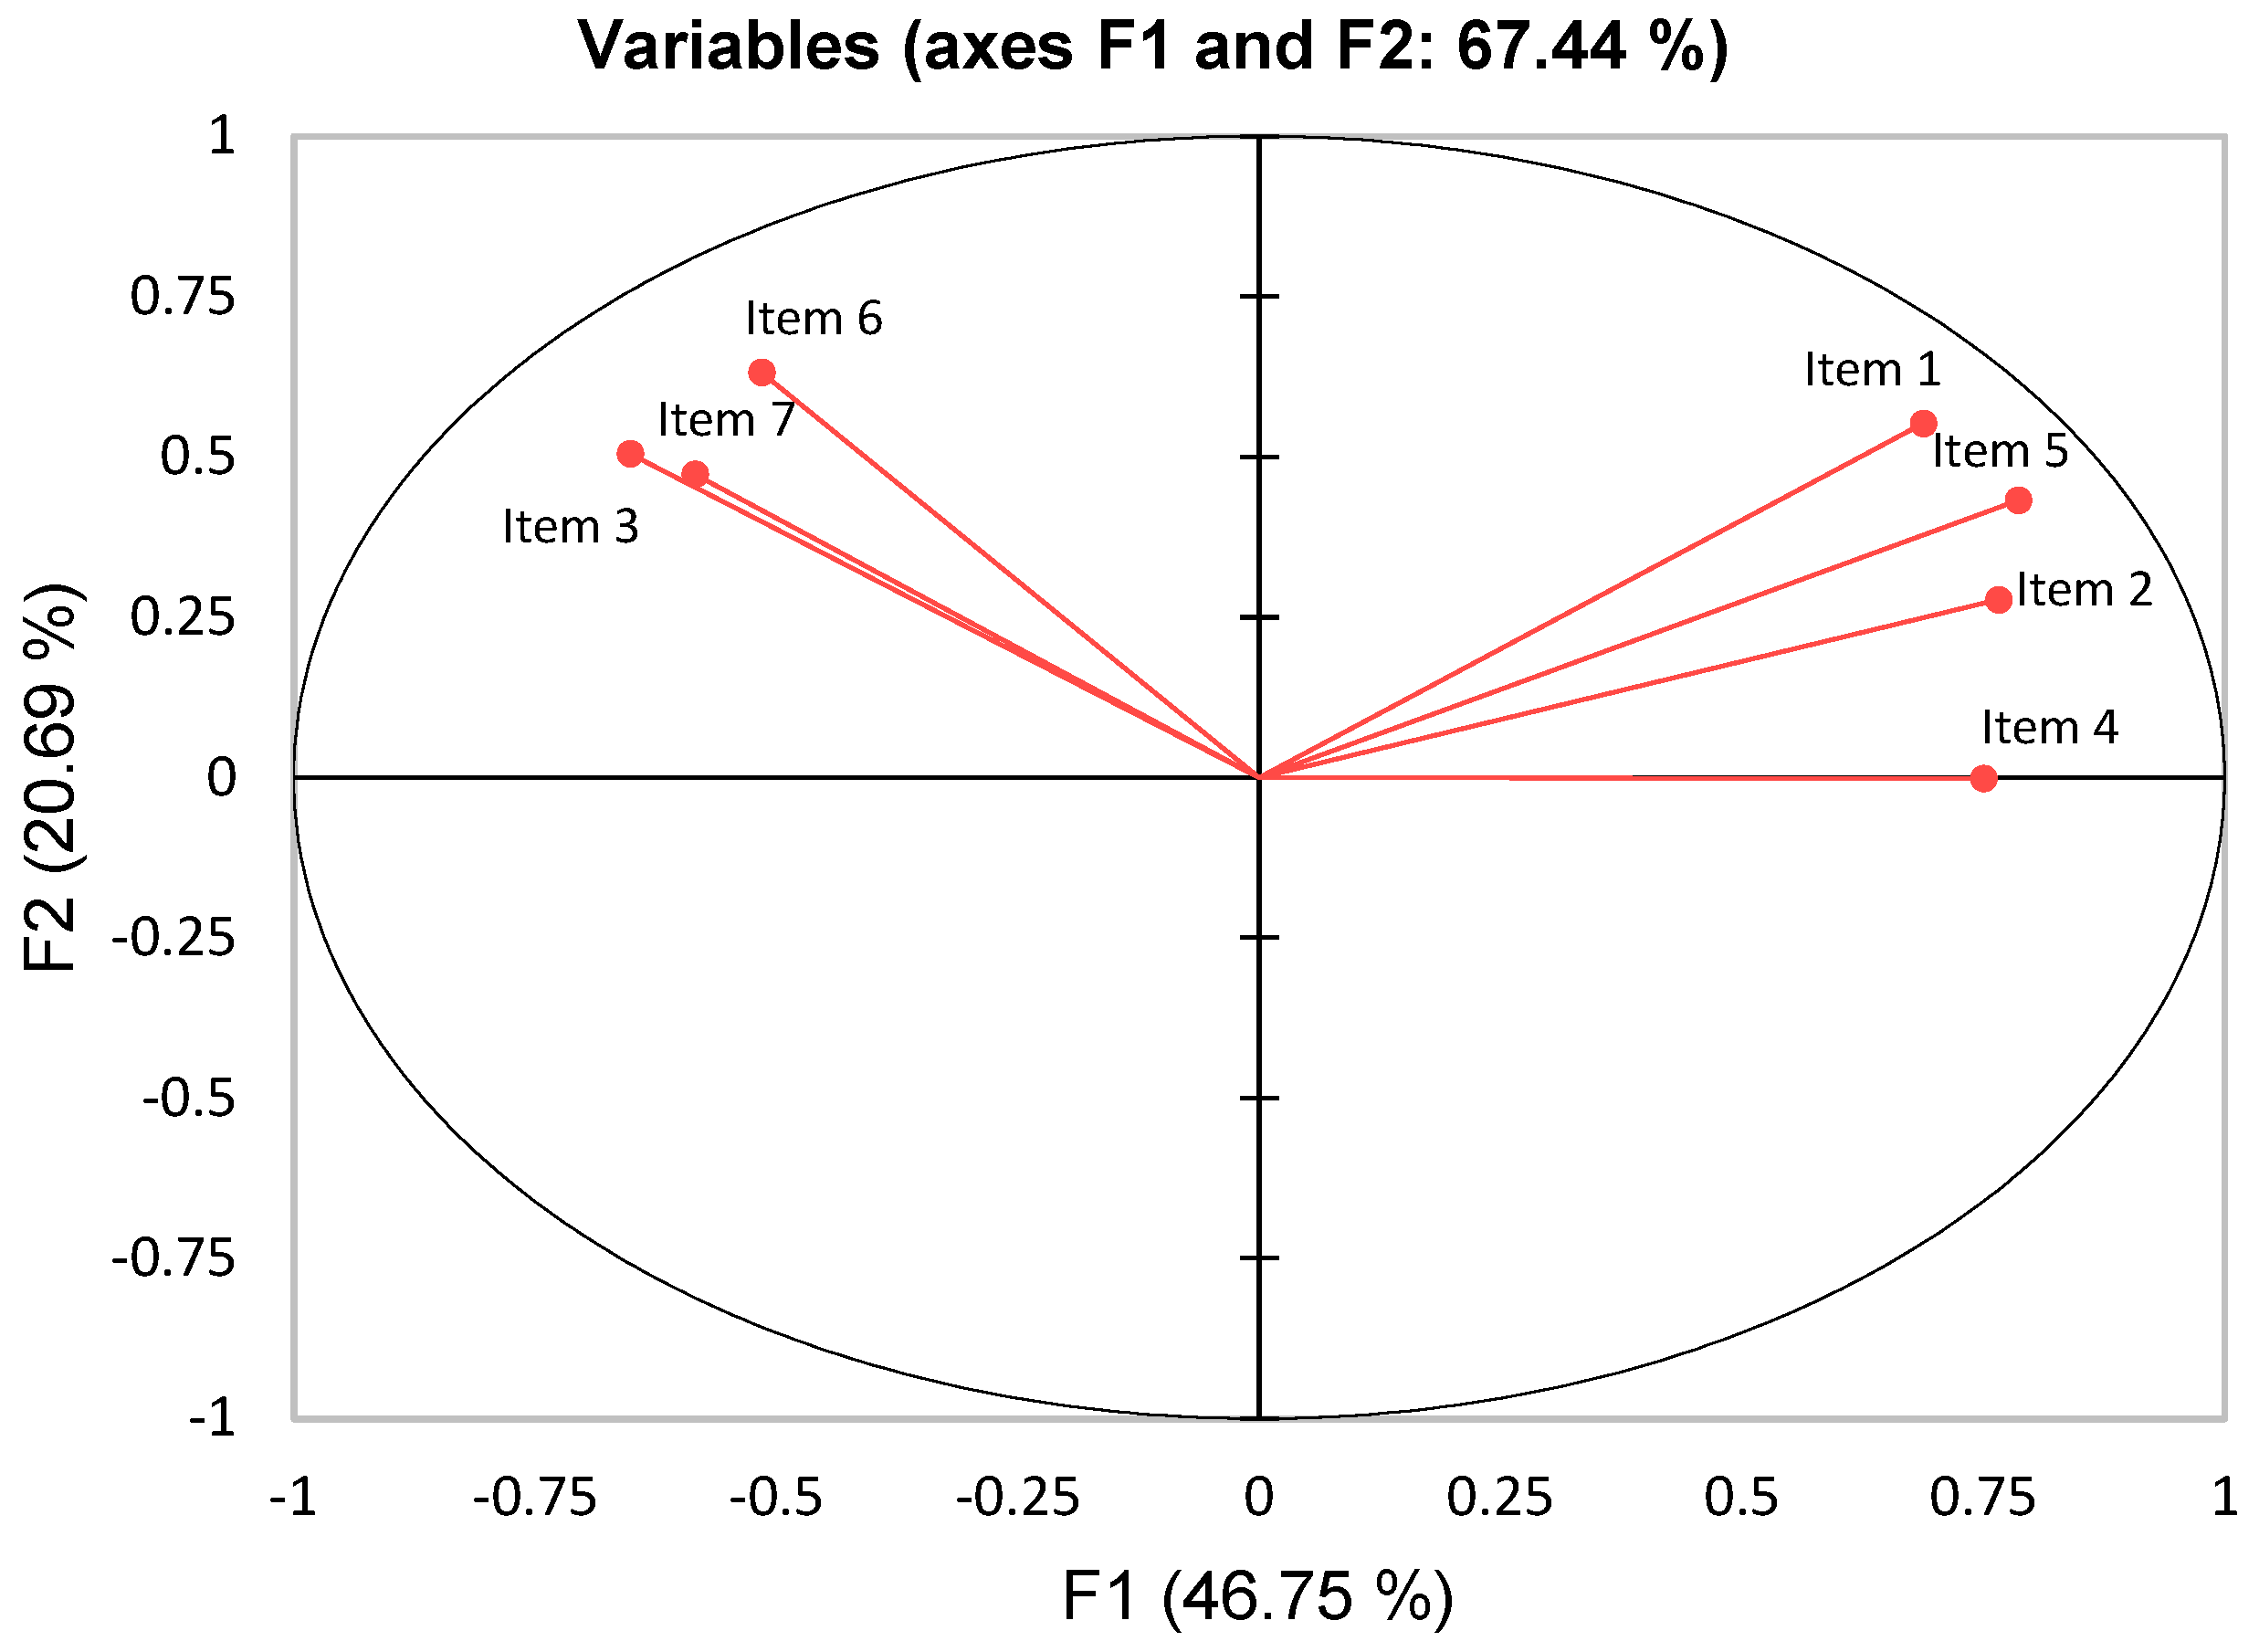
3.1. Wine Neophobia
3.1.1. Differences in Demographic Data Between Wine-Neophobic Groups
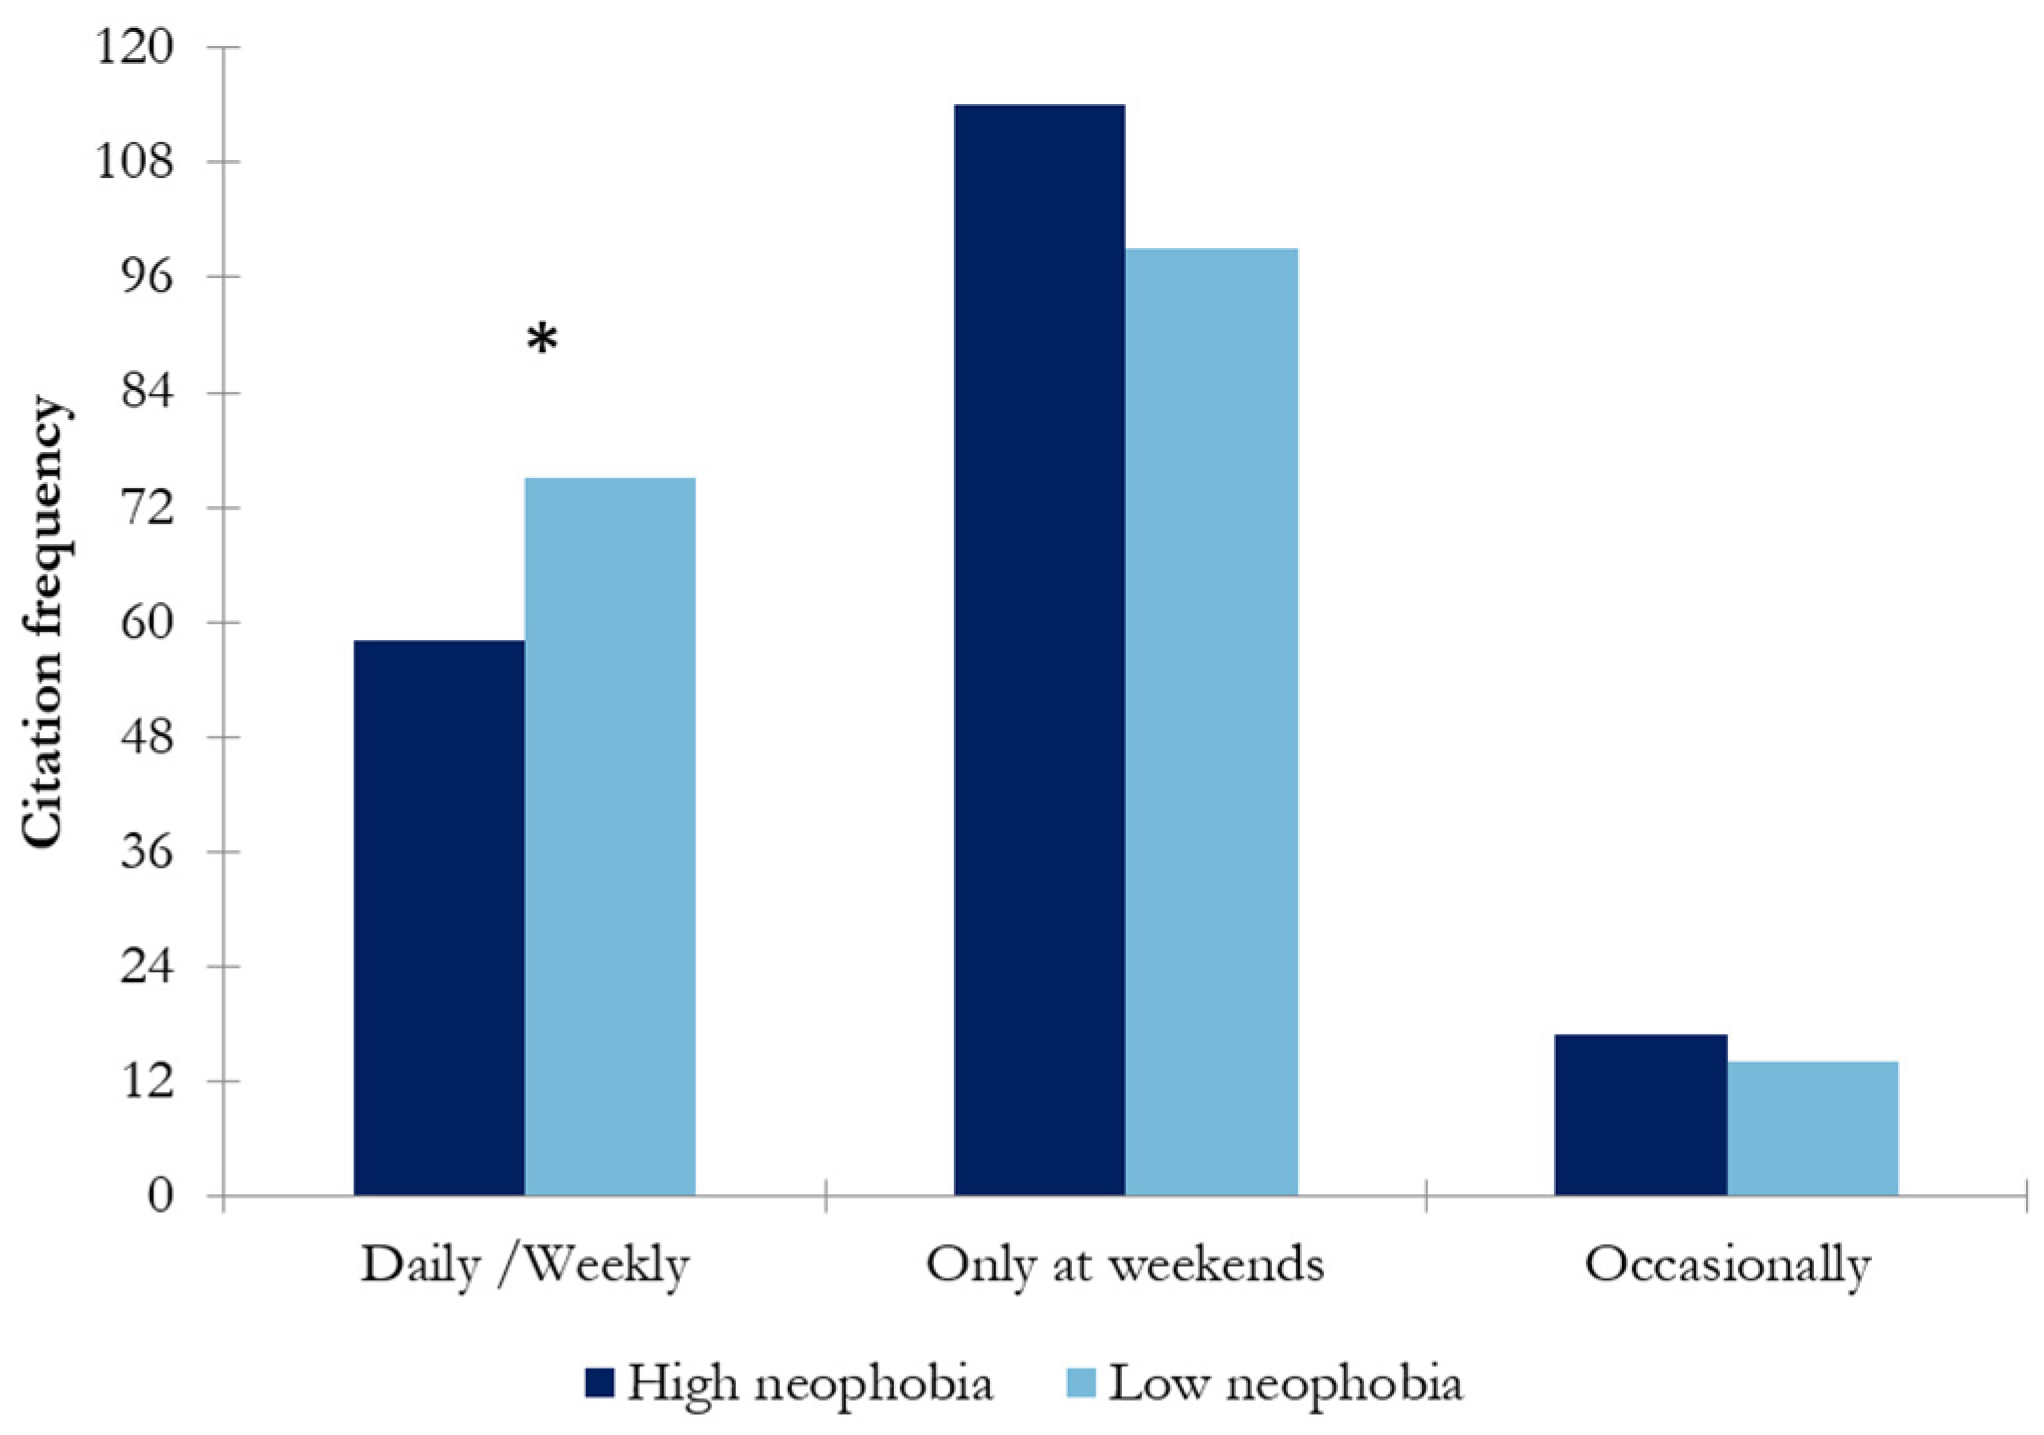
3.1.2. Differences in Wine Consumer Behavior Data Between Wine-Neophobic Groups
Frequency of Wine Consumption
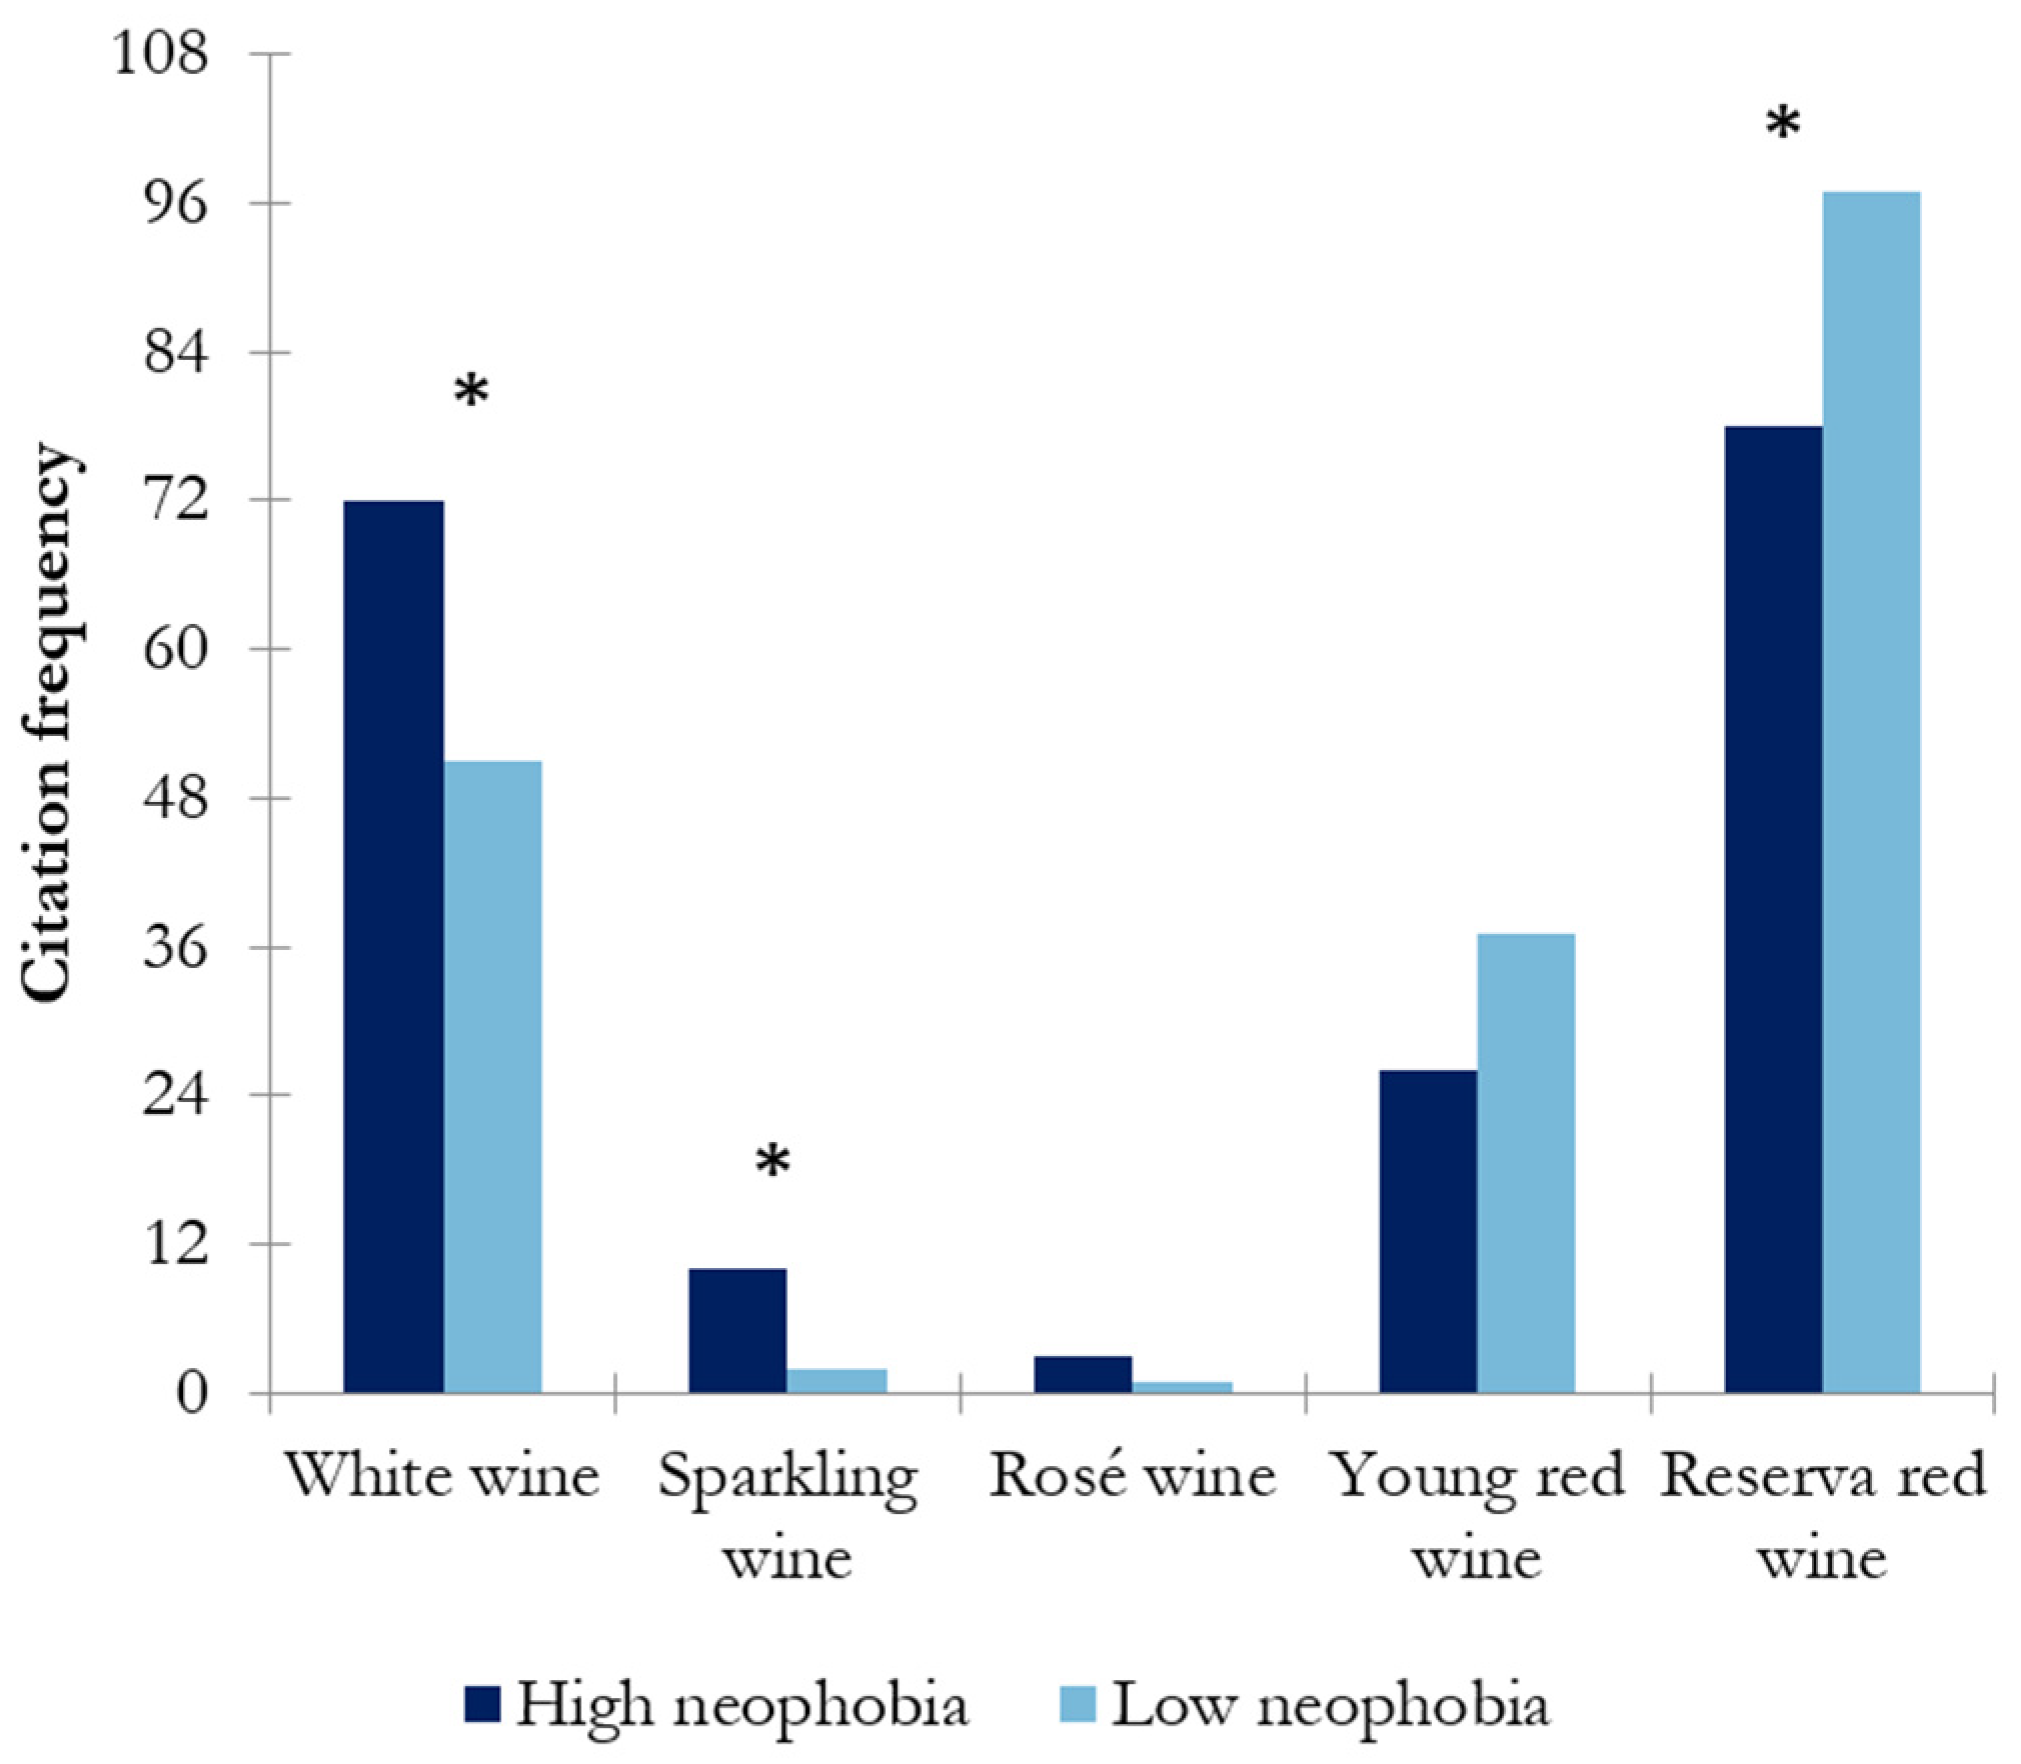
Wine Preference
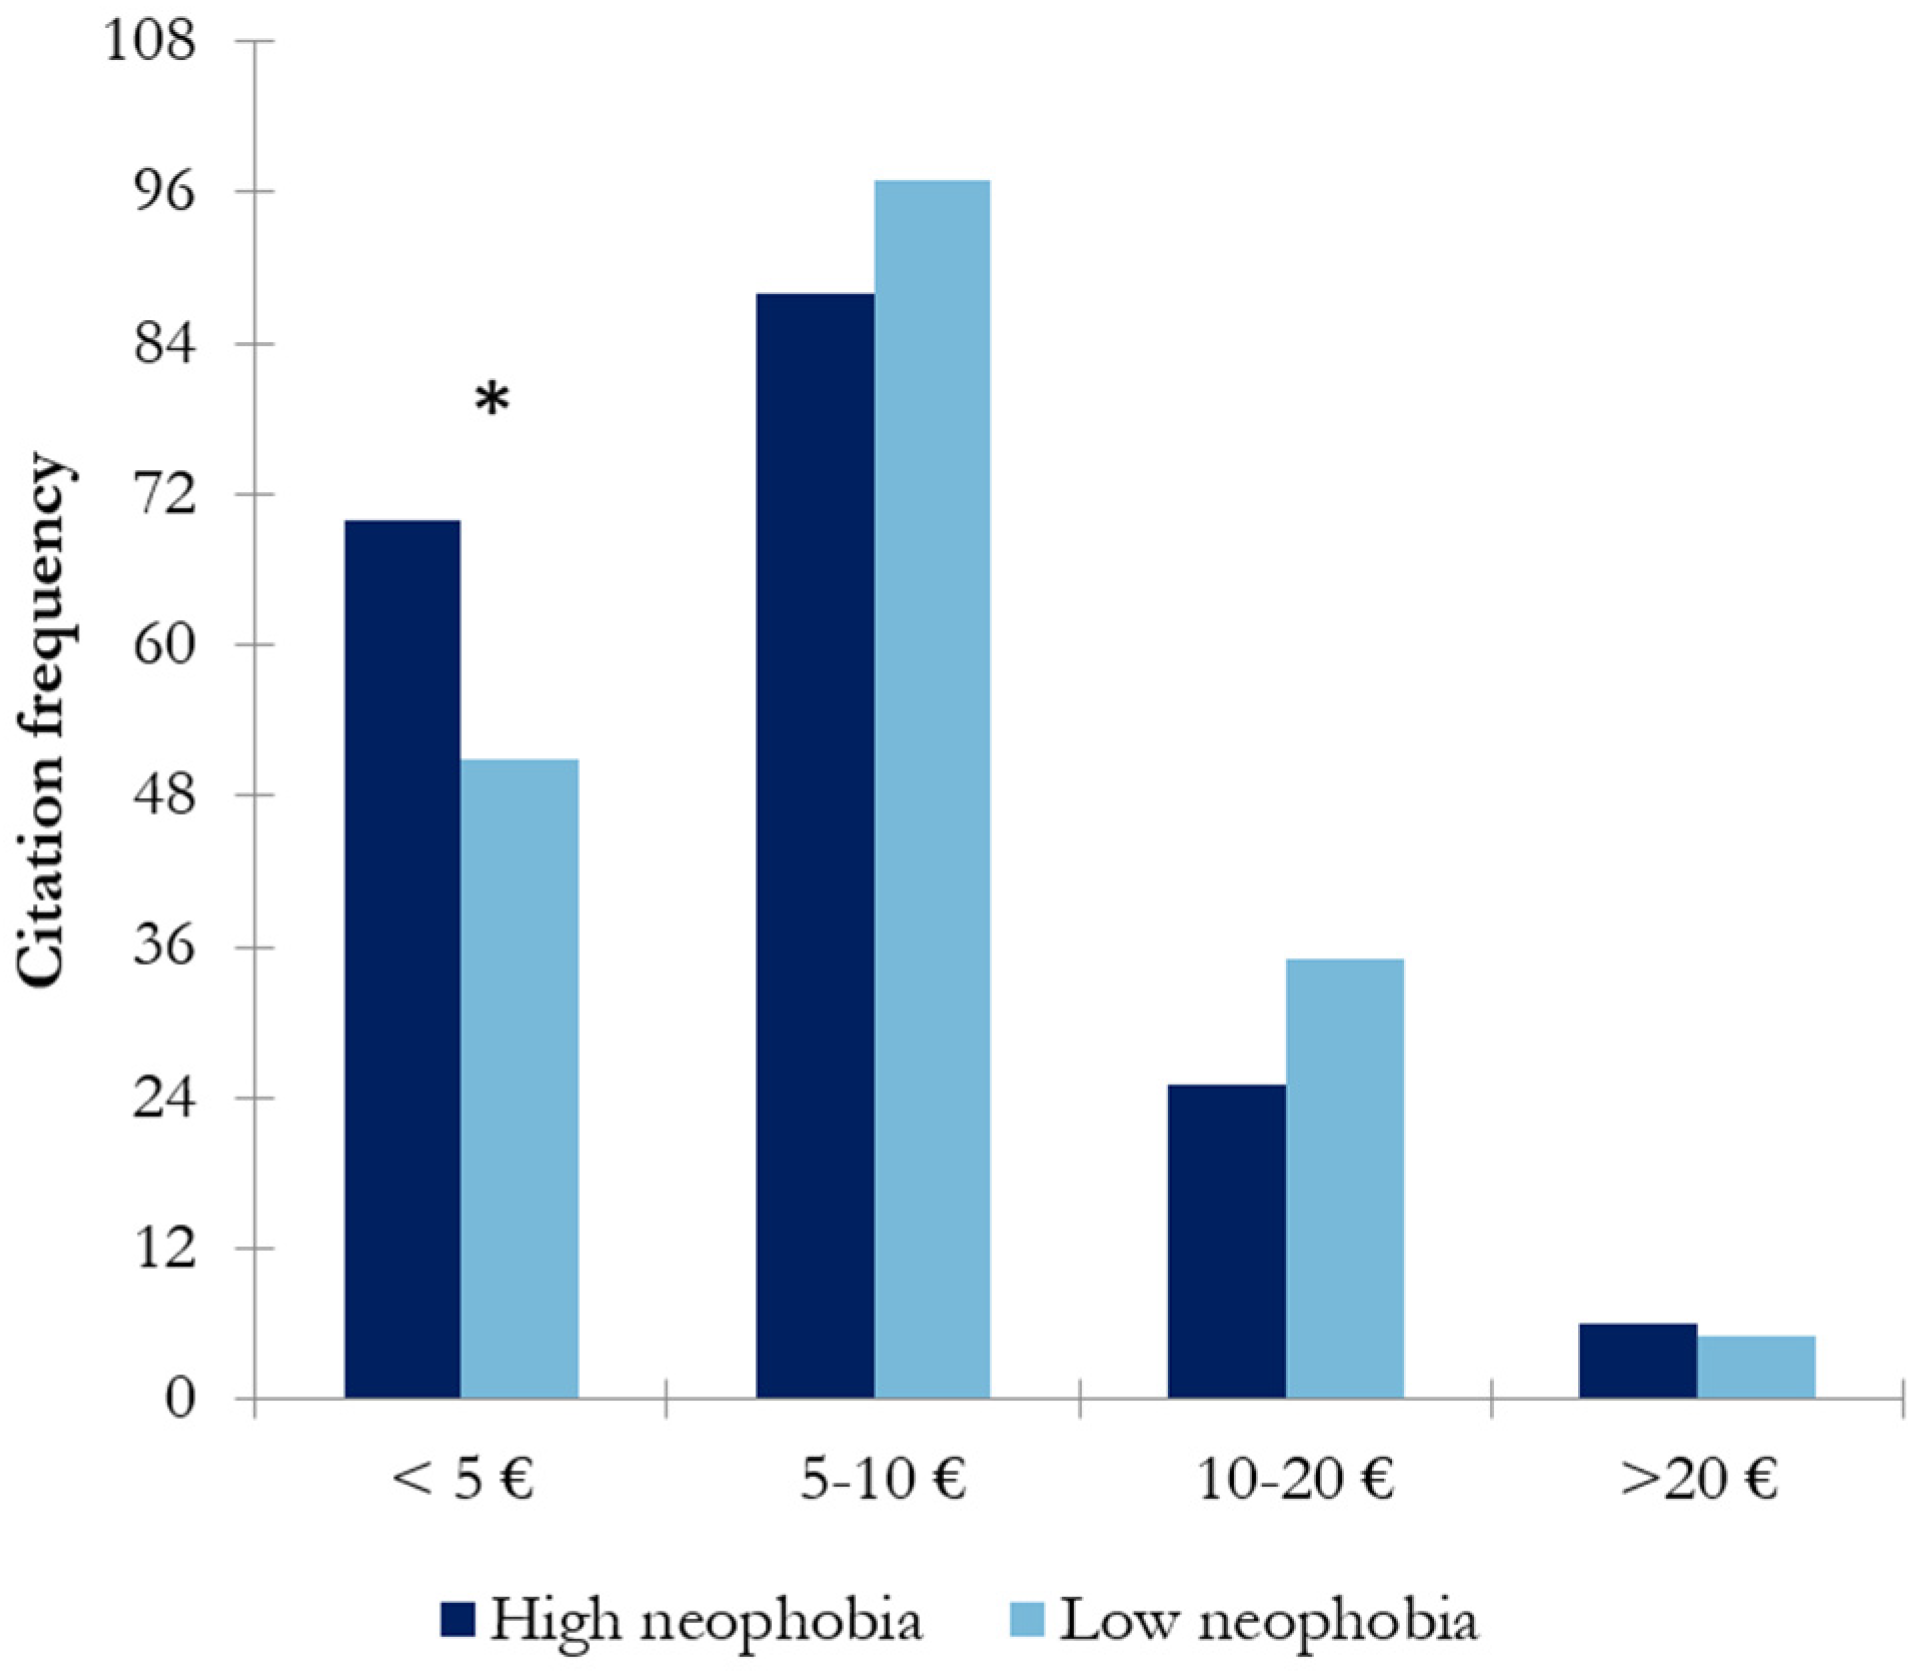
Everyday Spending on Wine
Spending Money on Wine When Celebrating a Special Occasion
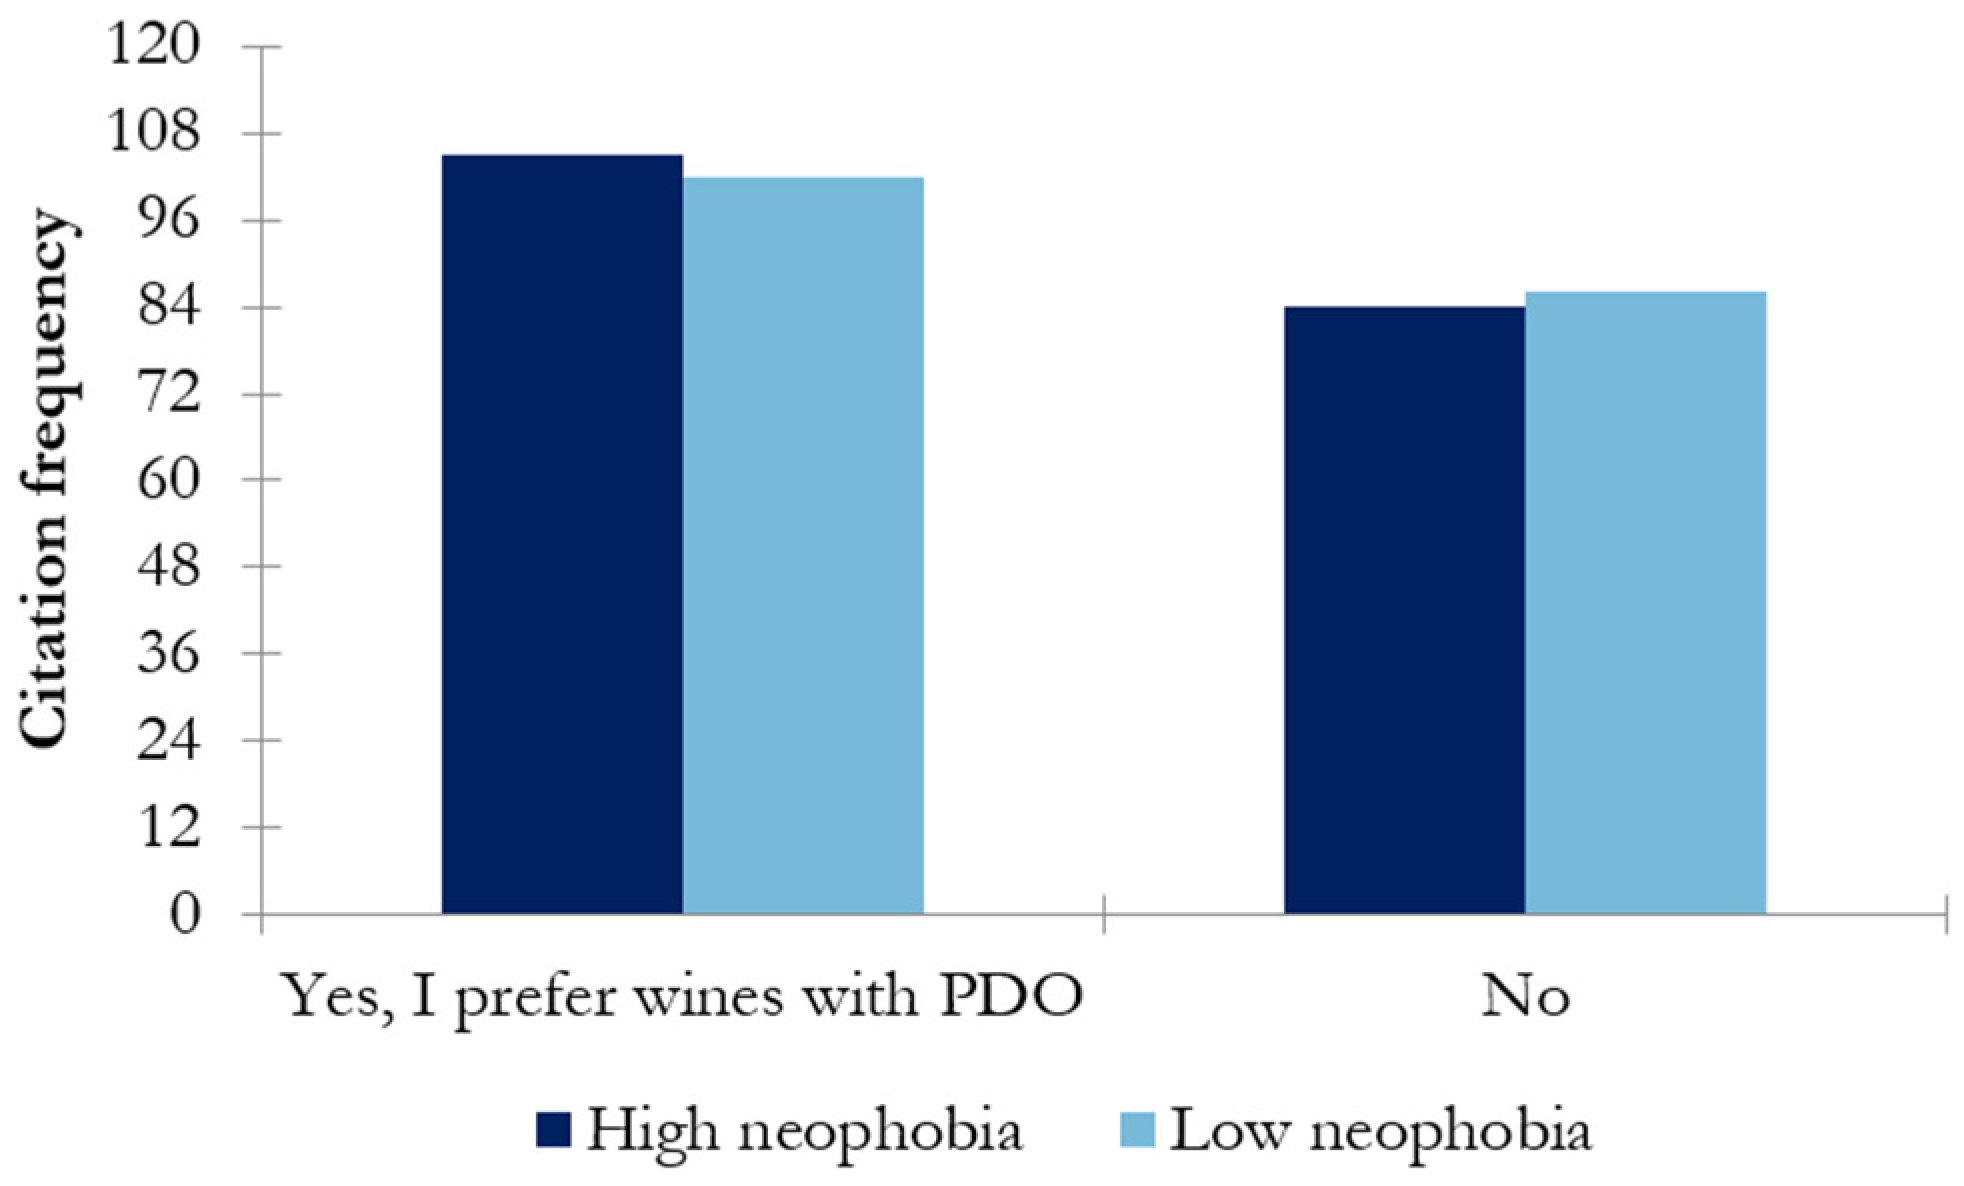
PDO (Protected Designation of Origin) Wine Preference
Preference of Wine over Other Alcoholic Beverages
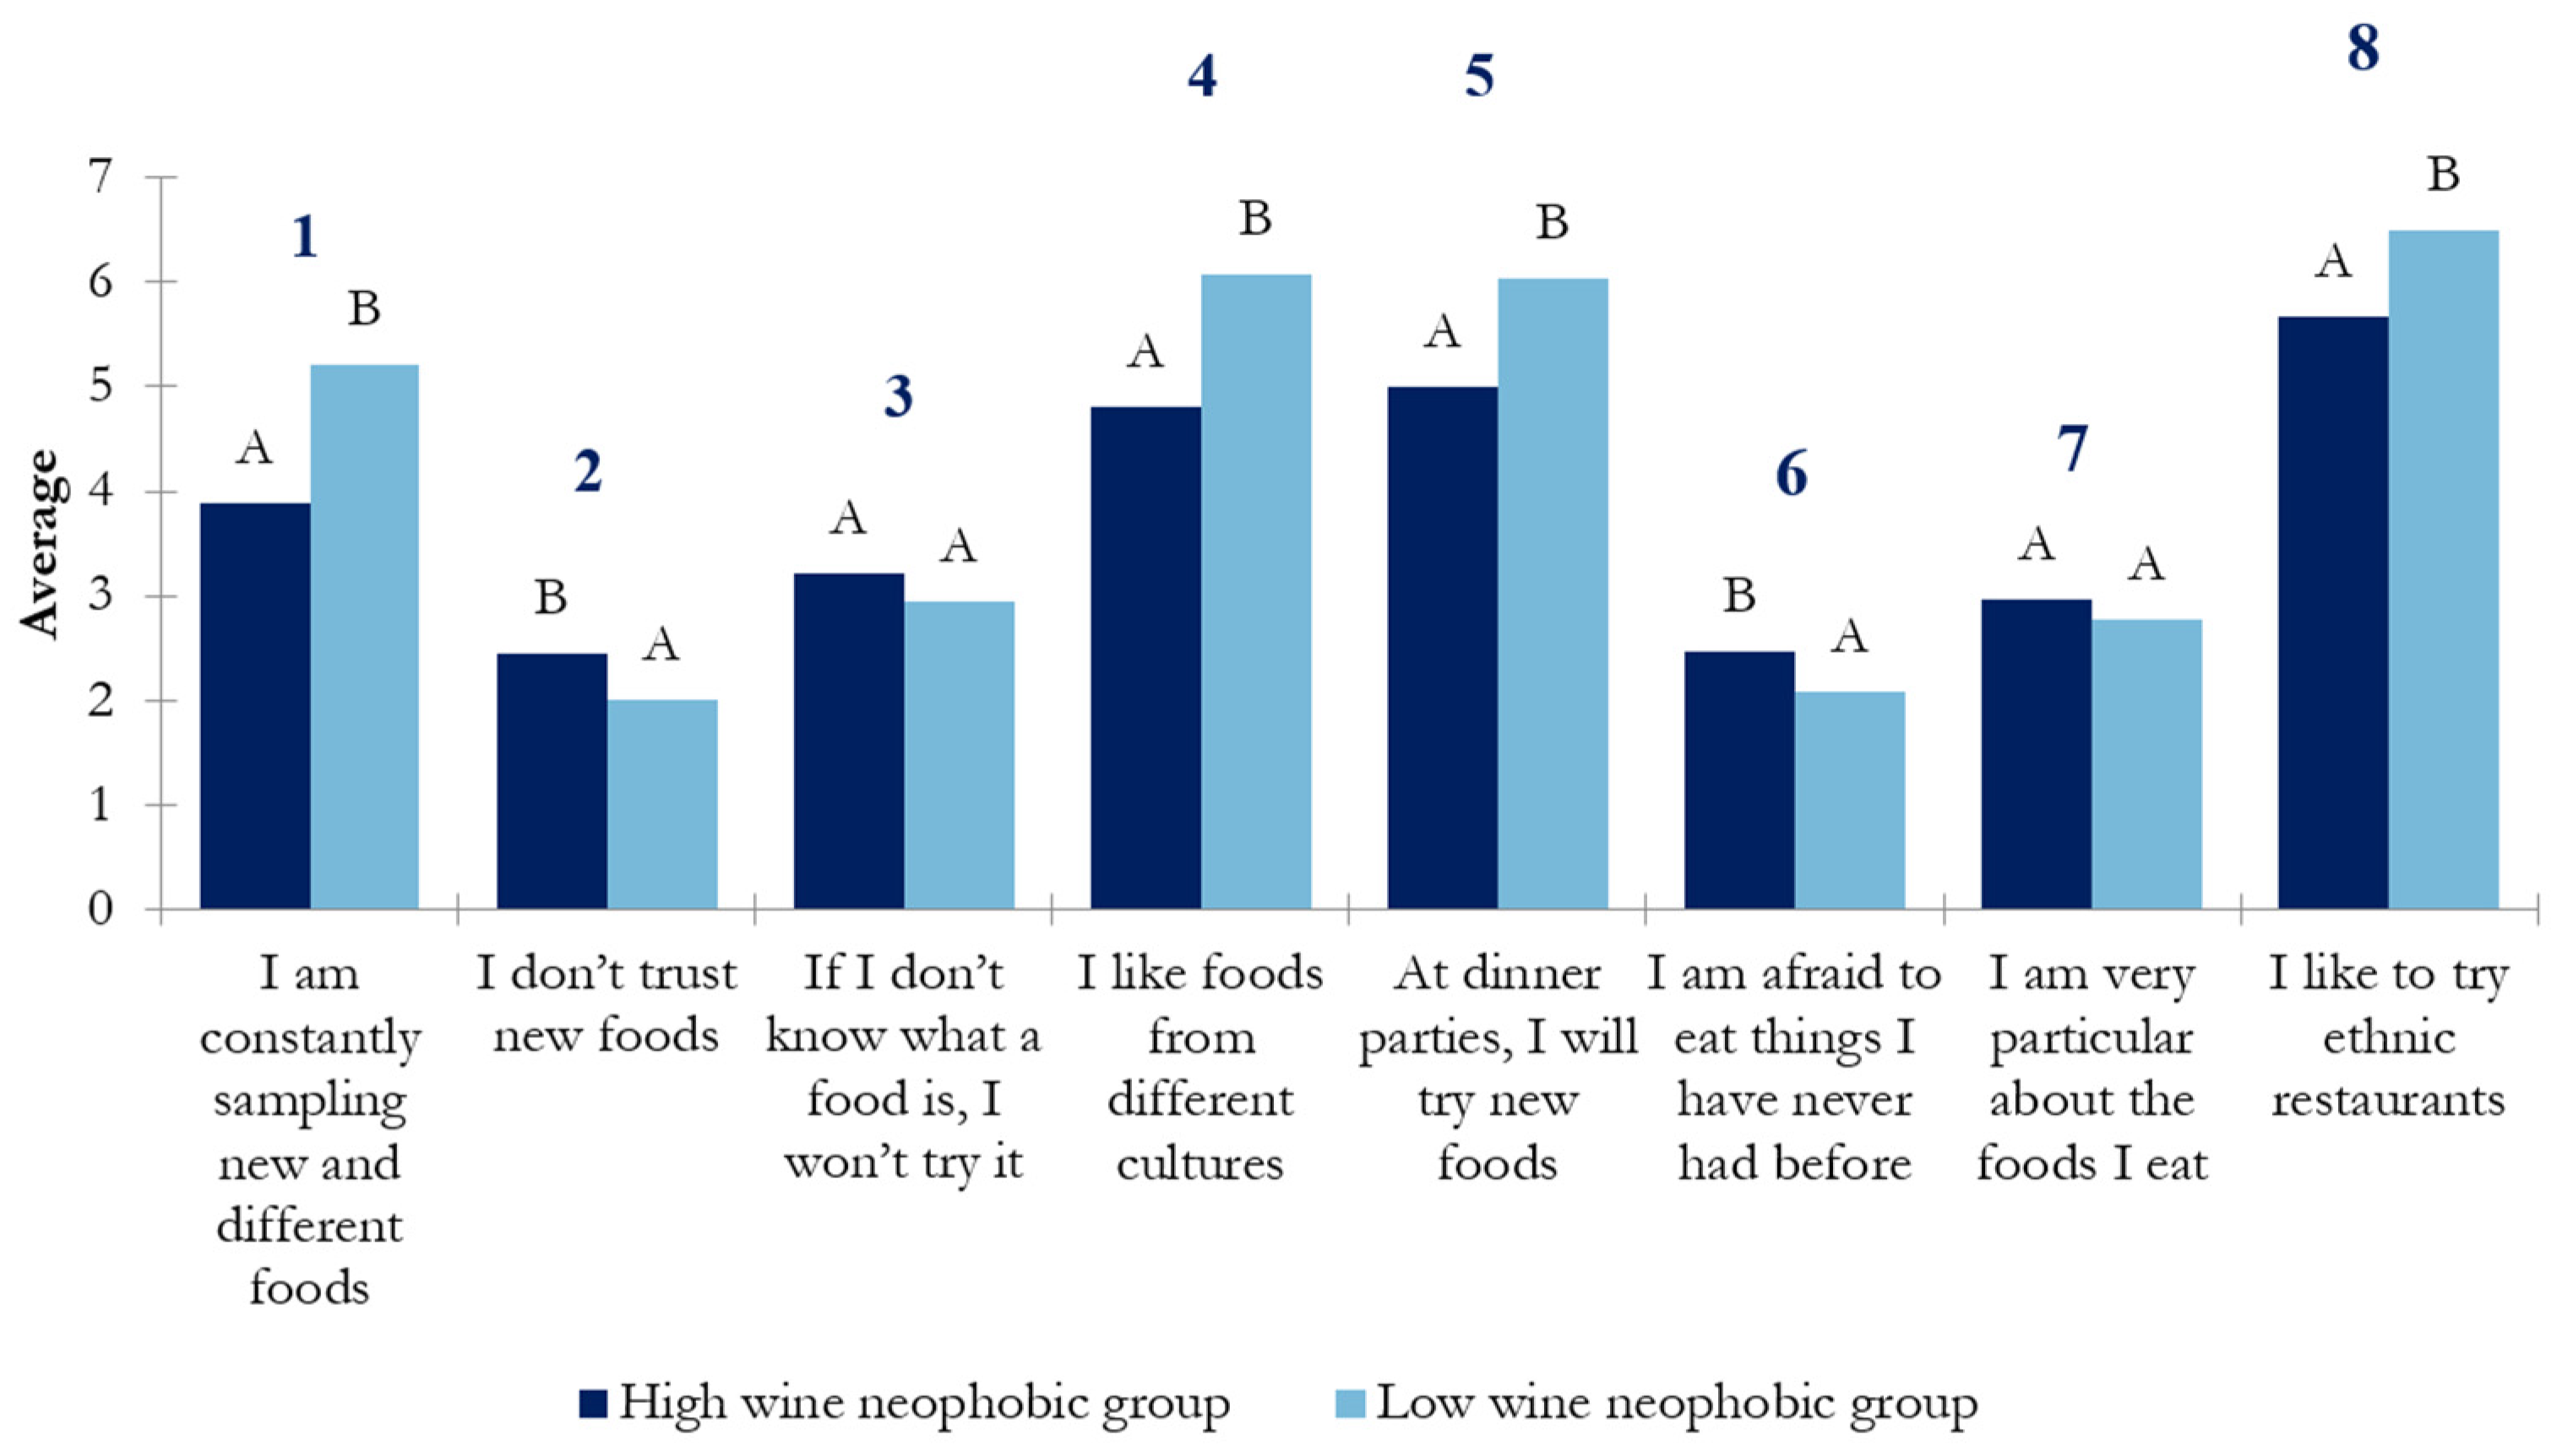
3.1.3. Differences in Food Neophobia Between Wine-Neophobic Groups
4. Discussion
5. Limitations and Future Research Directions
6. Conclusions
Author Contributions
Funding
Institutional Review Board Statement
Informed Consent Statement
Data Availability Statement
Conflicts of Interest
References
- Capiola, A.; Raudenbush, B. The Effects of Food Neophobia and Food Neophilia on Diet and Metabolic Processing. Food Nutr. Sci. 2012, 3, 1397–1403. [Google Scholar] [CrossRef]
- Pliner, P.; Hobden, K. Development of a scale to measure the trait of food neophobia in humans. Appetite 1992, 19, 105–120. [Google Scholar] [CrossRef] [PubMed]
- Del Campo, C.; Bouzas, C.; Monserrat-Mesquida, M.; Tur, J.A. Assessing Food Preferences and Neophobias Among Spanish Adolescents from Castilla–La Mancha. Foods 2023, 12, 3717. [Google Scholar] [CrossRef] [PubMed]
- Hazley, D.; McCarthy, S.N.; Stack, M.; Walton, J.; McNulty, B.A.; Flynn, A.; Kearney, J.M. Food neophobia and its relationship with dietary variety and quality in Irish adults: Findings from a national cross-sectional study. Appetite 2022, 169, 105859. [Google Scholar] [CrossRef] [PubMed]
- Knaapila, A.J.; Sandell, M.A.; Vaarno, J.; Hoppu, U.; Puolimatka, T.; Kaljonen, A.; Lagström, H. Food neophobia associates with lower dietary quality and higher BMI in Finnish adults. Public Health Nutr. 2015, 18, 2161–2171. [Google Scholar] [CrossRef] [PubMed]
- Van Trijp, H.C.M. Product-related Determinants of Variety-Seeking Behavior for Foods. Appetite 1994, 22, 1–10. [Google Scholar] [CrossRef] [PubMed]
- Ristic, R.; Johnson, T.E.; Meiselman, H.L.; Hoek, A.C.; Bastian, S.E.P. Towards development of a Wine Neophobia Scale (WNS): Measuring consumer wine neophobia using an adaptation of the Food Neophobia Scale (FNS). Food Qual. Prefer. 2016, 49, 161–167. [Google Scholar] [CrossRef]
- Barisan, L.; Galletto, L.; Franceschi, D.; Caracciolo, F. From vineyard to glass: Measuring consumers’ willingness to pay for innovative rootstock-produced wine through an experimental auction. J. Clean. Prod. 2024, 475, 143574. [Google Scholar] [CrossRef]
- Białek-Dratwa, A.; Staśkiewicz-Bartecka, W.; Kiciak, A.; Wardyniec, A.; Grajek, M.; Aktaç, Ş.; Çelik, Z.M.; Sabuncular, G.; İslamoğlu, A.H.; Kowalski, O. Food Neophobia and Avoidant/Restrictive Food Intake Among Adults and Related Factors. Nutrients 2024, 16, 2952. [Google Scholar] [CrossRef]
- Pickering, G.J.; Dale, G.; Kemp, B. Optimization and application of the wine neophobia scale. Beverages 2021, 7, 41. [Google Scholar] [CrossRef]
- Zhu, Y.; Su, Q.; Jiao, J.; Kelanne, N.; Kortesniemi, M.; Xu, X.; Zhu, B.; Laaksonen, O. Exploring the Sensory Properties and Preferences of Fruit Wines Based on an Online Survey and Partial Projective Mapping. Foods 2023, 12, 1844. [Google Scholar] [CrossRef]
- Nguyen, A.N.; Johnson, T.E.; Jeffery, D.W.; Danner, L.; Bastian, S.E.P. A cross-cultural examination of Australian, Chinese and Vietnamese consumers’ attitudes towards a new Australian wine product containing Ganoderma lucidum extract. Food Res. Int. 2019, 115, 393–399. [Google Scholar] [CrossRef]
- Nieto-Villegas, R.; Rabadán, A.; Bernabéu, R. A gender approach to wine innovation and organic wine preferences. Cienc. Tec. Vitivinic. 2022, 37, 60–70. [Google Scholar] [CrossRef]
- Rabadán, A.; Bernabéu, R. An approach to eco-innovation in wine production from a consumer’s perspective. J. Clean. Prod. 2021, 310, 127479. [Google Scholar] [CrossRef]
- Rabadán, A.; Bernabéu, R. A systematic review of studies using the Food Neophobia Scale: Conclusions from thirty years of studies. Food Qual. Prefer. 2021, 93, 104241. [Google Scholar] [CrossRef]
- Rabadán, A. Consumer attitudes towards technological innovation in a traditional food product: The case of wine. Foods 2021, 10, 1363. [Google Scholar] [CrossRef] [PubMed]
- Ristic, R.; Danner, L.; Johnson, T.E.; Meiselman, H.L.; Hoek, A.C.; Jiranek, V.; Bastian, S.E.P. Wine-related aromas for different seasons and occasions: Hedonic and emotional responses of wine consumers from Australia, UK and USA. Food Qual. Prefer. 2019, 71, 250–260. [Google Scholar] [CrossRef]
- Fernández-Ruiz, V.; Claret, A.; Chaya, C. Testing a Spanish-Version of the Food Neophobia Scale. Food Qual. Prefer. 2013, 28, 222–225. [Google Scholar] [CrossRef]
- Domínguez, L.; Fernández-Ruiz, V.; Sánchez-Mata, M.C.; Cámara, M. Food neophobia: Spanish case study related to new formulations based on traditional ‘gazpacho’. Acta Hortic. 2019, 1233, 209–216. [Google Scholar] [CrossRef]
- Ritchey, P.N.; Frank, R.A.; Hursti, U.K.; Tuorila, H. Validation and cross-national comparison of the food neophobia scale (FNS) using confirmatory factor analysis. Appetite 2003, 40, 163–173. [Google Scholar] [CrossRef] [PubMed]
- Demattè, M.L.; Endrizzi, I.; Gasperi, F. Food neophobia and its relation with olfaction. Front. Psychol. 2014, 5, 127. [Google Scholar] [CrossRef] [PubMed]
- Lähteenmäki, L.; Arvola, A. Food neophobia and variety seeking—Consumer ear or demand for new food products. In Food, People and Society; Frewer, L.J., Risvik, E., Schifferstein, H., Eds.; Springer: Berlin/Heidelberg, Germany, 2001; pp. 161–175. [Google Scholar]
- Schnettler, B.; Crisóstomo, G.; Sepúlveda, J.; Mora, M.; Lobos, G.; Miranda, H.; Grunert, K.G. Food neophobia, nanotechnology and satisfaction with life. Appetite 2013, 69, 71–79. [Google Scholar] [CrossRef]
- Tuorila, H.; Cardello, A. Consumer responses to an off-flavor in juice in the presence of specific health claims. Food Qual. Prefer. 2001, 13, 561–569. [Google Scholar] [CrossRef]
- Tuorila, H.; Lähteenmäki, L.; Pohjalainen, L.; Lotti, L. Food neophobia among the Finns and related responses to familiar and unfamiliar foods. Food Qual. Prefer. 2001, 12, 29–37. [Google Scholar] [CrossRef]
- D’Antuono, L.F.; Bignami, C. Perception of typical Ukrainian foods among an Italian population. Food Qual. Prefer. 2012, 25, 1–8. [Google Scholar] [CrossRef]
- Meiselman, H.L.; King, S.C.; Gillette, M. The demographics of neophobia in a large commercial US sample. Food Qual. Prefer. 2010, 21, 893–897. [Google Scholar] [CrossRef]
- Sanjuán-López, A.; Philippidis, G.; Resano-Ezcaray, H. How useful is acceptability to explain economic value? An application on the introduction of innovative saffron products into commercial markets. Food Qual. Prefer. 2011, 22, 255–263. [Google Scholar] [CrossRef]
- Schickenberg, B.; Van Assema, P.; Burg, J.; De Vries, N. Level of food neophobia in Dutch adults and association with familiarity with and willingness to try new healthful food products. Appetite 2006, 47, 276. [Google Scholar] [CrossRef]
- Bernabéu, R.; Díaz, M.; Oliveira, F. Consumer preferences for red wine in the Spanish market. Cienc. Tec. Vitivinic. 2016, 31, 88–97. [Google Scholar] [CrossRef]
- Laureati, M.; Spinelli, S.; Monteleone, E.; Dinnella, C.; Prescott, J.; Cattaneo, C.; Pagliarini, E. Associations between food neophobia and responsiveness to “warning” chemosensory sensations in food products in a large population sample. Food Qual. Prefer. 2018, 68, 113–124. [Google Scholar] [CrossRef]
- Ministerio de Agricultura Pesca y Alimentación. Informe del Consumo de Alimentación en España 2020 (Issue Nov 2021). Available online: https://www.mapa.gob.es/es/alimentacion/temas/consumo-tendencias/panel-de-consumo-alimentario/resumen-anual-de-la-alimentacion/ (accessed on 20 December 2024).
- Edwards, J.S.A.; Hartwell, H.L.; Brown, L. Changes in food neophobia and dietary habits of international students. J. Hum. Nutr. Diet. 2010, 23, 301–311. [Google Scholar] [CrossRef] [PubMed]
- Knaapila, A.; Silventoinen, K.; Broms, U.; Rose, R.J.; Perola, M.; Kaprio, J.; Tuorila, H.M. Food neophobia in young adults: Genetic architecture and relation to personality, pleasantness and use frequency of foods, and body mass index—A twin study. Behav. Genet. 2011, 41, 512–521. [Google Scholar] [CrossRef]
- Schickenberg, B.; Van Assema, P.; Brug, J.; De Vries, N.K. Are the Dutch acquainted with and willing to try healthful food products? The role of food neophobia. Public Health Nutr. 2008, 11, 493–500. [Google Scholar] [CrossRef] [PubMed]
- Helland, S.H.; Bere, E.; Bjørnarå, H.B.; Øverby, N.C. Food neophobia and its association with intake of fish and other selected foods in a Norwegian sample of toddlers: A cross-sectional study. Appetite 2017, 114, 110–117. [Google Scholar] [CrossRef] [PubMed]


| Item | Statements in English | Statements in Spanish |
|---|---|---|
| 1 | I like going to places serving wines from different countries (R) | Me gusta ir a lugares donde sirven vinos de diferentes países (R) |
| 2 | I will drink almost any wine (R) | Bebería casi cualquier vino (R) |
| 3 | I am afraid to drink wines I have never had before | Me da miedo beber vinos que no he probado nunca |
| 4 | At social gatherings, I will try a new wine (R) | En celebraciones sociales, probaría cualquier vino (R) |
| 5 | I like wines from different countries (R) | Me gusta probar vinos de diferentes países (R) |
| 6 | If I do not know what wine it is, I won’t try it | Si no sé qué vino es, no lo pruebo |
| 7 | I do not trust new wines | No confío en vinos nuevos |
| Items | Statements in English | Statements in Spanish |
|---|---|---|
| 1 | I am constantly sampling new and different foods (R) | Estoy constantemente probando alimentos nuevos y diferentes (R) |
| 2 | I don’t trust new foods | No confío en los alimentos nuevos |
| 3 | If I don’t know what a food is, I won’t try it | Si no conozco qué hay en un alimento, no lo pruebo |
| 4 | I like foods from different cultures (R) | Me gustan las comidas de países diferentes (R) |
| 5 | At dinner parties, I will try new foods (R) | En fiestas con comida, pruebo nuevos alimentos (R) |
| 6 | I am afraid to eat things I have never had before | Me da miedo probar alimentos que nunca he probado antes |
| 7 | I am very particular about the foods I eat | Soy muy especial con los alimentos que como |
| 8 | I like to try ethnic restaurants (R) | Me gusta probar nuevos restaurantes étnicos (R) |
| Variables | Options | High-Wine-Neophobic Group | Low-Wine-Neophobic Group | Chi-Square (p) |
|---|---|---|---|---|
| Age | 18–40 y.o. | 92 | 101 | 0.301 |
| Over 40 y.o. | 96 | 87 | 0.301 | |
| Gender | Female | 124 | 92 | 0.001 |
| Male | 64 | 96 | 0.001 | |
| Education level | No schooling | 0 | 0 | - |
| Primary education | 3 | 1 | 0.623 | |
| Secondary education | 11 | 3 | 0.053 | |
| Upper secondary education | 47 | 40 | 0.463 | |
| Bachelor or master (or equivalent) | 127 | 144 | 0.066 | |
| Marital status | Married | 86 | 86 | 0.999 |
| Unmarried partner | 31 | 52 | 0.013 | |
| Divorced | 7 | 7 | 1.000 | |
| Single | 62 | 42 | 0.028 | |
| Widower | 2 | 1 | 0.999 | |
| Employment | Homemaker | 0 | 0 | - |
| Self-employment | 16 | 15 | 0.999 | |
| Unemployment | 16 | 10 | 0.309 | |
| Employed | 99 | 122 | 0.021 | |
| Student | 40 | 33 | 0.434 | |
| Retired | 17 | 8 | 0.096 | |
| Monthly expenditure on food | <200 euros | 83 | 82 | 0.999 |
| 201–400 euros | 43 | 51 | 0.405 | |
| 401–600 euros | 34 | 32 | 0.892 | |
| >600 euros | 28 | 23 | 0.547 | |
| Household | Living with friends or flatmates | 18 | 17 | 0.999 |
| Living with relatives (parents, grandparents, etc.) | 42 | 31 | 0.192 | |
| Living with my partner | 51 | 46 | 0.637 | |
| Living with my partner or my kids | 61 | 79 | 0.070 | |
| I live alone | 16 | 14 | 0.849 | |
| Universitary residence | 0 | 1 | 0.999 |
Disclaimer/Publisher’s Note: The statements, opinions and data contained in all publications are solely those of the individual author(s) and contributor(s) and not of MDPI and/or the editor(s). MDPI and/or the editor(s) disclaim responsibility for any injury to people or property resulting from any ideas, methods, instructions or products referred to in the content. |
© 2025 by the authors. Licensee MDPI, Basel, Switzerland. This article is an open access article distributed under the terms and conditions of the Creative Commons Attribution (CC BY) license (https://creativecommons.org/licenses/by/4.0/).
Share and Cite
Criado, C.; Pozo-Bayón, M.Á.; Domínguez, L.; Fernández-Ruiz, V.; Muñoz-González, C. Relationship of Wine Neophobia Levels with Demographic Factors and Wine Consumption Behavior in Spanish Consumers. Nutrients 2025, 17, 687. https://doi.org/10.3390/nu17040687
Criado C, Pozo-Bayón MÁ, Domínguez L, Fernández-Ruiz V, Muñoz-González C. Relationship of Wine Neophobia Levels with Demographic Factors and Wine Consumption Behavior in Spanish Consumers. Nutrients. 2025; 17(4):687. https://doi.org/10.3390/nu17040687
Chicago/Turabian StyleCriado, Celia, Maria Ángeles Pozo-Bayón, Laura Domínguez, Virginia Fernández-Ruiz, and Carolina Muñoz-González. 2025. "Relationship of Wine Neophobia Levels with Demographic Factors and Wine Consumption Behavior in Spanish Consumers" Nutrients 17, no. 4: 687. https://doi.org/10.3390/nu17040687
APA StyleCriado, C., Pozo-Bayón, M. Á., Domínguez, L., Fernández-Ruiz, V., & Muñoz-González, C. (2025). Relationship of Wine Neophobia Levels with Demographic Factors and Wine Consumption Behavior in Spanish Consumers. Nutrients, 17(4), 687. https://doi.org/10.3390/nu17040687