
Trend and Burden of Vitamin A Deficiency in 1990–2021 and Projection to 2050: A Systematic Analysis for the Global Burden of Disease Study 2021
_Qi.png)


Abstract
1. Introduction
2. Materials and Methods
2.1. Data Source
2.2. SDI
2.3. Statistical Analysis
3. Results
3.1. Global
3.2. Sociodemographic Index
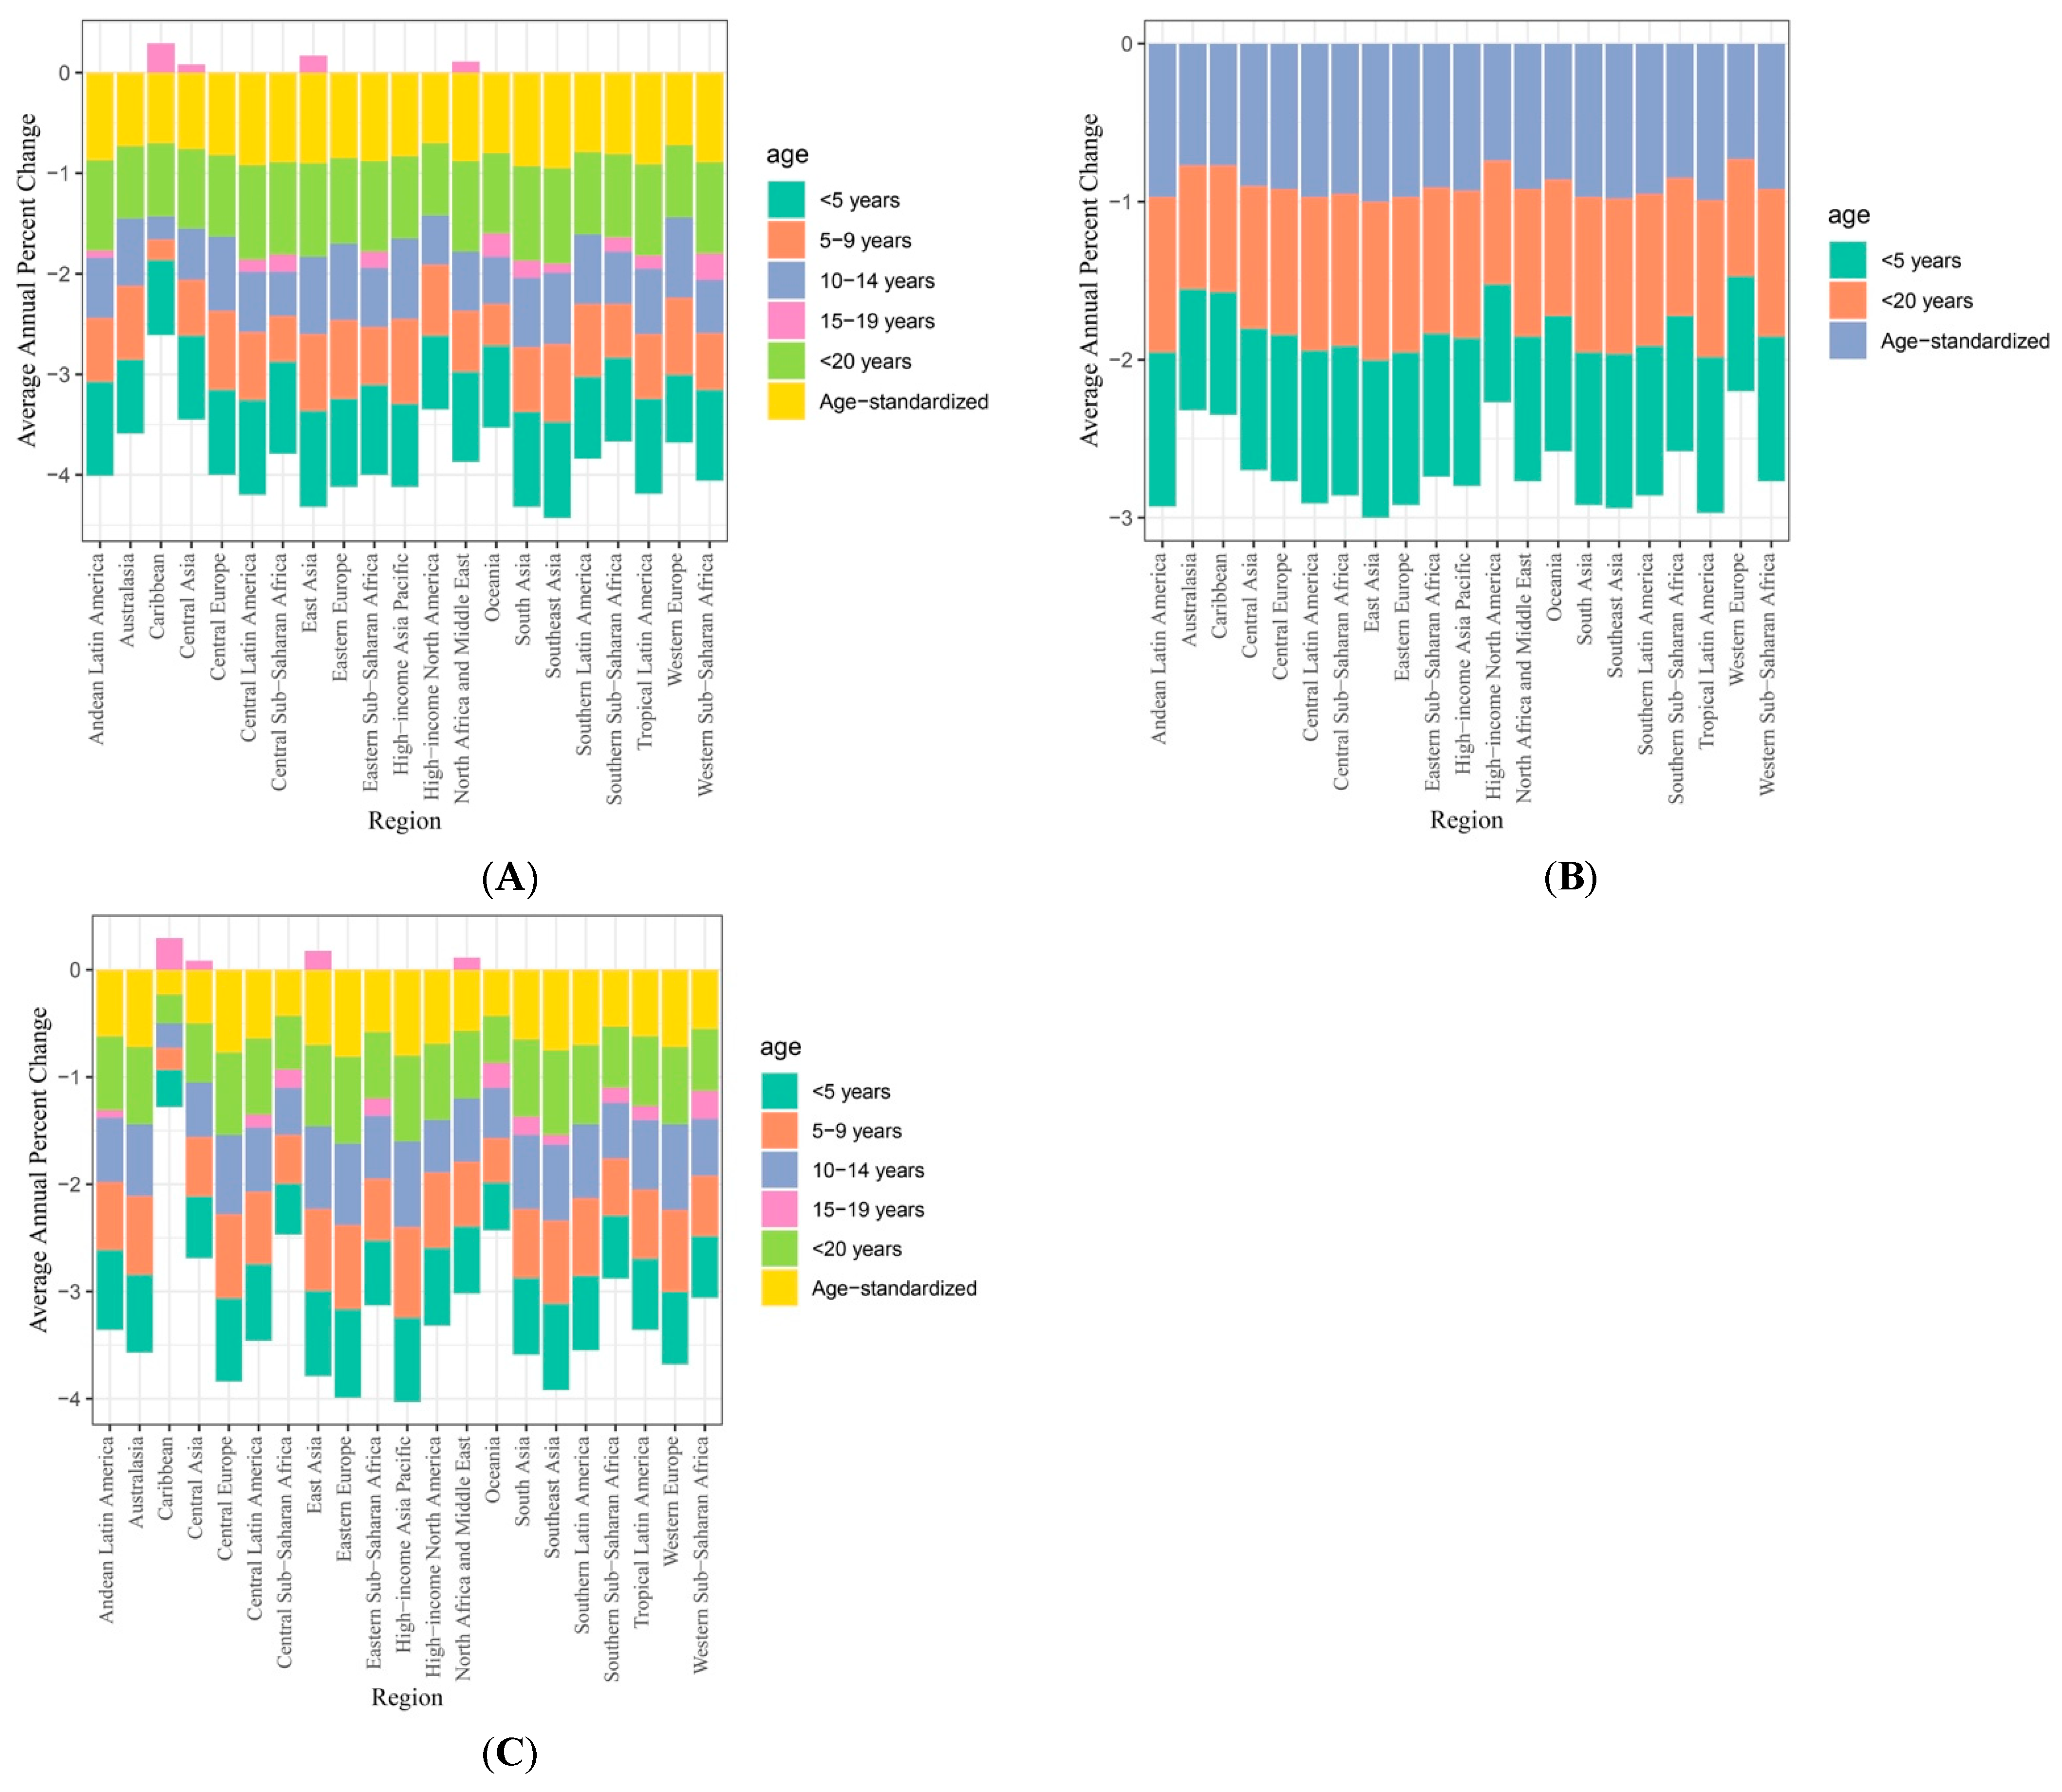
3.3. Regional
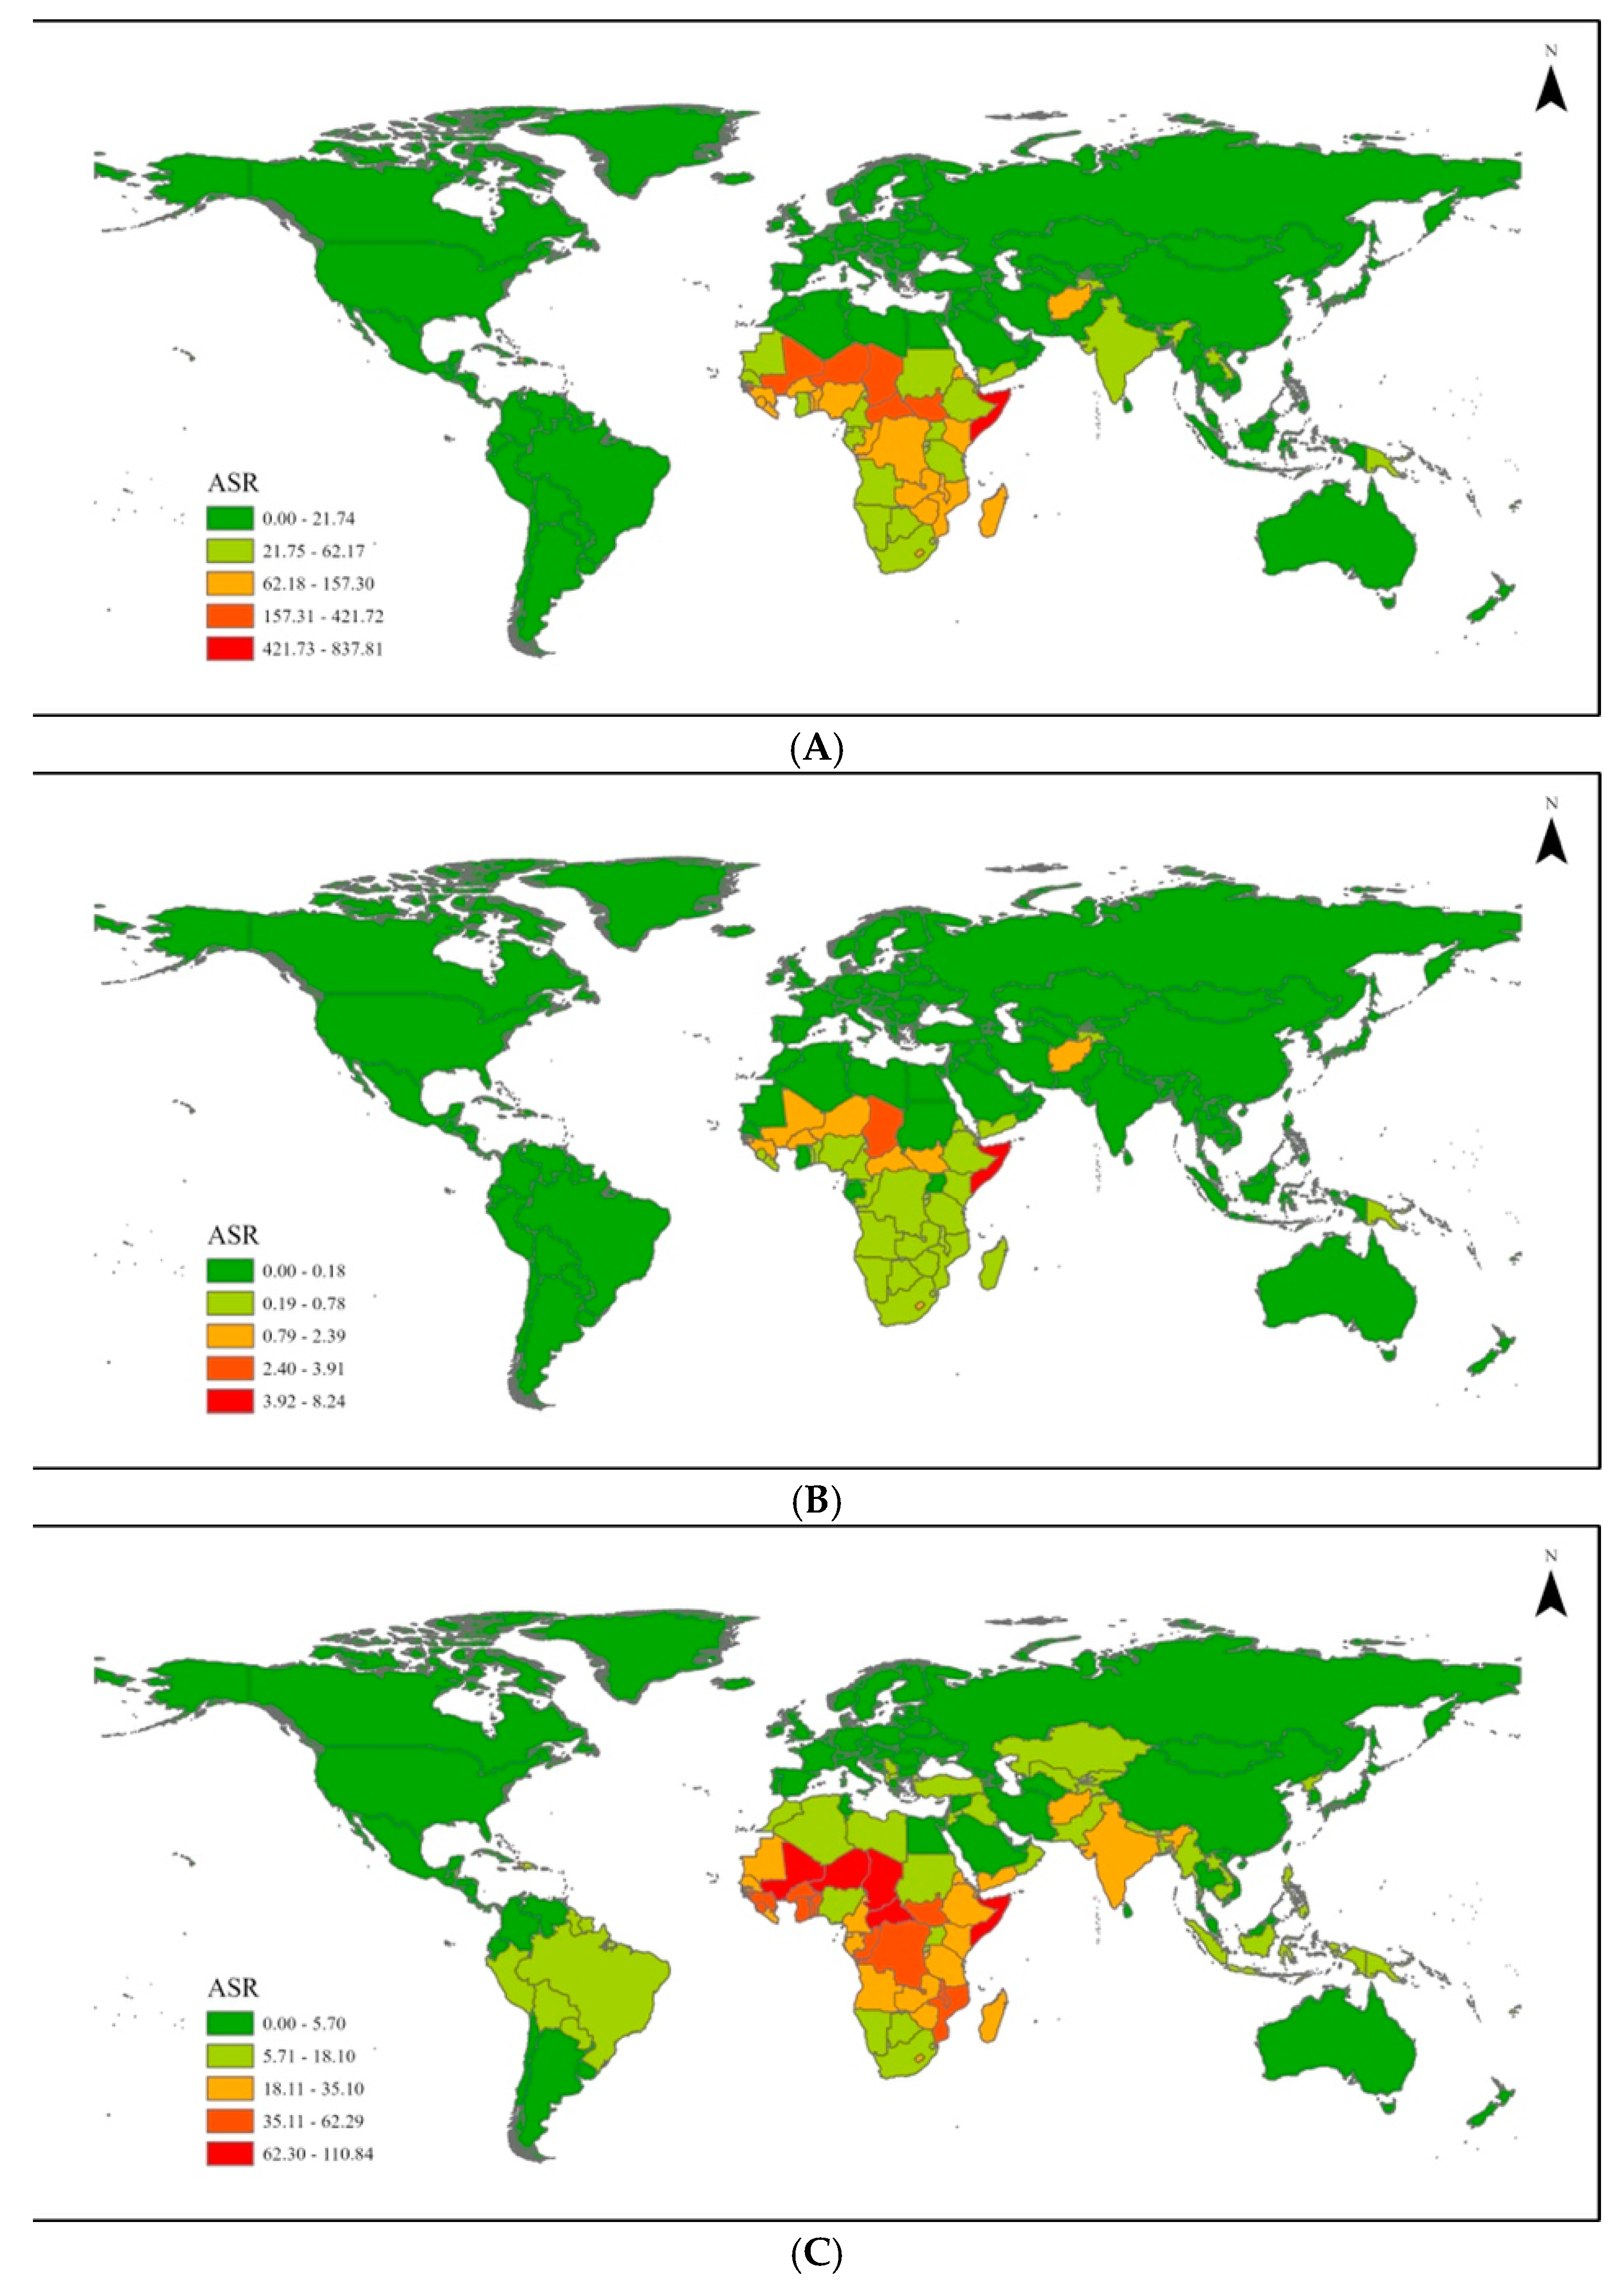
3.4. National
4. Discussion
5. Conclusions
Author Contributions
Funding
Institutional Review Board Statement
Informed Consent Statement
Data Availability Statement
Conflicts of Interest
Abbreviations
| LMICs | Low-to-middle income countries |
| VAD | Vitamin A deficiency |
| WHO | World Health Organization |
| DALYs | Disability-adjusted life years |
| YLDs | Years Lost to Disability |
| AAPC | Average Annual Percentage Change |
| ASR | Age-standardized rate |
| SDI | Sociodemographic index score |
| LDI | Lag-distributed income |
| CI | Confidence interval |
References
- Stevens, G.A.; Bennett, J.E.; Hennocq, Q.; Lu, Y.; De-Regil, L.M.; Rogers, L.; Danaei, G.; Li, G.; White, R.A.; Flaxman, S.R.; et al. Trends and mortality effects of vitamin A deficiency in children in 138 low-income and middle-income countries between 1991 and 2013: A pooled analysis of population-based surveys. Lancet Glob. Health 2015, 3, e528–e536. [Google Scholar] [CrossRef]
- Black, R.E.; Allen, L.H.; Bhutta, Z.A.; Caulfield, L.E.; de Onis, M.; Ezzati, M.; Mathers, C.; Rivera, J. Maternal and child undernutrition: Global and regional exposures and health consequences. Lancet 2008, 371, 243–260. [Google Scholar] [CrossRef] [PubMed]
- Darnton-Hill, I. Public Health Aspects in the Prevention and Control of Vitamin Deficiencies. Curr. Dev. Nutr. 2019, 3, nzz075. [Google Scholar] [CrossRef] [PubMed]
- Imdad, A.; Mayo-Wilson, E.; Haykal, M.R.; Regan, A.; Sidhu, J.; Smith, A.; Bhutta, Z.A. Vitamin A supplementation for preventing morbidity and mortality in children from six months to five years of age. Cochrane Database Syst. Rev. 2022, 3, Cd008524. [Google Scholar] [CrossRef]
- World Health Organization. Guideline: Vitamin A Supplementation in Infants and Children 6–59 Months of Age; World Health Organization: Geneva, Switzerland, 2011. [Google Scholar]
- Beaton, G.H.; Martorell, R.; Aronson, K.J.; Edmonston, B.; Ross, A.C.; Harvey, B.; McCabe, G. Effectiveness of vitamin A supplementation in the control of young child morbidity and mortality in developing countries. In Effectiveness of Vitamin A Supplementation in the Control of Young Child Morbidity and Mortality in Developing Countries; Canadian International Development Agency: Quebec, QC, Canada, 1993; p. 120. [Google Scholar]
- Palmer, A.C.; West, K.P., Jr.; Dalmiya, N.; Schultink, W. The use and interpretation of serum retinol distributions in evaluating the public health impact of vitamin A programmes. Public. Health Nutr. 2012, 15, 1201–1215. [Google Scholar] [CrossRef] [PubMed]
- Vilanova, C.S.; Hirakata, V.N.; de Souza Buriol, V.C.; Nunes, M.; Goldani, M.Z.; da Silva, C.H. The relationship between the different low birth weight strata of newborns with infant mortality and the influence of the main health determinants in the extreme south of Brazil. Population Health Metrics 2019, 17, 15. [Google Scholar] [CrossRef] [PubMed]
- Huang, J.; Chan, S.C.; Ngai, C.H.; Lok, V.; Zhang, L.; Lucero-Prisno, D.E., 3rd; Xu, W.; Zheng, Z.J.; Elcarte, E.; Withers, M.; et al. Global incidence, mortality and temporal trends of cancer in children: A joinpoint regression analysis. Cancer Med. 2023, 12, 1903–1911. [Google Scholar] [CrossRef] [PubMed]
- Song, P.; Adeloye, D.; Li, S.; Zhao, D.; Ye, X.; Pan, Q.; Qiu, Y.; Zhang, R.; Rudan, I. The prevalence of vitamin A deficiency and its public health significance in children in low- and middle-income countries: A systematic review and modelling analysis. J. Glob. Health 2023, 13, 04084. [Google Scholar] [CrossRef] [PubMed]
- Wirth, J.P.; Petry, N.; Tanumihardjo, S.A.; Rogers, L.M.; McLean, E.; Greig, A.; Garrett, G.S.; Klemm, R.D.; Rohner, F. Vitamin A Supplementation Programs and Country-Level Evidence of Vitamin A Deficiency. Nutrients 2017, 9, 190. [Google Scholar] [CrossRef] [PubMed]
- Mayo-Wilson, E.; Imdad, A.; Herzer, K.; Yakoob, M.Y.; Bhutta, Z.A. Vitamin A supplements for preventing mortality, illness, and blindness in children aged under 5: Systematic review and meta-analysis. BMJ 2011, 343, d5094. [Google Scholar] [CrossRef] [PubMed]
- Lin, K.; Chern, S.; Sun, J. Mapping the quality of prenatal and postnatal care and demographic differences on child mortality in 26 low to middle-income countries. World J. Pediatr. 2023, 19, 835–850. [Google Scholar] [CrossRef] [PubMed]
- Marjan, N.; Rahman, A.; Rois, R.; Rahman, A. Factors associated with coverage of vitamin a supplementation among Bangladeshi children: Mixed modelling approach. BMC Public. Health 2021, 21, 648. [Google Scholar] [CrossRef] [PubMed]
- Janmohamed, A.; Doledec, D.; Dissieka, R.; Jalloh, U.H.; Juneja, S.; Beye, M.; Ndiaye, F.; Jumbe, T.; Baker, M.M. Vitamin A supplementation coverage and associated factors for children aged 6 to 59 months in integrated and campaign-based delivery systems in four sub-Saharan African countries. BMC Public. Health 2024, 24, 1189. [Google Scholar] [CrossRef]
- Ahmed, F.; Azim, A.; Akhtaruzzaman, M. Vitamin A deficiency in poor, urban, lactating women in Bangladesh: Factors influencing vitamin A status. Public. Health Nutr. 2003, 6, 447–452. [Google Scholar] [CrossRef] [PubMed]
- World Health Organization. Medical Product Alert N 1/2021: Falsified Vitamin A; World Health Organization: Geneva, Switzerland, 2021. [Google Scholar]
- Zhao, T.; Liu, S.; Zhang, R.; Zhao, Z.; Yu, H.; Pu, L.; Wang, L.; Han, L. Global Burden of Vitamin A Deficiency in 204 Countries and Territories from 1990–2019. Nutrients 2022, 14, 950. [Google Scholar] [CrossRef] [PubMed]
- Cediel, G.; Olivares, M.; Brito, A.; Romaña, D.L.d.; Cori, H.; Frano, M.R.L. Interpretation of Serum Retinol Data From Latin America and the Caribbean. Food Nutr. Bull. 2015, 36, S98–S108. [Google Scholar] [CrossRef] [PubMed]
- Yang, H.; Xu, L.; Hou, L.; Xu, T.C.; Ye, S.H. Stability of vitamin A, E, C and thiamine during storage of different powdered enteral formulas. Heliyon 2022, 8, e11460. [Google Scholar] [CrossRef] [PubMed]
- Hombali, A.S.; Solon, J.A.; Venkatesh, B.T.; Nair, N.S.; Peña-Rosas, J.P. Fortification of staple foods with vitamin A for vitamin A deficiency. Cochrane Database Syst. Rev. 2019, 5, Cd010068. [Google Scholar] [CrossRef] [PubMed]
- Low, J.W.; Mwanga, R.O.M.; Andrade, M.; Carey, E.; Ball, A.M. Tackling vitamin A deficiency with biofortified sweetpotato in sub-Saharan Africa. Glob. Food Sec. 2017, 14, 23–30. [Google Scholar] [CrossRef] [PubMed]

| 1990 | 2021 | AAPC | 1990 | 2021 | AAPC | ||
|---|---|---|---|---|---|---|---|
| Rate | Rate | Number | Number | ||||
| DALYs (Disability-Adjusted Life Years) | |||||||
| Global | <5 years | 3035.82 | 310.85 | −0.89 (−1.01, −0.75) | 19,189,930.76 | 2,045,896.83 | −0.89 (−1.02, −0.73) |
| Global | 5–9 years | 89.78 | 41.51 | −0.53 (−0.61, −0.41) | 525,363.08 | 285,213.87 | −0.45 (−0.55, −0.31) |
| Global | 10–14 years | 55.5 | 27.54 | −0.51 (−0.6, −0.41) | 297,887.34 | 183,619.2 | −0.39 (−0.51, −0.26) |
| Global | 15–19 years | 4.55 | 3.94 | 0.11 (0, 0.22) | 23,647.31 | 24,613.78 | 0.34 (0.21, 0.46) |
| Global | <20 years | 881.29 | 96.34 | −0.88 (−1.08, −0.6) | 2,003,6828.5 | 2,539,343.67 | −0.86 (−1.09, −0.53) |
| Global | Age-standardized | 783.77 | 98.38 | - | - | - | - |
| High SDI | <5 years | 22.66 | 1.42 | −0.88 (−1.26, −0.42) | 13,060.2 | 767.16 | −0.89 (−1.23, −0.49) |
| High SDI | 5–9 years | 3.32 | 0.81 | −0.82 (−0.89, −0.72) | 1921.13 | 475.09 | −0.83 (−0.89, −0.74) |
| High SDI | 10–14 years | 1.43 | 0.49 | −0.8 (−0.88, −0.69) | 819.46 | 294.22 | −0.81 (−0.88, −0.7) |
| High SDI | 15–19 years | 0.04 | 0.08 | 0.18 (−0.1, 0.55) | 22.08 | 47.51 | 0.08 (−0.18, 0.42) |
| High SDI | <20 years | 6.76 | 0.68 | −0.85 (−0.91, −0.6) | 15,822.87 | 1583.98 | −0.86 (−0.92, −0.63) |
| High SDI | Age-standardized | 4.81 | 0.70 | - | - | - | - |
| High-middle SDI | <5 years | 218.74 | 12.43 | −0.93 (−1.35, −0.46) | 228,598.89 | 8704.19 | −0.95 (−1.27, −0.59) |
| High-middle SDI | 5–9 years | 25.99 | 6.13 | −0.73 (−0.8, −0.63) | 26,205.71 | 5049.85 | −0.75 (−0.82, −0.66) |
| High-middle SDI | 10–14 years | 15.37 | 3.9 | −0.71 (−0.79, −0.59) | 15,097.94 | 3055.52 | −0.75 (−0.81, −0.65) |
| High-middle SDI | 15–19 years | 1.69 | 1.39 | 0.22 (0.01, 0.47) | 1715.03 | 1009.01 | −0.08 (−0.24, 0.1) |
| High-middle SDI | <20 years | 67.02 | 5.87 | −0.9 (−1.82, −0.38) | 271,617.57 | 17,818.57 | −0.92 (−1.68, −0.49) |
| High-middle SDI | Age-standardized | 58.71 | 6.02 | - | - | - | - |
| Middle SDI | <5 years | 927.58 | 51.41 | −0.94 (−1.25, −0.83) | 1,899,988.42 | 90,794.97 | −0.95 (−1.22, −0.85) |
| Middle SDI | 5–9 years | 59.39 | 17.06 | −0.68 (−0.76, −0.57) | 115,182.08 | 33,628.33 | −0.68 (−0.76, −0.56) |
| Middle SDI | 10–14 years | 33.95 | 10.67 | −0.67 (−0.75, −0.56) | 619,95.21 | 20,615.7 | −0.65 (−0.74, −0.54) |
| Middle SDI | 15–19 years | 5.06 | 3.91 | 0.08 (−0.07, 0.23) | 9392.97 | 7121.89 | 0.05 (−0.09, 0.2) |
| Middle SDI | <20 years | 272.07 | 20.31 | −0.92 (−1.28, −0.43) | 2,086,558.69 | 152,160.89 | −0.92 (−1.27, −0.44) |
| Middle SDI | Age-standardized | 253.55 | 21.16 | - | - | - | - |
| Low-middle SDI | <5 years | 4372.66 | 202.27 | −0.95 (−1.06, −0.84) | 7,355,065.09 | 387,507.39 | −0.95 (−1.06, −0.83) |
| Low-middle SDI | 5–9 years | 136.66 | 47.23 | −0.65 (−0.75, −0.49) | 208,364.13 | 92,028.84 | −0.58 (−0.7, −0.38) |
| Low-middle SDI | 10–14 years | 90.83 | 30.2 | −0.67 (−0.77, −0.54) | 120,548.99 | 58,406.99 | −0.55 (−0.67, −0.36) |
| Low-middle SDI | 15–19 years | 6.69 | 4.89 | −0.15 (−0.26, −0.03) | 7835.06 | 9024.91 | 0.32 (0.15, 0.5) |
| Low-middle SDI | <20 years | 1348.04 | 71.56 | −0.94 (−1.12, −0.72) | 7,691,813.28 | 546,968.14 | −0.93 (−1.16, −0.64) |
| Low-middle SDI | Age-standardized | 1124.76 | 72.63 | - | - | - | - |
| Low SDI | <5 years | 10028.33 | 940.12 | −0.9 (−0.96, −0.81) | 9,684,889.81 | 1,556,610.34 | −0.82 (−0.92, −0.65) |
| Low SDI | 5–9 years | 217.54 | 100.22 | −0.55 (−0.63, −0.45) | 173,434.59 | 153,837.9 | −0.09 (−0.26, 0.11) |
| Low SDI | 10–14 years | 151.09 | 71.65 | −0.56 (−0.65, −0.45) | 99,291.35 | 101,133.55 | −0.01 (−0.2, 0.24) |
| Low SDI | 15–19 years | 8.75 | 5.96 | −0.18 (−0.27, −0.05) | 4670.96 | 7395.1 | 1.02 (0.78, 1.32) |
| Low SDI | <20 years | 3372.81 | 311.36 | −0.9 (−1.01, −0.76) | 9,962,286.7 | 1,818,976.89 | −0.8 (−1.02, −0.5) |
| Low SDI | Age-standardized | 2593.93 | 285.92 | - | - | - | - |
| Deaths | |||||||
| Global | <5 years | 32.83 | 2.64 | −0.91 (−0.95, −0.86) | 207,555.22 | 17,374.4 | −0.91 (−0.95, −0.85) |
| Global | 5–9 years | - | - | - | - | - | - |
| Global | 10–14 years | - | - | - | - | - | - |
| Global | 15–19 years | - | - | - | - | - | - |
| Global | <20 years | 9.13 | 0.66 | −0.92 (−0.96, −0.87) | 207,555.22 | 17,374.4 | −0.91 (−0.95, −0.85) |
| Global | Age-standardized | 7.87 | 0.68 | - | - | - | - |
| High SDI | <5 years | 0.2 | 0 | −0.96 (−0.99, −0.87) | 115.25 | 1.14 | −0.97 (−0.99, −0.89) |
| High SDI | 5–9 years | - | - | - | - | - | - |
| High SDI | 10–14 years | - | - | - | - | - | - |
| High SDI | 15–19 years | - | - | - | - | - | - |
| High SDI | <20 years | 0.05 | 0 | −0.96 (−0.99, −0.88) | 115.25 | 1.14 | −0.97 (−0.99, −0.89) |
| High SDI | Age-standardized | 0.01 | 0.001 | - | - | - | - |
| High-middle SDI | <5 years | 1.92 | 0.02 | −0.99 (−1, −0.98) | 2009.88 | 14.95 | −0.99 (−1, −0.98) |
| High-middle SDI | 5–9 years | - | - | - | - | - | - |
| High-middle SDI | 10–14 years | - | - | - | - | - | - |
| High-middle SDI | 15–19 years | - | - | - | - | - | - |
| High-middle SDI | <20 years | 0.5 | 0 | −0.99 (−1, −0.98) | 2009.88 | 14.95 | −0.99 (−1, −0.98) |
| High-middle SDI | Age-standardized | 0.43 | 0.001 | - | - | - | - |
| Middle SDI | <5 years | 9.34 | 0.26 | −0.97 (−0.99, −0.96) | 19,134.99 | 454.33 | −0.97 (−0.99, −0.96) |
| Middle SDI | 5–9 years | - | - | - | - | - | - |
| Middle SDI | 10–14 years | - | - | - | - | - | - |
| Middle SDI | 15–19 years | - | - | - | - | - | - |
| Middle SDI | <20 years | 2.5 | 0.06 | −0.97 (−0.99, −0.96) | 19,134.99 | 454.33 | −0.97 (−0.99, −0.96) |
| Middle SDI | Age-standardized | 2.27 | 0.07 | - | - | - | - |
| Low-middle SDI | <5 years | 47 | 1.36 | −0.97 (−0.99, −0.95) | 79,051.76 | 2604.91 | −0.97 (−0.99, −0.94) |
| Low-middle SDI | 5–9 years | - | - | - | - | - | - |
| Low-middle SDI | 10–14 years | - | - | - | - | - | - |
| Low-middle SDI | 15–19 years | - | - | - | - | - | - |
| Low-middle SDI | <20 years | 13.85 | 0.34 | −0.97 (−0.99, −0.95) | 79,051.76 | 2604.91 | −0.97 (−0.99, −0.94) |
| Low-middle SDI | Age-standardized | 11.14 | 0.35 | - | - | - | - |
| Low SDI | <5 years | 110.95 | 8.63 | −0.92 (−0.97, −0.85) | 107,153.79 | 14,285.59 | −0.85 (−0.94, −0.73) |
| Low SDI | 5–9 years | - | - | - | - | - | - |
| Low SDI | 10–14 years | - | - | - | - | - | - |
| Low SDI | 15–19 years | - | - | - | - | - | - |
| Low SDI | <20 years | 36.28 | 2.45 | −0.93 (−0.97, −0.87) | 107,153.79 | 14,285.59 | −0.85 (−0.94, −0.73) |
| Low SDI | Age-standardized | 26.96 | 2.23 | - | - | - | - |
| YLD (Years Lived with Disability) | |||||||
| Global | <5 years | 182.48 | 77.24 | −0.6 (−0.68, −0.39) | 1,153,473.83 | 508,371.76 | −0.58 (−0.66, −0.35) |
| Global | 5–9 years | 89.78 | 41.51 | −0.53 (−0.61, −0.41) | 525,363.08 | 285,213.87 | −0.45 (−0.55, −0.31) |
| Global | 10–14 years | 55.5 | 27.54 | −0.51 (−0.6, −0.41) | 297,887.34 | 183,619.2 | −0.39 (−0.51, −0.26) |
| Global | 15–19 years | 4.55 | 3.94 | 0.11 (0, 0.22) | 23,647.31 | 24,613.78 | 0.34 (0.21, 0.46) |
| Global | <20 years | 87.98 | 38.01 | −0.58 (−0.65, −0.47) | 2,000,371.57 | 1,001,818.6 | −0.51 (−0.59, −0.38) |
| Global | Age-standardized | 88.01 | 37.91 | - | - | - | - |
| High SDI | <5 years | 5.27 | 1.24 | −0.82 (−0.86, −0.77) | 3037.75 | 665.1 | −0.84 (−0.88, −0.8) |
| High SDI | 5–9 years | 3.32 | 0.81 | −0.82 (−0.89, −0.72) | 1921.13 | 475.09 | −0.83 (−0.89, −0.74) |
| High SDI | 10–14 years | 1.43 | 0.49 | −0.8 (−0.88, −0.69) | 819.46 | 294.22 | −0.81 (−0.88, −0.7) |
| High SDI | 15–19 years | 0.04 | 0.08 | 0.18 (−0.1, 0.55) | 22.08 | 47.51 | 0.08 (−0.18, 0.42) |
| High SDI | <20 years | 2.48 | 0.64 | −0.81 (−0.86, −0.77) | 5800.42 | 1481.91 | −0.83 (−0.87, −0.79) |
| High SDI | Age-standardized | 3.54 | 0.65 | - | - | - | - |
| High-middle SDI | <5 years | 51.31 | 10.53 | −0.76 (−0.82, −0.65) | 53,621.55 | 7374.79 | −0.82 (−0.86, −0.74) |
| High-middle SDI | 5–9 years | 25.99 | 6.13 | −0.73 (−0.8, −0.63) | 26,205.71 | 5049.85 | −0.75 (−0.82, −0.66) |
| High-middle SDI | 10–14 years | 15.37 | 3.9 | −0.71 (−0.79, −0.59) | 15,097.94 | 3055.52 | −0.75 (−0.81, −0.65) |
| High-middle SDI | 15–19 years | 1.69 | 1.39 | 0.22 (0.01, 0.47) | 1715.03 | 1009.01 | −0.08 (−0.24, 0.1) |
| High-middle SDI | <20 years | 23.85 | 5.44 | −0.73 (−0.78, −0.65) | 96,640.24 | 16,489.18 | −0.78 (−0.82, −0.72) |
| High-middle SDI | Age-standardized | 20.56 | 5.53 | - | - | - | - |
| Middle SDI | <5 years | 114.27 | 28.53 | −0.75 (−0.81, −0.6) | 234,064.01 | 50,395.72 | −0.78 (−0.83, −0.64) |
| Middle SDI | 5–9 years | 59.39 | 17.06 | −0.68 (−0.76, −0.57) | 115,182.08 | 33,628.33 | −0.68 (−0.76, −0.56) |
| Middle SDI | 10–14 years | 33.95 | 10.67 | −0.67 (−0.75, −0.56) | 61,995.21 | 20,615.7 | −0.65 (−0.74, −0.54) |
| Middle SDI | 15–19 years | 5.06 | 3.91 | 0.08 (−0.07, 0.23) | 9392.97 | 7121.89 | 0.05 (−0.09, 0.2) |
| Middle SDI | <20 years | 54.85 | 14.92 | −0.71 (−0.77, −0.63) | 420,634.28 | 111,761.64 | −0.72 (−0.77, −0.64) |
| Middle SDI | Age-standardized | 52.51 | 15.24 | - | - | - | - |
| Low-middle SDI | <5 years | 287.47 | 81.55 | −0.74 (−0.79, −0.6) | 483,542.87 | 156,227.62 | −0.71 (−0.77, −0.56) |
| Low-middle SDI | 5–9 years | 136.66 | 47.23 | −0.65 (−0.75, −0.49) | 208,364.13 | 92,028.84 | −0.58 (−0.7, −0.38) |
| Low-middle SDI | 10–14 years | 90.83 | 30.2 | −0.67 (−0.77, −0.54) | 120,548.99 | 58,406.99 | −0.55 (−0.67, −0.36) |
| Low-middle SDI | 15–19 years | 6.69 | 4.89 | −0.15 (−0.26, −0.03) | 7835.06 | 9024.91 | 0.32 (0.15, 0.5) |
| Low-middle SDI | <20 years | 143.76 | 41.3 | −0.73 (−0.78, −0.65) | 820,291.06 | 315,688.36 | −0.64 (−0.71, −0.54) |
| Low-middle SDI | Age-standardized | 139.48 | 41.38 | - | - | - | - |
| Low SDI | <5 years | 392.1 | 177.2 | −0.59 (−0.67, −0.33) | 378,676.48 | 293,391.14 | −0.26 (−0.4, 0.22) |
| Low SDI | 5–9 years | 217.54 | 100.22 | −0.55 (−0.63, −0.45) | 173,434.59 | 153,837.9 | −0.09 (−0.26, 0.11) |
| Low SDI | 10–14 years | 151.09 | 71.65 | −0.56 (−0.65, −0.45) | 99,291.35 | 101,133.55 | −0.01 (−0.2, 0.24) |
| Low SDI | 15–19 years | 8.75 | 5.96 | −0.18 (−0.27, −0.05) | 4670.96 | 7395.1 | 1.02 (0.78, 1.32) |
| Low SDI | <20 years | 222.12 | 95.13 | −0.6 (−0.66, −0.49) | 656,073.38 | 555,757.69 | −0.17 (−0.3, 0.06) |
| Low SDI | Age-standardized | 212.20 | 89.46 | - | - | - | - |
| 1990 | 2021 | AAPC | 1990 | 2021 | AAPC | ||
|---|---|---|---|---|---|---|---|
| Rate | Rate | Number | Number | ||||
| DALYs (Disability-Adjusted Life Years) | |||||||
| Andean Latin America | <5 years | 512.72 | 36.8 | −0.94 (−1.46, −0.58) | 27,925.53 | 2265.25 | −0.93 (−1.54, −0.51) |
| Andean Latin America | 5–9 years | 60.89 | 20.1 | −0.63 (−0.81, −0.11) | 3028.29 | 1224.61 | −0.54 (−0.76, 0.1) |
| Andean Latin America | 10–14 years | 33.73 | 10.69 | −0.6 (−0.77, −0.35) | 1559.76 | 624.99 | −0.5 (−0.7, −0.17) |
| Andean Latin America | 15–19 years | 5.77 | 4.44 | −0.07 (−0.43, 0.56) | 235.99 | 247.59 | 0.26 (−0.23, 1.13) |
| Andean Latin America | <20 years | 171.14 | 18.43 | −0.9 (−1.51, 0.12) | 32,749.57 | 4362.43 | −0.87 (−1.64, 0.4) |
| Andean Latin America | Age-standardized | 171.56 | 18.144 | - | - | - | - |
| Australasia | <5 years | 0.68 | 0.1 | −0.74 (−0.89, −0.39) | 10.52 | 1.8 | −0.69 (−0.87, −0.28) |
| Australasia | 5–9 years | 0.36 | 0.05 | −0.73 (−0.96, 1.19) | 5.47 | 0.92 | −0.65 (−0.95, 1.8) |
| Australasia | 10–14 years | 0.07 | 0.02 | −0.67 (−0.88, −0.08) | 1.12 | 0.36 | −0.58 (−0.84, 0.19) |
| Australasia | 15–19 years | 0 | 0 | - | 0 | 0 | - |
| Australasia | <20 years | 0.27 | 0.04 | −0.72 (−0.88, −0.31) | 17.12 | 3.08 | −0.67 (−0.85, −0.18) |
| Australasia | Age-standardized | 0.16 | 0.04 | - | - | - | |
| Caribbean | <5 years | 1052.15 | 366.3 | −0.75 (−1.05, −0.63) | 43,549.29 | 14,169.11 | −0.77 (−1.04, −0.66) |
| Caribbean | 5–9 years | 52.06 | 55.14 | −0.2 (−0.63,0.78) | 1939.76 | 2125.92 | −0.17 (−0.62, 0.84) |
| Caribbean | 10–14 years | 32.51 | 33.94 | −0.23 (−0.62, 0.79) | 1153.62 | 1283.47 | −0.18 (−0.6, 0.9) |
| Caribbean | 15–19 years | 2.67 | 5.5 | 0.29 (−0.04, 0.73) | 98.14 | 206.66 | 0.32 (−0.02, 0.77) |
| Caribbean | <20 years | 309.78 | 116.53 | −0.73 (−1.28, −0.42) | 46,740.81 | 17,785.16 | −0.73 (−1.28, −0.42) |
| Caribbean | Age-standardized | 412.92 | 118.23 | - | - | - | - |
| Central Asia | <5 years | 310.86 | 61.11 | −0.84 (−1.81, −0.32) | 29,467.58 | 6109.18 | −0.83 (−1.85, −0.29) |
| Central Asia | 5–9 years | 34.66 | 25.39 | −0.55 (−0.78, −0.05) | 2855.12 | 2394.32 | −0.48 (−0.74, 0.09) |
| Central Asia | 10–14 years | 20.79 | 13.5 | −0.51 (−0.71, −0.19) | 1505.18 | 1114.04 | −0.44 (−0.67, −0.08) |
| Central Asia | 15–19 years | 3.16 | 3.02 | 0.08 (−0.3, 0.77) | 207.95 | 209.53 | 0.14 (−0.26, 0.86) |
| Central Asia | <20 years | 107.91 | 28.38 | −0.79 (−1.5, 0.25) | 34,035.82 | 9827.06 | −0.77 (−1.55, 0.37) |
| Central Asia | Age-standardized | 118.34 | 26.23 | - | - | - | - |
| Central Europe | <5 years | 104.62 | 20.45 | −0.85 (−1.62, −0.25) | 9346.6 | 1142.44 | −0.91 (−1.38, −0.54) |
| Central Europe | 5–9 years | 34.18 | 10.76 | −0.78 (−0.85, −0.65) | 3303.5 | 627.4 | −0.87 (−0.91, −0.79) |
| Central Europe | 10–14 years | 18.49 | 7.29 | −0.74 (−0.82, −0.62) | 1912.88 | 458.14 | −0.84 (−0.89, −0.77) |
| Central Europe | 15–19 years | 0 | 0 | - | 0 | 0 | - |
| Central Europe | <20 years | 37.77 | 9.46 | −0.81 (−0.88, −0.29) | 14,562.97 | 2227.97 | −0.89 (−0.93, −0.57) |
| Central Europe | Age-standardized | 53.43 | 9.81 | - | - | - | - |
| Central Latin America | <5 years | 537.8 | 39.35 | −0.95 (−1.14, −0.82) | 123,125.25 | 7904.76 | −0.95 (−1.12, −0.84) |
| Central Latin America | 5–9 years | 45.31 | 11.01 | −0.67 (−0.78, −0.53) | 9568.59 | 2367.41 | −0.66 (−0.77, −0.52) |
| Central Latin America | 10–14 years | 19.79 | 5.43 | −0.6 (−0.72, −0.44) | 3975.41 | 1188.47 | −0.57 (−0.7, −0.39) |
| Central Latin America | 15–19 years | 5.43 | 2.1 | −0.12 (−0.26, 0.03) | 987.91 | 458.6 | 0.05 (−0.11, 0.23) |
| Central Latin America | <20 years | 167.28 | 13.98 | −0.94 (−1.3, −0.63) | 137,657.16 | 11,919.24 | −0.93 (−1.31, −0.62) |
| Central Latin America | Age-standardized | 204.57 | 14.78 | - | - | - | - |
| Central Sub-Saharan Africa | <5 years | 8326.26 | 484.01 | −0.92 (−1.03, −0.86) | 895,069.5 | 101,964.93 | −0.85 (−1.07, −0.72) |
| Central Sub-Saharan Africa | 5–9 years | 221.2 | 87.38 | −0.45 (−0.66, −0.12) | 18,371.54 | 17,407.03 | 0.33 (−0.16, 1.14) |
| Central Sub-Saharan Africa | 10–14 years | 158 | 87.63 | −0.44 (−0.66, −0.05) | 10,708.39 | 15,505.5 | 0.46 (−0.11, 1.48) |
| Central Sub-Saharan Africa | 15–19 years | 10.04 | 9.72 | −0.17 (−0.4, 0.14) | 570.68 | 1446.6 | 1.16 (0.56, 1.98) |
| Central Sub-Saharan Africa | <20 years | 2934 | 185.32 | −0.92 (−1.14, −0.75) | 924,720.11 | 136,324.06 | −0.8 (−1.34, −0.41) |
| Central Sub-Saharan Africa | Age-standardized | 1730.88 | 170.06 | - | - | - | - |
| East Asia | <5 years | 366.4 | 11.91 | −0.96 (−1.36, −0.72) | 439,064.34 | 9540.66 | −0.97 (−1.25, −0.81) |
| East Asia | 5–9 years | 28.47 | 6.57 | −0.76 (−0.85, −0.62) | 30,904.2 | 6461.42 | −0.78 (−0.86, −0.65) |
| East Asia | 10–14 years | 20.65 | 4.54 | −0.77 (−0.86, −0.61) | 22,008.98 | 4034.04 | −0.81 (−0.88, −0.68) |
| East Asia | 15–19 years | 2.59 | 2.59 | 0.17 (−0.09, 0.5) | 3382.96 | 2009.07 | −0.3 (−0.46, −0.1) |
| East Asia | <20 years | 106.42 | 6.39 | −0.93 (−1.41, −0.25) | 495,360.48 | 22,045.18 | −0.94 (−1.31, −0.44) |
| East Asia | Age-standardized | 88.88 | 6.49 | - | - | - | - |
| Eastern Europe | <5 years | 3.28 | 0.59 | −0.88 (−1.44, 0.41) | 565.26 | 59.44 | −0.93 (−1.26, −0.17) |
| Eastern Europe | 5–9 years | 1.06 | 0.28 | −0.78 (−0.89, −0.58) | 188.85 | 36.46 | −0.84 (−0.92, −0.7) |
| Eastern Europe | 10–14 years | 0.54 | 0.23 | −0.76 (−0.88, −0.54) | 88.55 | 28.79 | −0.82 (−0.91, −0.65) |
| Eastern Europe | 15–19 years | 0 | 0 | - | 0 | 0 | - |
| Eastern Europe | <20 years | 1.25 | 0.27 | −0.85 (−0.93, −0.38) | 842.65 | 124.69 | −0.9 (−0.95, −0.57) |
| Eastern Europe | Age-standardized | 1.80 | 0.28 | - | - | - | - |
| Eastern Sub-Saharan Africa | <5 years | 10505.72 | 978.72 | −0.9 (−0.96, −0.81) | 3,784,149.05 | 624,388.23 | −0.82 (−0.93, −0.66) |
| Eastern Sub-Saharan Africa | 5–9 years | 210.32 | 96.66 | −0.57 (−0.67, −0.45) | 61,639.15 | 57,479.34 | −0.13 (−0.32, 0.11) |
| Eastern Sub-Saharan Africa | 10–14 years | 146.42 | 60.8 | −0.59 (−0.68, −0.48) | 36,665.31 | 33,544.32 | −0.1 (−0.3, 0.14) |
| Eastern Sub-Saharan Africa | 15–19 years | 8.46 | 6.13 | −0.16 (−0.29, 0.01) | 1714.69 | 3015.42 | 1.04 (0.73, 1.43) |
| Eastern Sub-Saharan Africa | <20 years | 3510.89 | 315.67 | −0.9 (−1, −0.76) | 3,884,168.2 | 718,427.31 | −0.8 (−1, −0.5) |
| Eastern Sub-Saharan Africa | Age-standardized | 2582.32 | 293.25 | - | - | - | - |
| High-income Asia Pacific | <5 years | 6.12 | 0.77 | −0.83 (−1.04, −0.63) | 627.68 | 49.64 | −0.89 (−1.03, −0.77) |
| High-income Asia Pacific | 5–9 years | 4.21 | 0.2 | −0.84 (−0.93, −0.59) | 501.23 | 15.36 | −0.89 (−0.96, −0.73) |
| High-income Asia Pacific | 10–14 years | 2.42 | 0.15 | −0.8 (−0.92, −0.51) | 316.52 | 12.07 | −0.88 (−0.95, −0.7) |
| High-income Asia Pacific | 15–19 years | 0 | 0 | - | 0 | 0 | - |
| High-income Asia Pacific | <20 years | 2.87 | 0.25 | −0.82 (−0.91, −0.7) | 1445.43 | 77.06 | −0.89 (−0.94, −0.81) |
| High-income Asia Pacific | Age-standardized | 1.66 | 0.29 | - | - | - | - |
| High-income North America | <5 years | 1.53 | 0.32 | −0.74 (−1.29, 0.26) | 328.98 | 66.17 | −0.75 (−1.27, 0.19) |
| High-income North America | 5–9 years | 1.6 | 0.22 | −0.7 (−0.86, −0.32) | 328.18 | 49.17 | −0.68 (−0.85, −0.27) |
| High-income North America | 10–14 years | 0.41 | 0.14 | −0.49 (−0.79, 0.36) | 78.65 | 31.56 | −0.39 (−0.75, 0.62) |
| High-income North America | 15–19 years | 0 | 0 | - | 0 | 0 | - |
| High-income North America | <20 years | 0.9 | 0.16 | −0.72 (−0.82, −0.37) | 735.8 | 146.9 | −0.69 (−0.8, −0.31) |
| High-income North America | Age-standardized | 0.58 | 0.17 | - | - | - | - |
| North Africa and Middle East | <5 years | 2288.07 | 173.75 | −0.9 (−1.07, −0.72) | 1,220,495.35 | 106,226.65 | −0.88 (−1.08, −0.67) |
| North Africa and Middle East | 5–9 years | 53.23 | 19.49 | −0.6 (−0.71, −0.46) | 25,554.22 | 12,318.68 | −0.47 (−0.61, −0.28) |
| North Africa and Middle East | 10–14 years | 28.22 | 13.17 | −0.59 (−0.68, −0.47) | 11,958.69 | 7768.47 | −0.42 (−0.55, −0.25) |
| North Africa and Middle East | 15–19 years | 3.02 | 4.35 | 0.11 (−0.14, 0.36) | 1103.41 | 2312.9 | 0.62 (0.26, 0.99) |
| North Africa and Middle East | <20 years | 698.36 | 54.39 | −0.9 (−1.18, −0.65) | 1,259,111.68 | 128,626.69 | −0.86 (−1.24, −0.53) |
| North Africa and Middle East | Age-standardized | 474.74 | 54.04 | - | - | - | - |
| Oceania | <5 years | 1785.76 | 327.31 | −0.82 (−0.93, −0.68) | 17,556.94 | 6331.61 | −0.66 (−0.87, −0.38) |
| Oceania | 5–9 years | 79.24 | 43.21 | −0.41 (−0.68, 0.13) | 684.04 | 720.55 | 0.12 (−0.4, 1.14) |
| Oceania | 10–14 years | 46.49 | 23.56 | −0.47 (−0.7, −0.02) | 363.21 | 348.41 | −0.01 (−0.43, 0.83) |
| Oceania | 15–19 years | 2.59 | 1.51 | −0.23 (−0.46, 0.16) | 17.71 | 19.71 | 0.47 (0.03, 1.2) |
| Oceania | <20 years | 562.56 | 116.19 | −0.8 (−1.04, −0.49) | 18,621.91 | 7420.29 | −0.62 (−1.07, −0.04) |
| Oceania | Age-standardized | 506.95 | 101.69 | - | - | - | - |
| South Asia | <5 years | 3785.97 | 202.9 | −0.95 (−1.07, −0.76) | 6,124,618.99 | 321,792.25 | −0.95 (−1.07, −0.76) |
| South Asia | 5–9 years | 136.39 | 52.35 | −0.64 (−0.79, −0.36) | 204,711.37 | 89,163.06 | −0.58 (−0.76, −0.27) |
| South Asia | 10–14 years | 98.23 | 33.35 | −0.69 (−0.81, −0.49) | 124,864.8 | 59,403.94 | −0.56 (−0.73, −0.28) |
| South Asia | 15–19 years | 8 | 5.13 | −0.17 (−0.31, −0.04) | 8723.81 | 9058.32 | 0.34 (0.12, 0.55) |
| South Asia | <20 years | 1179.24 | 70.14 | −0.94 (−1.16, −0.68) | 6,462,918.98 | 479,417.57 | −0.93 (−1.2, −0.59) |
| South Asia | Age-standardized | 1138.23 | 74.89 | - | - | - | - |
| Southeast Asia | <5 years | 2725.84 | 102.77 | −0.96 (−1.05, −0.88) | 1,621,433.36 | 57,844.29 | −0.96 (−1.05, −0.89) |
| Southeast Asia | 5–9 years | 113.02 | 22.08 | −0.77 (−0.85, −0.65) | 65,719.61 | 12,867.82 | −0.77 (−0.85, −0.65) |
| Southeast Asia | 10–14 years | 54.36 | 12.9 | −0.71 (−0.79, −0.6) | 29,677.21 | 7492.37 | −0.7 (−0.78, −0.57) |
| Southeast Asia | 15–19 years | 7.52 | 3.38 | −0.09 (−0.21, 0.03) | 3690.8 | 1911 | 0.05 (−0.09, 0.19) |
| Southeast Asia | <20 years | 777.51 | 34.94 | −0.95 (−1.08, −0.78) | 1,720,520.98 | 80,115.48 | −0.95 (−1.09, −0.77) |
| Southeast Asia | Age-standardized | 746.24 | 36.18 | - | - | - | - |
| Southern Latin America | <5 years | 111.15 | 21.19 | −0.82 (−2.01, 0.41) | 5734.42 | 906.53 | −0.85 (−1.84, 0.17) |
| Southern Latin America | 5–9 years | 22.85 | 6.29 | −0.72 (−0.94, 0.64) | 1140.45 | 324.23 | −0.71 (−0.94, 0.7) |
| Southern Latin America | 10–14 years | 11.68 | 3.1 | −0.69 (−0.89, −0.22) | 558.27 | 156.84 | −0.67 (−0.89, −0.18) |
| Southern Latin America | 15–19 years | 0 | 0 | - | 0 | 0 | - |
| Southern Latin America | <20 years | 38.37 | 7.11 | −0.82 (−2.13, 0.03) | 7433.14 | 1387.6 | −0.82 (−2.14, 0.04) |
| Southern Latin America | Age-standardized | 38.13 | 7.56 | - | - | - | - |
| Southern Sub-Saharan Africa | <5 years | 2206.68 | 390.7 | −0.84 (−0.96, −0.79) | 158,305.05 | 31,369.63 | −0.83 (−0.95, −0.78) |
| Southern Sub-Saharan Africa | 5–9 years | 89.69 | 51.47 | −0.53 (−0.73, −0.17) | 6107.43 | 4197.96 | −0.44 (−0.67, −0.02) |
| Southern Sub-Saharan Africa | 10–14 years | 49.43 | 29.29 | −0.52 (−0.72, −0.14) | 3159.54 | 2308.4 | −0.41 (−0.65, 0.07) |
| Southern Sub-Saharan Africa | 15–19 years | 7.13 | 4 | −0.14 (−0.37, 0.13) | 416.02 | 287.63 | 0.07 (−0.22, 0.41) |
| Southern Sub-Saharan Africa | <20 years | 640.98 | 122.07 | −0.83 (−1.13, −0.54) | 167,988.04 | 38,163.63 | −0.8 (−1.15, −0.45) |
| Southern Sub-Saharan Africa | Age-standardized | 667.92 | 121.80 | - | - | - | - |
| Tropical Latin America | <5 years | 903.04 | 45.73 | −0.95 (−1.27, −0.82) | 158,531.35 | 7868.89 | −0.95 (−1.27, −0.82) |
| Tropical Latin America | 5–9 years | 80.15 | 31.5 | −0.64 (−0.83, −0.25) | 14,915.83 | 5262.44 | −0.68 (−0.85, −0.33) |
| Tropical Latin America | 10–14 years | 50.19 | 20.08 | −0.65 (−0.8, −0.35) | 8923.55 | 3268.81 | −0.68 (−0.82, −0.41) |
| Tropical Latin America | 15–19 years | 4.88 | 4.55 | −0.13 (−0.28, 0.05) | 764.98 | 745.43 | −0.09 (−0.25, 0.1) |
| Tropical Latin America | <20 years | 263 | 25.75 | −0.91 (−1.72, −0.35) | 183,135.7 | 17,145.55 | −0.91 (−1.69, −0.37) |
| Tropical Latin America | Age-standardized | 299.33 | 25.73 | - | - | - | - |
| Western Europe | <5 years | 5.44 | 1.52 | −0.68 (−1.34, −0.45) | 1248.37 | 321.91 | −0.71 (−1.31, −0.49) |
| Western Europe | 5–9 years | 3.43 | 0.57 | −0.76 (−0.85, −0.61) | 807.8 | 130.84 | −0.77 (−0.86, −0.62) |
| Western Europe | 10–14 years | 0.8 | 0.17 | −0.8 (−0.87, −0.68) | 195.57 | 41.51 | −0.8 (−0.87, −0.69) |
| Western Europe | 15–19 years | 0 | 0 | - | 0 | 0 | - |
| Western Europe | <20 years | 2.29 | 0.54 | −0.72 (−0.91, −0.61) | 2251.73 | 494.25 | −0.74 (−0.91, −0.64) |
| Western Europe | Age-standardized | 1.99 | 0.49 | - | - | - | - |
| Western Sub-Saharan Africa | <5 years | 12695.24 | 932.46 | −0.91 (−0.95, −0.85) | 4,528,777.36 | 745,573.47 | −0.8 (−0.88, −0.66) |
| Western Sub-Saharan Africa | 5–9 years | 255.81 | 97.89 | −0.56 (−0.65, −0.45) | 73,088.46 | 70,038.97 | 0.11 (−0.11, 0.37) |
| Western Sub-Saharan Africa | 10–14 years | 162.1 | 71.15 | −0.53 (−0.63, −0.42) | 38,212.13 | 45,004.7 | 0.25 (0, 0.56) |
| Western Sub-Saharan Africa | 15–19 years | 8.87 | 4.99 | −0.26 (−0.37, −0.12) | 1732.27 | 2685.31 | 1.03 (0.74, 1.41) |
| Western Sub-Saharan Africa | <20 years | 4324.36 | 321.44 | −0.91 (−0.97, −0.78) | 4,641,810.22 | 863,302.46 | −0.77 (−0.94, −0.44) |
| Western Sub-Saharan Africa | Age-standardized | 2780.72 | 284.27 | - | - | - | - |
| Deaths | |||||||
| Andean Latin America | <5 years | 4.8 | 0.13 | −0.98 (−0.99, −0.97) | 261.44 | 8.12 | −0.97 (−0.98, −0.96) |
| Andean Latin America | <20 years | 1.37 | 0.03 | −0.98 (−0.99, −0.97) | 261.44 | 8.12 | −0.97 (−0.98, −0.96) |
| Andean Latin America | Age-standardized | 1.40 | 0.03 | - | - | - | - |
| Australasia | <5 years | 0 | 0 | −0.77 (−0.86, −0.64) | 0 | 0 | −0.73 (−0.84, −0.57) |
| Australasia | <20 years | 0 | 0 | −0.78 (−0.86, −0.64) | 0 | 0 | −0.73 (−0.84, −0.57) |
| Australasia | Age-standardized | 0 | 0 | - | - | - | - |
| Caribbean | <5 years | 10.99 | 3.42 | −0.78 (−0.91, −0.72) | 454.74 | 132.11 | −0.8 (−0.91, −0.74) |
| Caribbean | <20 years | 3.01 | 0.87 | −0.8 (−0.91, −0.74) | 454.74 | 132.11 | −0.8 (−0.91, −0.74) |
| Caribbean | Age-standardized | 4.04 | 0.88 | - | - | - | - |
| Central Asia | <5 years | 2.69 | 0.34 | −0.9 (−0.94, −0.86) | 255.3 | 34.19 | −0.89 (−0.94, −0.85) |
| Central Asia | <20 years | 0.81 | 0.1 | −0.9 (−0.94, −0.86) | 255.3 | 34.19 | −0.89 (−0.94, −0.85) |
| Central Asia | Age-standardized | 0.87 | 0.09 | - | - | - | - |
| Central Europe | <5 years | 0.53 | 0.05 | −0.93 (−1.01, −0.84) | 47.71 | 2.82 | −0.95 (−1, −0.9) |
| Central Europe | <20 years | 0.12 | 0.01 | −0.92 (−1.01, −0.84) | 47.71 | 2.82 | −0.95 (−1, −0.9) |
| Central Europe | Age-standardized | 0.18 | 0.01 | - | - | - | - |
| Central Latin America | <5 years | 5.32 | 0.24 | −0.97 (−0.98, −0.96) | 1217.69 | 48.44 | −0.97 (−0.99, −0.97) |
| Central Latin America | <20 years | 1.48 | 0.06 | −0.97 (−0.99, −0.97) | 1217.69 | 48.44 | −0.97 (−0.99, −0.97) |
| Central Latin America | Age-standardized | 1.97 | 0.06 | - | - | - | - |
| Central Sub-Saharan Africa | <5 years | 91.4 | 3.36 | −0.95 (−0.98, −0.86) | 9825.86 | 707.38 | −0.9 (−0.97, −0.73) |
| Central Sub-Saharan Africa | <20 years | 31.18 | 0.96 | −0.96 (−0.99, −0.88) | 9825.86 | 707.38 | −0.9 (−0.97, −0.73) |
| Central Sub-Saharan Africa | Age-standardized | 17.59 | 0.87 | - | - | - | - |
| East Asia | <5 years | 3.57 | 0.01 | −1 (−1, −1) | 4274.36 | 7.95 | −1 (−1, −1) |
| East Asia | <20 years | 0.92 | 0 | −1 (−1, - 1) | 4274.36 | 7.95 | −1 (−1, −1) |
| East Asia | Age-standardized | 0.69 | 0.00 | - | - | - | - |
| Eastern Europe | <5 years | 0.01 | 0 | −0.97 (−0.98, −0.96) | 1.73 | 0.05 | −0.98 (−0.99, −0.98) |
| Eastern Europe | <20 years | 0 | 0 | −0.98 (−0.98, −0.97) | 1.73 | 0.05 | −0.98 (−0.99, −0.98) |
| Eastern Europe | Age-standardized | 0 | 0 | - | - | - | - |
| Eastern Sub-Saharan Africa | <5 years | 116.65 | 9.4 | −0.91 (−0.97, −0.84) | 42,015.64 | 5994.17 | −0.84 (−0.94, −0.71) |
| Eastern Sub-Saharan Africa | <20 years | 37.98 | 2.63 | −0.92 (−0.97, −0.86) | 42,015.64 | 5994.17 | −0.84 (−0.94, −0.71) |
| Eastern Sub-Saharan Africa | Age-standardized | 27.02 | 2.43 | - | - | - | - |
| High-income Asia Pacific | <5 years | 0.01 | 0 | −0.94 (−0.96, −0.86) | 0.97 | 0.06 | −0.96 (−0.98, −0.91) |
| High-income Asia Pacific | <20 years | 0 | 0 | −0.93 (−0.96, −0.85) | 0.97 | 0.06 | −0.96 (−0.98, −0.91) |
| High-income Asia Pacific | Age-standardized | 0 | 0 | - | - | - | - |
| High-income North America | <5 years | 0 | 0 | −0.75 (−0.87, −0.53) | 0.24 | 0.18 | −0.76 (−0.88, −0.56) |
| High-income North America | <20 years | 0 | 0 | −0.78 (−0.89, −0.6) | 0.24 | 0.18 | −0.76 (−0.88, −0.56) |
| High-income North America | Age-standardized | 0 | 0 | - | - | - | - |
| North Africa and Middle East | <5 years | 24.78 | 1.45 | −0.92 (−0.97, −0.89) | 13,219.21 | 885.63 | −0.91 (−0.96, −0.86) |
| North Africa and Middle East | <20 years | 7.33 | 0.37 | −0.93 (−0.97, −0.9) | 13,219.21 | 885.63 | −0.91 (−0.96, −0.86) |
| North Africa and Middle East | Age-standardized | 4.76 | 0.37 | - | - | - | - |
| Oceania | <5 years | 18.71 | 2.67 | −0.86 (−1.01, −0.62) | 183.92 | 51.68 | −0.73 (−1.01, −0.27) |
| Oceania | <20 years | 5.56 | 0.81 | −0.86 (−1.01, −0.61) | 183.92 | 51.68 | −0.73 (−1.01, −0.27) |
| Oceania | Age-standardized | 4.90 | 0.69 | - | - | - | - |
| South Asia | <5 years | 39.96 | 1.15 | −0.97 (−1, −0.95) | 64,647.38 | 1822.22 | −0.97 (−1, −0.95) |
| South Asia | <20 years | 11.8 | 0.27 | −0.98 (−1, −0.96) | 64,647.38 | 1822.22 | −0.97 (−1, −0.95) |
| South Asia | Age-standardized | 11.09 | 0.30 | - | - | - | - |
| Southeast Asia | <5 years | 28.83 | 0.66 | −0.98 (−0.99, −0.95) | 17,150.46 | 373.21 | −0.98 (−0.99, −0.95) |
| Southeast Asia | <20 years | 7.75 | 0.16 | −0.98 (−0.99, −0.95) | 17,150.46 | 373.21 | −0.98 (−0.99, −0.95) |
| Southeast Asia | Age-standardized | 7.34 | 0.17 | - | - | - | - |
| Southern Latin America | <5 years | 0.42 | 0.03 | −0.95 (−0.97, −0.93) | 21.91 | 1.27 | −0.96 (−0.97, −0.94) |
| Southern Latin America | <20 years | 0.11 | 0.01 | −0.96 (−0.97, −0.94) | 21.91 | 1.27 | −0.96 (−0.97, −0.94) |
| Southern Latin America | Age-standardized | 0.16 | 0.01 | - | - | - | - |
| Southern Sub-Saharan Africa | <5 years | 23.63 | 3.62 | −0.86 (−0.95, −0.77) | 1695.34 | 290.7 | −0.85 (−0.94, −0.75) |
| Southern Sub-Saharan Africa | <20 years | 6.47 | 0.93 | −0.87 (−0.95, −0.79) | 1695.34 | 290.7 | −0.85 (−0.94, −0.75) |
| Southern Sub-Saharan Africa | Age-standardized | 6.54 | 0.94 | - | - | - | - |
| Tropical Latin America | <5 years | 9.13 | 0.11 | −0.99 (−0.99, −0.99) | 1602.49 | 18.82 | −0.99 (−0.99, −0.99) |
| Tropical Latin America | <20 years | 2.3 | 0.03 | −0.99 (−0.99, −0.98) | 1602.49 | 18.82 | −0.99 (−0.99, −0.99) |
| Tropical Latin America | Age-standardized | 2.61 | 0.03 | - | - | - | - |
| Western Europe | <5 years | 0 | 0 | −0.73 (−0.83, −0.65) | 0.77 | 0.34 | −0.75 (−0.85, −0.67) |
| Western Europe | <20 years | 0 | 0 | −0.74 (−0.84, −0.65) | 0.77 | 0.34 | −0.75 (−0.85, −0.67) |
| Western Europe | Age-standardized | 0 | 0 | - | - | - | - |
| Western Sub-Saharan Africa | <5 years | 142.06 | 8.75 | −0.92 (−0.98, −0.83) | 50,678.07 | 6995.06 | −0.83 (−0.96, −0.62) |
| Western Sub-Saharan Africa | <20 years | 47.21 | 2.6 | −0.93 (−0.98, −0.85) | 50,678.07 | 6995.06 | −0.83 (−0.96, −0.62) |
| Western Sub-Saharan Africa | Age-standardized | 29.30 | 2.26 | - | - | - | - |
| YLD (Years Lived with Disability) | |||||||
| Andean Latin America | <5 years | 93.69 | 25.08 | −0.75 (−0.85, −0.35) | 5102.94 | 1544.09 | −0.71 (−0.83, −0.24) |
| Andean Latin America | 5–9 years | 60.89 | 20.1 | −0.63 (−0.81, −0.11) | 3028.29 | 1224.61 | −0.54 (−0.76, 0.1) |
| Andean Latin America | 10–14 years | 33.73 | 10.69 | −0.6 (−0.77, −0.35) | 1559.76 | 624.99 | −0.5 (−0.7, −0.17) |
| Andean Latin America | 15–19 years | 5.77 | 4.44 | −0.07 (−0.43, 0.56) | 235.99 | 247.59 | 0.26 (−0.23, 1.13) |
| Andean Latin America | <20 years | 51.88 | 15.38 | −0.69 (−0.79, −0.47) | 9926.98 | 3641.27 | −0.61 (−0.74, −0.34) |
| Andean Latin America | Age-standardized | 47.74 | 15.11 | - | - | - | - |
| Australasia | <5 years | 0.67 | 0.09 | −0.73 (−0.88, −0.37) | 10.28 | 1.58 | −0.68 (−0.86, −0.26) |
| Australasia | 5–9 years | 0.36 | 0.05 | −0.73 (−0.96, 1.19) | 5.47 | 0.92 | −0.65 (−0.95, 1.8) |
| Australasia | 10–14 years | 0.07 | 0.02 | −0.67 (−0.88, −0.08) | 1.12 | 0.36 | −0.58 (−0.84, 0.19) |
| Australasia | 15–19 years | 0 | 0 | - | 0 | 0 | - |
| Australasia | <20 years | 0.27 | 0.04 | −0.72 (−0.88, −0.22) | 16.87 | 2.86 | −0.66 (−0.86, −0.06) |
| Australasia | Age-standardized | 0.14 | 0.04 | - | - | - | - |
| Caribbean | <5 years | 89.43 | 62.19 | −0.35 (−0.58, 0.21) | 3701.68 | 2405.72 | −0.39 (−0.61, 0.14) |
| Caribbean | 5–9 years | 52.06 | 55.14 | −0.2 (−0.63, 0.78) | 1939.76 | 2125.92 | −0.17 (−0.62, 0.84) |
| Caribbean | 10–14 years | 32.51 | 33.94 | −0.23 (−0.62, 0.79) | 1153.62 | 1283.47 | −0.18 (−0.6, 0.9) |
| Caribbean | 15–19 years | 2.67 | 5.5 | 0.29 (−0.04, 0.73) | 98.14 | 206.66 | 0.32 (−0.02, 0.77) |
| Caribbean | <20 years | 45.69 | 39.45 | −0.27 (−0.51, 0.11) | 6893.2 | 6021.77 | −0.27 (−0.5, 0.12) |
| Caribbean | Age-standardized | 53.52 | 39.52 | - | - | - | - |
| Central Asia | <5 years | 74.92 | 30.65 | −0.58 (−0.71, −0.35) | 7102.05 | 3064.21 | −0.56 (−0.7, −0.32) |
| Central Asia | 5–9 years | 34.66 | 25.39 | −0.55 (−0.78, −0.05) | 2855.12 | 2394.32 | −0.48 (−0.74, 0.09) |
| Central Asia | 10–14 years | 20.79 | 13.5 | −0.51 (−0.71, −0.19) | 1505.18 | 1114.04 | −0.44 (−0.67, −0.08) |
| Central Asia | 15–19 years | 3.16 | 3.02 | 0.08 (−0.3, 0.77) | 207.95 | 209.53 | 0.14 (−0.26, 0.86) |
| Central Asia | <20 years | 37 | 19.59 | −0.55 (−0.67, −0.35) | 11,670.29 | 6782.09 | −0.51 (−0.64, −0.28) |
| Central Asia | Age-standardized | 40.58 | 18.35 | - | - | - | - |
| Central Europe | <5 years | 58.02 | 15.95 | −0.78 (−0.82, −0.73) | 5183.65 | 890.88 | −0.87 (−0.89, −0.83) |
| Central Europe | 5–9 years | 34.18 | 10.76 | −0.78 (−0.85, −0.65) | 3303.5 | 627.4 | −0.87 (−0.91, −0.79) |
| Central Europe | 10–14 years | 18.49 | 7.29 | −0.74 (−0.82, −0.62) | 1912.88 | 458.14 | −0.84 (−0.89, −0.77) |
| Central Europe | 15–19 years | 0 | 0 | - | 0 | 0 | - |
| Central Europe | <20 years | 26.97 | 8.39 | −0.77 (−0.81, −0.72) | 10,400.03 | 1976.41 | −0.86 (−0.89, −0.83) |
| Central Europe | Age-standardized | 37.83 | 8.64 | - | - | - | - |
| Central Latin America | <5 years | 72.68 | 17.91 | −0.72 (−0.8, −0.47) | 16,639.5 | 3599.02 | −0.76 (−0.83, −0.54) |
| Central Latin America | 5–9 years | 45.31 | 11.01 | −0.67 (−0.78, −0.53) | 9568.59 | 2367.41 | −0.66 (−0.77, −0.52) |
| Central Latin America | 10–14 years | 19.79 | 5.43 | −0.6 (−0.72, −0.44) | 3975.41 | 1188.47 | −0.57 (−0.7, −0.39) |
| Central Latin America | 15–19 years | 5.43 | 2.1 | −0.12 (−0.26, 0.03) | 987.91 | 458.6 | 0.05 (−0.11, 0.23) |
| Central Latin America | <20 years | 37.88 | 8.93 | −0.71 (−0.78, −0.59) | 31,171.4 | 7613.5 | −0.7 (−0.77, −0.57) |
| Central Latin America | Age-standardized | 29.43 | 9.24 | - | - | - | - |
| Central Sub-Saharan Africa | <5 years | 375.64 | 185.96 | −0.48 (−0.63, 0.15) | 40,381.5 | 39,175.01 | 0.05 (−0.25, 1.33) |
| Central Sub-Saharan Africa | 5–9 years | 221.2 | 87.38 | −0.45 (−0.66, −0.12) | 18,371.54 | 17,407.03 | 0.33 (−0.16, 1.14) |
| Central Sub-Saharan Africa | 10–14 years | 158 | 87.63 | −0.44 (−0.66, −0.05) | 10,708.39 | 15,505.5 | 0.46 (−0.11, 1.48) |
| Central Sub-Saharan Africa | 15–19 years | 10.04 | 9.72 | −0.17 (−0.4, 0.14) | 570.68 | 1446.6 | 1.16 (0.56, 1.98) |
| Central Sub-Saharan Africa | <20 years | 222.2 | 99.96 | −0.5 (−0.62, −0.26) | 70,032.12 | 73,534.15 | 0.19 (−0.09, 0.76) |
| Central Sub-Saharan Africa | Age-standardized | 174.65 | 92.92 | - | - | - | - |
| East Asia | <5 years | 55.38 | 11.03 | −0.8 (−0.88, −0.66) | 66,367.9 | 8832.19 | −0.86 (−0.91, −0.77) |
| East Asia | 5–9 years | 28.47 | 6.57 | −0.76 (−0.85, −0.62) | 30,904.2 | 6461.42 | −0.78 (−0.86, −0.65) |
| East Asia | 10–14 years | 20.65 | 4.54 | −0.77 (−0.86, −0.61) | 22,008.98 | 4034.04 | −0.81 (−0.88, −0.68) |
| East Asia | 15–19 years | 2.59 | 2.59 | 0.17 (−0.09, 0.5) | 3382.96 | 2009.07 | −0.3 (−0.46, −0.1) |
| East Asia | <20 years | 26.35 | 6.19 | −0.76 (−0.83, −0.67) | 122,664.04 | 21,336.72 | −0.82 (−0.87, −0.75) |
| East Asia | Age-standardized | 27.29 | 6.26 | - | - | - | - |
| Eastern Europe | <5 years | 2.4 | 0.54 | −0.83 (−0.89, −0.7) | 413.29 | 54.67 | −0.9 (−0.93, −0.82) |
| Eastern Europe | 5–9 years | 1.06 | 0.28 | −0.78 (−0.89, −0.58) | 188.85 | 36.46 | −0.84 (−0.92, −0.7) |
| Eastern Europe | 10–14 years | 0.54 | 0.23 | −0.76 (−0.88, −0.54) | 88.55 | 28.79 | −0.82 (−0.91, −0.65) |
| Eastern Europe | 15–19 years | 0 | 0 | - | 0 | 0 | - |
| Eastern Europe | <20 years | 1.03 | 0.26 | −0.81 (−0.87, −0.72) | 690.69 | 119.93 | −0.87 (−0.91, −0.81) |
| Eastern Europe | Age-standardized | 1.38 | 0.27 | - | - | - | - |
| Eastern Sub-Saharan Africa | <5 years | 367.94 | 148.43 | −0.61 (−0.7, −0.26) | 132,530.14 | 94,690.25 | −0.32 (−0.47, 0.3) |
| Eastern Sub-Saharan Africa | 5–9 years | 210.32 | 96.66 | −0.57 (−0.67, −0.45) | 61,639.15 | 57,479.34 | −0.13 (−0.32, 0.11) |
| Eastern Sub-Saharan Africa | 10–14 years | 146.42 | 60.8 | −0.59 (−0.68, −0.48) | 36,665.31 | 33,544.32 | −0.1 (−0.3, 0.14) |
| Eastern Sub-Saharan Africa | 15–19 years | 8.46 | 6.13 | −0.16 (−0.29, 0.01) | 1714.69 | 3015.42 | 1.04 (0.73, 1.43) |
| Eastern Sub-Saharan Africa | <20 years | 210.2 | 82.93 | −0.62 (−0.69, −0.48) | 232,549.3 | 188,729.33 | −0.23 (−0.37, 0.06) |
| Eastern Sub-Saharan Africa | Age-standardized | 195.80 | 78.35 | - | - | - | - |
| High-income Asia Pacific | <5 years | 5.3 | 0.69 | −0.79 (−1.01, −0.6) | 542.82 | 44.2 | −0.87 (−1.01, −0.75) |
| High-income Asia Pacific | 5–9 years | 4.21 | 0.2 | −0.84 (−0.93, −0.59) | 501.23 | 15.36 | −0.89 (−0.96, −0.73) |
| High-income Asia Pacific | 10–14 years | 2.42 | 0.15 | −0.8 (−0.92, −0.51) | 316.52 | 12.07 | −0.88 (−0.95, −0.7) |
| High-income Asia Pacific | 15–19 years | 0 | 0 | - | 0 | 0 | - |
| High-income Asia Pacific | <20 years | 2.7 | 0.23 | −0.8 (−0.91, −0.65) | 1360.58 | 71.63 | −0.88 (−0.95, −0.79) |
| High-income Asia Pacific | Age-standardized | 1.33 | 0.26 | - | - | - | - |
| High-income North America | <5 years | 1.43 | 0.25 | −0.73 (−0.86, −0.12) | 307.9 | 50.24 | −0.75 (−0.87, −0.17) |
| High-income North America | 5–9 years | 1.6 | 0.22 | −0.7 (−0.86, −0.32) | 328.18 | 49.17 | −0.68 (−0.85, −0.27) |
| High-income North America | 10–14 years | 0.41 | 0.14 | −0.49 (−0.79, 0.36) | 78.65 | 31.56 | −0.39 (−0.75, 0.62) |
| High-income North America | 15–19 years | 0 | 0 | - | 0 | 0 | - |
| High-income North America | <20 years | 0.88 | 0.15 | −0.71 (−0.83, −0.45) | 714.72 | 130.96 | −0.68 (−0.81, −0.4) |
| High-income North America | Age-standardized | 0.50 | 0.15 | - | - | - | - |
| North Africa and Middle East | <5 years | 131.52 | 45.6 | −0.63 (−0.74, −0.28) | 70,156.2 | 27,881.4 | −0.56 (−0.69, −0.14) |
| North Africa and Middle East | 5–9 years | 53.23 | 19.49 | −0.6 (−0.71, −0.46) | 25,554.22 | 12,318.68 | −0.47 (−0.61, −0.28) |
| North Africa and Middle East | 10–14 years | 28.22 | 13.17 | −0.59 (−0.68, −0.47) | 11,958.69 | 7768.47 | −0.42 (−0.55, −0.25) |
| North Africa and Middle East | 15–19 years | 3.02 | 4.35 | 0.11 (−0.14, 0.36) | 1103.41 | 2312.9 | 0.62 (0.26, 0.99) |
| North Africa and Middle East | <20 years | 60.33 | 21.26 | −0.63 (−0.72, −0.46) | 108,772.53 | 50,281.44 | −0.5 (−0.62, −0.27) |
| North Africa and Middle East | Age-standardized | 53.23 | 20.87 | - | - | - | - |
| Oceania | <5 years | 160.46 | 90.25 | −0.45 (−0.63, −0.07) | 1577.61 | 1745.83 | 0.06 (−0.29, 0.79) |
| Oceania | 5–9 years | 79.24 | 43.21 | −0.41 (−0.68, 0.13) | 684.04 | 720.55 | 0.12 (−0.4, 1.14) |
| Oceania | 10–14 years | 46.49 | 23.56 | −0.47 (−0.7, −0.02) | 363.21 | 348.41 | −0.01 (−0.43, 0.83) |
| Oceania | 15–19 years | 2.59 | 1.51 | −0.23 (−0.46, 0.16) | 17.71 | 19.71 | 0.47 (0.03, 1.2) |
| Oceania | <20 years | 79.83 | 44.38 | −0.44 (−0.59, −0.21) | 2642.57 | 2834.5 | 0.07 (−0.23, 0.5) |
| Oceania | Age-standardized | 72.44 | 40.34 | - | - | - | - |
| South Asia | <5 years | 316.52 | 100.92 | −0.72 (−0.8, −0.58) | 512,041.07 | 160,057.4 | −0.71 (−0.8, −0.58) |
| South Asia | 5–9 years | 136.39 | 52.35 | −0.64 (−0.79, −0.36) | 204,711.37 | 89,163.06 | −0.58 (−0.76, −0.27) |
| South Asia | 10–14 years | 98.23 | 33.35 | −0.69 (−0.81, −0.49) | 124,864.8 | 59,403.94 | −0.56 (−0.73, −0.28) |
| South Asia | 15–19 years | 8 | 5.13 | −0.17 (−0.31, −0.04) | 8723.81 | 9058.32 | 0.34 (0.12, 0.55) |
| South Asia | <20 years | 155.15 | 46.48 | −0.72 (−0.79, −0.63) | 850,341.05 | 317,682.72 | −0.65 (−0.73, −0.54) |
| South Asia | Age-standardized | 157.09 | 48.49 | - | - | - | - |
| Southeast Asia | <5 years | 215.77 | 43.84 | −0.81 (−0.85, −0.67) | 128,350.21 | 24,672.79 | −0.82 (−0.85, −0.68) |
| Southeast Asia | 5–9 years | 113.02 | 22.08 | −0.77 (−0.85, −0.65) | 65,719.61 | 12,867.82 | −0.77 (−0.85, −0.65) |
| Southeast Asia | 10–14 years | 54.36 | 12.9 | −0.71 (−0.79, −0.6) | 29,677.21 | 7492.37 | −0.7 (−0.78, −0.57) |
| Southeast Asia | 15–19 years | 7.52 | 3.38 | −0.09 (−0.21, 0.03) | 3690.8 | 1911 | 0.05 (−0.09, 0.19) |
| Southeast Asia | <20 years | 102.78 | 20.48 | −0.79 (−0.83, −0.71) | 227,437.83 | 46,943.98 | −0.78 (−0.82, −0.7) |
| Southeast Asia | Age-standardized | 96.35 | 20.92 | - | - | - | - |
| Southern Latin America | <5 years | 73.89 | 18.54 | −0.7 (−0.88, −0.31) | 3812.33 | 793.36 | −0.75 (−0.9, −0.43) |
| Southern Latin America | 5–9 years | 22.85 | 6.29 | −0.72 (−0.94, 0.64) | 1140.45 | 324.23 | −0.71 (−0.94, 0.7) |
| Southern Latin America | 10–14 years | 11.68 | 3.1 | −0.69 (−0.89, −0.22) | 558.27 | 156.84 | −0.67 (−0.89, −0.18) |
| Southern Latin America | 15–19 years | 0 | 0 | - | 0 | 0 | - |
| Southern Latin America | <20 years | 28.45 | 6.53 | −0.74 (−0.87, −0.4) | 5511.05 | 1274.42 | −0.73 (−0.87, −0.39) |
| Southern Latin America | Age-standardized | 24.10 | 6.87 | - | - | - | - |
| Southern Sub-Saharan Africa | <5 years | 147.05 | 68.45 | −0.59 (−0.72, 0.04) | 10,549.4 | 5496.16 | −0.56 (−0.7, 0.11) |
| Southern Sub-Saharan Africa | 5–9 years | 89.69 | 51.47 | −0.53 (−0.73, −0.17) | 6107.43 | 4197.96 | −0.44 (−0.67, −0.02) |
| Southern Sub-Saharan Africa | 10–14 years | 49.43 | 29.29 | −0.52 (−0.72, −0.14) | 3159.54 | 2308.4 | −0.41 (−0.65, 0.07) |
| Southern Sub-Saharan Africa | 15–19 years | 7.13 | 4 | −0.14 (−0.37, 0.13) | 416.02 | 287.63 | 0.07 (−0.22, 0.41) |
| Southern Sub-Saharan Africa | <20 years | 77.2 | 39.31 | −0.57 (−0.67, −0.32) | 20,232.39 | 12,290.16 | −0.49 (−0.61, −0.2) |
| Southern Sub-Saharan Africa | Age-standardized | 86.96 | 38.40 | - | - | - | - |
| Tropical Latin America | <5 years | 99.53 | 35.98 | −0.67 (−0.79, −0.24) | 17,472.68 | 6190.79 | −0.67 (−0.79, −0.23) |
| Tropical Latin America | 5–9 years | 80.15 | 31.5 | −0.64 (−0.83, −0.25) | 14,915.83 | 5262.44 | −0.68 (−0.85, −0.33) |
| Tropical Latin America | 10–14 years | 50.19 | 20.08 | −0.65 (−0.8, −0.35) | 8923.55 | 3268.81 | −0.68 (−0.82, −0.41) |
| Tropical Latin America | 15–19 years | 4.88 | 4.55 | −0.13 (−0.28, 0.05) | 764.98 | 745.43 | −0.09 (−0.25, 0.1) |
| Tropical Latin America | <20 years | 60.43 | 23.23 | −0.65 (−0.75, −0.47) | 42,077.03 | 15,467.46 | −0.67 (−0.76, −0.49) |
| Tropical Latin America | Age-standardized | 66.02 | 23.21 | - | - | - | - |
| Western Europe | <5 years | 5.14 | 1.37 | −0.68 (−1.21, −0.54) | 1181.18 | 291.62 | −0.7 (−1.2, −0.58) |
| Western Europe | 5–9 years | 3.43 | 0.57 | −0.76 (−0.85, −0.61) | 807.8 | 130.84 | −0.77 (−0.86, −0.62) |
| Western Europe | 10–14 years | 0.8 | 0.17 | −0.8 (−0.87, −0.68) | 195.57 | 41.51 | −0.8 (−0.87, −0.69) |
| Western Europe | 15–19 years | 0 | 0 | - | 0 | 0 | - |
| Western Europe | <20 years | 2.22 | 0.51 | −0.72 (−0.88, −0.59) | 2184.54 | 463.96 | −0.73 (−0.89, −0.62) |
| Western Europe | Age-standardized | 1.85 | 0.45 | - | - | - | - |
| Western Sub-Saharan Africa | <5 years | 364.56 | 158.7 | −0.58 (−0.67, −0.21) | 130,049.51 | 126,890.35 | −0.06 (−0.26, 0.78) |
| Western Sub-Saharan Africa | 5–9 years | 255.81 | 97.89 | −0.56 (−0.65, −0.45) | 73,088.46 | 70,038.97 | 0.11 (−0.11, 0.37) |
| Western Sub-Saharan Africa | 10–14 years | 162.1 | 71.15 | −0.53 (−0.63, −0.42) | 38,212.13 | 45,004.7 | 0.25 (0, 0.56) |
| Western Sub-Saharan Africa | 15–19 years | 8.87 | 4.99 | −0.26 (−0.37, −0.12) | 1732.27 | 2685.31 | 1.03 (0.74, 1.41) |
| Western Sub-Saharan Africa | <20 years | 226.46 | 91.08 | −0.58 (−0.65, −0.43) | 243,082.37 | 244,619.34 | 0.04 (−0.12, 0.42) |
| Western Sub-Saharan Africa | Age-standardized | 193.60 | 84 | - | - | - | - |
| 1990 | 2021 | ||
|---|---|---|---|
| ASR | ASR | ||
| DALYs (Disability-Adjusted Life Years) | |||
| Afghanistan | Age-standardized | 2669.53 (10,854.88, −7371.01) | 347.22 (1319.32, −558.90) |
| Albania | Age-standardized | 274.70 (802.25, −298.30) | 24.06 (53.14, 5.77) |
| Algeria | Age-standardized | 146.09 (513.26, −97.60) | 15.40 (26.94, 7.63) |
| American Samoa | Age-standardized | 60.88 (187.08, −22.47) | 24.44 (72.44, −5.43) |
| Andorra | Age-standardized | 1.57 (4.29, 0.06) | 0.31 (0.81, 0.01) |
| Angola | Age-standardized | 2979.88 (12,475.03, −9518.98) | 132.17 (454.18, −124.37) |
| Antigua and Barbuda | Age-standardized | 28.88 (60.53, 10.66) | 13.72 (24.68, 7.06) |
| Argentina | Age-standardized | 46.92 (137.69, −21.49) | 9.65 (26.26, 2.48) |
| Armenia | Age-standardized | 7.77 (33.19, −8.57) | 0.75 (1.62, 0.22) |
| Australia | Age-standardized | 0.03 (0.08, 0.01) | 0.01 (0.01, 0.00) |
| Austria | Age-standardized | 2.25 (6.23, −0.26) | 0.37 (1.02, 0.01) |
| Azerbaijan | Age-standardized | 50.29 (213.14, −71.96) | 7.67 (23.87, −3.18) |
| Bahamas | Age-standardized | 18.27 (36.77, 6.10) | 11.33 (18.51, 5.88) |
| Bahrain | Age-standardized | 13.76 (36.11, 0.13) | 2.55 (5.52, 0.97) |
| Bangladesh | Age-standardized | 616.94 (2512.48, −1221.03) | 15.01 (35.67, 2.43) |
| Barbados | Age-standardized | 17.75 (39.10, 5.89) | 9.94 (18.32, 5.01) |
| Belarus | Age-standardized | 3.35 (7.97, 0.63) | 0.51 (1.18, 0.15) |
| Belgium | Age-standardized | 2.22 (5.80, −0.06) | 0.42 (1.12, −0.03) |
| Belize | Age-standardized | 116.83 (413.61, −95.24) | 23.21 (46.95, 8.69) |
| Benin | Age-standardized | 3020.82 (11,879.69, −9604.18) | 205.39 (737.17, −659.09) |
| Bermuda | Age-standardized | 5.94 (13.74, 1.60) | 1.23 (2.67, 0.42) |
| Bhutan | Age-standardized | 549.74 (2425.32, −3646.54) | 40.81 (107.77, −10.38) |
| Bolivia (Plurinational State of) | Age-standardized | 240.41 (1064.34, −233.06) | 30.65 (81.95, 3.54) |
| Bosnia and Herzegovina | Age-standardized | 57.46 (114.96, 18.42) | 15.02 (29.29, 6.01) |
| Botswana | Age-standardized | 786.17 (3120.14, −1469.52) | 123.25 (504.87, −155.63) |
| Brazil | Age-standardized | 305.58 (1260.84, −610.85) | 25.99 (50.89, 9.89) |
| Brunei Darussalam | Age-standardized | 3.78 (7.97, 1.14) | 0.79 (1.90, 0.15) |
| Bulgaria | Age-standardized | 35.88 (74.66, 10.30) | 13.81 (30.54, 4.02) |
| Burkina Faso | Age-standardized | 3945.97 (15,424.43, −12,513.94) | 415.23 (1472.99, −725.10) |
| Burundi | Age-standardized | 1507.35 (5679.40, −4796.93) | 122.17 (447.25, −402.34) |
| Cabo Verde | Age-standardized | 1070.07 (4140.38, −1790.45) | 30.14 (80.81, 1.83) |
| Cambodia | Age-standardized | 743.40 (2861.37, −1728.40) | 54.32 (130.09, 3.30) |
| Cameroon | Age-standardized | 2179.27 (8279.14, −6331.14) | 155.87 (520.38, −277.54) |
| Canada | Age-standardized | 1.17 (3.39, −0.20) | 0.23 (0.66, −0.03) |
| Central African Republic | Age-standardized | 2663.91 (10,791.33, −8225.08) | 530.80 (2127.93, −2093.95) |
| Chad | Age-standardized | 4740.05 (20,103.75, −20,360.84) | 1110.46 (5008.96, −5026.04) |
| Chile | Age-standardized | 17.47 (58.48, −10.02) | 1.97 (4.96, 0.04) |
| China | Age-standardized | 90.81 (360.91, −155.06) | 6.36 (10.19, 3.43) |
| Colombia | Age-standardized | 58.10 (227.77, −65.03) | 5.27 (11.40, 1.14) |
| Comoros | Age-standardized | 1530.53 (5495.75, −3681.46) | 115.99 (409.88, −101.51) |
| Congo | Age-standardized | 1005.92 (4232.20, −4892.06) | 188.32 (570.41, −427.00) |
| Cook Islands | Age-standardized | 74.46 (199.56, −0.69) | 10.05 (19.00, 4.36) |
| Costa Rica | Age-standardized | 21.42 (65.36, −9.32) | 4.53 (8.78, 1.76) |
| Croatia | Age-standardized | 20.76 (40.28, 8.45) | 6.45 (13.48, 1.77) |
| Cuba | Age-standardized | 14.54 (38.18, −0.95) | 3.95 (8.47, 1.46) |
| Cyprus | Age-standardized | 6.45 (20.12, −1.02) | 0.54 (1.60, −0.08) |
| Czechia | Age-standardized | 22.46 (48.34, 5.60) | 5.63 (14.00, 0.71) |
| Cote d’Ivoire | Age-standardized | 1545.43 (5709.05, −4114.71) | 154.45 (482.02, −214.91) |
| Democratic People’s Republic of Korea | Age-standardized | 55.66 (105.95, 18.92) | 17.07 (31.62, 7.18) |
| Democratic Republic of the Congo | Age-standardized | 1394.31 (5294.99, −4185.64) | 165.81 (528.45, −279.85) |
| Denmark | Age-standardized | 1.51 (4.08, 0.03) | 0.26 (0.73, −0.03) |
| Djibouti | Age-standardized | 1200.68 (5028.34, −2805.15) | 114.37 (401.61, −92.82) |
| Dominica | Age-standardized | 28.22 (67.49, 4.26) | 13.14 (23.19, 5.68) |
| Dominican Republic | Age-standardized | 202.89 (861.48, −343.60) | 24.91 (62.45, 3.69) |
| Ecuador | Age-standardized | 137.15 (591.25, −202.74) | 8.92 (16.84, 3.49) |
| Egypt | Age-standardized | 248.24 (1123.53, −416.63) | 12.97 (31.43, 1.51) |
| El Salvador | Age-standardized | 297.28 (1351.48, −576.64) | 12.59 (32.36, 1.46) |
| Equatorial Guinea | Age-standardized | 2269.78 (9348.81, −10236.72) | 47.82 (104.30, 1.28) |
| Eritrea | Age-standardized | 2763.66 (10,990.59, −7762.82) | 184.30 (707.12, −183.04) |
| Estonia | Age-standardized | 2.50 (5.73, 0.50) | 0.27 (0.57, 0.10) |
| Eswatini | Age-standardized | 1197.12 (5042.29, −2713.19) | 140.58 (604.67, −158.03) |
| Ethiopia | Age-standardized | 3739.87 (14,156.19, −7822.82) | 155.03 (519.03, −223.38) |
| Fiji | Age-standardized | 138.18 (473.38, −88.55) | 34.60 (93.80, 1.15) |
| Finland | Age-standardized | 1.77 (4.28, 0.28) | 0.34 (0.93, 0.02) |
| France | Age-standardized | 0.47 (1.28, −0.01) | 0.15 (0.42, −0.01) |
| Gabon | Age-standardized | 370.88 (1405.33, −1029.48) | 47.39 (109.25, −14.24) |
| Gambia | Age-standardized | 2111.30 (7561.58, −5093.84) | 242.02 (770.84, −158.19) |
| Georgia | Age-standardized | 12.34 (43.09, −6.83) | 3.80 (8.02, 1.63) |
| Germany | Age-standardized | 0.56 (1.34, 0.06) | 0.14 (0.36, 0.02) |
| Ghana | Age-standardized | 1638.14 (5915.44, −4232.79) | 134.80 (334.11, −15.27) |
| Greece | Age-standardized | 3.05 (7.37, 0.50) | 0.83 (2.06, 0.14) |
| Greenland | Age-standardized | 3.31 (13.54, −1.63) | 0.35 (0.83, 0.02) |
| Grenada | Age-standardized | 56.22 (121.54, 9.32) | 16.27 (28.49, 8.44) |
| Guam | Age-standardized | 30.42 (84.05, −0.81) | 8.43 (21.42, 0.83) |
| Guatemala | Age-standardized | 515.80 (2222.44, −870.36) | 31.60 (122.99, −26.70) |
| Guinea | Age-standardized | 4248.75 (16,202.31, −11,064.29) | 349.56 (1075.96, −607.75) |
| Guinea-Bissau | Age-standardized | 4075.38 (15,124.00, −10,818.46) | 481.82 (1615.26, −534.75) |
| Guyana | Age-standardized | 162.98 (633.92, −197.59) | 23.00 (50.79, 5.38) |
| Haiti | Age-standardized | 1311.94 (6239.21, −3346.37) | 262.91 (1024.86, −268.95) |
| Honduras | Age-standardized | 258.37 (1163.50, −409.66) | 18.43 (59.47, −1.47) |
| Hungary | Age-standardized | 29.89 (62.52, 8.82) | 9.32 (23.26, 0.72) |
| Iceland | Age-standardized | 1.44 (3.75, 0.08) | 0.28 (0.74, 0.01) |
| India | Age-standardized | 1242.12 (4642.63, −2604.28) | 91.75 (236.83, 3.65) |
| Indonesia | Age-standardized | 1002.26 (4372.33, −3065.65) | 46.75 (158.93, −30.20) |
| Iran (Islamic Republic of) | Age-standardized | 51.35 (180.59, −104.83) | 2.93 (5.70, 1.27) |
| Iraq | Age-standardized | 172.95 (649.72, −207.37) | 17.48 (34.28, 5.71) |
| Ireland | Age-standardized | 2.07 (5.09, 0.42) | 0.26 (0.70, 0.02) |
| Israel | Age-standardized | 15.16 (35.59, 1.21) | 3.72 (9.31, 0.38) |
| Italy | Age-standardized | 2.74 (6.06, 0.85) | 0.67 (1.57, 0.16) |
| Jamaica | Age-standardized | 50.65 (147.02, −16.25) | 16.20 (28.58, 8.32) |
| Japan | Age-standardized | 1.14 (3.34, −0.06) | 0.34 (1.03, −0.03) |
| Jordan | Age-standardized | 51.05 (117.93, 5.25) | 17.57 (30.83, 8.92) |
| Kazakhstan | Age-standardized | 168.79 (605.16, −156.11) | 27.65 (59.43, 11.07) |
| Kenya | Age-standardized | 1325.62 (5352.39, −3979.83) | 200.53 (708.38, −345.84) |
| Kiribati | Age-standardized | 928.98 (3866.97, −2122.29) | 179.23 (610.68, −186.74) |
| Kuwait | Age-standardized | 14.10 (25.21, 6.48) | 9.54 (16.08, 4.83) |
| Kyrgyzstan | Age-standardized | 64.39 (252.60, −55.70) | 18.64 (37.11, 7.44) |
| Lao People’s Democratic Republic | Age-standardized | 2390.76 (10,169.18, −6028.17) | 79.09 (281.60, −44.97) |
| Latvia | Age-standardized | 2.35 (5.38, 0.51) | 0.36 (0.77, 0.11) |
| Lebanon | Age-standardized | 47.48 (182.61, −28.08) | 3.75 (9.71, 0.15) |
| Lesotho | Age-standardized | 1297.43 (6006.52, −3705.75) | 377.68 (1820.88, −745.49) |
| Liberia | Age-standardized | 3271.83 (13,033.20, −10,058.34) | 207.29 (816.54, −480.44) |
| Libya | Age-standardized | 74.49 (252.82, −62.49) | 14.53 (24.76, 7.42) |
| Lithuania | Age-standardized | 2.60 (6.26, 0.35) | 0.28 (0.56, 0.11) |
| Luxembourg | Age-standardized | 1.54 (3.80, 0.17) | 0.24 (0.64, 0.01) |
| Madagascar | Age-standardized | 2028.62 (8488.15, −5435.61) | 232.41 (1145.09, −774.34) |
| Malawi | Age-standardized | 2948.56 (11,448.21, −10,070.48) | 180.83 (558.60, −215.23) |
| Malaysia | Age-standardized | 46.18 (162.99, −24.06) | 1.51 (3.50, 0.34) |
| Maldives | Age-standardized | 641.34 (2574.75, −1753.70) | 17.73 (40.32, 3.93) |
| Mali | Age-standardized | 4782.93 (18,430.61, −16,555.06) | 638.66 (1980.44, −934.96) |
| Malta | Age-standardized | 3.95 (8.91, 0.83) | 0.72 (1.86, 0.03) |
| Marshall Islands | Age-standardized | 424.57 (1351.60, −495.10) | 91.44 (193.14, 5.90) |
| Mauritania | Age-standardized | 1280.17 (5071.43, −3340.42) | 83.09 (253.04, −71.12) |
| Mauritius | Age-standardized | 69.10 (180.26, −5.06) | 10.38 (21.57, 3.74) |
| Mexico | Age-standardized | 241.69 (1041.54, −440.66) | 15.33 (37.74, 0.01) |
| Micronesia (Federated States of) | Age-standardized | 417.63 (1265.60, −484.06) | 129.00 (310.41, −7.29) |
| Monaco | Age-standardized | 0.51 (1.44, 0.00) | 0.13 (0.36, −0.01) |
| Mongolia | Age-standardized | 48.57 (154.95, −30.09) | 10.33 (18.54, 4.21) |
| Montenegro | Age-standardized | 19.58 (38.72, 8.69) | 7.24 (14.94, 3.11) |
| Morocco | Age-standardized | 618.68 (2445.62, −1094.41) | 28.70 (67.35, 1.20) |
| Mozambique | Age-standardized | 3273.70 (12,526.25, −8941.39) | 181.36 (629.03, −292.99) |
| Myanmar | Age-standardized | 1991.05 (8157.65, −4992.28) | 54.81 (161.95, −14.38) |
| Namibia | Age-standardized | 591.67 (2362.44, −1069.78) | 83.09 (324.75, −107.92) |
| Nauru | Age-standardized | 133.26 (418.07, −74.22) | 48.81 (126.12, 1.12) |
| Nepal | Age-standardized | 1358.52 (5348.97, −2372.95) | 32.64 (89.19, 5.27) |
| Netherlands | Age-standardized | 1.22 (3.19, 0.08) | 0.30 (0.92, −0.08) |
| New Zealand | Age-standardized | 0.75 (2.13, 0.18) | 0.21 (0.66, 0.05) |
| Nicaragua | Age-standardized | 205.33 (979.42, −424.07) | 5.38 (13.31, 0.50) |
| Niger | Age-standardized | 6224.29 (25,142.50, −24,445.85) | 679.22 (2578.14, −2718.01) |
| Nigeria | Age-standardized | 2332.26 (9345.87, −5898.50) | 168.24 (632.73, −377.88) |
| Niue | Age-standardized | 80.28 (243.67, −24.54) | 29.34 (84.31, −2.88) |
| North Macedonia | Age-standardized | 147.00 (569.50, −255.39) | 19.65 (44.03, 1.10) |
| Northern Mariana Islands | Age-standardized | 22.63 (57.76, 1.02) | 10.84 (25.17, 2.44) |
| Norway | Age-standardized | 1.21 (2.68, 0.39) | 0.14 (0.33, 0.04) |
| Oman | Age-standardized | 89.08 (227.63, 17.28) | 18.57 (30.51, 9.87) |
| Pakistan | Age-standardized | 977.05 (3757.73, −1672.61) | 43.59 (132.74, −6.02) |
| Palau | Age-standardized | 63.35 (207.64, −55.41) | 20.69 (54.26, −1.19) |
| Palestine | Age-standardized | 206.49 (741.20, −236.24) | 17.21 (29.07, 8.82) |
| Panama | Age-standardized | 37.17 (146.42, −31.91) | 7.94 (21.80, −0.92) |
| Papua New Guinea | Age-standardized | 573.12 (2200.20, −1131.02) | 101.76 (410.86, −161.41) |
| Paraguay | Age-standardized | 129.83 (483.38, −125.40) | 19.41 (41.31, 5.76) |
| Peru | Age-standardized | 163.73 (645.55, −215.83) | 18.41 (38.76, 6.82) |
| Philippines | Age-standardized | 457.17 (1817.57, −929.92) | 37.32 (115.55, −29.50) |
| Poland | Age-standardized | 36.90 (69.45, 16.19) | 7.17 (14.55, 2.70) |
| Portugal | Age-standardized | 7.45 (19.39, −0.81) | 1.11 (2.65, 0.22) |
| Puerto Rico | Age-standardized | 7.92 (18.48, 2.41) | 1.44 (3.41, 0.40) |
| Qatar | Age-standardized | 12.47 (42.54, −3.51) | 0.85 (1.88, 0.25) |
| Republic of Korea | Age-standardized | 2.65 (6.79, 0.23) | 0.15 (0.34, 0.03) |
| Republic of Moldova | Age-standardized | 7.51 (24.23, −2.53) | 1.14 (2.61, 0.28) |
| Romania | Age-standardized | 53.34 (140.36, −11.66) | 11.46 (24.37, 3.23) |
| Russian Federation | Age-standardized | 0.92 (2.76, −0.21) | 0.11 (0.23, 0.04) |
| Rwanda | Age-standardized | 1469.12 (5429.29, −3271.21) | 91.56 (335.15, −126.10) |
| Saint Kitts and Nevis | Age-standardized | 47.85 (155.20, −16.25) | 13.60 (25.32, 6.29) |
| Saint Lucia | Age-standardized | 46.75 (123.55, −3.26) | 15.90 (29.23, 7.86) |
| Saint Vincent and the Grenadines | Age-standardized | 74.50 (242.56, −36.38) | 19.79 (37.43, 9.00) |
| Samoa | Age-standardized | 198.52 (661.68, −94.20) | 42.79 (88.64, 17.12) |
| San Marino | Age-standardized | 0.92 (2.43, 0.10) | 0.23 (0.59, 0.02) |
| Sao Tome and Principe | Age-standardized | 1982.48 (7390.01, −4355.70) | 76.51 (188.20, 4.97) |
| Saudi Arabia | Age-standardized | 29.95 (121.71, −28.56) | 0.51 (1.14, 0.15) |
| Senegal | Age-standardized | 2006.62 (7466.52, −6100.96) | 76.92 (230.49, −14.37) |
| Serbia | Age-standardized | 76.24 (160.42, 22.57) | 17.14 (33.91, 6.75) |
| Seychelles | Age-standardized | 50.62 (159.96, −12.82) | 7.26 (14.66, 2.79) |
| Sierra Leone | Age-standardized | 3401.02 (13,721.12, −12,982.25) | 216.49 (818.86, −502.22) |
| Singapore | Age-standardized | 2.36 (6.55, 0.26) | 0.22 (0.52, 0.08) |
| Slovakia | Age-standardized | 28.13 (52.96, 12.09) | 6.92 (14.20, 2.30) |
| Slovenia | Age-standardized | 14.08 (28.09, 6.35) | 3.61 (7.12, 1.39) |
| Solomon Islands | Age-standardized | 768.77 (2888.77, −1367.89) | 168.30 (483.72, −51.21) |
| Somalia | Age-standardized | 5437.19 (21,484.44, −16,752.38) | 2199.05 (9108.03, −5903.07) |
| South Africa | Age-standardized | 671.07 (2866.16, −1158.85) | 81.70 (310.31, −70.41) |
| South Sudan | Age-standardized | 3464.03 (13,992.17, −8056.73) | 708.43 (3175.29, −1759.12) |
| Spain | Age-standardized | 1.96 (4.78, 0.27) | 0.40 (1.11, −0.01) |
| Sri Lanka | Age-standardized | 111.88 (345.39, −108.77) | 10.35 (19.65, 4.15) |
| Sudan | Age-standardized | 1678.67 (6916.70, −2998.04) | 62.84 (207.06, 4.04) |
| Suriname | Age-standardized | 104.31 (371.90, −124.89) | 29.40 (69.01, 5.45) |
| Sweden | Age-standardized | 1.18 (2.74, 0.36) | 0.23 (0.57, 0.04) |
| Switzerland | Age-standardized | 0.73 (2.15, −0.03) | 0.13 (0.38, 0.00) |
| Syrian Arab Republic | Age-standardized | 170.72 (612.69, −195.12) | 11.42 (23.99, 4.57) |
| Taiwan (Province of China) | Age-standardized | 5.69 (14.02, 0.43) | 0.45 (1.16, 0.06) |
| Tajikistan | Age-standardized | 330.62 (1437.71, −650.24) | 82.53 (303.79, −92.08) |
| Thailand | Age-standardized | 201.15 (715.64, −144.52) | 9.71 (18.57, 3.64) |
| Timor-Leste | Age-standardized | 1393.89 (6619.08, −4530.19) | 102.28 (298.95, −59.55) |
| Togo | Age-standardized | 1845.41 (7463.01, −5905.06) | 199.94 (652.97, −410.86) |
| Tokelau | Age-standardized | 193.76 (677.43, −220.19) | 76.48 (309.52, −89.91) |
| Tonga | Age-standardized | 181.46 (590.16, −122.58) | 29.41 (59.76, 11.01) |
| Trinidad and Tobago | Age-standardized | 25.59 (61.65, 3.89) | 11.46 (19.35, 5.90) |
| Tunisia | Age-standardized | 59.96 (201.35, −20.91) | 9.73 (16.46, 4.86) |
| Turkey | Age-standardized | 211.10 (853.45, −290.09) | 7.10 (14.94, 2.37) |
| Turkmenistan | Age-standardized | 108.12 (454.65, −143.27) | 14.66 (26.30, 6.62) |
| Tuvalu | Age-standardized | 613.19 (2195.24, −890.23) | 71.23 (190.06, −6.98) |
| Uganda | Age-standardized | 1896.43 (7273.59, −3911.83) | 63.82 (198.71, −91.96) |
| Ukraine | Age-standardized | 3.44 (8.68, 0.29) | 0.86 (1.77, 0.31) |
| United Arab Emirates | Age-standardized | 13.61 (46.93, −2.06) | 1.38 (3.19, 0.37) |
| United Kingdom | Age-standardized | 2.16 (4.72, 0.71) | 0.46 (1.09, 0.17) |
| United Republic of Tanzania | Age-standardized | 1207.12 (4676.68, −2505.43) | 112.92 (358.65, −126.20) |
| United States of America | Age-standardized | 0.52 (1.30, 0.05) | 0.17 (0.38, 0.05) |
| United States Virgin Islands | Age-standardized | 10.10 (25.52, 2.08) | 1.92 (4.46, 0.61) |
| Uruguay | Age-standardized | 34.83 (112.42, −19.55) | 6.40 (15.45, 0.42) |
| Uzbekistan | Age-standardized | 94.88 (356.30, −81.56) | 17.39 (33.21, 8.41) |
| Vanuatu | Age-standardized | 573.16 (1993.44, −1016.81) | 169.77 (520.53, −146.92) |
| Venezuela (Bolivarian Republic of) | Age-standardized | 88.81 (375.18, −113.78) | 19.20 (61.51, −3.08) |
| Vietnam | Age-standardized | 228.01 (834.21, −206.64) | 10.11 (18.30, 4.72) |
| Yemen | Age-standardized | 2121.46 (8478.60, −4449.96) | 116.92 (317.07, 11.86) |
| Zambia | Age-standardized | 2284.07 (9076.55, −4730.44) | 155.61 (492.86, −161.78) |
| Zimbabwe | Age-standardized | 523.58 (1862.25, −755.73) | 193.72 (689.76, −102.21) |
| Deaths | |||
| Afghanistan | Age-standardized | 28.67 (120.19, −84.02) | 3.24 (14.00, −6.82) |
| Albania | Age-standardized | 1.95 (7.06, −3.86) | 0.04 (0.21, −0.07) |
| Algeria | Age-standardized | 1.19 (5.03, −1.36) | 0.01 (0.05, −0.01) |
| American Samoa | Age-standardized | 0.39 (1.67, −0.44) | 0.14 (0.59, −0.14) |
| Andorra | Age-standardized | 0.00 (0.01, 0.00) | 0.00 (0.00, 0.00) |
| Angola | Age-standardized | 32.28 (138.62, −107.60) | 0.88 (4.17, −1.82) |
| Antigua and Barbuda | Age-standardized | 0.03 (0.16, −0.05) | 0.00 (0.02, −0.01) |
| Argentina | Age-standardized | 0.19 (0.92, −0.38) | 0.01 (0.05, −0.02) |
| Armenia | Age-standardized | 0.07 (0.33, −0.11) | 0.00 (0.00, 0.00) |
| Australia | Age-standardized | 0.00 (0.00, 0.00) | 0.00 (0.00, 0.00) |
| Austria | Age-standardized | 0.00 (0.01, 0.00) | 0.00 (0.00, 0.00) |
| Azerbaijan | Age-standardized | 0.43 (2.14, −0.88) | 0.03 (0.17, −0.07) |
| Bahamas | Age-standardized | 0.03 (0.13, −0.04) | 0.00 (0.01, 0.00) |
| Bahrain | Age-standardized | 0.04 (0.19, −0.07) | 0.00 (0.01, 0.00) |
| Bangladesh | Age-standardized | 5.92 (26.53, −14.54) | 0.04 (0.20, −0.06) |
| Barbados | Age-standardized | 0.02 (0.11, −0.03) | 0.00 (0.01, 0.00) |
| Belarus | Age-standardized | 0.01 (0.03, −0.01) | 0.00 (0.00, 0.00) |
| Belgium | Age-standardized | 0.00 (0.02, 0.00) | 0.00 (0.00, 0.00) |
| Belize | Age-standardized | 0.78 (3.78, −1.42) | 0.03 (0.14, −0.04) |
| Benin | Age-standardized | 31.77 (130.63, −109.83) | 0.95 (6.41, −8.49) |
| Bermuda | Age-standardized | 0.01 (0.04, −0.01) | 0.00 (0.00, 0.00) |
| Bhutan | Age-standardized | 4.41 (24.93, −42.54) | 0.10 (0.58, −0.32) |
| Bolivia (Plurinational State of) | Age-standardized | 2.15 (11.06, −2.97) | 0.09 (0.47, −0.11) |
| Bosnia and Herzegovina | Age-standardized | 0.07 (0.32, −0.13) | 0.01 (0.07, −0.02) |
| Botswana | Age-standardized | 7.37 (32.53, −17.42) | 0.92 (4.82, −2.07) |
| Brazil | Age-standardized | 2.67 (12.85, −7.22) | 0.03 (0.15, −0.05) |
| Brunei Darussalam | Age-standardized | 0.00 (0.02, −0.01) | 0.00 (0.00, 0.00) |
| Bulgaria | Age-standardized | 0.04 (0.21, −0.08) | 0.02 (0.10, −0.03) |
| Burkina Faso | Age-standardized | 40.75 (169.03, −143.48) | 3.16 (14.07, −9.30) |
| Burundi | Age-standardized | 15.23 (61.28, −55.28) | 0.66 (3.85, −5.01) |
| Cabo Verde | Age-standardized | 10.63 (44.19, −20.93) | 0.09 (0.44, −0.12) |
| Cambodia | Age-standardized | 6.16 (28.72, −20.67) | 0.11 (0.62, −0.26) |
| Cameroon | Age-standardized | 22.36 (89.96, −72.76) | 1.01 (4.61, −3.66) |
| Canada | Age-standardized | 0.00 (0.01, 0.00) | 0.00 (0.00, 0.00) |
| Central African Republic | Age-standardized | 27.38 (117.66, −93.96) | 4.09 (21.14, −24.72) |
| Chad | Age-standardized | 49.81 (221.88, −231.91) | 10.41 (53.24, −58.40) |
| Chile | Age-standardized | 0.09 (0.43, −0.16) | 0.00 (0.02, −0.01) |
| China | Age-standardized | 0.72 (3.60, −1.93) | 0.00 (0.01, −0.01) |
| Colombia | Age-standardized | 0.46 (2.19, −0.83) | 0.01 (0.06, −0.02) |
| Comoros | Age-standardized | 15.35 (58.32, −42.33) | 0.72 (3.47, −1.52) |
| Congo | Age-standardized | 9.05 (43.80, −55.81) | 0.52 (3.86, −5.78) |
| Cook Islands | Age-standardized | 0.35 (1.46, −0.35) | 0.01 (0.03, −0.01) |
| Costa Rica | Age-standardized | 0.10 (0.50, −0.17) | 0.00 (0.02, −0.01) |
| Croatia | Age-standardized | 0.02 (0.09, −0.04) | 0.01 (0.05, −0.02) |
| Cuba | Age-standardized | 0.05 (0.22, −0.08) | 0.00 (0.01, 0.00) |
| Cyprus | Age-standardized | 0.02 (0.13, −0.03) | 0.00 (0.00, 0.00) |
| Czechia | Age-standardized | 0.03 (0.17, −0.07) | 0.01 (0.07, −0.02) |
| Cote d’Ivoire | Age-standardized | 15.22 (61.19, −47.84) | 0.85 (4.05, −3.01) |
| Democratic People’s Republic of Korea | Age-standardized | 0.06 (0.31, −0.14) | 0.01 (0.04, −0.01) |
| Democratic Republic of the Congo | Age-standardized | 13.70 (56.46, −48.08) | 0.70 (4.21, −3.93) |
| Denmark | Age-standardized | 0.00 (0.01, 0.00) | 0.00 (0.00, 0.00) |
| Djibouti | Age-standardized | 12.07 (53.89, −32.26) | 0.78 (3.67, −1.39) |
| Dominica | Age-standardized | 0.06 (0.35, −0.12) | 0.01 (0.06, −0.02) |
| Dominican Republic | Age-standardized | 1.75 (8.81, −4.11) | 0.08 (0.40, −0.08) |
| Ecuador | Age-standardized | 1.22 (5.91, −2.36) | 0.01 (0.06, −0.02) |
| Egypt | Age-standardized | 2.44 (11.95, −4.82) | 0.03 (0.17, −0.05) |
| El Salvador | Age-standardized | 2.89 (14.31, −6.70) | 0.04 (0.21, −0.05) |
| Equatorial Guinea | Age-standardized | 22.58 (100.90, −116.71) | 0.09 (0.48, −0.29) |
| Eritrea | Age-standardized | 28.60 (119.82, −88.97) | 1.18 (6.24, −2.63) |
| Estonia | Age-standardized | 0.00 (0.02, −0.01) | 0.00 (0.00, 0.00) |
| Eswatini | Age-standardized | 12.23 (54.57, −31.03) | 1.14 (6.01, −2.03) |
| Ethiopia | Age-standardized | 39.86 (156.63, −89.92) | 0.97 (4.75, −3.03) |
| Fiji | Age-standardized | 0.99 (4.46, −1.30) | 0.11 (0.49, −0.14) |
| Finland | Age-standardized | 0.00 (0.00, 0.00) | 0.00 (0.00, 0.00) |
| France | Age-standardized | 0.00 (0.00, 0.00) | 0.00 (0.00, 0.00) |
| Gabon | Age-standardized | 2.99 (13.88, −12.43) | 0.06 (0.37, −0.47) |
| Gambia | Age-standardized | 20.89 (81.14, −59.18) | 1.44 (6.49, −2.63) |
| Georgia | Age-standardized | 0.07 (0.35, −0.11) | 0.00 (0.00, 0.00) |
| Germany | Age-standardized | 0.00 (0.00, 0.00) | 0.00 (0.00, 0.00) |
| Ghana | Age-standardized | 15.89 (62.88, −49.22) | 0.40 (1.97, −0.99) |
| Greece | Age-standardized | 0.00 (0.00, 0.00) | 0.00 (0.00, 0.00) |
| Greenland | Age-standardized | 0.03 (0.13, −0.02) | 0.00 (0.00, 0.00) |
| Grenada | Age-standardized | 0.12 (0.59, −0.24) | 0.00 (0.03, −0.01) |
| Guam | Age-standardized | 0.14 (0.64, −0.12) | 0.02 (0.12, −0.03) |
| Guatemala | Age-standardized | 5.35 (24.27, −10.01) | 0.23 (1.20, −0.39) |
| Guinea | Age-standardized | 45.32 (178.93, −126.66) | 2.64 (10.20, −7.70) |
| Guinea-Bissau | Age-standardized | 43.07 (166.44, −124.12) | 4.14 (16.10, −7.02) |
| Guyana | Age-standardized | 1.19 (6.07, −2.74) | 0.05 (0.22, −0.08) |
| Haiti | Age-standardized | 13.27 (67.38, −38.70) | 2.04 (9.85, −3.60) |
| Honduras | Age-standardized | 2.56 (12.49, −4.80) | 0.10 (0.49, −0.09) |
| Hungary | Age-standardized | 0.04 (0.21, −0.08) | 0.03 (0.13, −0.04) |
| Iceland | Age-standardized | 0.00 (0.00, 0.00) | 0.00 (0.00, 0.00) |
| India | Age-standardized | 12.11 (49.77, −30.48) | 0.36 (1.68, −0.41) |
| Indonesia | Age-standardized | 9.90 (46.99, −35.03) | 0.27 (1.37, −0.47) |
| Iran (Islamic Republic of) | Age-standardized | 0.26 (1.44, −1.34) | 0.00 (0.01, 0.00) |
| Iraq | Age-standardized | 1.43 (6.41, −2.65) | 0.03 (0.14, −0.05) |
| Ireland | Age-standardized | 0.00 (0.00, 0.00) | 0.00 (0.00, 0.00) |
| Israel | Age-standardized | 0.02 (0.09, −0.04) | 0.00 (0.02, −0.01) |
| Italy | Age-standardized | 0.00 (0.00, 0.00) | 0.00 (0.00, 0.00) |
| Jamaica | Age-standardized | 0.22 (1.12, −0.41) | 0.01 (0.04, −0.01) |
| Japan | Age-standardized | 0.00 (0.01, 0.00) | 0.00 (0.00, 0.00) |
| Jordan | Age-standardized | 0.10 (0.55, −0.20) | 0.01 (0.05, −0.01) |
| Kazakhstan | Age-standardized | 0.97 (4.90, −2.23) | 0.01 (0.04, −0.02) |
| Kenya | Age-standardized | 13.26 (57.60, −45.69) | 1.48 (6.82, −4.41) |
| Kiribati | Age-standardized | 8.91 (41.05, −24.96) | 1.12 (5.42, −2.63) |
| Kuwait | Age-standardized | 0.01 (0.04, −0.01) | 0.00 (0.00, 0.00) |
| Kyrgyzstan | Age-standardized | 0.44 (2.28, −0.78) | 0.02 (0.10, −0.04) |
| Lao People’s Democratic Republic | Age-standardized | 24.99 (111.50, −68.83) | 0.44 (2.39, −0.80) |
| Latvia | Age-standardized | 0.00 (0.02, 0.00) | 0.00 (0.00, 0.00) |
| Lebanon | Age-standardized | 0.37 (1.72, −0.40) | 0.01 (0.06, −0.01) |
| Lesotho | Age-standardized | 13.09 (64.98, −42.41) | 3.58 (19.24, −8.75) |
| Liberia | Age-standardized | 34.76 (143.61, −114.64) | 1.53 (8.04, −5.96) |
| Libya | Age-standardized | 0.53 (2.36, −0.87) | 0.01 (0.05, −0.01) |
| Lithuania | Age-standardized | 0.00 (0.03, −0.01) | 0.00 (0.00, 0.00) |
| Luxembourg | Age-standardized | 0.00 (0.01, 0.00) | 0.00 (0.00, 0.00) |
| Madagascar | Age-standardized | 21.16 (92.88, −62.27) | 1.91 (11.68, −9.24) |
| Malawi | Age-standardized | 30.47 (124.78, −115.11) | 1.00 (4.49, −3.04) |
| Malaysia | Age-standardized | 0.37 (1.62, −0.38) | 0.00 (0.01, 0.00) |
| Maldives | Age-standardized | 4.93 (25.09, −21.05) | 0.03 (0.15, −0.05) |
| Mali | Age-standardized | 50.25 (203.10, −190.00) | 5.22 (19.07, −11.99) |
| Malta | Age-standardized | 0.00 (0.00, 0.00) | 0.00 (0.00, 0.00) |
| Marshall Islands | Age-standardized | 3.16 (12.72, −6.47) | 0.20 (0.98, −0.52) |
| Mauritania | Age-standardized | 12.43 (54.20, −39.00) | 0.38 (1.79, −1.18) |
| Mauritius | Age-standardized | 0.19 (0.97, −0.37) | 0.01 (0.05, −0.02) |
| Mexico | Age-standardized | 2.32 (11.02, −5.16) | 0.05 (0.24, −0.09) |
| Micronesia (Federated States of) | Age-standardized | 2.82 (11.43, −6.67) | 0.46 (1.97, −0.79) |
| Monaco | Age-standardized | 0.00 (0.00, 0.00) | 0.00 (0.00, 0.00) |
| Mongolia | Age-standardized | 0.26 (1.29, −0.52) | 0.01 (0.05, −0.02) |
| Montenegro | Age-standardized | 0.01 (0.03, −0.01) | 0.00 (0.00, 0.00) |
| Morocco | Age-standardized | 6.12 (25.98, −12.69) | 0.07 (0.37, −0.17) |
| Mozambique | Age-standardized | 34.15 (137.43, −102.28) | 0.96 (5.41, −4.11) |
| Myanmar | Age-standardized | 20.41 (88.55, −57.29) | 0.20 (1.04, −0.37) |
| Namibia | Age-standardized | 5.65 (24.65, −12.66) | 0.59 (3.05, −1.47) |
| Nauru | Age-standardized | 0.81 (3.60, −1.33) | 0.13 (0.66, −0.22) |
| Nepal | Age-standardized | 13.93 (58.00, −27.44) | 0.10 (0.48, −0.09) |
| Netherlands | Age-standardized | 0.00 (0.00, 0.00) | 0.00 (0.00, 0.00) |
| New Zealand | Age-standardized | 0.00 (0.00, 0.00) | 0.00 (0.00, 0.00) |
| Nicaragua | Age-standardized | 2.02 (10.43, −4.86) | 0.02 (0.09, −0.02) |
| Niger | Age-standardized | 66.22 (277.69, −278.63) | 4.90 (25.43, −32.64) |
| Nigeria | Age-standardized | 25.29 (104.02, −67.48) | 1.50 (6.54, −4.58) |
| Niue | Age-standardized | 0.40 (1.92, −0.58) | 0.14 (0.66, −0.15) |
| North Macedonia | Age-standardized | 1.04 (5.25, −3.19) | 0.04 (0.20, −0.09) |
| Northern Mariana Islands | Age-standardized | 0.08 (0.37, −0.07) | 0.02 (0.10, −0.03) |
| Norway | Age-standardized | 0.00 (0.00, 0.00) | 0.00 (0.00, 0.00) |
| Oman | Age-standardized | 0.28 (1.52, −0.29) | 0.00 (0.02, −0.01) |
| Pakistan | Age-standardized | 9.54 (40.02, −19.68) | 0.21 (1.09, −0.25) |
| Palau | Age-standardized | 0.37 (1.74, −0.84) | 0.07 (0.35, −0.11) |
| Palestine | Age-standardized | 1.71 (7.22, −3.05) | 0.01 (0.04, −0.01) |
| Panama | Age-standardized | 0.26 (1.36, −0.43) | 0.03 (0.15, −0.05) |
| Papua New Guinea | Age-standardized | 5.74 (23.47, −13.16) | 0.73 (3.86, −2.07) |
| Paraguay | Age-standardized | 0.89 (4.32, −1.55) | 0.03 (0.17, −0.05) |
| Peru | Age-standardized | 1.21 (6.08, −2.65) | 0.02 (0.13, −0.04) |
| Philippines | Age-standardized | 4.48 (19.27, −10.68) | 0.17 (0.91, −0.48) |
| Poland | Age-standardized | 0.02 (0.09, −0.04) | 0.01 (0.03, −0.01) |
| Portugal | Age-standardized | 0.02 (0.07, −0.03) | 0.00 (0.00, 0.00) |
| Puerto Rico | Age-standardized | 0.01 (0.04, −0.01) | 0.00 (0.01, 0.00) |
| Qatar | Age-standardized | 0.08 (0.37, −0.08) | 0.00 (0.00, 0.00) |
| Republic of Korea | Age-standardized | 0.01 (0.04, −0.01) | 0.00 (0.00, 0.00) |
| Republic of Moldova | Age-standardized | 0.03 (0.16, −0.05) | 0.00 (0.00, 0.00) |
| Romania | Age-standardized | 0.20 (0.91, −0.38) | 0.02 (0.09, −0.03) |
| Russian Federation | Age-standardized | 0.00 (0.02, −0.01) | 0.00 (0.00, 0.00) |
| Rwanda | Age-standardized | 15.34 (59.37, −37.34) | 0.64 (3.19, −1.75) |
| Saint Kitts and Nevis | Age-standardized | 0.23 (1.19, −0.38) | 0.01 (0.07, −0.02) |
| Saint Lucia | Age-standardized | 0.14 (0.70, −0.29) | 0.01 (0.03, −0.01) |
| Saint Vincent and the Grenadines | Age-standardized | 0.38 (1.89, −0.67) | 0.01 (0.08, −0.02) |
| Samoa | Age-standardized | 1.41 (5.92, −1.56) | 0.04 (0.19, −0.04) |
| San Marino | Age-standardized | 0.00 (0.00, 0.00) | 0.00 (0.00, 0.00) |
| Sao Tome and Principe | Age-standardized | 20.19 (79.74, −50.40) | 0.21 (0.94, −0.34) |
| Saudi Arabia | Age-standardized | 0.27 (1.25, −0.36) | 0.00 (0.00, 0.00) |
| Senegal | Age-standardized | 19.58 (79.69, −71.34) | 0.34 (1.55, −0.49) |
| Serbia | Age-standardized | 0.16 (0.68, −0.21) | 0.01 (0.05, −0.03) |
| Seychelles | Age-standardized | 0.28 (1.29, −0.32) | 0.01 (0.05, −0.01) |
| Sierra Leone | Age-standardized | 35.81 (150.59, −147.64) | 1.22 (7.44, −6.53) |
| Singapore | Age-standardized | 0.00 (0.02, −0.01) | 0.00 (0.00, 0.00) |
| Slovakia | Age-standardized | 0.02 (0.09, −0.03) | 0.01 (0.04, −0.01) |
| Slovenia | Age-standardized | 0.00 (0.02, −0.01) | 0.00 (0.01, 0.00) |
| Solomon Islands | Age-standardized | 6.91 (29.62, −16.36) | 0.85 (3.62, −1.30) |
| Somalia | Age-standardized | 57.61 (237.10, −191.14) | 21.72 (98.13, −69.35) |
| South Africa | Age-standardized | 6.69 (30.53, −13.30) | 0.65 (3.07, −0.93) |
| South Sudan | Age-standardized | 36.64 (154.04, −92.01) | 6.51 (33.51, −20.68) |
| Spain | Age-standardized | 0.00 (0.01, 0.00) | 0.00 (0.00, 0.00) |
| Sri Lanka | Age-standardized | 0.53 (2.58, −1.68) | 0.01 (0.04, −0.01) |
| Sudan | Age-standardized | 17.53 (75.70, −34.47) | 0.30 (1.71, −0.24) |
| Suriname | Age-standardized | 0.67 (3.35, −1.71) | 0.07 (0.35, −0.10) |
| Sweden | Age-standardized | 0.00 (0.00, 0.00) | 0.00 (0.00, 0.00) |
| Switzerland | Age-standardized | 0.00 (0.00, 0.00) | 0.00 (0.00, 0.00) |
| Syrian Arab Republic | Age-standardized | 1.50 (6.15, −2.40) | 0.01 (0.06, −0.01) |
| Taiwan (Province of China) | Age-standardized | 0.01 (0.06, −0.02) | 0.00 (0.00, 0.00) |
| Tajikistan | Age-standardized | 3.13 (15.05, −7.62) | 0.60 (2.94, −1.24) |
| Thailand | Age-standardized | 1.64 (7.09, −2.00) | 0.01 (0.06, −0.02) |
| Timor-Leste | Age-standardized | 13.79 (71.22, −51.68) | 0.46 (2.36, −1.17) |
| Togo | Age-standardized | 18.10 (79.99, −68.27) | 1.12 (5.57, −5.41) |
| Tokelau | Age-standardized | 1.41 (6.35, −2.98) | 0.61 (3.03, −1.17) |
| Tonga | Age-standardized | 1.41 (5.70, −1.79) | 0.04 (0.17, −0.04) |
| Trinidad and Tobago | Age-standardized | 0.06 (0.30, −0.09) | 0.00 (0.02, −0.01) |
| Tunisia | Age-standardized | 0.42 (1.87, −0.37) | 0.00 (0.02, 0.00) |
| Turkey | Age-standardized | 1.91 (8.82, −3.49) | 0.01 (0.05, −0.01) |
| Turkmenistan | Age-standardized | 0.96 (4.66, −1.74) | 0.01 (0.06, −0.02) |
| Tuvalu | Age-standardized | 5.52 (22.48, −10.72) | 0.26 (1.21, −0.44) |
| Uganda | Age-standardized | 19.75 (79.30, −44.97) | 0.30 (1.56, −1.30) |
| Ukraine | Age-standardized | 0.01 (0.03, −0.01) | 0.00 (0.00, 0.00) |
| United Arab Emirates | Age-standardized | 0.07 (0.36, −0.06) | 0.00 (0.01, 0.00) |
| United Kingdom | Age-standardized | 0.00 (0.00, 0.00) | 0.00 (0.00, 0.00) |
| United Republic of Tanzania | Age-standardized | 11.95 (50.07, −29.29) | 0.73 (3.15, −1.72) |
| United States of America | Age-standardized | 0.00 (0.00, 0.00) | 0.00 (0.00, 0.00) |
| United States Virgin Islands | Age-standardized | 0.02 (0.09, −0.03) | 0.00 (0.01, 0.00) |
| Uruguay | Age-standardized | 0.17 (0.83, −0.32) | 0.01 (0.06, −0.02) |
| Uzbekistan | Age-standardized | 0.63 (3.16, −1.15) | 0.00 (0.02, −0.01) |
| Vanuatu | Age-standardized | 5.21 (20.77, −12.15) | 1.11 (4.64, −2.17) |
| Venezuela (Bolivarian Republic of) | Age-standardized | 0.80 (3.90, −1.38) | 0.10 (0.50, −0.11) |
| Vietnam | Age-standardized | 2.15 (8.75, −2.52) | 0.01 (0.03, 0.00) |
| Yemen | Age-standardized | 21.93 (92.64, −51.10) | 0.54 (2.53, −0.46) |
| Zambia | Age-standardized | 23.67 (98.79, −54.33) | 1.00 (4.24, −2.32) |
| Zimbabwe | Age-standardized | 4.76 (18.96, −9.13) | 3.24 (14.00, −6.82) |
| YLD (Years Lived with Disability) | |||
| Afghanistan | Age-standardized | 135.86 (239.09, 57.16) | 60.76 (101.98, 33.64) |
| Albania | Age-standardized | 102.23 (205.13, 50.64) | 20.12 (39.84, 9.65) |
| Algeria | Age-standardized | 40.60 (82.17, 18.11) | 14.44 (24.53, 7.83) |
| American Samoa | Age-standardized | 26.11 (45.66, 12.71) | 12.15 (22.96, 5.55) |
| Andorra | Age-standardized | 1.44 (3.71, 0.17) | 0.31 (0.80, 0.01) |
| Angola | Age-standardized | 126.50 (237.61, 15.35) | 53.73 (93.23, 28.79) |
| Antigua and Barbuda | Age-standardized | 26.16 (50.99, 12.82) | 13.37 (24.22, 7.13) |
| Argentina | Age-standardized | 30.32 (71.60, 8.97) | 8.86 (24.28, 2.90) |
| Armenia | Age-standardized | 1.91 (3.97, 0.69) | 0.70 (1.47, 0.25) |
| Australia | Age-standardized | 0.03 (0.07, 0.01) | 0.01 (0.01, 0.00) |
| Austria | Age-standardized | 2.17 (5.79, −0.14) | 0.36 (0.97, 0.03) |
| Azerbaijan | Age-standardized | 11.87 (24.65, 4.99) | 4.85 (9.20, 2.25) |
| Bahamas | Age-standardized | 15.98 (28.41, 8.30) | 11.18 (18.44, 5.85) |
| Bahrain | Age-standardized | 10.43 (20.77, 4.55) | 2.36 (4.85, 1.02) |
| Bangladesh | Age-standardized | 94.54 (174.02, 40.13) | 11.69 (20.63, 5.84) |
| Barbados | Age-standardized | 15.91 (32.00, 7.72) | 9.75 (17.76, 5.08) |
| Belarus | Age-standardized | 2.90 (5.80, 1.20) | 0.50 (1.15, 0.16) |
| Belgium | Age-standardized | 1.95 (4.66, 0.34) | 0.35 (0.85, 0.07) |
| Belize | Age-standardized | 47.51 (88.26, 23.68) | 20.74 (38.79, 10.93) |
| Benin | Age-standardized | 215.42 (362.15, 100.25) | 120.89 (205.88, 65.41) |
| Bermuda | Age-standardized | 5.23 (11.14, 2.19) | 1.20 (2.58, 0.43) |
| Bhutan | Age-standardized | 158.05 (257.00, 89.28) | 32.32 (77.66, 13.83) |
| Bolivia (Plurinational State of) | Age-standardized | 49.87 (90.52, 22.46) | 22.47 (45.12, 11.05) |
| Bosnia and Herzegovina | Age-standardized | 51.47 (98.01, 25.16) | 13.94 (26.32, 6.62) |
| Botswana | Age-standardized | 133.69 (248.28, 57.47) | 41.62 (86.65, 18.77) |
| Brazil | Age-standardized | 66.50 (115.96, 31.57) | 23.49 (40.74, 12.53) |
| Brunei Darussalam | Age-standardized | 3.41 (7.25, 1.31) | 0.71 (1.81, 0.22) |
| Bulgaria | Age-standardized | 32.17 (64.04, 15.21) | 12.02 (23.55, 5.56) |
| Burkina Faso | Age-standardized | 344.12 (563.13, 162.56) | 134.74 (230.20, 73.46) |
| Burundi | Age-standardized | 163.10 (286.14, 69.29) | 64.10 (119.81, 32.72) |
| Cabo Verde | Age-standardized | 128.49 (256.37, 48.38) | 22.43 (49.55, 10.13) |
| Cambodia | Age-standardized | 195.39 (352.92, 90.18) | 44.54 (86.77, 21.38) |
| Cameroon | Age-standardized | 204.49 (343.63, 85.81) | 66.35 (123.26, 33.20) |
| Canada | Age-standardized | 1.07 (2.96, −0.04) | 0.17 (0.38, 0.06) |
| Central African Republic | Age-standardized | 239.72 (405.65, 107.08) | 167.17 (279.03, 89.57) |
| Chad | Age-standardized | 341.23 (586.65, 155.17) | 190.30 (336.47, 100.25) |
| Chile | Age-standardized | 9.73 (19.78, 3.36) | 1.64 (3.48, 0.58) |
| China | Age-standardized | 27.17 (45.65, 13.27) | 6.15 (9.61, 3.48) |
| Colombia | Age-standardized | 17.58 (33.69, 7.70) | 4.30 (7.18, 2.18) |
| Comoros | Age-standardized | 174.28 (360.32, 62.28) | 52.57 (114.57, 24.86) |
| Congo | Age-standardized | 203.38 (357.59, 70.03) | 141.76 (251.90, 76.33) |
| Cook Islands | Age-standardized | 43.70 (87.88, 21.03) | 9.39 (17.03, 4.65) |
| Costa Rica | Age-standardized | 12.33 (22.55, 5.88) | 4.22 (7.52, 2.05) |
| Croatia | Age-standardized | 19.32 (36.11, 9.71) | 5.61 (10.60, 2.59) |
| Cuba | Age-standardized | 10.44 (22.05, 4.66) | 3.69 (7.54, 1.50) |
| Cyprus | Age-standardized | 4.25 (9.67, 1.03) | 0.50 (1.32, 0.02) |
| Czechia | Age-standardized | 19.41 (38.04, 8.91) | 4.46 (9.01, 1.89) |
| Cote d’Ivoire | Age-standardized | 198.50 (330.34, 101.83) | 78.77 (139.33, 38.98) |
| Democratic People’s Republic of Korea | Age-standardized | 50.29 (91.00, 24.03) | 16.21 (28.92, 7.40) |
| Democratic Republic of the Congo | Age-standardized | 181.72 (318.90, 81.95) | 103.41 (174.05, 56.79) |
| Denmark | Age-standardized | 1.30 (3.22, 0.26) | 0.24 (0.62, 0.02) |
| Djibouti | Age-standardized | 132.89 (275.15, 49.36) | 45.78 (94.73, 21.64) |
| Dominica | Age-standardized | 22.53 (39.71, 12.41) | 11.95 (19.00, 6.56) |
| Dominican Republic | Age-standardized | 46.98 (84.17, 22.51) | 17.76 (30.10, 9.47) |
| Ecuador | Age-standardized | 28.67 (73.25, 3.74) | 7.93 (12.96, 4.08) |
| Egypt | Age-standardized | 32.04 (65.06, 11.19) | 10.04 (16.94, 5.12) |
| El Salvador | Age-standardized | 40.19 (80.24, 15.42) | 8.95 (15.46, 4.62) |
| Equatorial Guinea | Age-standardized | 269.02 (445.13, 121.25) | 39.90 (70.62, 21.24) |
| Eritrea | Age-standardized | 241.71 (467.10, 83.01) | 80.34 (177.88, 37.33) |
| Estonia | Age-standardized | 2.15 (4.37, 0.84) | 0.27 (0.55, 0.11) |
| Eswatini | Age-standardized | 112.96 (220.07, 39.25) | 38.64 (79.07, 17.82) |
| Ethiopia | Age-standardized | 222.55 (361.38, 106.64) | 69.11 (112.68, 38.35) |
| Fiji | Age-standardized | 50.86 (90.40, 24.87) | 24.53 (54.26, 10.97) |
| Finland | Age-standardized | 1.72 (4.01, 0.36) | 0.33 (0.86, 0.04) |
| France | Age-standardized | 0.41 (1.02, 0.06) | 0.14 (0.38, 0.00) |
| Gabon | Age-standardized | 105.54 (191.92, 51.07) | 42.27 (83.66, 20.68) |
| Gambia | Age-standardized | 268.79 (473.74, 141.23) | 114.60 (226.53, 57.66) |
| Georgia | Age-standardized | 6.25 (13.54, 2.56) | 3.72 (7.75, 1.60) |
| Germany | Age-standardized | 0.52 (1.22, 0.10) | 0.13 (0.31, 0.04) |
| Ghana | Age-standardized | 236.31 (391.76, 108.17) | 99.63 (179.56, 50.33) |
| Greece | Age-standardized | 3.03 (7.31, 0.53) | 0.82 (2.01, 0.15) |
| Greenland | Age-standardized | 0.90 (2.16, 0.24) | 0.28 (0.57, 0.11) |
| Grenada | Age-standardized | 45.13 (77.41, 23.38) | 15.85 (27.64, 8.65) |
| Guam | Age-standardized | 18.40 (35.04, 7.86) | 6.27 (12.33, 2.68) |
| Guatemala | Age-standardized | 41.55 (76.00, 16.66) | 10.94 (20.16, 5.47) |
| Guinea | Age-standardized | 247.79 (405.73, 120.93) | 116.70 (204.48, 60.13) |
| Guinea-Bissau | Age-standardized | 277.27 (511.38, 129.88) | 116.79 (215.85, 58.77) |
| Guyana | Age-standardized | 56.42 (107.15, 27.82) | 18.80 (34.30, 9.93) |
| Haiti | Age-standardized | 132.17 (243.89, 62.01) | 80.89 (168.32, 38.34) |
| Honduras | Age-standardized | 31.12 (54.72, 14.94) | 9.74 (17.80, 4.89) |
| Hungary | Age-standardized | 26.32 (50.81, 12.62) | 7.05 (13.81, 3.25) |
| Iceland | Age-standardized | 1.40 (3.62, 0.15) | 0.27 (0.69, 0.02) |
| India | Age-standardized | 171.15 (274.49, 90.31) | 59.70 (98.90, 33.40) |
| Indonesia | Age-standardized | 124.43 (216.61, 44.09) | 22.77 (39.31, 11.26) |
| Iran (Islamic Republic of) | Age-standardized | 28.25 (56.74, 11.53) | 2.79 (5.33, 1.30) |
| Iraq | Age-standardized | 46.58 (88.07, 21.54) | 15.13 (25.28, 7.99) |
| Ireland | Age-standardized | 2.02 (4.86, 0.49) | 0.25 (0.67, 0.03) |
| Israel | Age-standardized | 13.48 (28.23, 4.01) | 3.30 (7.36, 0.93) |
| Italy | Age-standardized | 2.65 (5.77, 0.93) | 0.62 (1.31, 0.22) |
| Jamaica | Age-standardized | 30.74 (53.38, 15.91) | 15.55 (27.58, 8.23) |
| Japan | Age-standardized | 0.94 (2.44, 0.16) | 0.31 (0.90, −0.01) |
| Jordan | Age-standardized | 41.90 (73.79, 21.37) | 16.77 (28.29, 9.29) |
| Kazakhstan | Age-standardized | 81.89 (175.61, 35.89) | 26.87 (58.06, 11.07) |
| Kenya | Age-standardized | 150.40 (250.42, 56.25) | 69.31 (107.87, 39.13) |
| Kiribati | Age-standardized | 139.62 (254.96, 60.00) | 79.78 (146.83, 41.00) |
| Kuwait | Age-standardized | 13.45 (22.41, 7.08) | 9.51 (16.07, 4.82) |
| Kyrgyzstan | Age-standardized | 24.83 (48.19, 12.22) | 16.86 (31.03, 8.76) |
| Lao People’s Democratic Republic | Age-standardized | 176.40 (335.50, 55.97) | 40.31 (74.14, 19.43) |
| Latvia | Age-standardized | 2.09 (4.21, 0.77) | 0.35 (0.76, 0.12) |
| Lebanon | Age-standardized | 14.89 (30.93, 6.68) | 2.80 (5.77, 1.20) |
| Lesotho | Age-standardized | 135.24 (254.67, 47.40) | 58.40 (114.22, 30.30) |
| Liberia | Age-standardized | 195.75 (339.13, 85.84) | 72.06 (129.52, 37.07) |
| Libya | Age-standardized | 27.45 (50.63, 13.79) | 13.68 (22.45, 7.48) |
| Lithuania | Age-standardized | 2.17 (4.37, 0.86) | 0.27 (0.54, 0.12) |
| Luxembourg | Age-standardized | 1.41 (3.27, 0.35) | 0.22 (0.53, 0.04) |
| Madagascar | Age-standardized | 158.56 (301.11, 51.10) | 62.95 (119.78, 32.23) |
| Malawi | Age-standardized | 253.11 (430.01, 118.46) | 92.64 (179.05, 46.25) |
| Malaysia | Age-standardized | 13.17 (23.47, 6.52) | 1.33 (2.65, 0.52) |
| Maldives | Age-standardized | 204.16 (393.86, 93.83) | 15.12 (29.70, 6.99) |
| Mali | Age-standardized | 349.35 (601.72, 156.59) | 178.31 (332.10, 97.82) |
| Malta | Age-standardized | 3.89 (8.65, 0.90) | 0.70 (1.75, 0.06) |
| Marshall Islands | Age-standardized | 144.96 (239.66, 77.42) | 74.10 (140.35, 38.28) |
| Mauritania | Age-standardized | 183.54 (357.79, 82.59) | 49.12 (104.73, 22.88) |
| Mauritius | Age-standardized | 52.41 (106.71, 21.05) | 9.44 (17.95, 4.52) |
| Mexico | Age-standardized | 34.98 (59.12, 15.07) | 11.02 (17.74, 6.15) |
| Micronesia (Federated States of) | Age-standardized | 168.12 (292.45, 89.69) | 87.97 (162.49, 47.09) |
| Monaco | Age-standardized | 0.49 (1.38, 0.01) | 0.13 (0.34, 0.00) |
| Mongolia | Age-standardized | 25.69 (42.20, 13.65) | 9.45 (15.59, 5.01) |
| Montenegro | Age-standardized | 18.96 (37.20, 9.10) | 7.16 (14.92, 3.11) |
| Morocco | Age-standardized | 76.04 (144.00, 26.71) | 22.20 (38.88, 12.15) |
| Mozambique | Age-standardized | 255.48 (431.48, 111.61) | 96.15 (177.01, 50.12) |
| Myanmar | Age-standardized | 186.68 (351.06, 66.57) | 36.83 (74.48, 15.92) |
| Namibia | Age-standardized | 91.00 (184.76, 37.85) | 30.39 (60.63, 14.68) |
| Nauru | Age-standardized | 61.62 (126.50, 30.22) | 37.03 (77.50, 17.74) |
| Nepal | Age-standardized | 127.89 (255.87, 52.65) | 23.77 (52.78, 10.77) |
| Netherlands | Age-standardized | 1.17 (2.88, 0.17) | 0.28 (0.83, −0.05) |
| New Zealand | Age-standardized | 0.69 (1.87, 0.22) | 0.20 (0.63, 0.06) |
| Nicaragua | Age-standardized | 26.04 (51.96, 7.62) | 3.89 (6.58, 1.91) |
| Niger | Age-standardized | 375.55 (646.93, 157.85) | 245.18 (395.74, 142.59) |
| Nigeria | Age-standardized | 100.68 (174.55, 44.71) | 35.67 (58.11, 19.46) |
| Niue | Age-standardized | 45.28 (90.24, 21.64) | 17.03 (31.82, 8.33) |
| North Macedonia | Age-standardized | 54.33 (103.76, 24.36) | 16.01 (30.13, 7.48) |
| Northern Mariana Islands | Age-standardized | 15.59 (31.55, 6.96) | 8.79 (17.60, 3.72) |
| Norway | Age-standardized | 1.19 (2.61, 0.41) | 0.14 (0.31, 0.04) |
| Oman | Age-standardized | 64.03 (113.66, 33.91) | 18.28 (29.79, 9.86) |
| Pakistan | Age-standardized | 132.59 (256.01, 62.37) | 25.35 (44.57, 14.09) |
| Palau | Age-standardized | 30.28 (60.42, 13.69) | 14.34 (28.17, 6.91) |
| Palestine | Age-standardized | 55.75 (101.07, 28.52) | 16.58 (27.45, 8.88) |
| Panama | Age-standardized | 13.67 (27.22, 5.41) | 5.34 (9.30, 2.49) |
| Papua New Guinea | Age-standardized | 64.60 (126.01, 27.31) | 36.74 (75.46, 16.23) |
| Paraguay | Age-standardized | 50.44 (105.30, 12.32) | 16.36 (28.57, 8.51) |
| Peru | Age-standardized | 55.89 (113.05, 18.64) | 16.22 (29.50, 8.33) |
| Philippines | Age-standardized | 60.78 (119.19, 13.63) | 21.93 (39.43, 10.95) |
| Poland | Age-standardized | 35.22 (66.27, 17.11) | 6.68 (13.33, 2.88) |
| Portugal | Age-standardized | 6.07 (13.36, 1.44) | 1.05 (2.42, 0.28) |
| Puerto Rico | Age-standardized | 7.17 (15.67, 2.96) | 1.34 (3.06, 0.47) |
| Qatar | Age-standardized | 5.73 (11.13, 2.55) | 0.80 (1.68, 0.28) |
| Republic of Korea | Age-standardized | 2.04 (4.08, 0.74) | 0.13 (0.29, 0.05) |
| Republic of Moldova | Age-standardized | 4.84 (11.10, 1.83) | 1.05 (2.26, 0.35) |
| Romania | Age-standardized | 35.88 (66.26, 18.14) | 9.84 (19.20, 4.39) |
| Russian Federation | Age-standardized | 0.63 (1.32, 0.25) | 0.11 (0.20, 0.05) |
| Rwanda | Age-standardized | 115.84 (216.93, 32.39) | 34.70 (60.16, 18.31) |
| Saint Kitts and Nevis | Age-standardized | 27.74 (53.24, 13.75) | 12.53 (21.53, 6.63) |
| Saint Lucia | Age-standardized | 33.83 (66.34, 16.67) | 15.26 (27.51, 8.05) |
| Saint Vincent and the Grenadines | Age-standardized | 40.94 (80.17, 20.18) | 18.50 (33.47, 9.67) |
| Samoa | Age-standardized | 73.56 (142.32, 34.66) | 39.02 (76.75, 18.62) |
| San Marino | Age-standardized | 0.87 (2.21, 0.13) | 0.23 (0.57, 0.02) |
| Sao Tome and Principe | Age-standardized | 198.04 (349.73, 90.91) | 58.06 (119.39, 26.63) |
| Saudi Arabia | Age-standardized | 6.09 (11.83, 2.65) | 0.45 (0.93, 0.17) |
| Senegal | Age-standardized | 278.89 (504.69, 135.29) | 46.85 (100.51, 21.44) |
| Serbia | Age-standardized | 62.43 (113.30, 32.91) | 16.27 (31.34, 7.79) |
| Seychelles | Age-standardized | 25.64 (50.88, 12.13) | 6.40 (10.94, 3.33) |
| Sierra Leone | Age-standardized | 234.43 (392.86, 93.57) | 107.78 (185.29, 58.13) |
| Singapore | Age-standardized | 2.00 (5.78, 0.63) | 0.21 (0.50, 0.08) |
| Slovakia | Age-standardized | 26.39 (49.99, 12.49) | 6.34 (12.14, 2.84) |
| Slovenia | Age-standardized | 13.67 (26.72, 6.35) | 3.47 (6.92, 1.45) |
| Solomon Islands | Age-standardized | 156.14 (276.40, 80.19) | 93.02 (185.63, 47.12) |
| Somalia | Age-standardized | 353.40 (600.90, 147.23) | 282.36 (491.02, 156.47) |
| South Africa | Age-standardized | 76.48 (145.53, 27.36) | 23.88 (40.55, 12.40) |
| South Sudan | Age-standardized | 224.65 (394.56, 94.91) | 131.13 (239.15, 67.77) |
| Spain | Age-standardized | 1.87 (4.44, 0.38) | 0.37 (1.00, 0.02) |
| Sri Lanka | Age-standardized | 64.94 (126.09, 31.19) | 9.55 (17.00, 4.82) |
| Sudan | Age-standardized | 129.42 (250.36, 47.67) | 36.43 (62.71, 19.59) |
| Suriname | Age-standardized | 44.06 (84.31, 22.08) | 22.71 (41.44, 12.18) |
| Sweden | Age-standardized | 1.17 (2.70, 0.37) | 0.22 (0.51, 0.05) |
| Switzerland | Age-standardized | 0.67 (1.86, 0.05) | 0.13 (0.35, 0.01) |
| Syrian Arab Republic | Age-standardized | 38.49 (78.32, 15.05) | 10.22 (19.95, 4.93) |
| Taiwan (Province of China) | Age-standardized | 4.71 (9.63, 1.74) | 0.44 (1.08, 0.08) |
| Tajikistan | Age-standardized | 52.04 (102.82, 21.04) | 29.13 (48.89, 16.12) |
| Thailand | Age-standardized | 55.93 (99.01, 24.92) | 8.69 (15.02, 4.47) |
| Timor-Leste | Age-standardized | 168.59 (308.66, 51.92) | 61.53 (112.68, 30.59) |
| Togo | Age-standardized | 246.85 (399.63, 113.80) | 101.01 (174.51, 55.19) |
| Tokelau | Age-standardized | 69.17 (129.38, 34.99) | 22.71 (45.15, 11.02) |
| Tonga | Age-standardized | 57.10 (101.01, 29.39) | 26.30 (50.05, 12.75) |
| Trinidad and Tobago | Age-standardized | 20.54 (38.49, 10.19) | 11.12 (18.91, 5.88) |
| Tunisia | Age-standardized | 22.77 (40.29, 10.84) | 9.33 (15.44, 4.83) |
| Turkey | Age-standardized | 41.94 (82.23, 17.92) | 6.29 (11.90, 2.89) |
| Turkmenistan | Age-standardized | 22.62 (40.92, 11.26) | 13.48 (22.46, 7.58) |
| Tuvalu | Age-standardized | 124.48 (235.09, 62.67) | 48.64 (101.99, 23.56) |
| Uganda | Age-standardized | 149.71 (266.53, 63.71) | 37.66 (68.07, 19.24) |
| Ukraine | Age-standardized | 2.86 (5.95, 1.09) | 0.83 (1.69, 0.34) |
| United Arab Emirates | Age-standardized | 7.52 (16.08, 2.95) | 1.26 (2.74, 0.45) |
| United Kingdom | Age-standardized | 2.12 (4.54, 0.76) | 0.45 (1.06, 0.18) |
| United Republic of Tanzania | Age-standardized | 149.88 (258.11, 74.48) | 48.41 (93.23, 22.87) |
| United States of America | Age-standardized | 0.44 (0.93, 0.15) | 0.15 (0.32, 0.06) |
| United States Virgin Islands | Age-standardized | 8.70 (19.72, 3.63) | 1.80 (4.05, 0.68) |
| Uruguay | Age-standardized | 20.02 (50.78, 6.29) | 5.32 (12.93, 1.73) |
| Uzbekistan | Age-standardized | 38.41 (81.38, 17.66) | 17.04 (32.66, 8.36) |
| Vanuatu | Age-standardized | 111.35 (186.04, 52.94) | 71.47 (123.51, 38.45) |
| Venezuela (Bolivarian Republic of) | Age-standardized | 17.59 (30.46, 8.59) | 10.25 (18.16, 5.13) |
| Vietnam | Age-standardized | 38.29 (74.03, 13.92) | 9.62 (16.83, 4.89) |
| Yemen | Age-standardized | 176.94 (333.16, 67.50) | 69.33 (111.64, 39.88) |
| Zambia | Age-standardized | 190.92 (349.06, 76.49) | 67.63 (128.38, 33.64) |
| Zimbabwe | Age-standardized | 101.32 (189.98, 44.57) | 60.76 (101.98, 33.64) |
Disclaimer/Publisher’s Note: The statements, opinions and data contained in all publications are solely those of the individual author(s) and contributor(s) and not of MDPI and/or the editor(s). MDPI and/or the editor(s) disclaim responsibility for any injury to people or property resulting from any ideas, methods, instructions or products referred to in the content. |
© 2025 by the authors. Licensee MDPI, Basel, Switzerland. This article is an open access article distributed under the terms and conditions of the Creative Commons Attribution (CC BY) license (https://creativecommons.org/licenses/by/4.0/).
Share and Cite
Lin, K.; Qi, Y.; Sun, J. Trend and Burden of Vitamin A Deficiency in 1990–2021 and Projection to 2050: A Systematic Analysis for the Global Burden of Disease Study 2021. Nutrients 2025, 17, 572. https://doi.org/10.3390/nu17030572
Lin K, Qi Y, Sun J. Trend and Burden of Vitamin A Deficiency in 1990–2021 and Projection to 2050: A Systematic Analysis for the Global Burden of Disease Study 2021. Nutrients. 2025; 17(3):572. https://doi.org/10.3390/nu17030572
Chicago/Turabian StyleLin, Kelly, Yanfei Qi, and Jing Sun. 2025. "Trend and Burden of Vitamin A Deficiency in 1990–2021 and Projection to 2050: A Systematic Analysis for the Global Burden of Disease Study 2021" Nutrients 17, no. 3: 572. https://doi.org/10.3390/nu17030572
APA StyleLin, K., Qi, Y., & Sun, J. (2025). Trend and Burden of Vitamin A Deficiency in 1990–2021 and Projection to 2050: A Systematic Analysis for the Global Burden of Disease Study 2021. Nutrients, 17(3), 572. https://doi.org/10.3390/nu17030572