
Ultra-Processed Food Consumption and Metabolic-Dysfunction-Associated Steatotic Liver Disease (MASLD): A Longitudinal and Sustainable Analysis

 ,
,  , ,
, ,  and
and
Abstract

1. Introduction
2. Methods
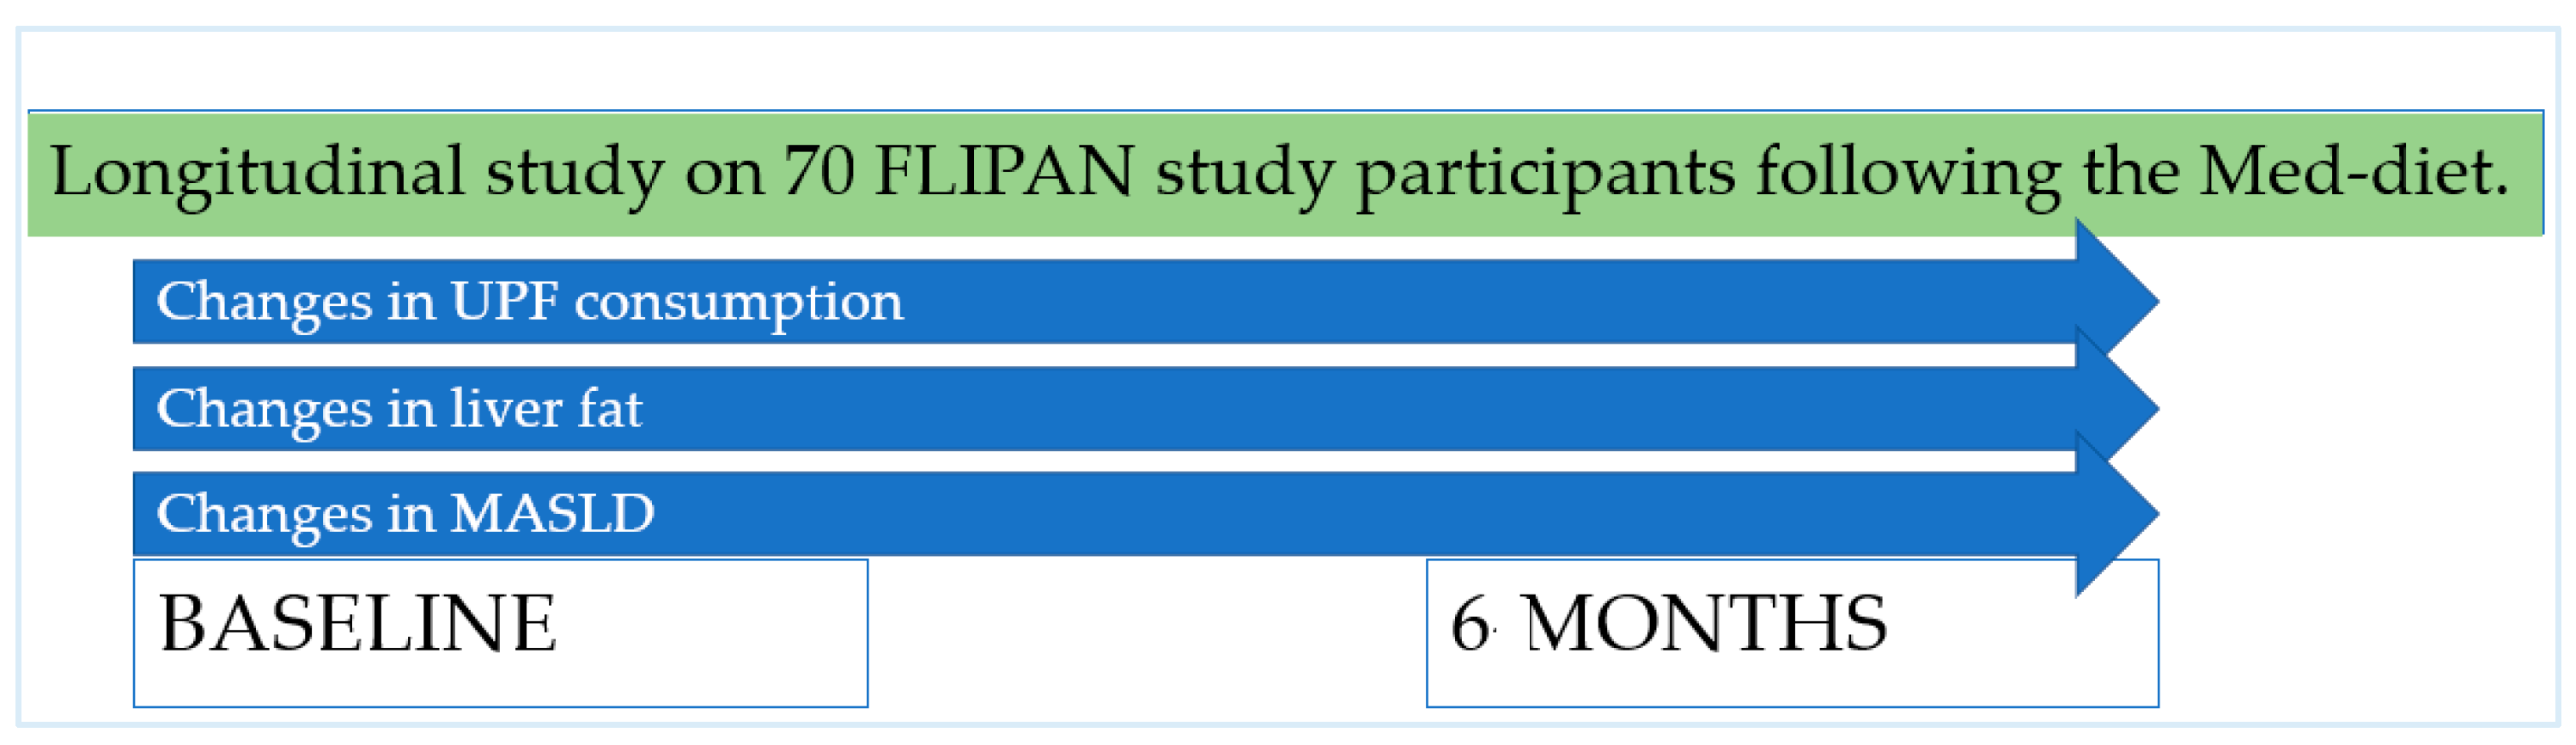
2.1. Design
2.2. Participants, Recruitment, and Ethics
2.3. Sociodemographic Characteristics
2.4. Fatty Liver Disease Parameters
2.5. Dietary Parameters
2.6. Ultra-Processed Food Consumption Assessment
2.7. Statistics
3. Results
4. Discussion
Strengths and Limitations
5. Conclusions
Author Contributions
Funding
Institutional Review Board Statement
Informed Consent Statement
Data Availability Statement
Acknowledgments
Conflicts of Interest
Clinical Trials Registration
References
- Lee, E.C.Z.; Anand, V.V.; Razavi, A.C.; Alebna, P.L.; Muthiah, M.D.; Siddiqui, M.S.; Chew, N.W.S.; Mehta, A. The Global Epidemic of Metabolic Fatty Liver Disease. Curr. Cardiol. Rep. 2024, 26, 199–210. [Google Scholar] [CrossRef] [PubMed]
- Grinshpan, L.S.; Eilat-Adar, S.; Ivancovsky-Wajcman, D.; Kariv, R.; Gillon-Keren, M.; Zelber-Sagi, S. Ultra-processed food consumption and non-alcoholic fatty liver disease, metabolic syndrome and insulin resistance: A systematic review. JHEP Rep. 2023, 6, 100964. [Google Scholar] [CrossRef]
- Rinella, M.E.; Sookoian, S. From NAFLD to MASLD: Updated naming and diagnosis criteria for fatty liver disease. J. Lipid Res. 2024, 65, 100485. [Google Scholar] [CrossRef]
- Petroni, M.L.; Brodosi, L.; Marchignoli, F.; Musio, A.; Marchesini, G. Moderate Alcohol Intake in Non-Alcoholic Fatty Liver Disease: To Drink or Not to Drink? Nutrients 2019, 11, 3048. [Google Scholar] [CrossRef]
- Sanyal, A.J.; Brunt, E.M.; Kleiner, D.E.; Kowdley, K.V.; Chalasani, N.; LaVine, J.E.; Ratziu, V.; McCullough, A. Endpoints and clinical trial design for nonalcoholic steatohepatitis. Hepatology 2011, 54, 344–353. [Google Scholar] [CrossRef]
- Institute for Health Metrics and Evaluation (IHME). Global Health Metrics. Total Burden Related to NAFLD Cause. 2021. Available online: https://www.healthdata.org/research-analysis/diseases-injuries-risks/factsheets/2021-total-burden-related-nafld-level-0 (accessed on 7 November 2024).
- Institute for Health Metrics and Evaluation GBD Results. GBD 2021—(IHME)—GBD Compare. 2021. Available online: https://vizhub.healthdata.org/gbd-compare/ (accessed on 7 November 2024).
- Talens, P.; Cámara, M.; Daschner, A.; López, E.; Marín, S.; Martínez, J.A.; Morales-Navas, F.J. Informe del Comité Científico de la Agencia Española de Seguridad Alimentaria y Nutrición (AESAN) sobre el impacto del consumo de alimentos “ultra-procesados” en la salud de los consumidores. Rev. Com. Cient. AESAN 2020, 31, 49–76. [Google Scholar]
- Poti, J.M.; Braga, B.; Qin, B. Ultra-processed Food Intake and Obesity: What Really Matters for Health-Processing or Nutrient Content? Curr. Obes. Rep. 2017, 6, 420–431. [Google Scholar] [CrossRef]
- Calcaterra, V.; Cena, H.; Rossi, V.; Santero, S.; Bianchi, A.; Zuccotti, G. Ultra-Processed Food, Reward System and Childhood Obesity. Children 2023, 10, 804. [Google Scholar] [CrossRef]
- Konieczna, J.; Morey, M.; Abete, I.; Bes-Rastrollo, M.; Ruiz-Canela, M.; Vioque, J.; Gonzalez-Palacios, S.; Daimiel, L.; Salas-Salvadó, J.; Fiol, M.; et al. Contribution of ultra-processed foods in visceral fat deposition and other adiposity indicators: Prospective analysis nested in the PREDIMED-Plus trial. Clin. Nutr. 2021, 40, 4290–4300. [Google Scholar] [CrossRef]
- Henney, A.E.; Gillespie, C.S.; Alam, U.; Hydes, T.J.; Cuthbertson, D.J. Ultra-Processed Food Intake Is Associated with Non-Alcoholic Fatty Liver Disease in Adults: A Systematic Review and Meta-Analysis. Nutrients 2023, 15, 2266. [Google Scholar] [CrossRef]
- Lodge, M.; Dykes, R.; Kennedy, A. Regulation of Fructose Metabolism in Nonalcoholic Fatty Liver Disease. Biomolecules 2024, 14, 845. [Google Scholar] [CrossRef] [PubMed]
- Stanhope, K.L. Role of fructose-containing sugars in the epidemics of obesity and metabolic syndrome. Annu. Rev. Med. 2012, 63, 329–343. [Google Scholar] [CrossRef] [PubMed]
- Quetglas-Llabrés, M.M.; Monserrat-Mesquida, M.; Bouzas, C.; García, S.; Mateos, D.; Casares, M.; Gómez, C.; Ugarriza, L.; Tur, J.A.; Sureda, A. Effects of a Two-Year Lifestyle Intervention on Intrahepatic Fat Reduction and Renal Health: Mitigation of Inflammation and Oxidative Stress, a Randomized Trial. Antioxidants 2024, 13, 754. [Google Scholar] [CrossRef] [PubMed]
- Brichacek, A.L.; Florkowski, M.; Abiona, E.; Frank, K.M. Ultra-Processed Foods: A Narrative Review of the Impact on the Human Gut Microbiome and Variations in Classification Methods. Nutrients 2024, 16, 1738. [Google Scholar] [CrossRef] [PubMed]
- Aerts, M.; Rosseel, Z.; De Waele, E. The Evolution in Non-Alcoholic Fatty Liver Disease Patients’ Profile and the Associated Sustainable Challenges: A Multidisciplinary Perspective. Nutrients 2024, 16, 1584. [Google Scholar] [CrossRef] [PubMed]
- Ahmed, I.A.; Mikail, M.A.; Mustafa, M.R.; Ibrahim, M.; Othman, R. Lifestyle interventions for non-alcoholic fatty liver disease. Saudi J. Biol. Sci. 2019, 26, 1519–1524. [Google Scholar] [CrossRef] [PubMed]
- NCT04442620—Prevention and Reversion of NAFLD in Obese Patients with Metabolic Syndrome by Mediterranean Diet and Physical Activity (FLIPAN). 2020. Available online: https://clinicaltrials.gov/ct2/show/NCT04442620 (accessed on 20 January 2022).
- The International Diabetic Federation (IDF). The IDF Consensus Worldwide Definition of Definition of the Metabolic Syndrome. 2022. Available online: http://www.idf.org/webdata/docs/IDF_Meta_def_final.pdf (accessed on 22 January 2022).
- Elosua, R.; Garcia, M.; Aguilar, A.; Molina, L.; Covas, M.I.; Marrugat, J.; Investigators of the MARATDON Group. Validation of the Minnesota Leisure Time Physical Activity Questionnaire in Spanish Women. Med. Sci. Sports Exerc. 2000, 32, 1431–1437. [Google Scholar] [CrossRef] [PubMed]
- Elosua, R.; Marrugat, J.; Molina, L.; Pons, S.; Pujol, E.; The MARATHOM Investigators. Validation of the Minnesota Leisure Time Physical Activity Questionnaire in Spanish men. Am. J. Epidemiol. 1994, 139, 1197–1209. [Google Scholar] [CrossRef]
- Reeder, S.B.; Sirlin, C.B. Quantification of liver fat with magnetic resonance imaging. Magn. Reason. Imaging Clin. N. Am. 2010, 18, 337–357. [Google Scholar] [CrossRef]
- Eskreis-Winkler, S.; Corrias, G.; Monti, S.; Zheng, J.; Capanu, M.; Krebs, S.; Fung, M.; Reeder, S.; Mannelli, L. IDEAL-IQ in an oncologic population: Meeting the challenge of concomitant liver fat and liver iron. Cancer Imaging 2018, 18, 51. [Google Scholar] [CrossRef]
- Monserrat-Mesquida, M.; Quetglas-Llabrés, M.; Abbate, M.; Montemayor, S.; Mascaró, C.M.; Casares, M.; Tejada, S.; Abete, I.; Zulet, M.A.; Tur, J.A.; et al. Oxidative Stress and Pro-Inflammatory Status in Patients with Non-Alcoholic Fatty Liver Disease. Antioxidants 2020, 9, 759. [Google Scholar] [CrossRef] [PubMed]
- Kleiner, D.E.; Brunt, E.M.; Van Natta, M.; Behling, C.; Contos, M.J.; Cummings, O.W.; Ferrell, L.D.; Liu, Y.-C.; Torbenson, M.S.; Unalp-Arida, A.; et al. Design and validation of a histological scoring system for nonalcoholic fatty liver disease. Hepatology 2005, 41, 1313–1321. [Google Scholar] [CrossRef] [PubMed]
- Martin-Moreno, J.M.; Boyle, P.; Gorgojo, L.; Maisonneuve, P.; Fernandez-Rodriguez, J.C.; Salvini, S.; Willett, W.C. Development and validation of a food frequency questionnaire in Spain. Int. J. Epidemiol. 1993, 22, 512–519. [Google Scholar] [CrossRef] [PubMed]
- Fernández-Ballart, J.D.; Piñol, J.L.; Zazpe, I.; Corella, D.; Carrasco, P.; Toledo, E.; Perez-Bauer, M.; Martínez-González, M.Á.; Salas-Salvadó, J. Relative validity of a semi-quantitative food-frequency questionnaire in an elderly Mediterranean population of Spain. Br. J. Nutr. 2010, 103, 1808–1816. [Google Scholar] [CrossRef]
- De la Fuente-Arrillaga, C.; Ruiz, Z.V.; Bes-Rastrollo, M.; Sampson, L.; Martinez-González, M.Á. Reproducibility of an FFQ validated in Spain. Public Health Nutr. 2010, 13, 1364–1372. [Google Scholar] [CrossRef]
- Moreiras, O.; Carbajal, A.; Cabrera, L.; Cuadrado, C. Tablas de Composición de Alimentos, Guía de Prácticas (Spanish Food Composition Tables), 17th ed.; Pirámide: Madrid, Spain, 2015. [Google Scholar]
- Mataix, J.; Mañas, M.; Llopis, J.; Martínez de Victoria, E.; Juan, J.; Borregón, A. Tablas de Composición de Alimentos (Spanish Food Composition Tables), 5th ed.; Universidad de Granada: Granada, Spain, 2013. [Google Scholar]
- Schröder, H.; Fitó, M.; Estruch, R.; Martínez-González, M.A.; Corella, D.; Salas-Salvadó, J.; Lamuela-Raventós, R.; Ros, E.; Salaverría, I.; Fiol, M.; et al. A short screener is valid for assessing Mediterranean diet adherence among older Spanish men and women. J. Nutr. 2011, 141, 1140–1145. [Google Scholar] [CrossRef]
- Schröder, H.; Zomeño, M.D.; Martínez-González, M.Á.; Salas-Salvadó, J.; Corella, D.; Vioque, J.; Romaguera, D.; Alfredo Martínez, J.; Tinahones, F.J.; López Miranda, J.; et al. Validity of the energy-restricted Mediterranean Diet Adherence Screener. Clin. Nutr. 2021, 40, 4971–4979. [Google Scholar] [CrossRef]
- Monteiro, C.A.; Cannon, G.; Levy, R.B.; Moubarac, J.-C.; Louzada, M.L.C.; Rauber, F.; Khandpur, N.; Cediel, G.; Neri, D.; Martinez-Steele, E.; et al. Ultra-processed foods: What they are and how to identify them. Public Health Nutr. 2019, 22, 936–941. [Google Scholar] [CrossRef]
- Konieczna, J.; Fiol, M.; Colom, A.; Martínez-Gonzáles, M.Á.; Salas-Salvadó, J.; Corella, D.; Soria-Florido, M.T.; Martínez, J.A.; Alonso-Gómez, Á.M.; Wärnberg, J.; et al. Does Consumption of Ultra-Processed Foods Matter for Liver Health? Prospective Analysis among Older Adults with Metabolic Syndrome. Nutrients 2022, 14, 4142. [Google Scholar] [CrossRef]
- García, S.; Pastor, R.; Monserrat-Mesquida, M.; Álvarez-Álvarez, L.; Rubín-García, M.; Martínez-Gonzáles, M.Á.; Salas Salvadó, J.; Corella Piquer, D.; Fitó Colomer, M.; Martínez Hernández, J.A.; et al. Ultra-processed foods consumption as a promoting factor of greenhouse gas emissions, water, energy, and land use: A longitudinal assessment. Sci. Total Environ. 2023, 891, 164417. [Google Scholar] [CrossRef]
- Fardet, A.; Rock, E. Ultra-Processed Foods and Food System Sustainability: What Are the Links? Sustainability 2020, 12, 6280. [Google Scholar] [CrossRef]
- Ashiqueali, S.A.; Zhu, X.; Wiesenborn, D.S.; Gesing, A.; Schneider, A.; Noureddine, S.A.; Correa-Garcia, C.G.; Masternak, M.M.; Siddiqi, S.A. Calorie restriction and life-extending mutation downregulate miR-34a to facilitate lipid metabolism in the liver. Exp. Gerontol. 2024, 194, 112506. [Google Scholar] [CrossRef] [PubMed]
- Montemayor, S.; Bouzas, C.; Mascaró, C.M.; Casares, M.; Llompart, I.; Abete, I.; Angullo-Martinez, E.; Zulet, M.Á.; Martínez, J.A.; Tur, J.A. Effect of Dietary and Lifestyle Interventions on the Amelioration of NAFLD in Patients with Metabolic Syndrome: The FLIPAN Study. Nutrients 2022, 14, 2223. [Google Scholar] [CrossRef] [PubMed]
- Yki-Järvinen, H. Nutritional Modulation of Non-Alcoholic Fatty Liver Disease and Insulin Resistance. Nutrients 2015, 7, 9127–9138. [Google Scholar] [CrossRef]
- Lian, C.Y.; Zhai, Z.Z.; Li, Z.F.; Wang, L. High fat diet-triggered non-alcoholic fatty liver disease: A review of proposed mechanisms. Chem. Biol. Interact. 2020, 330, 109199. [Google Scholar] [CrossRef]
- Global Food Research Program. Utlra-Processed Foods: A Global Threat to Public Health. 2023. Available online: https://www.globalfoodresearchprogram.org/wp-content/uploads/2023/11/GFRP_FactSheet_UltraProcessedFoods_2023_11.pdf (accessed on 29 July 2024).
- Aramburu, A.; Alvarado-Gamarra, G.; Cornejo, R.; Curi-Quinto, K.; Díaz-Parra, C.d.P.; Rojas-Limache, G.; Lanata, C.F. Ultra-processed foods consumption and health-related outcomes: A systematic review of randomized controlled trials. Front. Nutr. 2024, 11, 1421728. [Google Scholar] [CrossRef]
- Delli Bovi, A.P.; Marciano, F.; Mandato, C.; Siano, M.A.; Savoia, M.; Vajro, P. Oxidative Stress in Non-alcoholic Fatty Liver Disease. An Updated Mini Review. Front. Med. 2021, 8, 595371. [Google Scholar] [CrossRef]
- Dicken, S.J.; Batterham, R.L. Ultra-processed Food and Obesity: What Is the Evidence? Curr. Nutr. Rep. 2024, 13, 23–38. [Google Scholar] [CrossRef]
- Lv, J.-L.; Wei, Y.-F.; Sun, J.-N.; Shi, Y.-C.; Liu, F.-H.; Sun, M.-H.; Chang, Q.; Wu, Q.-J.; Zhao, Y.-H. Ultra-processed food consumption and metabolic disease risk: An umbrella review of systematic reviews with meta-analyses of observational studies. Front. Nutr. 2024, 11, 1306310. [Google Scholar] [CrossRef]
- Hou, K.; Wu, Z.X.; Chen, X.Y.; Wang, J.Q.; Zhang, D.; Xiao, C.; Zhu, D.; Koya, J.B.; Wei, L.; Li, J.; et al. Microbiota in health and diseases. Signal Transduct. Target Ther. 2022, 7, 135. [Google Scholar] [CrossRef]
- Makki, K.; Deehan, E.C.; Walter, J.; Bäckhed, F. The Impact of Dietary Fiber on Gut Microbiota in Host Health and Disease. Cell Host Microbe 2018, 23, 705–715. [Google Scholar] [CrossRef] [PubMed]
- Fichtel-Epstein, C.; Huang, J.; Rich, B.J.; Taswell, C.S.; Isrow, D.; Jin, W. Ultra-Processed Food and Prostate Cancer Risk: A Systemic Review and Meta-Analysis. Cancers 2024, 16, 3953. [Google Scholar] [CrossRef]
- Quetglas-Llabrés, M.M.; Monserrat-Mesquida, M.; Bouzas, C.; García, S.; Argelich, E.; Casares, M.; Ugarriza, L.; Llompart, I.; Tur, J.A.; Sureda, A. Impact of Adherence to the Mediterranean Diet on Antioxidant Status and Metabolic Parameters in NAFLD Patients: A 24-Month Lifestyle Intervention Study. Antioxidants 2024, 13, 480. [Google Scholar] [CrossRef]
- Anania, C.; Perla, F.M.; Olivero, F.; Pacifico, L.; Chiesa, C. Mediterranean diet and nonalcoholic fatty liver disease. World J. Gastroenterol. 2018, 24, 2083–2094. [Google Scholar] [CrossRef]
- Plauth, M.; Bernal, W.; Dasarathy, S.; Merli, M.; Plank, L.D.; Schütz, T.; Bischoff, S.C. ESPEN guideline on clinical nutrition in liver disease. Clin. Nutr. 2019, 38, 485–521. [Google Scholar] [CrossRef]
- Sangouni, A.A.; Hassani Zadeh, S.; Mozaffari-Khosravi, H.; Hosseinzadeh, M. Effect of Mediterranean diet on liver enzymes: A systematic review and meta-analysis of randomised controlled trials. Br. J. Nutr. 2022, 128, 1231–1239. [Google Scholar] [CrossRef]
- George, E.S.; Reddy, A.; Nicoll, A.J.; Ryan, M.C.; Itsiopoulos, C.; Abbott, G.; Johnson, N.A.; Sood, S.; Roberts, S.K.; Tierney, A.C. Impact of a Mediterranean diet on hepatic and metabolic outcomes in non-alcoholic fatty liver disease: The MEDINA randomised controlled trial. Liver. Int. 2022, 42, 1308–1322. [Google Scholar] [CrossRef]
- Vellinga, R.E.; van Bakel, M.; Biesbroek, S.; Toxopeus, I.B.; de Valk, E.; Hollander, A.; van’t Veer, P.; Temme, E.H.M. Evaluation of foods, drinks and diets in the Netherlands according to the degree of processing for nutritional quality, environmental impact and food costs. BMC Public Health 2022, 22, 877. [Google Scholar] [CrossRef]
- Lorca-Camara, V.; Bosque-Prous, M.; Batlle-Bayer, L.; Bes-Rastrollo, M.; O’Callaghan-Gordo, C.; Bach-Faig, A. Environmental and Health Sustainability of the Mediterranean Diet: A Systematic Review. Adv. Nutr. Int. Rev. J. 2024, 15, 100322. [Google Scholar] [CrossRef]
- García, S.; Bouzas, C.; Mateos, D.; Pastor, R.; Álvarez, L.; Rubín, M.; Martínez-González, M.Á.; Salas-Salvadó, J.; Corella, D.; Goday, A.; et al. Carbon dioxide (CO2) emissions and adherence to Mediterranean diet in an adult population: The Mediterranean diet index as a pollution level index. Environ. Health. 2023, 22, 1. [Google Scholar] [CrossRef]
- García, S.; Pastor, R.; Monserrat-Mesquida, M.; Álvarez-Álvarez, L.; Rubín-García, M.; Martínez-González, M.Á.; Salas-Salvadó, J.; Corella, D.; Goday, A.; Martínez, J.A.; et al. Metabolic syndrome criteria and severity and carbon dioxide (CO2) emissions in an adult population. Global Health 2023, 19, 50. [Google Scholar] [CrossRef] [PubMed]
- Lazo, M.; Clark, J.M. The epidemiology of nonalcoholic fatty liver disease: A global perspective. Semin Liver Dis. 2008, 28, 339–350. [Google Scholar] [CrossRef]
- Beygi, M.; Ahi, S.; Zolghadri, S.; Stanek, A. Management of Metabolic-Associated Fatty Liver Disease/Metabolic Dysfunction-Associated Steatotic Liver Disease: From Medication Therapy to Nutritional Interventions. Nutrients 2024, 16, 2220. [Google Scholar] [CrossRef]
- Targher, G.; Byrne, C.D.; Tilg, H. MASLD: A systemic metabolic disorder with cardiovascular and malignant complications. Gut 2024, 73, 691–702. [Google Scholar] [CrossRef]
- Ramaiah, P.; Jamel Baljon, K.; Alsulami, S.A.; Lindsay, G.M.; Chinnasamy, L. Diet quality indices and odds of metabolic dysfunction-associated fatty liver disease: A case-control study. Front. Nutr. 2024, 10, 1251861. [Google Scholar] [CrossRef]
- Younossi, Z.M.; Zelber-Sagi, S.; Henry, L.; Gerber, L.H. Lifestyle interventions in nonalcoholic fatty liver disease. Nat. Rev. Gastroenterol. Hepatol. 2023, 20, 708–722. [Google Scholar] [CrossRef]
- Quetglas-Llabrés, M.M.; Monserrat-Mesquida, M.; Bouzas, C.; Gómez, C.; Mateos, D.; Ripoll-Vera, T.; Tur, J.A.; Sureda, A. Inflammatory and Oxidative Stress Markers Related to Adherence to the Mediterranean Diet in Patients with Metabolic Syndrome. Antioxidants 2022, 11, 901. [Google Scholar] [CrossRef]
- Abdallah, J.; Assaf, S.; Das, A.; Hirani, V. Effects of anti-inflammatory dietary patterns on non-alcoholic fatty liver disease: A systematic literature review. Eur. J. Nutr. 2023, 62, 1563–1578. [Google Scholar] [CrossRef]
- Estruch, R.; Ros, E. The role of the Mediterranean diet on weight loss and obesity-related diseases. Rev. Endocr. Metab. Disord. 2020, 21, 315–327. [Google Scholar] [CrossRef]
- Salas-Salvadó, J.; Díaz-López, A.; Ruiz-Canela, M.; Basora, J.; Fitó, M.; Corella, D.; Serra-Majem, L.; Wärnberg, J.; Romaguera, D.; Estruch, R.; et al. Effect of a Lifestyle Intervention Program With Energy-Restricted Mediterranean Diet and Exercise on Weight Loss and Cardiovascular Risk Factors: One-Year Results of the PREDIMED-Plus Trial. Diabetes Care 2019, 42, 777–788. [Google Scholar] [CrossRef]
- Liu, Z.; Huang, H.; Zeng, Y.; Chen, Y.; Xu, C. Association between ultra-processed foods consumption and risk of non-alcoholic fatty liver disease: A population-based analysis of NHANES 2011-2018. Br. J. Nutr. 2023, 130, 996–1004. [Google Scholar] [CrossRef] [PubMed]
- Zhao, L.; Clay-Gilmour, A.; Zhang, J.; Zhang, X.; Steck, S.E. Higher ultra-processed food intake is associated with adverse liver outcomes: A prospective cohort study of UK Biobank participants. Am. J. Clin. Nutr. 2024, 119, 49–57. [Google Scholar] [CrossRef] [PubMed]
- Zhao, L.; Zhang, X.; Martinez Steele, E.; Lo, C.H.; Zhang, F.F.; Zhang, X. Higher ultra-processed food intake was positively associated with odds of NAFLD in both US adolescents and adults: A national survey. Hepatol. Commun. 2023, 7, e0240. [Google Scholar] [CrossRef]


| Maximum Reduction in %UPF Consumption § n = 23 | Medium Reduction in %UPF Consumption § n = 24 | Minimum Reduction in %UPF Consumption § n = 23 | p Value | |
|---|---|---|---|---|
| Sex Men Women | n (%) | |||
| 15 (65.2) | 16 (66.7) | 13 (56.5) | 0.741 | |
| 8 (34.8) | 8 (33.3) | 10 (43.5) | ||
| Educational Level Primary Secondary University | n (%) | |||
| 8 (34.8) | 9 (37.5) | 9 (39.2) | 0.798 | |
| 9 (39.1) | 11 (45.8) | 7 (30.4) | ||
| 6 (36.1) | 4 (16.7) | 7 (30.4) | ||
| Job situation Not working Working Retired | n (%) | |||
| 3 (13.0) | 4 (16.7) | 4 (17.4) | 0.651 | |
| 17 (73.9) | 17 (70.8) | 18 (78.3) | ||
| 3 (13.0) | 3 (12.5) | 1 (4.3) | ||
| Mean (SD) [CI] | ||||
| Age (years) | 50.8 (6.9) [47.8, 53.7] | 54.8 (6.7) [51.9, 57.6] | 52.4 (6.5) [49.5, 55.2] | 0.132 |
| Glucose (mL/dL) | 108.4 (17.9) | 112.1 (19.8) | 127.2 (72.9) | 0.320 |
| HbA1c (%) | 5.9 (0.8) | 6.1 (0.8) | 6.3 (2.1) | 0.663 |
| HDL (mg/dL) | 40.5 (7.3) | 41.1 (8.9) | 42.7 (11.1) | 0.696 |
| TG (mg/dL) | 210.7 (78.9) | 255.3 (441.5) | 199.1 (137.8) | 0.760 |
| WC (cm) | 113.6 (8.1) | 113.7 (9.6) | 110.9 (9.4) | 0.485 |
| BPsyst (mmHg) | 135.4 (15.4) | 138.4 (15.8) | 137.4 (19.9) | 0.832 |
| BPdias (mmHg) | 81.1 (10.2) | 84.3 (8.1) | 81.2 (8.1) | 0.380 |
| Maximum Reduction in %UPF Consumption § n = 23 | Medium Reduction in %UPF Consumption § n = 24 | Minimum Reduction in %UPF Consumption § n = 23 | Time * Group | ||
|---|---|---|---|---|---|
| Mean (SD) [CI] | Mean (SD) [CI] | Mean (SD) [CI] | |||
| Intrahepatic fat content (%) | Baseline 6 months ▲ | 17.9 (10.5) [13.4, 22.5] 10.3 (6.1) [7.6, 12.9] −7.7 (8.4) * d [−11.3, −4.1] | 15.1 (9.8) [10.9, 19.3] 11.8 (8.4) [7.7, 15.8] −3.1 (5.8) d [−5.9, −0.1] | 15.1 (9.7) [10.8, 19.2] 12.4 (7.5) [8.7, 16.1] −2.6 (8.9) [−6.9, 1.6] | 0.047 ^ |
| Steatosis level (grades) | Baseline 6 months ▲ | 1.9 (0.3) [1.7, 2.1] 1.3 (0.8) [0.9, 1.7] −0.6 (0.9) * [−1.1, −0.1] | 1.8 (0.5) [1.5, 2.1] 1.6 (0.7) [1.2, 1.9] −0.2 (0.8) [−0.6, 0.2] | 1.7 (0.5) [1.5, 1.9] 1.6 (0.8) [1.1, 2.1] −0.3 (0.6) [−0.6, 0.1] | 0.546 |
| Fibrosis level (grades) | Baseline 6 months ▲ | 1.1 (0.4) [0.8–1.2] 1.1 (0.5) [0.8–1.3] 0.1 (0.4) [−0.1, 0.2] | 1.3 (0.9) [0.8, 1.7] 1.2 (0.8) [0.7, 1.5] −0.1 (0.6) [−0.5, 0.2] | 1.3 (1.1) [0.8, 1.8] 1.7 (1.3) [0.8, 2.5] 0.8 (1.5) [−0.2, 1.7] | 0.197 |
| Stiffness of liver tissue (kPa) | Baseline 6 months ▲ | 4.7 (1.1) [4.3, 5.2] 5.1 (1.3) [4.4, 5.7] 0.2 (1.3) [−0.4, 0.8] | 5.3 (1.8) [4.4, 6.1] 5.4 (1.5) [4.6, 6.1] −0.1 (1.2) [−0.7, 0.7] | 5.1 (1.5) [4.4, 5.8] 5.7 (2.1) [4.4, 6.9] 0.8 (2.4) [−0.7, 2.3] | 0.849 |
| Weight (kg) | Baseline 6 months ▲ | 92.5 (11.8) [87.3, 97.4] 87.6 (11.1) [82.8, 92.4] −4.8 (3.5) * [−6.3, −3.3] | 95.2 (16.1) [88.4, 102, 1] 91.9 (15.9) [85.1, 98.5] −3.4 (4.5) * [−5.2, −1.4] | 94.5 (13.3) [88.7, 100.1] 91.9 (13.1) [86.3, 97.6] −2.5 (4.3) * [−4.3, −0.5] | 0.082 |
| Visceral fat (points) | Baseline 6 months ▲ | 13.5 (3.4) [12.1, 15.1] 12.8 (3.1) [11.4, 14.1] −1.1 (1.1) * [−1.6, −0.6] | 15.1 (3.7) [13.4, 16.7] 14.3 (3.5) [12.7, 15.7] −0.6 (1.4) * [−1.2, −0.1] | 13.1 (3.5) [11.5, 14.5] 12.6 (3.2) [11.2, 13.9] −0.4 (1.3) [−1.1, 0.1] | 0.101 |
| BMI (kg/m2) | Baseline 6 months ▲ | 33.1 (3.1) [31.7, 34.4] 31.7 (2.7) [30.4, 33.2] −1.4 (1.1) * [−2.1, −0.8] | 34.5 (4.1) [32.7, 36.3] 32.3 (3.6) [30.6, 34.1] −1.1 (1.7) * [−2.1, −0.3] | 33.4 (4.3) [31.5, 35.4] 31.8 (4.1) [30.1, 33.7] −1.1 (1.6) * [−1.8, −0.3] | 0.697 |
| Maximum Reduction in %UPF Consumption § n = 23 | Medium Reduction in %UPF Consumption § n = 24 | Minimum Reduction in %UPF Consumption § n = 23 | Time * Group | ||
|---|---|---|---|---|---|
| Mean (SD) [CI] | Mean (SD) [CI] | Mean (SD) [CI] | |||
| Adherence to Med-diet (points) | Baseline 6 months ▲ | 7.4 (2.7) [6.1, 8.5] 12.6 (2.7) [11.4, 13.7] 5.2 (2.9) * e [3.9, 6.4] | 8.4 (2.7) [7.2, 9.5] 12.3 (2.7) [11.1, 13.3] 3.8 (2.9) * [2.6, 5.1] | 8.7 (2.3) [7.6, 9.7] 11.2 (2.4) [10.1, 12.2] 2.5 (2.8) * e [1.3, 3.7] | 0.013 ^ |
| Vegetables (g/day) | Baseline 6 months ▲ | 242.7 (117.5) b [191.1, 293.4] 322.8 (128.9) [267.1, 378.5] 80.2 (116.5) * e [29.7, 130.5] | 298.9 (163.1) [230.1, 367.7] 371.7 (147.2) [309.5, 433.8] 72.8 (171.4) * [0.41, 145.1] | 408.4 (215.9) b [315.1, 501.8] 395.6 (214.7) [302.7, 488.4] −12.7 (109.5) e [−60.1, 34.5] | 0.055 |
| Fruits (g/day) | Baseline 6 months ▲ | 258.4 (184.5) [178.6, 338.2] 279.2 (164.7) [207.9, 350.3] 20.7 (175.1) [−54.9, 96.4] | 311.7 (232.8) [213.4, 410.1] 326.2 (195.7) [243.5, 408.8] 14.5 (154.8) [−50.9, 79.8] | 347.3 (211.6) [255.8, 438.8] 399.6 (256.1) [288.9, 510.3] 52.3 (180.2) [−25.6, 130.2] | 0.875 |
| Legumes (g/day) | Baseline 6 months ▲ | 23.5 (14.1) [17.4, 29.6] 29.8 (21.6) [20.3, 39.1] 6.2 (15.7) [−0.5, 13.1] | 20.6 (9.7) [16.6, 24.7] 36.4 (27.3) [24.8, 47.8] 15.7 (25.7) * [4.8, 26.6] | 22.9 (13.9) [16.9, 29.1] 34.3 (25.1) [23.3, 45.1] 11.3 (26.8) * [−0.2, 22.8] | 0.209 |
| Cereals (g/day) | Baseline 6 months ▲ | 136.1 (65.5) [107.7, 164.4] 144.7 (56.1) [120.5, 168.9] 8.7 (88.3) [−29.5, 46.8] | 108.5 (63.7) [81.5, 135.3] 113.6 (57.7) [89.2, 138.1] 5.1 (62.2) [−21.1, 31.4] | 139.4 (58.7) [113.9, 164.7] 143.8 (56.7) [119.2, 168.3] 4.4 (74.9) [−27.9, 36.8] | 0.937 |
| Dairy (g/day) | Baseline 6 months ▲ | 324.4 (215.1) [231.4, 417.4] 286.3 (142.1) [224.8, 347.7] −38.1 (230.2) [−137.6, 61.4] | 312.6 (182.4) [235.5, 389.5] 299.4 (151.5) [235.4, 363.4] −13.1 (164.9) [−82.7, 56.5] | 288.6 (211.1) [197.3, 379.9] 346.5 (243.6) [241.1, 451.8] 57.9 (188.5) [−23.6, 139.3] | 0.467 |
| Meat (g/day) | Baseline 6 months ▲ | 191.8 (89.8) [152.9, 230.6] 123.1 (56.6) [98.5, 147.5] −68.8 (85.6) * d e [−105.7, −31.7] | 166.5 (71.1) [136.5, 196.5] 143.8 (60.5) [118.2, 169.3] −22.7 (45.7) d [−42.1, −3.4] | 151.7 (67.9) [122.3, 181.1] 136.2 (77.1) [102.8, 169.4] −15.6 (65.2) e [−43.8, 12.6] | 0.008 ^ |
| Olive oil (g/day) | Baseline 6 months ▲ | 39.6 (19.3) b [31.2, 47.9] 38.6 (15.5) [31.8, 45.3] −1.1 (18.8) [−9.1, 7.1] | 32.9 (23.2) [23.1, 42.7] 32.2 (17.9) [24.5, 39.7] −0.8 (25.5) [−11.5, 9.9] | 23.8 (12.1) b [18.6, 29.1] 30.2 (13.9) [24.1, 36.2] 6.3 (12.2) [1.1, 11.6] | 0.596 |
| Fish (g/day) | Baseline 6 months ▲ | 96.5 (78.4) [62.5, 130.3] 130.7 (70.9) [100–1, 161.3] 34.2 (58.8) * [8.8, 59.6] | 95.5 (58.7) [70.6, 120.3] 140.9 (86.6) [104.3, 177.4] 45.4 (62.5) * f [18.9, 71.7] | 112.6 (70.7) [82.1, 143.1] 114.2 (67.6) [84.9, 143.4] 1.6 (48.1) f [−19.1, 22.3] | 0.050 |
| Nuts (g/day) | Baseline 6 months ▲ | 8.8 (11.7) [3.7, 13.9] 19.2 (22.8) b [9.3, 29.1] 10.3 (22.3) [0.7, 19.9] | 11.2 (14.9) [4.9, 17.5] 17.6 (15.3) c [11.1, 24.1] 6.4 (19.1) f [−1.7, 14.4] | 17.9 (17.2) [10.4, 25-3] 41.4 (31.2) b c [27.9, 54.8] 23.5 (33.9) * f [8.8, 38.1] | 0.049 ^ |
| Sweets and pastries (g/day) | Baseline 6 months ▲ | 30.1 (44.5) [10.8, 49.3] 6.5 (7.8) [3.1, 9.8] −23.7 (44.9) * e [−43.1, −4.2] | 17.9 (22.3) [8.4, 27.3] 11.7 (16.6) [4.7, 18.7] −6.2 (10.5) [−10.5, −1.7] | 9.2 (9.4) [5.1, 13.2] 14.6 (28.9) [2.1, 27.1] 5.4 (27.8) e [−6.6, 17.4] | 0.013 ^ |
| Non-processed foods (g/day) | Baseline 6 months ▲ | 1245.1 (375.1) [1082.8, 1407.2] b 1334.9 (347.2) b [1194.7, 1495.1] 99.8 (337.7) [−46.1, 245.8] | 1317.7 (457.9) [1124.3, 1368.8] 1487.8 (281.7) [1368.8, 1606.7] 170.1 (414.8) * [−5.1, 345.2] | 1530.1 (619.2) [1262.3, 1797.9] b 1646.5 (605.7) b [1384.5, 1908.4] 116.4 (271.5) [−1.1, 233.7] | 0.575 |
| Low-processed foods (g/day) | Baseline 6 months ▲ | 63.9 (34.3) a b [49.1, 78.7] 44.1 (17.3) [36.5, 51.5] −19.8 (30.2) * d e [−32.8, −6.7] | 40.4 (24.1) a [30.2, 50.5] 36.1 (18.4) [28.2, 43.8] −4.4 (25.1) d [−14.9, 6.2] | 36.8 (15.1) b [30.3, 43.4] 42.1 (24.3) [31.5, 52.5] 5.2 (20.8) e [−3.7, 14.2] | 0.008 ^ |
| High-processed foods (g/day) | Baseline 6 months ▲ | 349.5 (203.2) [261.6, 437.3] 225.4 (96.4) [183.7, 267.1] −124.1 (179.7) * d [−201.8, −46.4] | 291.3 (166.8) [220.8, 361.7] 261.6 (182.4) [184.5, 338.5] −29.7 (142.5) d f [−89.8, 30.4] | 482.6 (425.1) [298.7, 666.3] 272.1 (170.7) [198.2, 345.9] −210.5 (373.9) * f [−372.1, −48.7] | 0.043 ^ |
| Ultra-processed food (g/day) | Baseline 6 months ▲ | 492.6 (325.4) a b [351.8, 633.2] 92.7 (93.3) [52.3, 133.1] −399.8 (302.9) * d e [−530.7, 268.8] | 179.2 (156.4) a [113.1, 245.2] 115.3 (151.4) [51.3, 179.2] −63.9 (55.1) d f [−87.2, −40.6] | 124.2 (112.7) b [75.4, 172.9] 165.4 (162.7) [95.1, 235.7] 41.1 (67.7) e f [11.8, 70.4] | <0.001 ^ |
| Total energy (kcal/day) | Baseline 6 months ▲ | 2594.9 (634.1) a [2320.7, 2869.1] 1989.7 (416.2) b [1809.7, 2169.6] −605.3 (615.1) * d e [−871.2, 339.2] | 2055.2 (499.2) a [1844.3, 2265.9] 1965.9 (391.9) c [1800.4, 2131.4] −89.2 (523.8) d [−310.4, 131.9] | 2216.2 (568.5) [1970.3, 2462.1] 2425.8 (781.4) b c [2087.8, 2763.7] 209.5 (467.8) e [7.2, 411.8] | <0.001 ^ |
Disclaimer/Publisher’s Note: The statements, opinions and data contained in all publications are solely those of the individual author(s) and contributor(s) and not of MDPI and/or the editor(s). MDPI and/or the editor(s) disclaim responsibility for any injury to people or property resulting from any ideas, methods, instructions or products referred to in the content. |
© 2025 by the authors. Licensee MDPI, Basel, Switzerland. This article is an open access article distributed under the terms and conditions of the Creative Commons Attribution (CC BY) license (https://creativecommons.org/licenses/by/4.0/).
Share and Cite
García, S.; Monserrat-Mesquida, M.; Ugarriza, L.; Casares, M.; Gómez, C.; Mateos, D.; Angullo-Martínez, E.; Tur, J.A.; Bouzas, C. Ultra-Processed Food Consumption and Metabolic-Dysfunction-Associated Steatotic Liver Disease (MASLD): A Longitudinal and Sustainable Analysis. Nutrients 2025, 17, 472. https://doi.org/10.3390/nu17030472
García S, Monserrat-Mesquida M, Ugarriza L, Casares M, Gómez C, Mateos D, Angullo-Martínez E, Tur JA, Bouzas C. Ultra-Processed Food Consumption and Metabolic-Dysfunction-Associated Steatotic Liver Disease (MASLD): A Longitudinal and Sustainable Analysis. Nutrients. 2025; 17(3):472. https://doi.org/10.3390/nu17030472
Chicago/Turabian StyleGarcía, Silvia, Margalida Monserrat-Mesquida, Lucía Ugarriza, Miguel Casares, Cristina Gómez, David Mateos, Escarlata Angullo-Martínez, Josep A. Tur, and Cristina Bouzas. 2025. "Ultra-Processed Food Consumption and Metabolic-Dysfunction-Associated Steatotic Liver Disease (MASLD): A Longitudinal and Sustainable Analysis" Nutrients 17, no. 3: 472. https://doi.org/10.3390/nu17030472
APA StyleGarcía, S., Monserrat-Mesquida, M., Ugarriza, L., Casares, M., Gómez, C., Mateos, D., Angullo-Martínez, E., Tur, J. A., & Bouzas, C. (2025). Ultra-Processed Food Consumption and Metabolic-Dysfunction-Associated Steatotic Liver Disease (MASLD): A Longitudinal and Sustainable Analysis. Nutrients, 17(3), 472. https://doi.org/10.3390/nu17030472