
Cross-Sectional Comparative Analysis of Gut Microbiota in Spanish Adolescents with Mediterranean and Western Diets

 , ,
, ,  ,
,  ,
,  , ,
, ,  and
and
Abstract
1. Introduction
2. Materials and Methods
2.1. Study Design and Sample Selection
- –
- Inclusion criteria: healthy individuals aged 13 to <18 years, following their usual diet, whose parents/guardians were able to read and understand the questionnaires and agreed to sign the informed consent.
- –
- Exclusion criteria: individuals that did not follow their usual diet at the time of the fieldwork, that received antibiotic or probiotic treatment in the previous month, that did not provide a signed consent form for participation, or that did not complete any phase of the study.
2.2. Diet Quality Assessment
2.3. Analysis of Gut Microbiota
2.3.1. Comparative Functional Analysis
2.3.2. Comparative Analysis of Antibiotic Response
2.3.3. Metagenomic Analysis
2.4. Statistical Analysis
3. Results
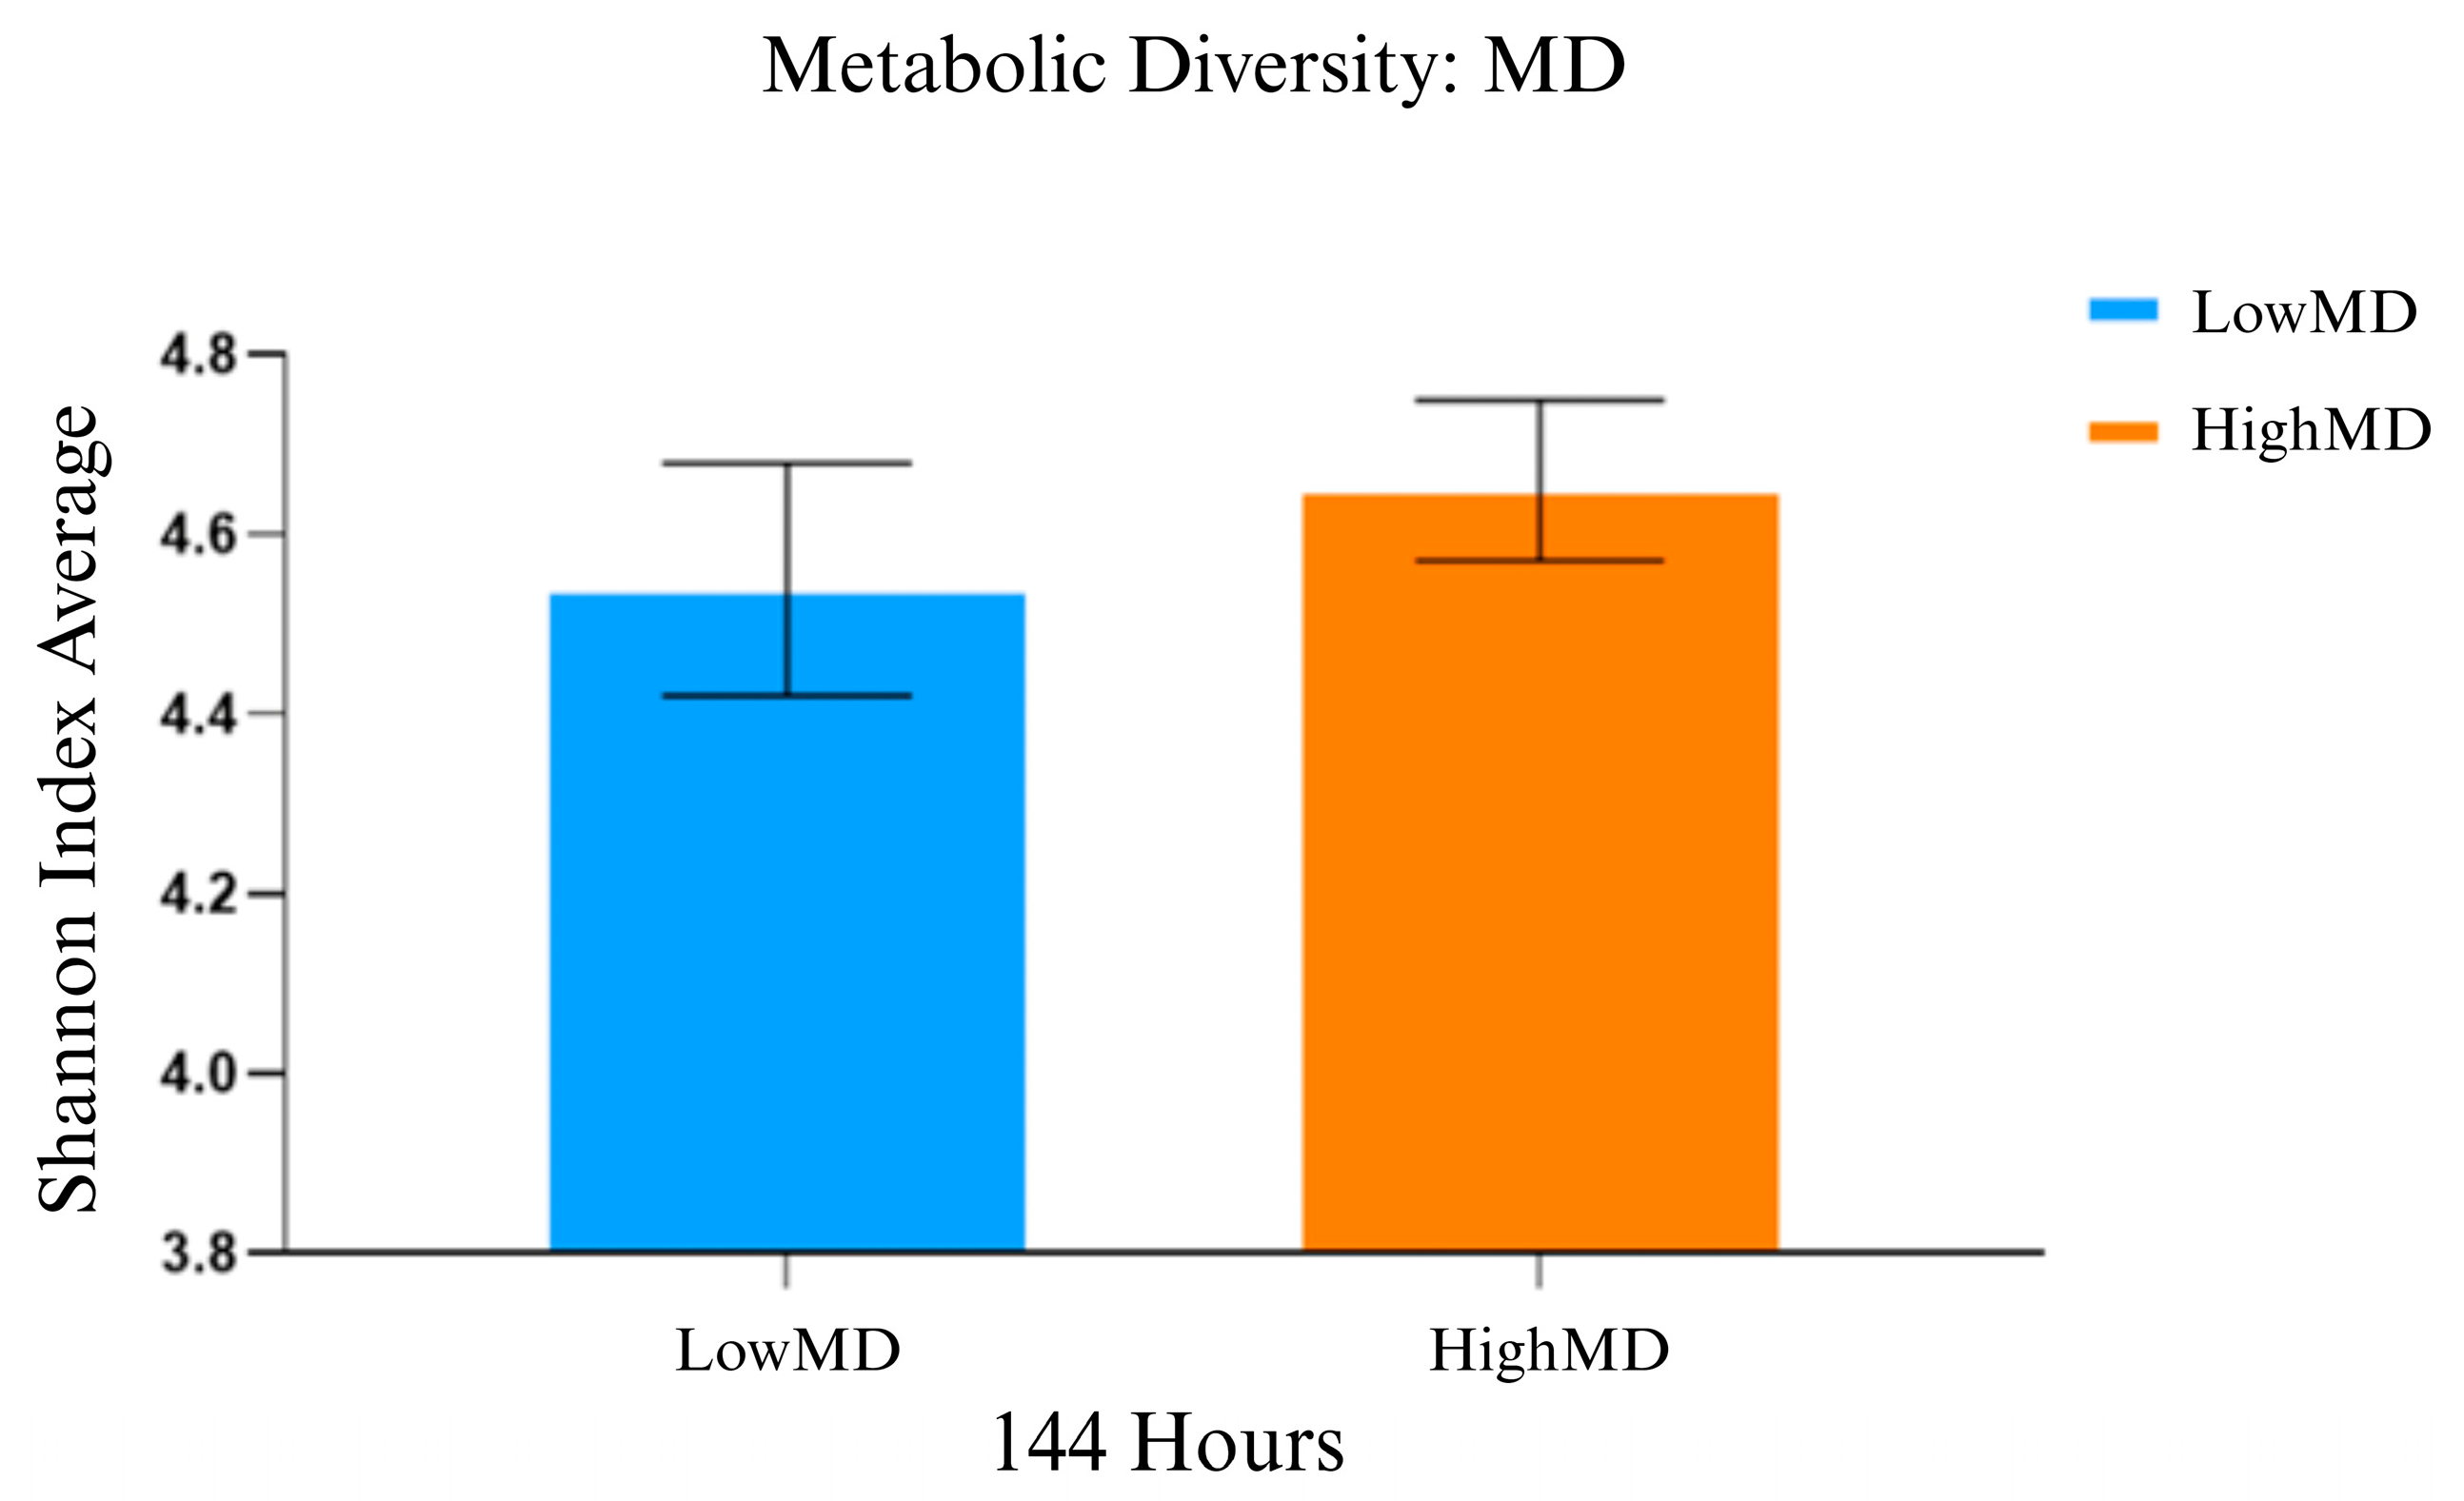
3.1. Comparative Functional Analysis
3.2. Comparative Analysis of Antibiotic Response
3.2.1. Aerobic Conditions
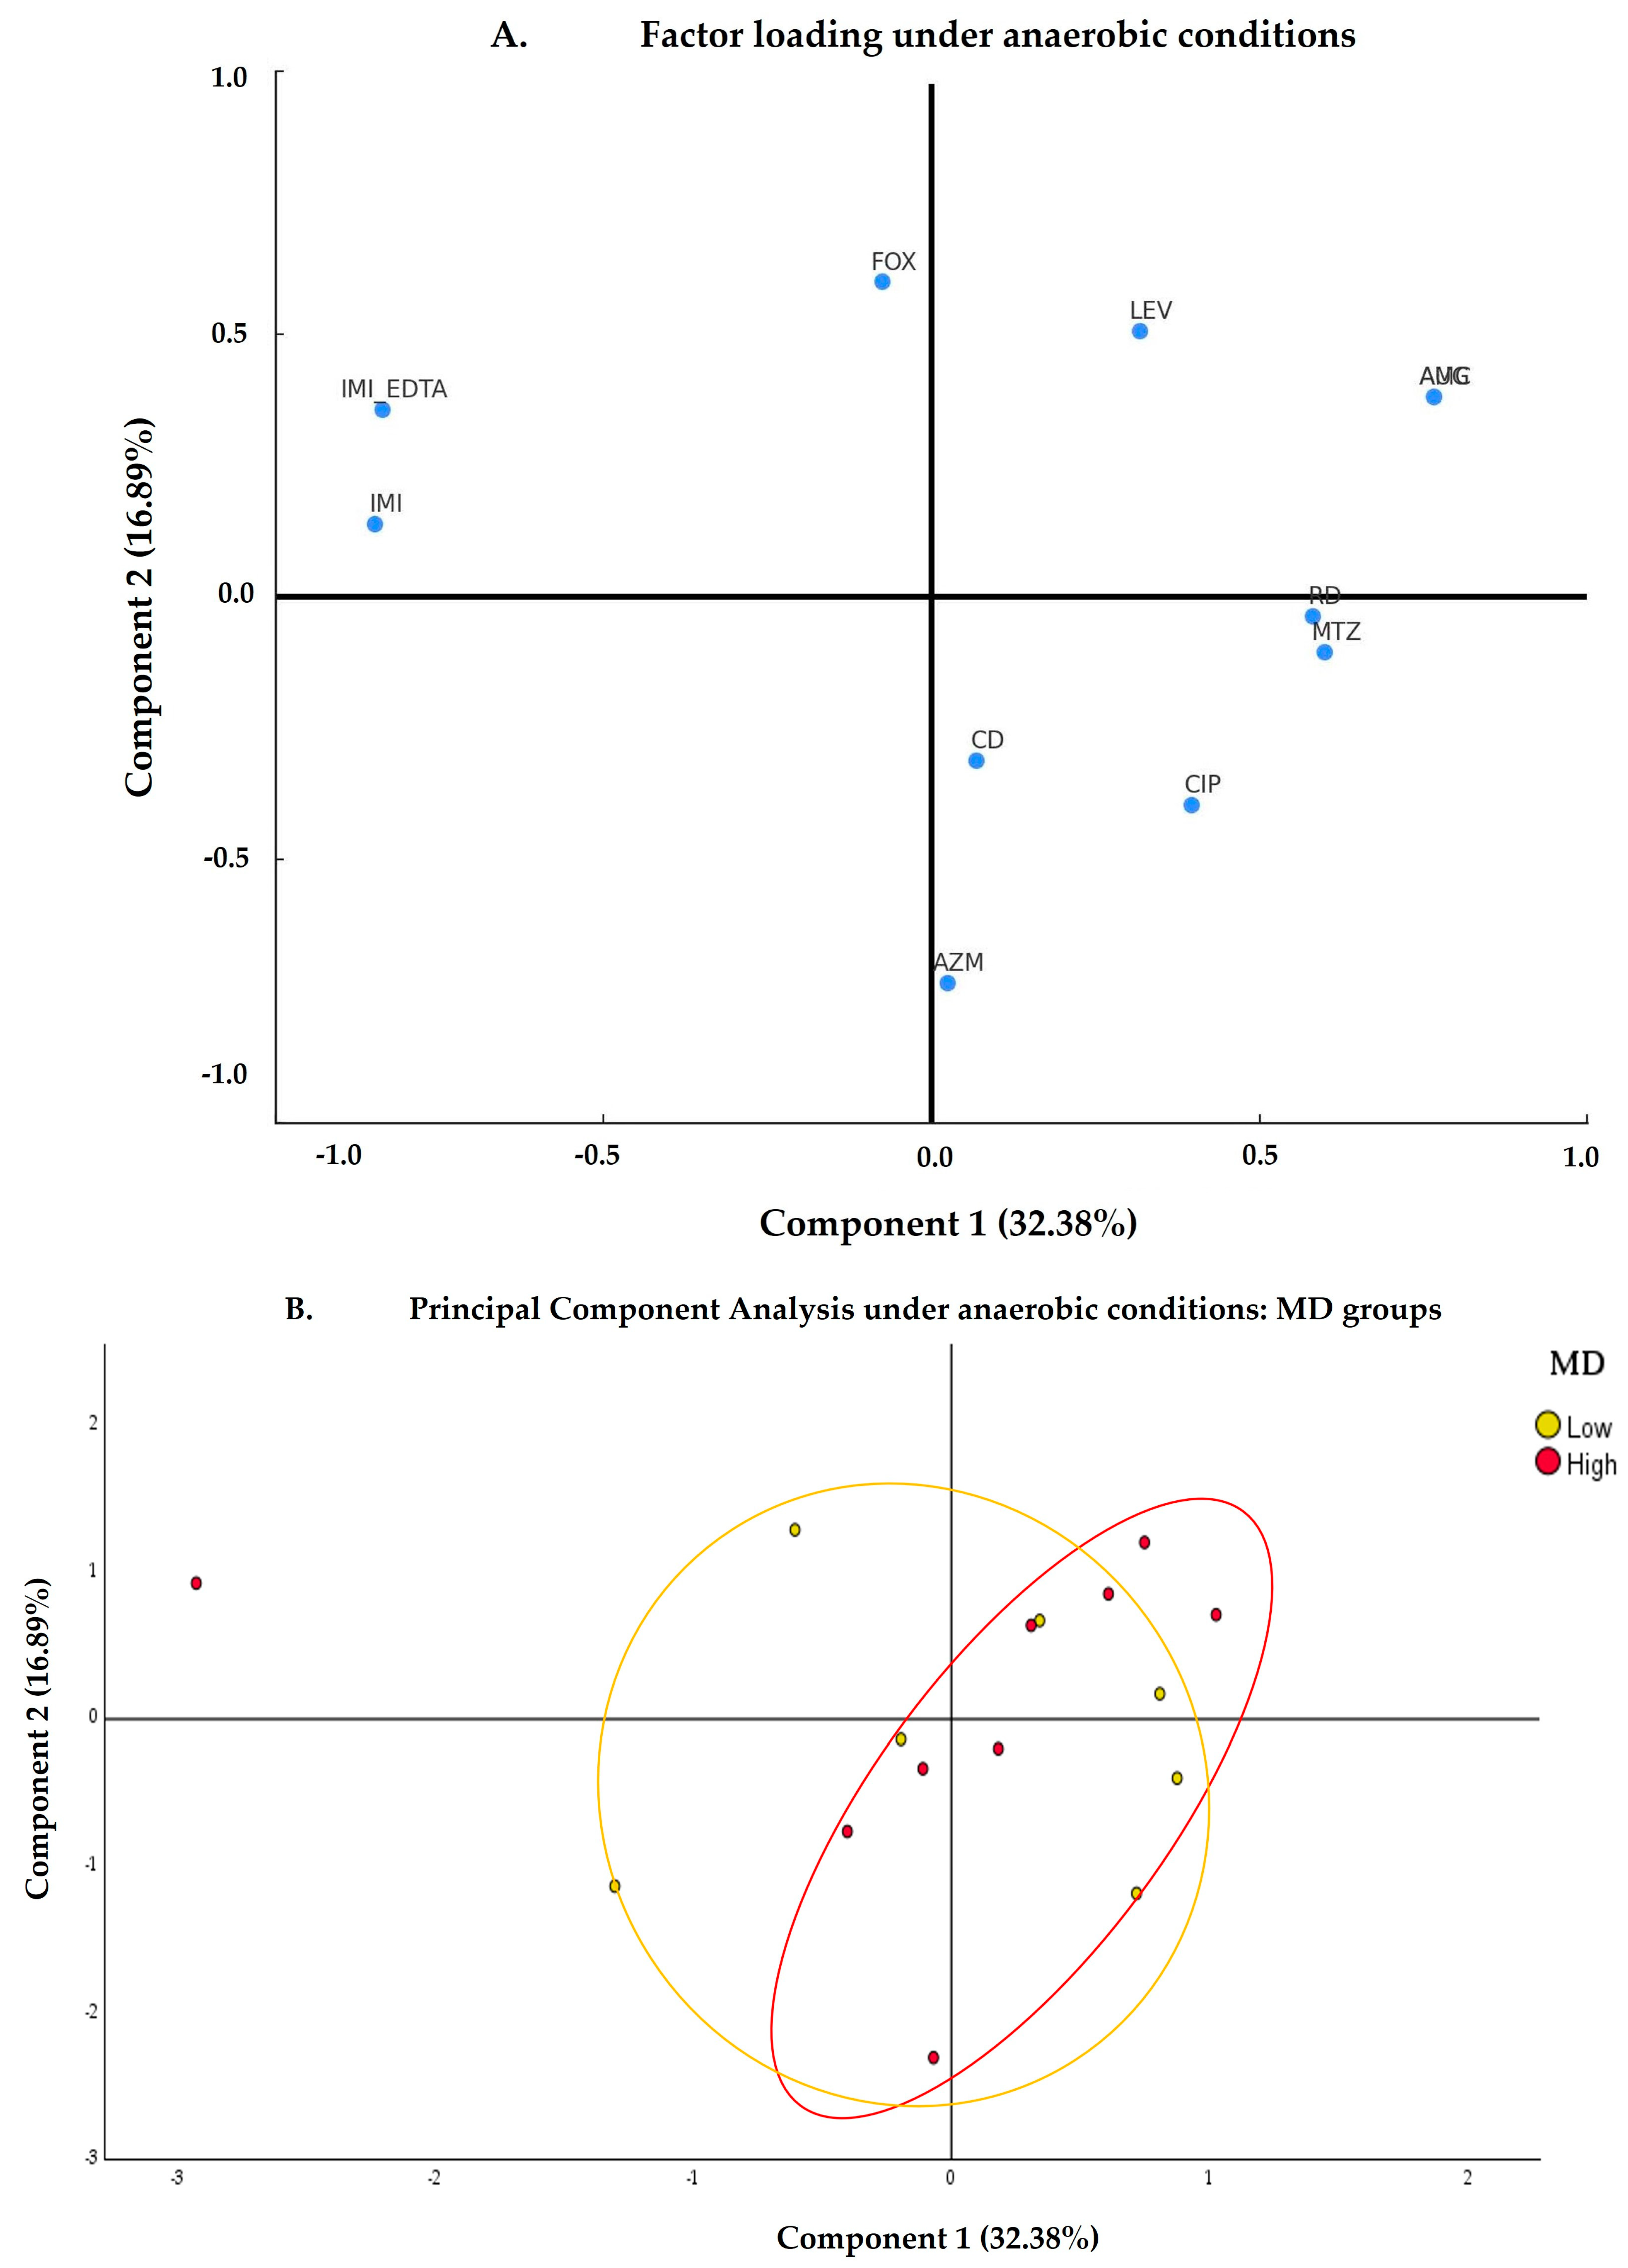
3.2.2. Anaerobic Conditions
3.3. Metagenomic Analysis
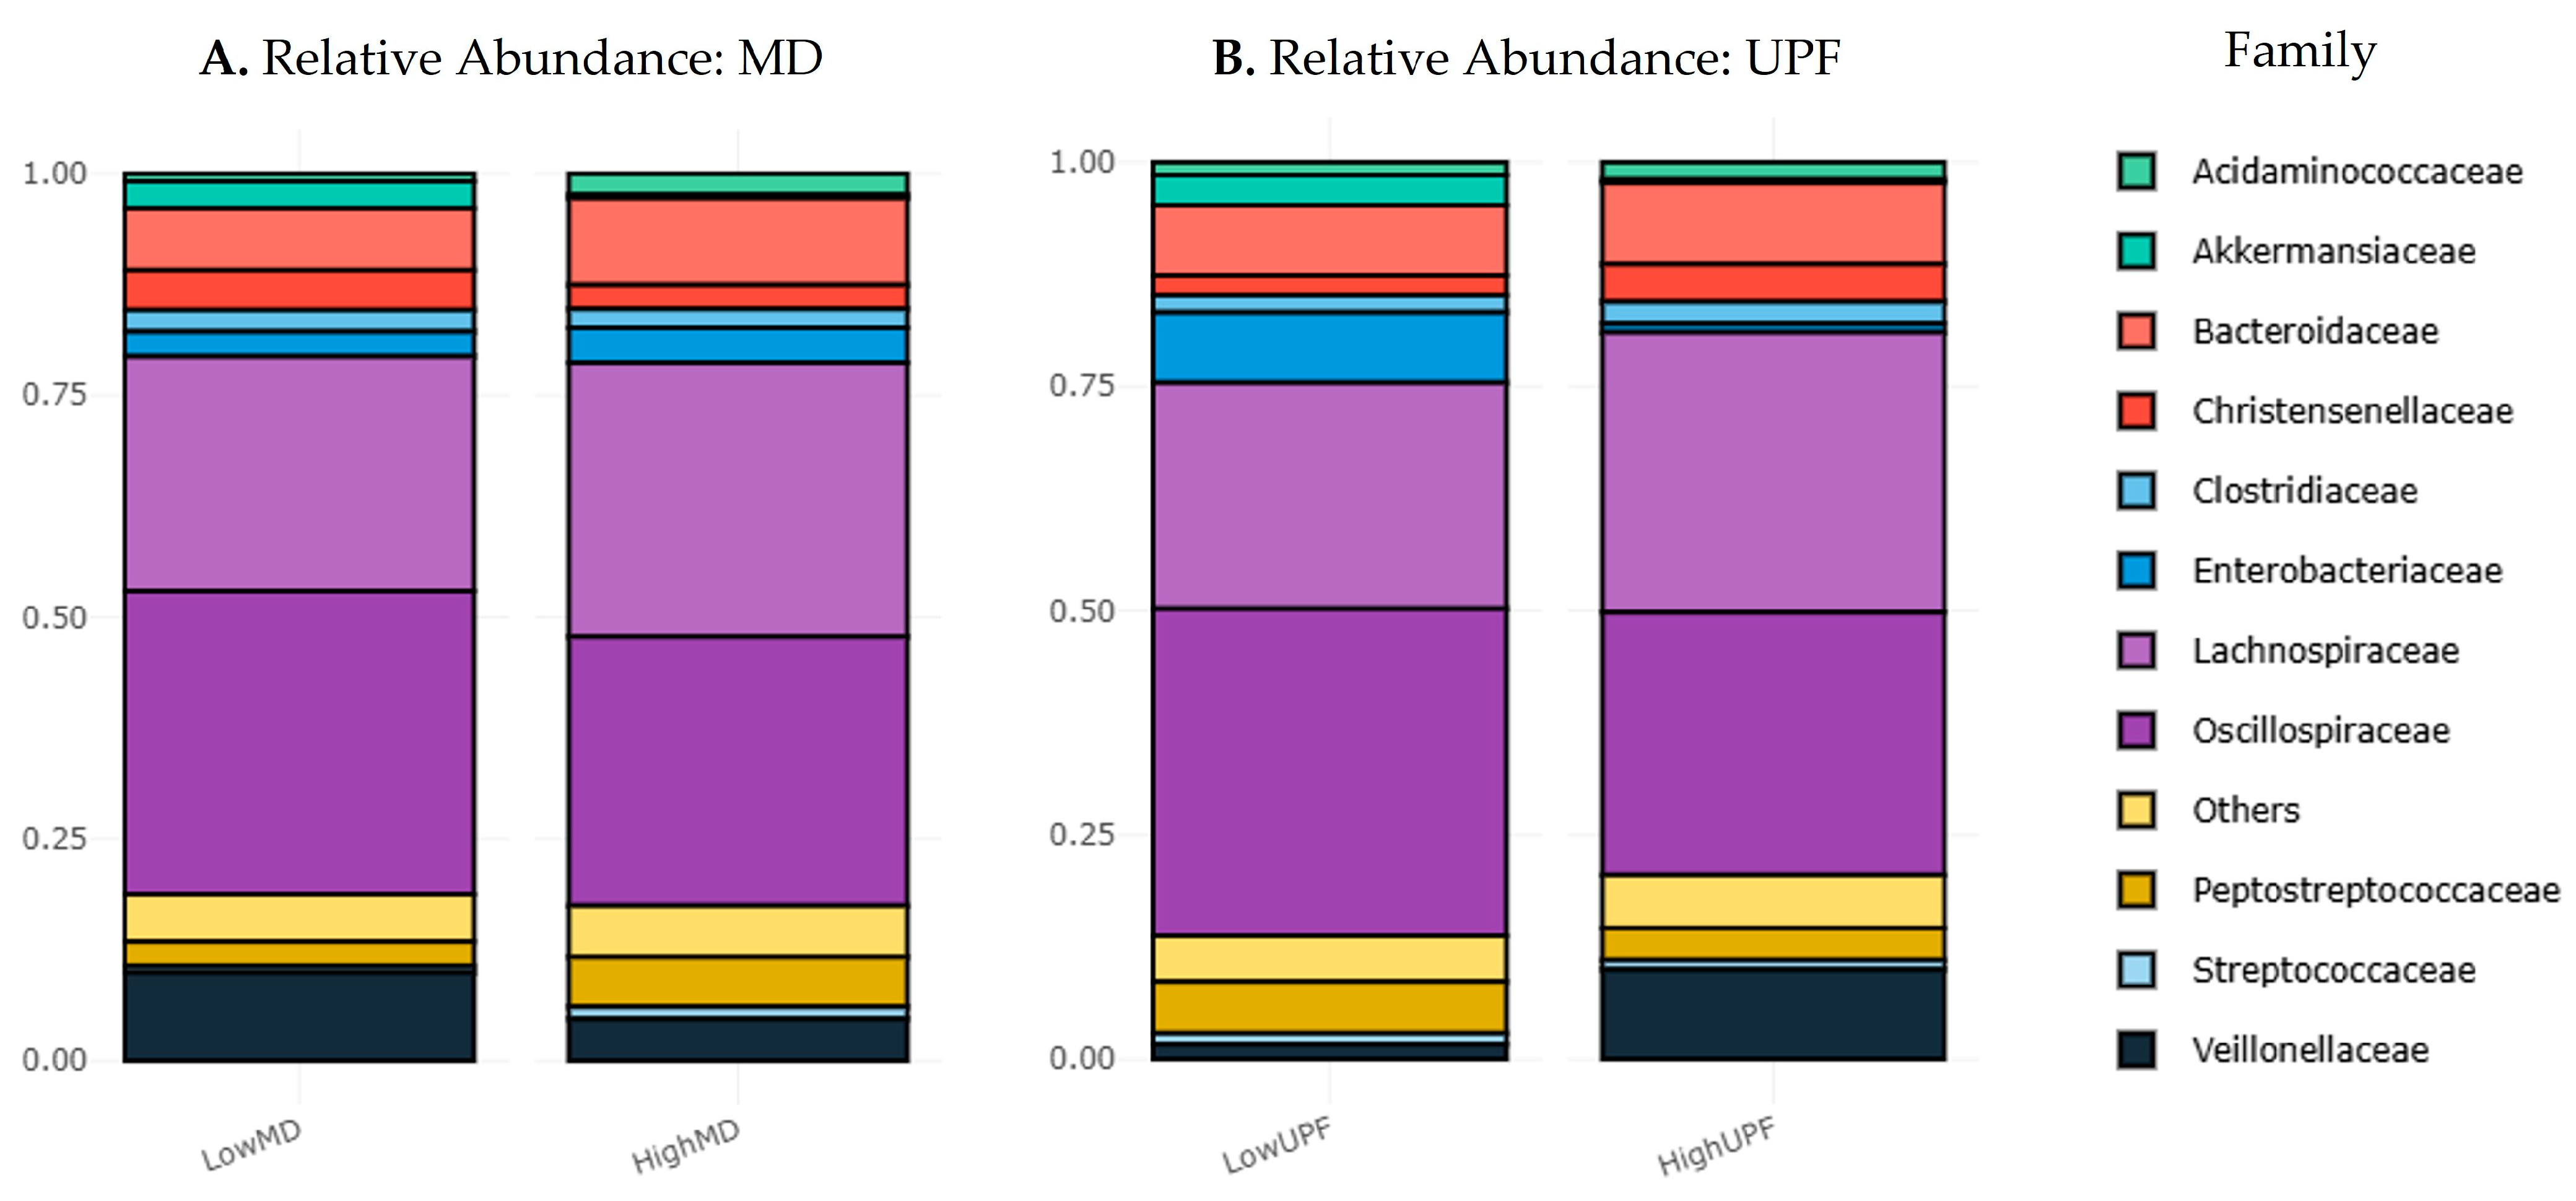
3.3.1. Relative Abundances
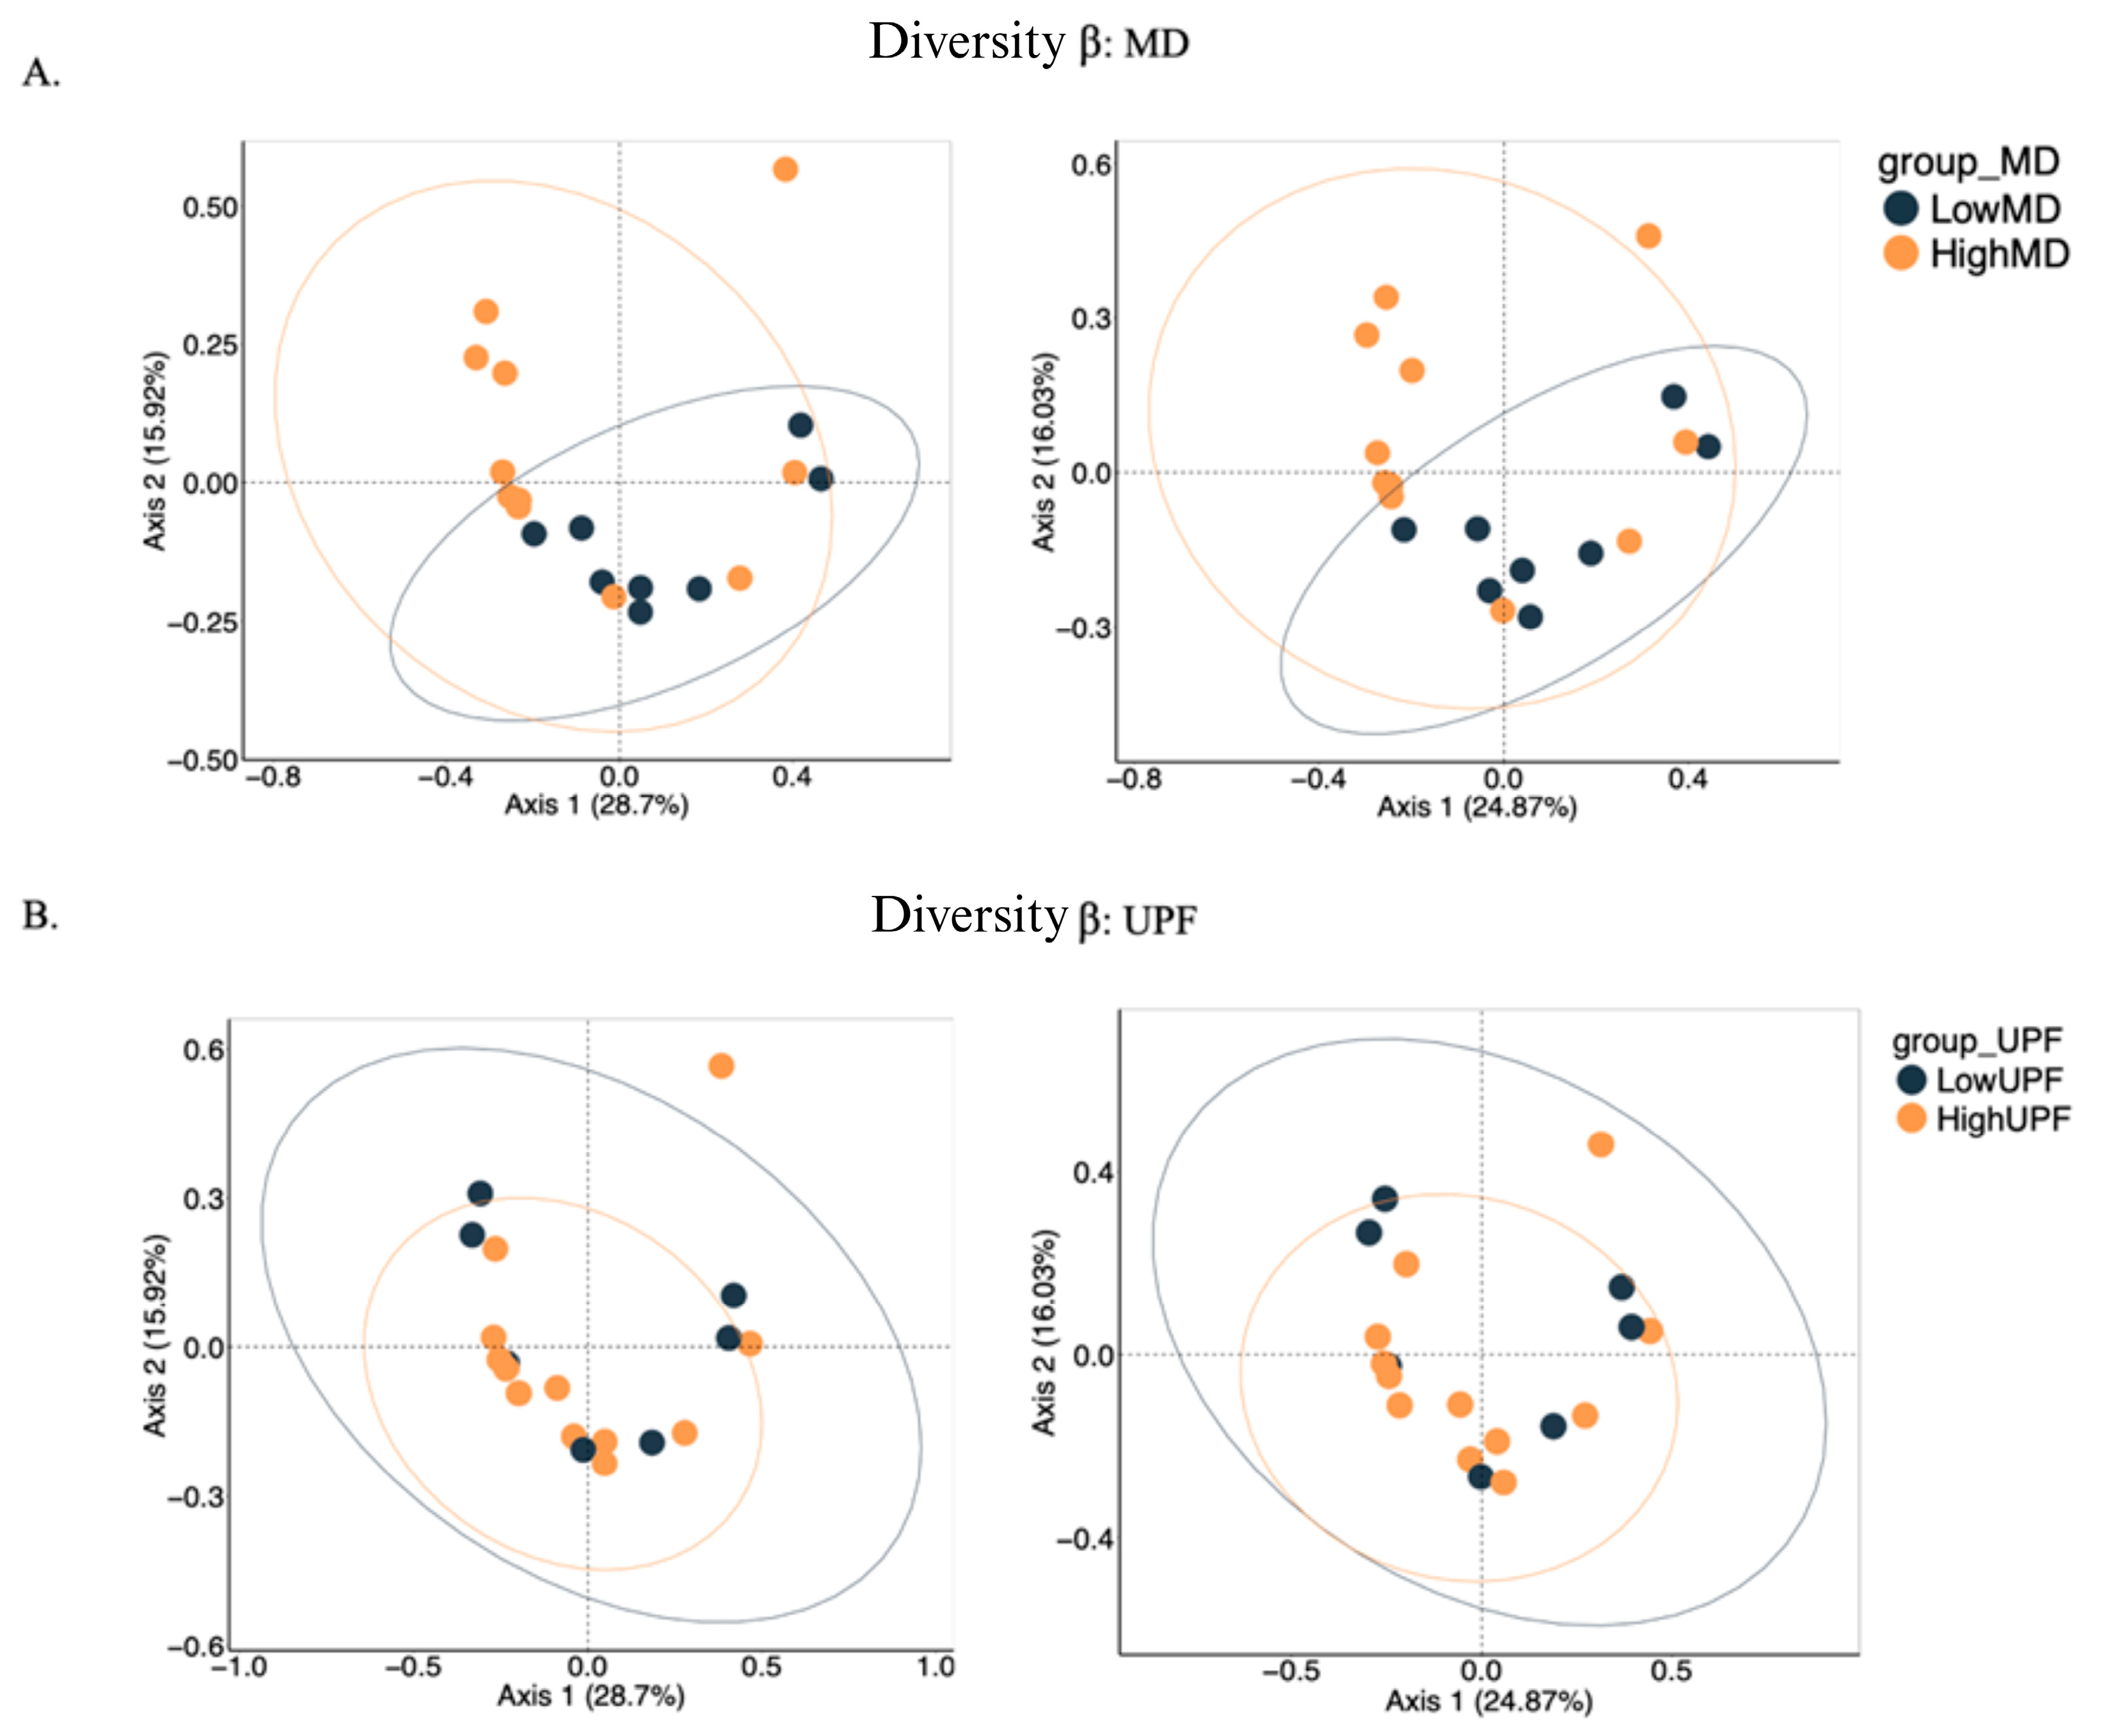
3.3.2. α- and β-Diversity
3.3.3. Diversity at the Genus Level
4. Discussion
Strengths and Limitations
5. Conclusions
Supplementary Materials
Author Contributions
Funding
Institutional Review Board Statement
Informed Consent Statement
Data Availability Statement
Conflicts of Interest
Abbreviations
| AK | Amikacin |
| AML | Amoxicillin |
| ARG | Antibiotic resistance genes |
| AUG | Amoxicillin/clavulanic acid |
| AWCD | Average well color development |
| AZM | Azithromycin |
| BC | Bray–Curtis |
| CAZ | Ceftazidime |
| CD | Clindamycin |
| CIP | Ciprofloxacin |
| CN | Gentamicin |
| CR | Cefpirome |
| FOX | Cefoxitin |
| IMI | Imipenem |
| IMI+EDTA | Imipenem + EDTA |
| LEV | Levofloxacin |
| MD | Mediterranean diet |
| MIC | Minimum inhibitory concentration |
| MTZ | Metronidazole |
| PCA | Principal component analysis |
| PCoA | Principal coordinates analysis |
| RD | Rifampicin |
| SCFAs | Short-chain fatty acids |
| TS | Sulfamethoxazole/trimethoprim |
| UPF | Ultra-processed foods |
| WD | Western diet |
References
- Heintz-Buschart, A.; Wilmes, P. Human Gut Microbiome: Function Matters. Trends Microbiol. 2018, 26, 563–574. [Google Scholar] [CrossRef] [PubMed]
- Fan, Y.; Pedersen, O. Gut Microbiota in Human Metabolic Health and Disease. Nat. Rev. Microbiol. 2021, 19, 55–71. [Google Scholar] [CrossRef] [PubMed]
- Round, J.L.; Mazmanian, S.K. The Gut Microbiota Shapes Intestinal Immune Responses during Health and Disease. Nat. Rev. Immunol. 2009, 9, 313–323. [Google Scholar] [CrossRef]
- Pilmis, B.; Le Monnier, A.; Zahar, J.-R. Gut Microbiota, Antibiotic Therapy and Antimicrobial Resistance: A Narrative Review. Microorganisms 2020, 8, 269. [Google Scholar] [CrossRef] [PubMed]
- Socała, K.; Doboszewska, U.; Szopa, A.; Serefko, A.; Włodarczyk, M.; Zielińska, A.; Poleszak, E.; Fichna, J.; Wlaź, P. The Role of Microbiota-Gut-Brain Axis in Neuropsychiatric and Neurological Disorders. Pharmacol. Res. 2021, 172, 105840. [Google Scholar] [CrossRef] [PubMed]
- Budden, K.F.; Shukla, S.D.; Rehman, S.F.; Bowerman, K.L.; Keely, S.; Hugenholtz, P.; Armstrong-James, D.P.H.; Adcock, I.M.; Chotirmall, S.H.; Chung, K.F. Functional Effects of the Microbiota in Chronic Respiratory Disease. Lancet Respir. Med. 2019, 7, 907–920. [Google Scholar] [CrossRef]
- Adolph, T.E.; Tilg, H. Western Diets and Chronic Diseases. Nat. Med. 2024, 30, 2133–2147. [Google Scholar] [CrossRef]
- Nardocci, M.; Leclerc, B.-S.; Louzada, M.-L.; Monteiro, C.A.; Batal, M.; Moubarac, J.-C. Consumption of Ultra-Processed Foods and Obesity in Canada. Can. J. Public Health 2019, 110, 4–14. [Google Scholar] [CrossRef]
- Rico-Campà, A.; Martínez-González, M.A.; Alvarez-Alvarez, I.; de Deus Mendonça, R.; De La Fuente-Arrillaga, C.; Gómez-Donoso, C.; Bes-Rastrollo, M. Association between Consumption of Ultra-Processed Foods and All Cause Mortality: SUN Prospective Cohort Study. Br. Med. J. 2019, 365, l1949. [Google Scholar] [CrossRef]
- Scrinis, G.; Monteiro, C.A. Ultra-Processed Foods and the Limits of Product Reformulation. Public Health Nutr. 2018, 21, 247–252. [Google Scholar] [CrossRef]
- Martínez-González, M.A.; Gea, A.; Ruiz-Canela, M. The Mediterranean Diet and Cardiovascular Health. Circ. Res. 2019, 124, 779–798. [Google Scholar] [CrossRef] [PubMed]
- No Time to Wait: Securing the Future from Drug-Resistant Infections. Report to the Secretary-General of the United Nations. Available online: https://www.who.int/publications/i/item/no-time-to-wait-securing-the-future-from-drug-resistant-infections (accessed on 20 January 2025).
- World Medical Association. World Medical Association Declaration of Helsinki. J. Am. Med. Assoc. 2013, 310, 2191. [Google Scholar] [CrossRef] [PubMed]
- Instituto Nacional de Estadística, Cifras de Población Provisionales a 01/07/2020. Available online: https://www.ine.es/dyngs/INEbase/es/operacion.htm?c=Estadistica_C&cid=1254736176951&menu=ultiDatos&idp=1254735572981 (accessed on 1 September 2021).
- von Elm, E.; Altman, D.G.; Egger, M.; Pocock, S.J.; Gøtzsche, P.C.; Vandenbroucke, J.P. The Strengthening the Reporting of Observational Studies in Epidemiology (STROBE) Statement: Guidelines for Reporting Observational Studies. Lancet 2007, 370, 1453–1457. [Google Scholar] [CrossRef] [PubMed]
- Serra-Majem, L.; Ribas, L.; Ngo, J.; Ortega, R.M.; García, A.; Pérez-Rodrigo, C.; Aranceta, J. Food, Youth and the Mediterranean Diet in Spain. Development of KIDMED, Mediterranean Diet Quality Index in Children and Adolescents. Public Health Nutr. 2004, 7, 931–935. [Google Scholar] [CrossRef] [PubMed]
- Martinez-Perez, C.; Daimiel, L.; Climent-Mainar, C.; Martínez-González, M.Á.; Salas-Salvadó, J.; Corella, D.; Schröder, H.; Martinez, J.A.; Alonso-Gómez, Á.M.; Wärnberg, J.; et al. Integrative Development of a Short Screening Questionnaire of Highly Processed Food Consumption (SQ-HPF). Int. J. Behav. Nutr. Phys. Act. 2022, 19, 6. [Google Scholar] [CrossRef] [PubMed]
- Garland, J.L. Analytical Approaches to the Characterization of Samples of Microbial Communities Using Patterns of Potential C Source Utilization. Soil Biol. Biochem. 1996, 28, 213–221. [Google Scholar] [CrossRef]
- Sofo, A.; Ricciuti, P. A Standardized Method for Estimating the Functional Diversity of Soil Bacterial Community by Biolog® EcoPlatesTM Assay—The Case Study of a Sustainable Olive Orchard. Appl. Sci. 2019, 9, 4035. [Google Scholar] [CrossRef]
- Mora, M.R.; Gómez, P.A.J.; Valbuena, C.; Probanza, A. Effect of the Type of Vitis Vinifera Cultivation in the Cenophenoresistome and Metabolic Profiling (CLPP) of Edaphic Bacterial Communities. J. Agric. Sci. Technol. A 2017, 7, 524–538. [Google Scholar] [CrossRef]
- Zhang, L.; Wang, P.; Huang, J.; Xing, Y.; Wong, F.S.; Suo, J.; Wen, L. Gut Microbiota and Therapy for Obesity and Type 2 Diabetes. Front. Endocrinol. 2024, 15, 1333778. [Google Scholar] [CrossRef]
- Barber, T.M.; Kabisch, S.; Pfeiffer, A.F.H.; Weickert, M.O. The Effects of the Mediterranean Diet on Health and Gut Microbiota. Nutrients 2023, 15, 2150. [Google Scholar] [CrossRef]
- van der Vossen, E.W.J.; Davids, M.; Bresser, L.R.F.; Galenkamp, H.; van den Born, B.-J.H.; Zwinderman, A.H.; Levin, E.; Nieuwdorp, M.; de Goffau, M.C. Gut Microbiome Transitions across Generations in Different Ethnicities in an Urban Setting—The HELIUS Study. Microbiome 2023, 11, 99. [Google Scholar] [CrossRef] [PubMed]
- Rosas-Plaza, S.; Hernández-Terán, A.; Navarro-Díaz, M.; Escalante, A.E.; Morales-Espinosa, R.; Cerritos, R. Human Gut Microbiome Across Different Lifestyles: From Hunter-Gatherers to Urban Populations. Front. Microbiol. 2022, 13, 843170. [Google Scholar] [CrossRef] [PubMed]
- Walker, R.L.; Vlamakis, H.; Lee, J.W.J.; Besse, L.A.; Xanthakis, V.; Vasan, R.S.; Shaw, S.Y.; Xavier, R.J. Population Study of the Gut Microbiome: Associations with Diet, Lifestyle, and Cardiometabolic Disease. Genome Med. 2021, 13, 188. [Google Scholar] [CrossRef]
- Carter, M.M.; Olm, M.R.; Merrill, B.D.; Dahan, D.; Tripathi, S.; Spencer, S.P.; Yu, F.B.; Jain, S.; Neff, N.; Jha, A.R.; et al. Ultra-Deep Sequencing of Hadza Hunter-Gatherers Recovers Vanishing Gut Microbes. Cell 2023, 186, 3111–3124.e13. [Google Scholar] [CrossRef] [PubMed]
- Nagpal, R.; Shively, C.A.; Register, T.C.; Craft, S.; Yadav, H. Gut Microbiome-Mediterranean Diet Interactions in Improving Host Health. F1000Research 2019, 8, 699. [Google Scholar] [CrossRef]
- Myhrstad, M.C.W.; Tunsjø, H.; Charnock, C.; Telle-Hansen, V.H. Dietary Fiber, Gut Microbiota, and Metabolic Regulation—Current Status in Human Randomized Trials. Nutrients 2020, 12, 859. [Google Scholar] [CrossRef]
- Clemente-Suárez, V.J.; Beltrán-Velasco, A.I.; Redondo-Flórez, L.; Martín-Rodríguez, A.; Tornero-Aguilera, J.F. Global Impacts of Western Diet and Its Effects on Metabolism and Health: A Narrative Review. Nutrients 2023, 15, 2749. [Google Scholar] [CrossRef]
- Ridaura, V.K.; Faith, J.J.; Rey, F.E.; Cheng, J.; Duncan, A.E.; Kau, A.L.; Griffin, N.W.; Lombard, V.; Henrissat, B.; Bain, J.R.; et al. Gut Microbiota from Twins Discordant for Obesity Modulate Metabolism in Mice. Science 2013, 341, 1241214. [Google Scholar] [CrossRef]
- Le Roy, T.; Llopis, M.; Lepage, P.; Bruneau, A.; Rabot, S.; Bevilacqua, C.; Martin, P.; Philippe, C.; Walker, F.; Bado, A.; et al. Intestinal Microbiota Determines Development of Non-Alcoholic Fatty Liver Disease in Mice. Gut 2013, 62, 1787–1794. [Google Scholar] [CrossRef]
- Britton, G.J.; Contijoch, E.J.; Mogno, I.; Vennaro, O.H.; Llewellyn, S.R.; Ng, R.; Li, Z.; Mortha, A.; Merad, M.; Das, A.; et al. Microbiotas from Humans with Inflammatory Bowel Disease Alter the Balance of Gut Th17 and RORγt+ Regulatory T Cells and Exacerbate Colitis in Mice. Immunity 2019, 50, 212–224.e4. [Google Scholar] [CrossRef]
- Wong, S.H.; Zhao, L.; Zhang, X.; Nakatsu, G.; Han, J.; Xu, W.; Xiao, X.; Kwong, T.N.Y.; Tsoi, H.; Wu, W.K.K.; et al. Gavage of Fecal Samples From Patients With Colorectal Cancer Promotes Intestinal Carcinogenesis in Germ-Free and Conventional Mice. Gastroenterology 2017, 153, 1621–1633.e6. [Google Scholar] [CrossRef] [PubMed]
- Asnicar, F.; Berry, S.E.; Valdes, A.M.; Nguyen, L.H.; Piccinno, G.; Drew, D.A.; Leeming, E.; Gibson, R.; Le Roy, C.; Al Khatib, H.; et al. Microbiome Connections with Host Metabolism and Habitual Diet from 1,098 Deeply Phenotyped Individuals. Nat. Med. 2021, 27, 321–332. [Google Scholar] [CrossRef] [PubMed]
- Ayesha, I.E.; Monson, N.R.; Klair, N.; Patel, U.; Saxena, A.; Patel, D.; Venugopal, S. Probiotics and Their Role in the Management of Type 2 Diabetes Mellitus (Short-Term Versus Long-Term Effect): A Systematic Review and Meta-Analysis. Cureus 2023, 15, e46741. [Google Scholar] [CrossRef]
- Wang, Q.; Wang, Z.; Pang, B.; Zheng, H.; Cao, Z.; Feng, C.; Ma, W.; Wei, J. Probiotics for the Improvement of Metabolic Profiles in Patients with Metabolic-Associated Fatty Liver Disease: A Systematic Review and Meta-Analysis of Randomized Controlled Trials. Front. Endocrinol. 2022, 13, 1014670. [Google Scholar] [CrossRef]
- Merra, G.; Noce, A.; Marrone, G.; Cintoni, M.; Tarsitano, M.G.; Capacci, A.; De Lorenzo, A. Influence of Mediterranean Diet on Human Gut Microbiota. Nutrients 2020, 13, 7. [Google Scholar] [CrossRef]
- Wu, G.D.; Compher, C.; Chen, E.Z.; Smith, S.A.; Shah, R.D.; Bittinger, K.; Chehoud, C.; Albenberg, L.G.; Nessel, L.; Gilroy, E. Comparative Metabolomics in Vegans and Omnivores Reveal Constraints on Diet-Dependent Gut Microbiota Metabolite Production. Gut 2016, 65, 63–72. [Google Scholar] [CrossRef]
- Rosés, C.; Cuevas-Sierra, A.; Quintana, S.; Riezu-Boj, J.I.; Martínez, J.A.; Milagro, F.I.; Barceló, A. Gut Microbiota Bacterial Species Associated with Mediterranean Diet-Related Food Groups in a Northern Spanish Population. Nutrients 2021, 13, 636. [Google Scholar] [CrossRef]
- Wang, R.; Chen, D.; Wang, F.; Fan, X.; Fan, C.; Tang, T.; Li, P.; Yang, M.; Zhao, Y.; Qi, K. An Insight into the Exploration of Proliferation of Antibiotic Resistance Genes in High-Fat Diet Induced Obesity Mice. Genomics 2021, 113, 2503–2512. [Google Scholar] [CrossRef]
- Jin, Q.; Black, A.; Kales, S.N.; Vattem, D.; Ruiz-Canela, M.; Sotos-Prieto, M. Metabolomics and Microbiomes as Potential Tools to Evaluate the Effects of the Mediterranean Diet. Nutrients 2019, 11, 207. [Google Scholar] [CrossRef]
- Xi, Y.; Jing, Z.; Wei, W.; Chun, Z.; Quan, Q.; Qing, Z.; Jiamin, X.; Shuwen, H. Inhibitory Effect of Sodium Butyrate on Colorectal Cancer Cells and Construction of the Related Molecular Network. BMC Cancer 2021, 21, 127. [Google Scholar] [CrossRef]
- Zhang, L.; Liu, C.; Jiang, Q.; Yin, Y. Butyrate in Energy Metabolism: There Is Still More to Learn. Trends Endocrinol. Metab. 2021, 32, 159–169. [Google Scholar] [CrossRef] [PubMed]
- Mangifesta, M.; Mancabelli, L.; Milani, C.; Gaiani, F.; de’Angelis, N.; de’Angelis, G.L.; van Sinderen, D.; Ventura, M.; Turroni, F. Mucosal Microbiota of Intestinal Polyps Reveals Putative Biomarkers of Colorectal Cancer. Sci. Rep. 2018, 8, 13974. [Google Scholar] [CrossRef] [PubMed]
- Johnson, A.J.; Vangay, P.; Al-Ghalith, G.A.; Hillmann, B.M.; Ward, T.L.; Shields-Cutler, R.R.; Kim, A.D.; Shmagel, A.K.; Syed, A.N.; Walter, J. Daily Sampling Reveals Personalized Diet-Microbiome Associations in Humans. Cell Host Microbe 2019, 25, 789–802.e5. [Google Scholar] [CrossRef] [PubMed]
- Calderón, D.; Cárdenas, P.A.; Prado-Vivar, B.; Graham, J.P.; Trueba, G. A Longitudinal Study of Dominant E. Coli Lineages and Antimicrobial Resistance in the Gut of Children Living in an Upper Middle-Income Country. J. Glob. Antimicrob. Resist. 2022, 29, 136–140. [Google Scholar] [CrossRef] [PubMed]
- Martinson, J.N.V.; Pinkham, N.V.; Peters, G.W.; Cho, H.; Heng, J.; Rauch, M.; Broadaway, S.C.; Walk, S.T. Rethinking Gut Microbiome Residency and the Enterobacteriaceae in Healthy Human Adults. Int. Soc. Microb. Ecol. J. 2019, 13, 2306–2318. [Google Scholar] [CrossRef]
- Benítez-Páez, A.; Portune, K.J.; Sanz, Y. Species-Level Resolution of 16S RRNA Gene Amplicons Sequenced through the MinIONTM Portable Nanopore Sequencer. Gigascience 2016, 5, s13742-016. [Google Scholar] [CrossRef]


| Total | Male | Female | |||||
|---|---|---|---|---|---|---|---|
| n | % | n | % | n | % | ||
| Total Population | 19 | 100 | 9 | 47.4 | 10 | 52.6 | |
| Adherence to MD (KIDMED test [16]) | Low MD | 8 | 42.1 | 4 | 21.1 | 4 | 21.1 |
| High MD | 11 | 57.9 | 5 | 26.3 | 6 | 31.6 | |
| UPF intake (SQ-HPF test [17]) | Low UPF | 9 | 47.4 | 6 | 31.6 | 3 | 15.8 |
| High UPF | 10 | 52.6 | 3 | 15.8 | 7 | 36.8 | |
Disclaimer/Publisher’s Note: The statements, opinions and data contained in all publications are solely those of the individual author(s) and contributor(s) and not of MDPI and/or the editor(s). MDPI and/or the editor(s) disclaim responsibility for any injury to people or property resulting from any ideas, methods, instructions or products referred to in the content. |
© 2025 by the authors. Licensee MDPI, Basel, Switzerland. This article is an open access article distributed under the terms and conditions of the Creative Commons Attribution (CC BY) license (https://creativecommons.org/licenses/by/4.0/).
Share and Cite
Redruello-Requejo, M.; del Mar Blaya, M.; González-Reguero, D.; Robas-Mora, M.; Arranz-Herrero, J.; Partearroyo, T.; Varela-Moreiras, G.; Penalba-Iglesias, D.; Jiménez-Gómez, P.; Reche-Sainz, P. Cross-Sectional Comparative Analysis of Gut Microbiota in Spanish Adolescents with Mediterranean and Western Diets. Nutrients 2025, 17, 388. https://doi.org/10.3390/nu17030388
Redruello-Requejo M, del Mar Blaya M, González-Reguero D, Robas-Mora M, Arranz-Herrero J, Partearroyo T, Varela-Moreiras G, Penalba-Iglesias D, Jiménez-Gómez P, Reche-Sainz P. Cross-Sectional Comparative Analysis of Gut Microbiota in Spanish Adolescents with Mediterranean and Western Diets. Nutrients. 2025; 17(3):388. https://doi.org/10.3390/nu17030388
Chicago/Turabian StyleRedruello-Requejo, Marina, María del Mar Blaya, Daniel González-Reguero, Marina Robas-Mora, Javier Arranz-Herrero, Teresa Partearroyo, Gregorio Varela-Moreiras, Diana Penalba-Iglesias, Pedro Jiménez-Gómez, and Paloma Reche-Sainz. 2025. "Cross-Sectional Comparative Analysis of Gut Microbiota in Spanish Adolescents with Mediterranean and Western Diets" Nutrients 17, no. 3: 388. https://doi.org/10.3390/nu17030388
APA StyleRedruello-Requejo, M., del Mar Blaya, M., González-Reguero, D., Robas-Mora, M., Arranz-Herrero, J., Partearroyo, T., Varela-Moreiras, G., Penalba-Iglesias, D., Jiménez-Gómez, P., & Reche-Sainz, P. (2025). Cross-Sectional Comparative Analysis of Gut Microbiota in Spanish Adolescents with Mediterranean and Western Diets. Nutrients, 17(3), 388. https://doi.org/10.3390/nu17030388