Abstract
Background: Unhealthy diets are major contributors to obesity and chronic diseases. In 2023, 50.7% of Chinese adults were overweight or obese, underscoring the need to strengthen healthy-eating intentions. Methods: We analysed a cross-sectional online survey of 1145 adults (18–64 years) from Henan and Shandong. Moderation was tested using multiple linear regression with mean-centred interaction terms between each Theory of Planned Behaviour (TPB) construct (attitude, subjective norms, and perceived behavioural control [PBC]) and each food-literacy component (production, choices, preparation and cooking, intake, disposal). Models were adjusted for age, occupation, marital status, alcohol use, physician-diagnosed chronic disease, and living with family. To address multicollinearity, we performed a ridge-regression robustness check (L2-regularised linear model; λ = 0.02 selected by 10-fold cross-validation; CV-RMSE = 0.483; CV-R2 = 0.631). We report B, SE, β, p-values, and R2/adjusted R2. Results: The overall food-literacy score did not significantly moderate the associations between attitude, subjective norms, or PBC and healthy-eating intention (p = 0.328, 0.671, 0.985). In component-wise analyses, only intake (intake) significantly moderated the PBC–intention association (B = 0.002, SE = 0.001, t = 2.497, p = 0.013); in the ridge model, the effect remained positive (β = 0.182; λ = 0.02). PBC (β = 0.459) and subjective norms (β = 0.169) were the strongest main-effect predictors. The best-fitting model explained R2 = 0.663 of the variance in intention (adjusted R2 = 0.663). Conclusions: Among adults in Henan and Shandong, the intake component of food literacy strengthened the association between PBC and healthy-eating intention, whereas overall food literacy showed no general moderating effect. Interventions should prioritise intake-related skills (e.g., portion planning, lower-sodium choices and nutrition label use) to enhance perceived behavioural control and, in turn, intention. Given the cross-sectional design, causal inference is limited; longitudinal, capability-building evaluations are warranted.
1. Introduction
Since 1978, when China launched its national “reform and opening-up” program of market-oriented economic reforms, agricultural output—including grain production—has increased substantially [1]. However, ensuring optimal nutritional health among residents continues to present substantial challenges. Inappropriate dietary habits have contributed to a growing incidence of chronic diseases, particularly cardiovascular diseases, stroke, and type 2 diabetes [2,3,4]. Insufficient intake of whole grains, vegetables, and fruits, combined with high salt intake, is considered a major cause of these conditions [1,5,6,7]. According to the Scientific Research Report on Dietary Guidelines for Chinese Residents (2021), excessive sodium intake, along with the rapidly increasing intake of red meat, is among the main dietary factors contributing to cardiovascular and metabolic mortality [8]. Obesity and diabetes have become increasingly severe public health concerns. In 2023, the prevalence of overweight and obesity among Chinese adults aged 18 years and above reached 50.7%, with 34.3% classified as overweight and 16.4% as obese [9]. In recent years, excess body weight has been strongly associated with rising rates of insulin resistance and diabetes among Chinese adults, with high body mass index (BMI) identified as the primary individual risk factor for diabetes in China [10,11,12,13].
With the rapid expansion of the national economy, advances in communication technologies, and the rise of platform-based economies, residents’ dietary patterns have shifted toward more convenience-oriented options. Online food delivery has become integral to daily intake—by December 2023, there were 545 million users nationwide (49.9% of all internet users) [14]. These structural changes, together with the high prevalence of overweight and obesity among adults in China (50.7% in 2023) [9], underscore growing public-health concerns and motivate the present focus on food literacy within the TPB framework. In this context, the significance of food literacy has become increasingly apparent.
Food literacy represents a crucial dimension of overall health literacy and plays a key role in improving dietary patterns and nutritional health among Chinese residents. The ability to comprehend food-related information determines not only how individuals choose and consume food, but also how effectively they manage, prepare, and cook it [15]. Although research on food literacy in China has expanded in recent years, it still lags behind that of developed countries. Notably, levels among young people remain relatively low; for example, a 2021 study in Shenzhen reported that only 19.52% of youths met adequacy on a food- and nutrition-literacy scale [16]. Food literacy is a key dimension of health literacy that shapes dietary patterns and nutritional health. Although definitions vary across the literature [15,17,18,19,20,21,22,23,24,25,26,27,28,29,30,31,32,33,34,35,36], we follow a widely cited international definition—that of Vidgen and Gallegos (2014)—which views food literacy as the interrelated knowledge, skills, and behaviours needed to plan, manage, select, prepare, and eat food to meet needs [15]. Aligning with this perspective and with our measurement tool, we operationalize food literacy across five food-system domains—production, distribution, selection, preparation and cooking, intake, and waste disposal—capturing decision making along the “farm to table” continuum and emphasizing actionable knowledge and skills. This operationalization and scoring approach are grounded in the validated instrument we draw upon (adult form; 0–4 Likert items; domain scores aggregated to a total score) and its conceptual framework of food literacy covering production to disposal. We therefore use the single term “food literacy” throughout, reserving original labels only when referring to specific instrument names [37].
The Theory of Planned Behaviour (TPB) explains intention through attitudes, subjective norms, and perceived behavioural control (PBC) (Ajzen, 1985) [38]. In 1991, Ajzen reformulated the model to emphasise the proximal relations among these constructs and behavioural intention. The revised TPB has been widely applied across health, consumer, and environmental domains [38,39,40], and numerous studies support its explanatory value for health-related intentions and consumer decision making [41,42]. Ajzen et al. (2011) further highlighted the role of accurate domain knowledge in shaping beliefs and, ultimately, intention within the TPB framework [43]. Building on this insight, Ölander and Thøgersen’s Motivation–Opportunity–Capability (MOC) model conceptualises capability—the knowledge and skills required to perform a behaviour—as both a direct determinant of behaviour and a moderator that can condition TPB pathways [44]. In dietary contexts, food literacy can be treated as a behavioural capability by improving the knowledge and skills needed to plan, select, prepare, and consume healthier options, it enhances perceived behavioural control and lowers execution barriers (e.g., time constraints and label comprehension), thereby strengthening healthy-eating intentions [45].
This study integrates food literacy into the TPB to examine how food literacy influences individuals’ intentions towards healthy eating. However, in the Chinese context there is limited empirical work that explicitly integrates food literacy—conceptualised as a behavioural capability—into the TPB and tests its moderating role; evidence that compares the five components of food literacy is particularly sparse, especially in regional adult samples. Therefore, this study aims to examine whether food literacy and its components moderate the relationships between TPB constructs (attitudes, subjective norms and perceived behavioural control) and healthy-eating intentions among Chinese adults, with data from Henan and Shandong. Specifically, we ask(1) does overall food literacy moderate the associations between TPB constructs and healthy-eating intention? and (2) do the five components (production, choices, preparation and cooking, intake and disposal) differentially moderate these associations?
2. Materials and Methods
2.1. Settings and Participants
The study protocol has been described in detail elsewhere [46,47,48,49]. Briefly, we conducted two waves of online surveys in 2023–2024 among adults residing in selected areas of the Henan and Shandong Provinces, China. Data collection was led by Chinese investigators in their home regions; the survey was minimal risk and approved by the PI’s home IRB (Sangmyung University, Seoul, Republic of Korea), with instruments translated, culturally adapted, and piloted for Chinese adults. Using a snowball sampling approach, questionnaires were distributed via QR codes and WeChat links. A total of 1252 Chinese adults completed the survey, which included an incentive. To ensure data quality, we applied five pre-specified screening criteria and excluded 107 respondents, yielding a final analytic sample of 1145 eligible participants. The study received institutional review board approval from Sangmyung University (IRB approval numbers: SMUIRBC-2023-001 [23 June 2023] and SMUIRBC-2024-024 [12 June 2024]).
2.2. Conceptual Framework
This study explored the impact of food literacy on the relationship between the three main components of planned behaviour theory (i.e., attitude, subjective norms, and perceived behaviour control) and behavioural intent (Figure 1). The research assumptions under the conceptual framework are as follows: First, attitudes, subjective norms, and perceptual behaviour control have a positive impact on healthy behavioural intentions. Second, food literacy has a positive impact on the relationship among attitude, subjective norms, PBC, and behavioural intentions. Third, the five components of food literacy (i.e., production, choices, preparation and cooking, intake, and disposal) have a positive impact on the relationship among attitude, subjective norms, perceptual behaviour control, and behavioural intent.
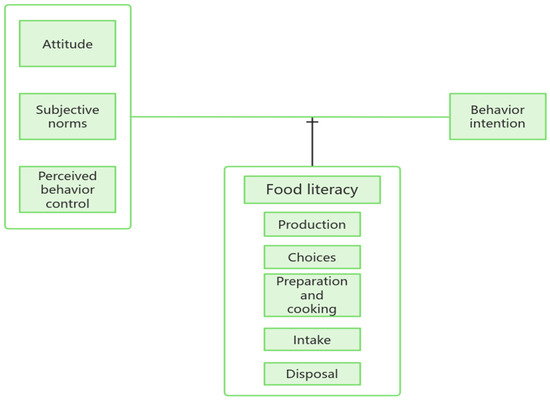
Figure 1.
Study conceptual framework.
Hypotheses (H1):
Attitudes, subjective norms, and perceived behavioural control (PBC) will be positively associated with healthy-eating intention, with PBC expected to be the strongest predictor based on prior TPB evidence.
Hypotheses (H2):
Overall food literacy will moderate the associations between TPB constructs and intention (i.e., stronger TPB–intention relations at higher rates of literacy).
Exploratory analyses: Given limited prior evidence at the domain level, we explored whether any of the five food-literacy domains (production, choices, preparation and cooking, consumption, and waste disposal) moderated the TPB–intention pathways without specifying a particular domain a priori.
2.3. Survey Instrument
2.3.1. TPB
According to the TPB, behavioural intention is determined by three core constructs: attitude, subjective norms, and perceived behavioural control (PBC). The development of the present questionnaire has been reported in detail elsewhere [46,47,48,49]. In brief, an expert panel adapted the instrument for Chinese adults through forward translation, review, and refinement, followed by a pilot test with nutrition-major students to ensure clarity and cultural appropriateness. To enhance content validity and coverage, we also drew on instruments previously validated in adolescent populations [50,51]. Our earlier work indicates that the instrument exhibits strong explanatory performance among Chinese adults [46,47,48,49], supporting its use in the current study.
A total of 24 items for the three components of TPB were all measured by using the Likert 5-point scale. The scale for intention ranges from easily possible (5) to impossible (1), and the scale for attitude, subjective norms, and PBC ranges from completely agree (5) to completely disagree (1). When the conceptual direction is opposite to the other items, the scale is set in the opposite direction. Reliability was verified to understand the internal consistency between the questionnaire items, and Cronbach’s α-coefficient was found to be 0.881 for attitude (6 questions), 0.913 for subjective norm (8 questions), and 0.819 for perceived behavioural control (4 questions).
2.3.2. Food Literacy
Food literacy measure (origin, adaptation, and precedent in Chinese adults). We assessed food literacy using a comprehensive instrument originally developed and validated in Korea and organised into five domains—production, selection/choices, preparation and cooking, intake, and disposal—with 25 items rated on five-point Likert scales [52]. For use in the present study, the wording was adapted for mainland Chinese adults through forward translation, expert review, and a small pilot to ensure clarity and cultural appropriateness, while preserving the original domain structure and response anchors. Importantly, this Korean-developed scale has already been applied to Chinese adults in an independent study from Shandong Province, which reported graded increases in TPB constructs across food-literacy rank groups and a consistent, positive association of perceived behavioural control with healthy-eating intention after covariate adjustment—patterns that support the instrument’s construct validity in this population [53].
The five components of food literacy, the scale of production, selection, preparation and cooking, ingestion, and disposal, range from yes (4) to not at all (0). Reliability was verified to understand the internal consistency between the questionnaire items, and Cronbach’s α-coefficient was found to be 0.899 for production (7 questions), 0.832 for selection (5 questions), 0.873 for preparation and cooking (7 questions), 0.801 for intake (3 questions), and 0.812 for disposal (3 questions).
2.4. Other Variables
Demographic characteristics include gender (i.e., male and female), age (year), height (cm), weight (kg), monthly average income level (≤5000 CNY, 5,001–10,000 CNY, ≥10,001 CNY), alcohol intake within the year (no drinking experience, once, or more than one time), education level (i.e., high school or lower, university or higher), residence (i.e., first-tier cities, second-tier cities, third-tier cities, and other areas), disease diagnosed by a doctor (without and with), and the number of family members living together (person). Height and weight were used to calculate and distinguish the BMI (kg/m2), and the BMI categories were divided into <18.5 kg/m2, 18.5–22.99 kg/m2, 23.0–24.99 kg/m2, and >25.0 kg/m2 [51]. This standard differs from the World Health Organization (WHO) criteria, considering that the Chinese standard adopts a stricter definition of overweight and obesity to better align with the health characteristics of the Asian population.
2.5. Instrument Adaptation, Reliability, and Validity
Questionnaires were translated and culturally adapted by a bilingual expert panel; a pilot with nutrition-major students confirmed comprehensibility. Internal consistency (Cronbach’s α) was acceptable across constructs (e.g., attitude α = 0.881; subjective norms α = 0.913; PBC α = 0.819; intention α = 0.840; food-literacy domains α ≈ 0.80–0.90; and overall FL α = 0.957). Confirmatory factor analysis (CFA) supported the intended factor structures for TPB and food-literacy measures (global fit indices reported in the Results: e.g., CFI/IFI > 0.90; RMSEA ≈ 0.06; and SRMR < 0.05). Convergent validity was evaluated via standardised loadings, composite reliability (CR), and average variance extracted (AVE).
2.6. Statistical Analysis
We first screened the data for completeness and quality and used complete-case analysis. Descriptive statistics summarised participant characteristics and scale scores (mean ± SD; n, %). Group differences in behavioural intention were examined with independent-samples t-tests (binary factors) and one-way ANOVA (multi-level factors), reporting t/F, df, and p.
Measurement properties were assessed via confirmatory factor analysis (CFA) for TPB and food-literacy constructs; we report standardised loadings, CR/AVE, and global fit indices (e.g., CFI/TLI/IFI, RMSEA with 90% CI, SRMR). Internal consistency used Cronbach’s α.
To test moderation, we fit linear models including main effects (attitude, subjective norms, PBC, food-literacy domain[s]) and interaction terms (e.g., PBC × intake), adjusting for age, marital status, occupation, alcohol use, living with family, and physician-diagnosed chronic disease. Because VIFs indicated multicollinearity among TPB predictors and interactions, we used ridge regression (L2-regularised linear models) with standardised, mean-centred continuous variables and an unpenalised intercept. The penalty (λ) was selected by 10-fold cross-validation and inspection of the ridge trace; the final model used λ = 0.02 with CV-RMSE = 0.483 and CV-R2 = 0.631. We report unstandardised B, standardised β, 95% CIs, and p-values. Analyses were conducted in SPSS(29)/AMO(26) (descriptives, CFA) and R (glmnet) for ridge models.
3. Results
3.1. General Characteristics of Survey Subjects
The demographic characteristics of the 1145 subjects are summarized in Table 1. The sex distribution was nearly equal, with men accounting for 50.9% (n = 583) of the sample. Subjects aged 18–29 years comprised 35.8% of the study population. The proportions of underweight, overweight, and obese individuals were 14.0%, 18.7%, and 9.3%, respectively. Nearly half of the subjects (46.9%) reported an average monthly income of less than CNY 5000. Additionally, 48.0% indicated that they had not consumed alcohol during the previous year. More than half of the respondents (57.9%) had a university-level education or higher, and the majority resided in urban areas (Table 1).

Table 1.
General characteristics of the study subjects (n = 1145).
3.2. Exploratory and Confirmatory Factor Analysis of the TPB and Food Literacy
Measurement model. Treating the Likert responses as ordinal and estimating with WLSMV on polychoric correlations, the TPB four-factor model showed good fit: χ2(203) = 1001.06, χ2/df = 4.93, CFI = 0.950, TLI = 0.943, RMSEA = 0.059 (90% CI: 0.055–0.062), and SRMR = 0.033. The five-factor food literacy model demonstrated acceptable fit: χ2(265) = 1420.64, χ2/df = 5.36, CFI = 0.931, TLI = 0.922, RMSEA = 0.062 (90% CI: 0.059–0.065), and SRMR = 0.042. Given the known sensitivity of χ2 to large samples, the incremental (CFI/TLI) and residual-based (RMSEA/SRMR) indices collectively support adequate model performance.
Standardised factor loadings ranged 0.657–0.808 across TPB constructs and 0.621–0.795 across food-literacy domains. Composite reliability was 0.799–0.914, with Cronbach’s α = 0.801–0.913. AVE met the 0.50 criterion for all constructs except choices (AVE = 0.496, borderline); however, its loadings and CR = 0.831, together with overall model fit, suggest acceptable convergent validity. Item means indicated generally favourable responses: TPB construct means 3.82–3.96 (on 1–5 scales) and food-literacy domain means 3.46–3.67 (overall food literacy is 3.58 ± 0.51 on 0–4 scales). Taken together, these results indicate reliable measurement and acceptable validity, providing a sound basis for subsequent structural and moderation analyses (Table 2).
Table 2.
Exploratory and confirmatory factor analysis of the TPB and food literacy.
3.3. Correlation Between the Basic Characteristics of Survey Subjects and Healthy Dietary Behaviour Intentions
As shown in Table 3, basic demographic and lifestyle characteristics, including age, marital status, occupation, alcohol intake, health status, and cohabitation with family members, were found to influence intentions to engage in healthy-eating behaviours. Future studies should account for the effects of these factors when analysing behavioural intentions to derive more precise and reliable results.
Table 3.
Correlation between basic characteristics of subjects and health behaviour intentions.
3.4. The Relationship Between the Three Structures of the TPB and Healthy-Eating Intentions
Table 4 presents the relationships between attitudes, subjective norms, PBC, and healthy-eating intentions within the TPB, accounting for basic characteristics such as age, marital status, occupation, alcohol intake, health status, and cohabitation with family members. Multiple regression analysis indicated that subjective norms and PBC were positively associated with healthy-eating intentions (B = 0.224, p = 0.000 and B = 0.612, p = 0.000), whereas attitude did not have a significant effect. The model explained 67.2% of the variance in healthy-eating intentions.
Table 4.
Multiple linear regression of healthy-eating behavioural intentions on TPB constructs (with covariate adjustment; n = 1145).
3.5. The Moderating Effect of Food Literacy on the Relationship Between the Components of the TPB and the Intention of Healthy Behaviour
Table 5 presents the moderating effect of food literacy on the relationships between the components of the TPB and healthy-eating intentions. Since the p-values for all interaction terms exceeded 0.05, food literacy did not exhibit a significant moderating effect on these relationships.
Table 5.
The regulatory role of food literacy on the relationship between the three elements of planned behaviour theory and the intentions for healthy-eating behaviour.
3.6. The Moderating Effect of Food Literacy Components on the Relationship Between TPB Components and Healthy-Eating Intentions
The results presented in Table 6 indicate that the production, selection, preparation and cooking, and disposal components of food literacy did not have a significant moderating effect on the relationships between the components of the TPB and healthy-eating intentions. In contrast, the intake component demonstrated a positive moderating effect on these relationships (B = 0.03, p < 0.001; B = 0.03, p = 0.001; and B = 0.02, p = 0.013).
Table 6.
The moderating effects of the five components of food literacy on the relationships among the three constructs of the Theory of Planned Behaviour (TPB).
3.7. Ridge Regression Tests of Intake Moderation on TPB–Intention Associations
Ridge moderation model. Because the TPB predictors and their interactions exhibited multicollinearity, we estimated an L2-regularised (ridge) linear model with ten-fold cross-validation. The model achieved CV-RMSE = 0.483 and CV-R2 = 0.631, indicating good out-of-sample explanatory power on the 1–5 intention scale (Table 7). We selected λ = 0.02 as the primary penalty based on the lowest cross-validated error and stabilisation of the ridge trace.
Table 7.
Cross-validated performance of ridge models.
As shown in Table 8, subjective norms (Std. β = 0.169, p < 0.001) and perceived behavioural control (PBC; Std. β = 0.459, p < 0.001) were positive, statistically significant predictors of healthy-eating intention, whereas attitude was not (Std. β = 0.013, p = 0.66). Intake literacy’s main effect was small and non-significant (B = −0.002, p = 0.148). Critically, only the PBC × intake literacy interaction was significant (Std. β = 0.182, p < 0.001); the ATT × intake and SN × intake interactions were non-significant (p = 0.252 and 0.209, respectively). This pattern indicates that higher intake literacy strengthens the positive association between PBC and intention, consistent with the view that capability-related skills enhance an individual’s perceived control and translate more strongly into intention. All continuous predictors were mean-centred and standardised, controls (age, marital status, occupation, alcohol use, living with family, and physician-diagnosed chronic disease) were included, and the intercept was not penalised. Given ridge shrinkage, coefficient magnitudes are conservative; inference therefore emphasises the direction and relative size of effects alongside cross-validated performance.
Table 8.
Ridge moderation model predicting behavioural intention (λ = 0.02; n = 1141).
Consistent with H1, PBC and subjective norms—but not attitude—emerged as the most salient correlates of intention in this sample; H2 (overall literacy moderation) was not supported. Exploratory domain-level analyses identified a single robust moderation effect for consumption literacy on the PBC → intention pathway, suggesting that skills directly tied to daily eating practices may amplify the translation of perceived control into intention.
4. Discussion
To address multicollinearity among Theory of Planned Behaviour (TPB) predictors and interaction terms, we estimated an L2-regularised ridge model with ten-fold cross-validation (λ = 0.02; CV-RMSE = 0.483; and CV-R2 = 0.631; Table 7 and Table 8). Subjective norms and perceived behavioural control (PBC) were robust positive correlates of healthy-eating intention, whereas attitude was not significant. Of the five food-literacy domains, only intake (intake) moderated a TPB pathway: the significant PBC × intake interaction indicates that higher intake literacy strengthens the link between perceived control and intention.
The absence of a significant attitude–intention association is coherent with TPB theory and meta-analytic evidence showing that, in health contexts, norms and PBC can exert more proximal influence on intentions than attitudes [39,44,54,55,56]. In a cultural milieu where interpersonal obligations (family, peers, and authorities) are salient and where time, cost, availability, and skills constrain action, normative pressure and perceived control may outweigh personal evaluations. Attitudes towards healthy eating were also high on average (≈3.8–4.0/5), suggesting restricted variance that could attenuate predictive power, even after regularisation.
Interpreted through a Motivation–Opportunity–Capability lens, food literacy functions as capability: knowledge and skills both facilitate behaviour directly and condition the strength of intention pathways [44,54]. Among the literacy domains, intake comprises immediately actionable competencies—assembling a balanced meal, selecting options suited to one’s health needs and circumstances—that plausibly reduce execution barriers and enhance task-specific self-efficacy. This helps explain why intake, rather than more distal domains such as production, choices, preparation/cooking, or waste disposal, magnified the effect of PBC on intention within a near-term outcome frame (“eating healthily in the next two weeks”). Prior research is consistent with this mechanism: practical food skills, frequency of home cooking, and effective nutrition-label use are associated with healthier selections and better diet quality [16,33,57,58,59].
These findings fit within the international evidence on the TPB, which identifies norms and PBC as key correlates of intentions in health domains [39,55,56], and they extend capability-based accounts by showing that the domain closest to the focal act (intake) specifically conditions the PBC → intention path. The intake-specific moderation may also reflect China’s rapidly evolving food environment and widespread uptake of convenience and delivery foods, in which simple, fast and context-fitting skills are especially consequential for translating perceived control into intended action.
The results carry several practical implications. Programmes should prioritise intake-focused food-literacy training—menu planning, quick healthy swaps, balanced-plate templates, and 30 s label reading—in community and workplace settings. Campaigns should emphasise PBC and intake skills rather than attitude appeals alone, making healthy choices feasible and easy at the point of decision. Given high platform use, micro-lessons and just-in-time prompts embedded within ordering apps and canteen systems can scaffold healthier selections. Educational efforts should be paired with supportive choice architecture (defaults, salt-reduction prompts, and traffic-light front-of-pack labels) in line with international policy directions [60].
Methodologically, the study modelled the five components of food literacy separately and used ridge regression with cross-validation to estimate moderation under multicollinearity, reporting out-of-sample performance. Conceptually, it operationalised food literacy as a capability within the TPB and demonstrated that the domain nearest to behavioural execution—intake—moderates the PBC → intention pathway, offering a more granular account than studies relying on a single overall literacy score. Strengths include a large sample, validated measures with acceptable fit, and cross-validated estimates. Limitations include the cross-sectional design (preventing causal inference), possible seasonality (autumn–winter data collection), reliance on self-report, differing response scales for TPB (1–5) versus food literacy (0–4)—mitigated by centring/standardising in ridge—and high inter-factor correlations among TPB constructs, which raise discriminant validity caveats despite regularisation.
Future work should test intervention trials that raise intake-focused literacy and assess downstream effects on intentions and behaviours; employ longitudinal designs to establish temporal ordering; integrate digital food-literacy tasks that operate at the point of choice; and examine psychosocial mediators such as self-efficacy and cultural value orientations. Multi-site studies would help assess the cross-cultural generalisability of the attitude–norm–control balance and of intake-specific moderation [16,33,39,44,54,57,58,59,60].
5. Conclusions
In this cross-sectional survey of Chinese adults, perceived behavioural control and subjective norms—but not attitude—predicted healthy-eating intention. Among the five food-literacy domains, only Consumption (formerly “intake”) moderated the PBC→intention pathway, indicating that proximal, point-of-choice skills strengthen the translation of control beliefs into intention. These findings suggest that programmes should prioritise consumption-focused skills (e.g., quick healthy swaps, simple menu planning, rapid label use) alongside enabling choice architectures rather than attitude appeals alone. Limitations include the cross-sectional design, self-report measures and possible seasonal influences. Future work should test interventions targeting Consumption skills, use longitudinal designs, and evaluate digital, just-in-time supports at the point of choice, including assessment of cross-cultural generalisability.
Author Contributions
Conceptualization, J.-Y.H. and Y.L.; methodology, Y.L. and J.-Y.H.; software, Y.L.; validation, Y.L. and J.-Y.H.; formal analysis, Y.L. and J.-Y.H.; data curation, Y.L. and J.-Y.H.; writing—original draft preparation, Y.L.; writing—review and editing, J.-Y.H.; supervision, J.-Y.H.; project administration, J.-Y.H.; funding acquisition, J.-Y.H. All authors have read and agreed to the published version of the manuscript.
Funding
This research was funded by the National Research Foundation of Korea grants from the Korean government (MSIT) (RS-2023-00280503).
Institutional Review Board Statement
This study received institutional review board (IRB) approval from Sangmyung University for the years 2023 through 2024 (IRB approval numbers: SMUIRBC-2023-001(2023.06.23), SMUIRBC-2024-024(2024.06.12)).
Informed Consent Statement
Written informed consent was obtained from parents for all participants and students.
Data Availability Statement
The data are not publicly available due to privacy, access to data can be requested from the corresponding author.
Conflicts of Interest
The authors declare no conflicts of interest.
References
- Ministry of Agriculture and Rural Affairs of the People’s Republic of China. China Agricultural Outlook Report (2020–2029); China Agricultural Press: Beijing, China, 2020. [Google Scholar]
- Xin, Y.; Shui, D.; Yan, G.; Tian, W.; Tang, N.; Liang, J.; Peng, J.; Sun, H.; Ge, A.; Liu, X.; et al. Dietary Risk Factors and Associated Disease Burden Among Chinese Adults Aged 25 Years and Older: Systematic Analysis of the Global Burden of Disease Study 2021. JMIR Public Health Surveill. 2025, 11, e72978. [Google Scholar] [CrossRef] [PubMed]
- National Center for Cardiovascular Diseases; The Writing Committee of the Report on Cardiovascular Health and Diseases in China. Report on Cardiovascular Health and Diseases in China 2023: An Updated Summary. Biomed. Environ. Sci. 2024, 37, 949–992. [Google Scholar]
- International Diabetes Federation. IDF Diabetes Atlas, 11th ed.; IDF: Brussels, Belgium, 2025; Available online: https://diabetesatlas.org/ (accessed on 12 October 2024).
- Du, H.; Li, L.; Bennett, D.; Guo, Y.; Turnbull, I.; Yang, L.; Bragg, F.; Millwood, I.Y.; Walters, R.G.; Chen, Y.; et al. Fresh Fruit intake and Major Cardiovascular Disease in China. N. Engl. J. Med. 2016, 374, 1332–1343. [Google Scholar] [CrossRef]
- Yang, J.; Du, H.; Guo, Y.; Bian, Z.; Yu, C.; Chen, Y.; Yang, L.; Liu, J.; Han, X.; Chen, J.; et al. Coarse Grain intake and Risk of Cardiometabolic Diseases: A Prospective Cohort Study of Chinese Adults. J. Nutr. 2022, 152, 1476–1486. [Google Scholar] [CrossRef] [PubMed]
- Liu, Z.; Man, Q.; Li, Y.; Yang, X.; Ding, G.; Zhang, J.; Zhao, W. Estimation of 24-Hour Urinary Sodium and Potassium Excretion among Chinese Adults: A Cross-Sectional Study from the China National Nutrition Survey. Am. J. Clin. Nutr. 2024, 119, 164–173. [Google Scholar] [CrossRef] [PubMed]
- Chinese Nutrition Society. Dietary Guidelines for Chinese Residents; People’s Medical Publishing House: Beijing, China, 2022. [Google Scholar]
- Bureau of Disease Prevention and Control; National Health Commission. Report on Nutrition and Chronic Disease Status of Chinese Residents (2020); People’s Medical Publishing House: Beijing, China, 2021. [Google Scholar]
- Xu, Y.; Lu, J.; Li, M.; Wang, T.; Wang, K.; Cao, Q.; Ding, Y.; Xiang, Y.; Wang, S.; Yang, Q.; et al. Diabetes in China Part 1: Epidemiology and Risk Factors. Lancet Public Health 2024, 9, e1089–e1097. [Google Scholar] [CrossRef] [PubMed]
- Deng, W.; Zhao, L.; Chen, C.; Ren, Z.; Jing, Y.; Qiu, J.; Liu, D. National Burden and Risk Factors of Diabetes Mellitus in China from 1990 to 2021: Results from the Global Burden of Disease Study 2021. J. Diabetes 2024, 16, e70012. [Google Scholar] [CrossRef]
- Bragg, F.; Tang, K.; Guo, Y.; Iona, A.; Du, H.; Holmes, M.V.; Bian, Z.; Kartsonaki, C.; Chen, Y.; Yang, L.; et al. Associations of General and Central Adiposity with Incident Diabetes in Chinese Men and Women. Diabetes Care 2018, 41, 494–502. [Google Scholar] [CrossRef]
- Wang, T.; Lu, J.; Shi, L.; Chen, G.; Xu, M.; Xu, Y.; Su, Q.; Mu, Y.; Chen, L.; Hu, R.; et al. Association of Insulin Resistance and β-Cell Dysfunction with Incident Diabetes Among Adults in China: A Nationwide, Population-Based, Prospective Cohort Study. Lancet Diabetes Endocrinol. 2020, 8, 115–124. [Google Scholar] [CrossRef]
- China Internet Network Information Center. The 53rd Statistical Report on China’s Internet Development. 2024. Available online: https://www.cnnic.net.cn/n4/2024/0322/c88-10964.html (accessed on 12 October 2024).
- Vidgen, H.A.; Gallegos, D. Defining food literacy and its components. Appetite 2014, 76, 50–59. [Google Scholar] [CrossRef]
- Li, Z.; Xu, Y.; Liu, Z.; Ma, Y.; Guo, Y.; Wang, D.; Yu, W.; Zhao, R.; Yuan, Q.; Xu, M. Status and associated factors of food and nutrition literacy among young adults aged 15–44 years in Shenzhen City, China. Front. Public Health 2024, 11, 1329241. [Google Scholar]
- Amin, S.A.; Panzarella, C.; Lehnerd, M.; Cash, S.B.; Economos, C.D.; Sacheck, J.M. Identifying food literacy educational opportunities for youth. Health Educ. Behav. 2018, 45, 918–925. [Google Scholar] [CrossRef] [PubMed]
- Amouzandeh, C.; Fingland, D.; Vidgen, H.A. A scoping review of the validity, reliability and conceptual alignment of food literacy measures for adults. Nutrients 2019, 11, 801. [Google Scholar] [CrossRef]
- Ares, G.; De Rosso, S.; Mueller, C.; Philippe, K.; Pickard, A.; Nicklaus, S.; van Kleef, E.; Varela, P. Development of food literacy in children and adolescents: Implications for the design of strategies to promote healthier and more sustainable diets. Nutr. Rev. 2024, 82, 536–552. [Google Scholar] [CrossRef]
- Perry, E.A.; Thomas, H.; Samra, H.R.; Edmonstone, S.; Davidson, L.; Faulkner, A.; Petermann, L.; Manafò, E.; I Kirkpatrick, S. Identifying attributes of food literacy: A scoping review. Public Health Nutr. 2017, 20, 2406–2415. [Google Scholar] [CrossRef] [PubMed]
- Begley, A.; Paynter, E.; Dhaliwal, S.S. Evaluation tool development for food literacy programs. Nutrients 2018, 10, 1617. [Google Scholar] [CrossRef]
- Block, L.G.; Grier, S.A.; Childers, T.L.; Davis, B.; Ebert, J.E.J.; Kumanyika, S.; Laczniak, R.N.; Machine, J.E.; Motley, C.M.; Peracchio, L.; et al. From nutrients to nurturance: A conceptual introduction to food well-being. J. Public Policy Mark. 2011, 30, 5–13. [Google Scholar] [CrossRef]
- Cullen, T.; Hatch, J.; Martin, W.; Higgins, J.W.; Sheppard, R. Food literacy Definition and framework for action. Can. J. Diet. Pract. Res. 2015, 76, 140–145. [Google Scholar] [CrossRef] [PubMed]
- Grea Krause, C.; Beer-Borst, S.; Sommerhalder, K.; Hayoz, S.; Abel, T. A short food literacy questionnaire (SFLQ) for adults: Findings from a Swiss validation study. Appetite 2018, 120, 275–280. [Google Scholar] [CrossRef]
- Hernandez, K.J.; Gillis, D.; Kevany, K.; Kirk, S. Toward a common understanding of food literacy: A pedagogical framework. Can. Food Stud. 2021, 8, 8–25. [Google Scholar] [CrossRef]
- Krause, C.; Sommerhalder, K.; Beer-Borst, S.; Abel, T. Just a subtle difference? Findings from a systematic review on definitions of nutrition literacy and food literacy. Health Promot. Int. 2018, 33, 378–389. [Google Scholar] [CrossRef]
- Palumbo, R. Sustainability of well-being through literacy: The effects of food literacy on sustainability of well-being. Agric. Agric. Sci. 2016, 8, 99–106. [Google Scholar]
- Rosas, R.; Pimenta, F.; Leal, I.; Schwarzer, R. FOODLIT-PRO: Food literacy domains, influential factors, and determinants—A qualitative study. Nutrients 2019, 12, 88. [Google Scholar] [CrossRef] [PubMed]
- Slater, J.; Falkenberg, T.; Rutherford, J.; Colatruglio, S. Food literacy competencies: A conceptual framework for youth transitioning to adulthood. Int. J. Consum. Stud. 2018, 42, 547–556. [Google Scholar] [CrossRef]
- Thomas, H.; Azevedo Perry, E.; Slack, J.; Samra, H.R.; Manowiec, E.; Petermann, L.; Manafo, E.; Kirkpatrick, S.I. Complexities in conceptualizing and measuring food literacy. J. Acad. Nutr. Diet. 2019, 119, 563–573. [Google Scholar] [CrossRef]
- Thompson, C.; Adams, J.; Vidgen, H.A. Progressing the development of a food literacy questionnaire using cognitive interviews. Public Health Nutr. 2021, 25, 1968–1978. [Google Scholar] [CrossRef]
- Truman, E.; Lane, D.; Elliott, C. Defining food literacy: A scoping review. Appetite 2017, 116, 365–371. [Google Scholar] [CrossRef]
- Vaitkeviciute, R.; Ball, L.E.; Harris, N. The relationship between food literacy and dietary intake in adolescents: A systematic review. Public Health Nutr. 2015, 18, 649–658. [Google Scholar] [CrossRef]
- Velardo, S. The nuances of health literacy, nutrition literacy, and food literacy. J. Nutr. Educ. Behav. 2015, 47, 385–389. [Google Scholar] [CrossRef]
- Vettori, V.; Lorini, C.; Milani, C.; Bonaccorsi, G. Towards the implementation of a conceptual framework of food and nutrition literacy: Providing healthy eating for the population. Int. J. Environ. Res. Public Health 2019, 16, 5041. [Google Scholar] [CrossRef]
- Yuen, E.Y.N.; Thomson, M.; Gardiner, H. Measuring nutrition and food literacy in adults: A systematic review and appraisal of existing measurement tools. Health Lit. Res. Pract. 2018, 2, e134–e160. [Google Scholar] [CrossRef] [PubMed]
- Lee, J.; Kim, E.; Shin, M.; Park, D.; Choi, M. Food Literacy for Sustainable Eating Habits; National Institute of Agricultural Sciences, Department of Agro-Food Resources, Division of Food and Nutrition: Wanju-gun, Republic of Korea, 2021; pp. 30–33. [Google Scholar]
- Ajzen, I. From intentions to actions: A theory of planned behavior. In Action-Control: From Cognition to Behavior; Kuhl, J., Beckmann, J., Eds.; Springer: Heidelberg, Germany, 1985; pp. 11–39. [Google Scholar]
- Ajzen, I. The theory of planned behavior. Organ. Behav. Hum. Decis. Process. 1991, 50, 179–211. [Google Scholar] [CrossRef]
- Ajzen, I. Consumer attitudes and behavior: The theory of planned behavior applied to food intake decisions. Ital. Rev. Agric. Econ. 2015, 70, 121–138. [Google Scholar]
- Duan, W.T.; Jiang, G.G. A review of the theory of planned behavior. Adv. Psychol. Sci. 2008, 16, 315. [Google Scholar]
- Gilal, F.G.; Shaikh, A.R.; Yang, Z.; Gilal, R.G.; Gilal, N.G. Secondhand intake: A systematic literature review and future research agenda. Int. J. Consum. Stud. 2024, 48, e13059. [Google Scholar] [CrossRef]
- Ajzen, I.; Joyce, N.; Sheikh, S.; Cote, N.G. Knowledge and the prediction of behavior: The role of information accuracy in the theory of planned behavior. Basic Appl. Soc. Psychol. 2011, 33, 101–117. [Google Scholar] [CrossRef]
- Ölander, F.; Thøgersen, J. Understanding of consumer behaviour as a prerequisite for environmental protection. J. Consum. Policy 1995, 18, 345–385. [Google Scholar] [CrossRef]
- Tian, Y.; Yoo, J.H.; Zhou, H. To Read or Not to Read: An Extension of the Theory of Planned Behaviour to Food Label Use. Int. J. Consum. Stud. 2022, 46, 984–993. [Google Scholar] [CrossRef]
- Liu, D.; Lee, S.; Hwang, J. Factors related to the intention of healthy eating behaviors based on the theory of planned behavior: Focused on adults residing in Beijing, China. J. Nutr. Health 2021, 54, 67–75. [Google Scholar] [CrossRef]
- Liu, A.; Lee, S.; Hwang, J.Y. Factors related to the short-term and long-term intentions of healthy eating among Chinese adults living in Shanghai and parts of Anhui Province of China using the theory of planned behavior. J. Nutr. Health 2022, 55, 188–199. [Google Scholar] [CrossRef]
- Ma, X.; Lee, S.; Hwang, J.Y. Healthy eating-out options are related to healthy eating intention in adults residing in Daqing(China). J. Nutr. Health 2023, 56, 112–121. [Google Scholar] [CrossRef]
- Ma, X.; Lee, S.; Hwang, J.-Y. Exploring the Role of Intrinsic Motivation in Healthy Eating Intentions: An Extension of the Theory of Planned Behavior in Chinese Adults. Nutrients 2025, 17, 2007. [Google Scholar] [CrossRef]
- Grønhøj, A.; Bech-Larsen, T.; Chan, K.; Tsang, L. Using theory of planned behavior to predict healthy eating among Danish adolescents. Health Educ. 2012, 113, 4–17. [Google Scholar] [CrossRef]
- Wu, T.; Snider, J.B.; Floyd, M.R.; Florence, J.E.; Stoots, J.M.; Makamey, M.I. Intention for healthy eating among Southern Appalachian teens. Am. J. Health Behav. 2009, 33, 115–124. [Google Scholar] [CrossRef]
- Park, D.; Park, Y.K.; Park, C.Y.; Choi, M.K.; Shin, M.J. Development of a comprehensive food literacy measurement tool integrating the food system and sustainability. Nutrients 2020, 12, 3300. [Google Scholar] [CrossRef] [PubMed]
- Xu, B.; Hwang, J.Y. How food literacy levels shape healthy eating intentions: A cross-sectional study of adults in Shandong Province, China, using the theory of planned behavior. Nutr. Res. Pract. 2025, 19, 566–576. [Google Scholar] [CrossRef]
- Fishbein, M.; Ajzen, I. Predicting and Changing Behavior: The Reasoned Action Approach; Psychology Press/Taylor & Francis: New York, NY, USA, 2010. [Google Scholar]
- Armitage, C.J.; Conner, M. Efficacy of the Theory of Planned Behaviour: A meta-analytic review. Br. J. Soc. Psychol. 2001, 40, 471–499. [Google Scholar] [CrossRef]
- McEachan, R.R.C.; Conner, M.; Taylor, N.J.; Lawton, R.J. Prospective prediction of health-related behaviours using the Theory of Planned Behaviour: A meta-analysis. Health Psychol. Rev. 2011, 5, 97–144. [Google Scholar] [CrossRef]
- Wolfson, J.A.; Bleich, S.N. Is cooking at home associated with better diet quality? Public Health Nutr. 2015, 18, 1397–1406. [Google Scholar] [CrossRef] [PubMed]
- Wolfson, J.A.; Leung, C.W.; Richardson, C.R. More frequent cooking at home is associated with higher Healthy Eating Index-2015 score. Public Health Nutr. 2020, 23, 2384–2394. [Google Scholar] [CrossRef] [PubMed]
- Graham, D.J.; Laska, M.N. Nutrition label use mediates the relationship between attitudes and diet quality. J. Acad. Nutr. Diet. 2012, 112, 414–418. [Google Scholar] [CrossRef] [PubMed]
- Hersey, J.C.; Wohlgenant, K.C.; Arsenault, J.E.; Kosa, K.M.; Muth, M.K. Effects of front-of-package and shelf nutrition labelling on consumers. Nutr. Rev. 2013, 71, 1–14. [Google Scholar] [CrossRef] [PubMed]

Disclaimer/Publisher’s Note: The statements, opinions and data contained in all publications are solely those of the individual author(s) and contributor(s) and not of MDPI and/or the editor(s). MDPI and/or the editor(s) disclaim responsibility for any injury to people or property resulting from any ideas, methods, instructions or products referred to in the content. |
© 2025 by the authors. Licensee MDPI, Basel, Switzerland. This article is an open access article distributed under the terms and conditions of the Creative Commons Attribution (CC BY) license (https://creativecommons.org/licenses/by/4.0/).