
Does Salt Form Matter? A Pilot Randomized, Double-Blind, Crossover Pharmacokinetic Comparison of Crystalline and Regular Glucosamine Sulfate in Healthy Volunteers
 , , and
Abstract

1. Introduction
2. Materials and Methods
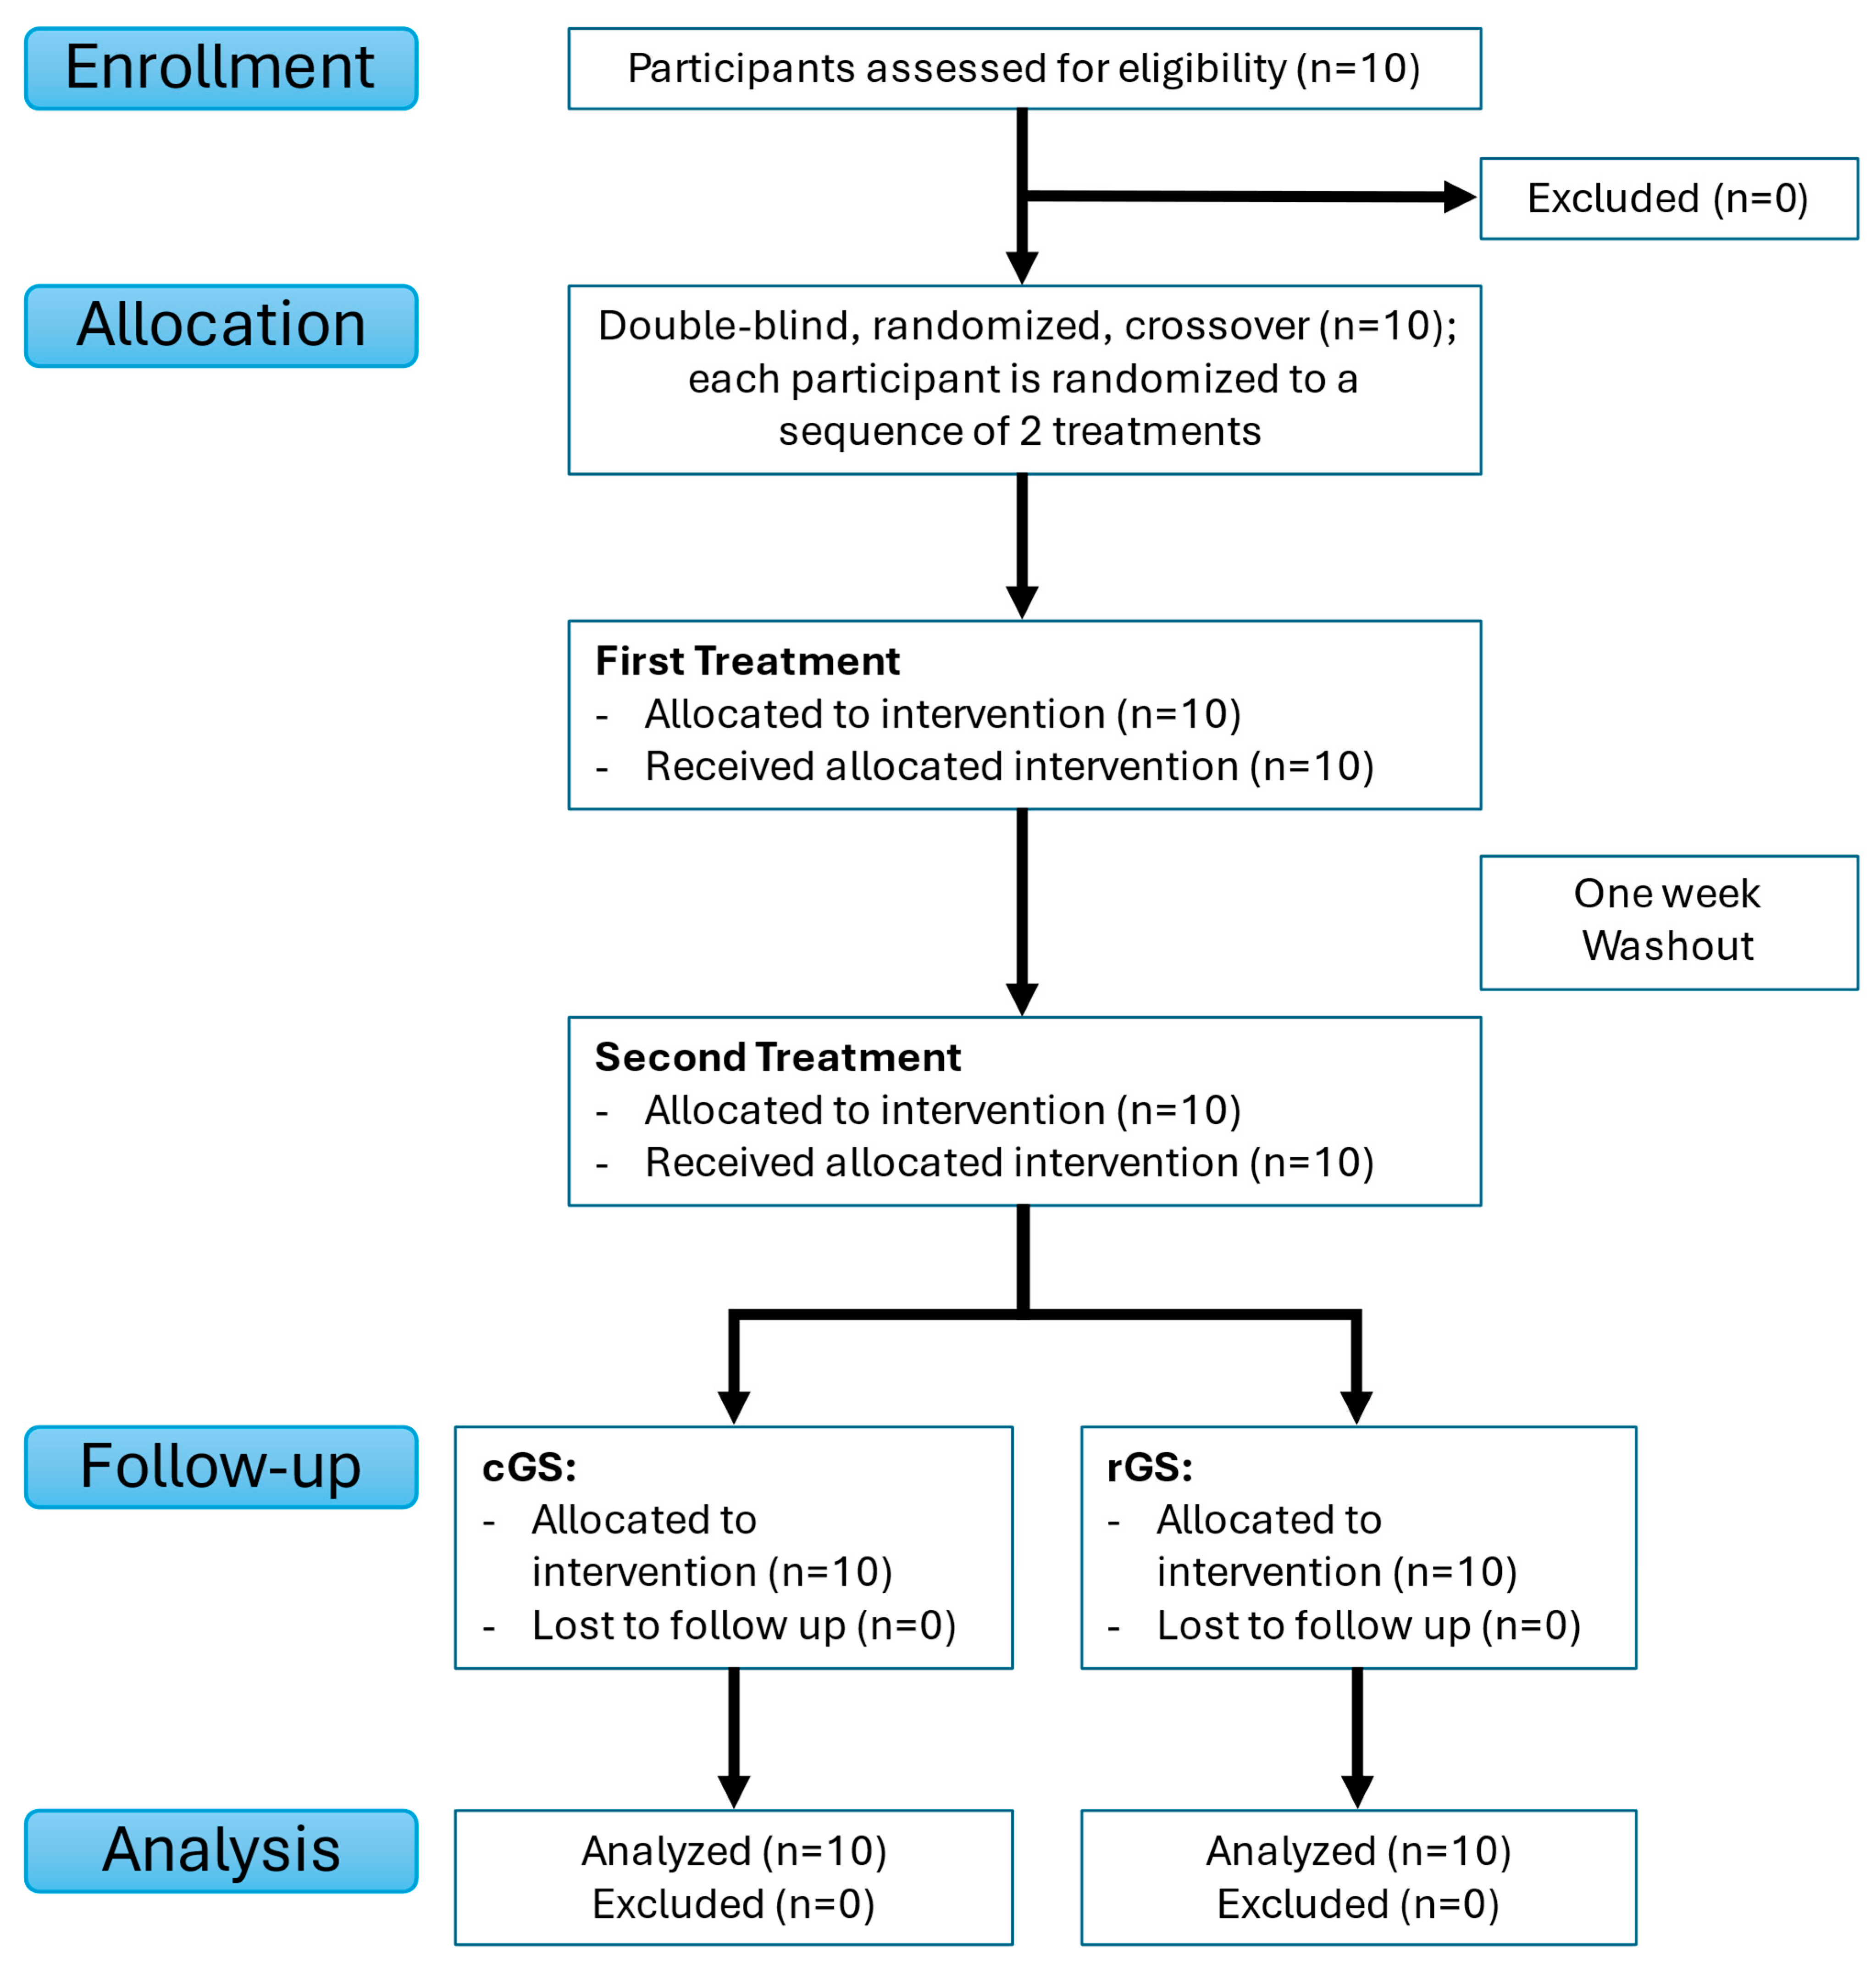
2.1. Study Design
2.2. Participants
2.3. Interventions
- Regular glucosamine sulfate (rGS): A single dose of 1500 mg of regular glucosamine sulfate.
- Crystalline glucosamine sulfate (cGS): A single dose of 1500 mg of crystalline glucosamine sulfate.

| Intervention | rGS | cGS |
|---|---|---|
| Dosage form | Hard-gelatin capsules | Caplets |
| Number of dosage forms per dose | 2 | 2 |
| Content per dose | 1500 mg Glucosamine Sulfate Potassium Chloride | 1500 mg Glucosamine Sulfate Sodium Chloride |
| Disintegration Time (min) | <13 * | <30 * |
| Source of Glucosamine | Shrimp/crab exoskeleton | Shellfish |
| Non-medicinal ingredients | Gelatin capsule (gelatin, purified water), magnesium stearate, microcrystalline cellulose | Microcrystalline cellulose, Polyvinyl Pyrrolidone K25, Cross-linked Sodium Carboxymethylcellulose, Hydroxypropyl Methylcellulose, Polyethyleneglycol 6000, Magnesium Stearate, Titanium Dioxide, Talc, Polydextrose FCC, Maltodextrin, Medium chain triglycerides. |
| Brand | Webber Naturals | Dona (Distributed by WynnPharm Inc.) |
| Product Name | Joint Ease Glucosamine Sulfate | Crystalline Glucosamine Sulfate |
| UPC | 25273 05052 | 91108 06010 |
| Lot Number | 964851 | B2301639 |
| Expiry Date | May 2028 | February 2027 |
| Distributor Location | Coquitlam, BC, Canada | Freehold, NJ, USA |
2.4. Randomization and Blinding
2.5. Blood Sample Collection and Analysis
2.6. Outcomes and Pharmacokinetic Analyses
2.7. Supplementary Safety Monitoring
2.8. Statistical Analysis
3. Results
3.1. Participant Characteristics
3.2. Pharmacokinetics
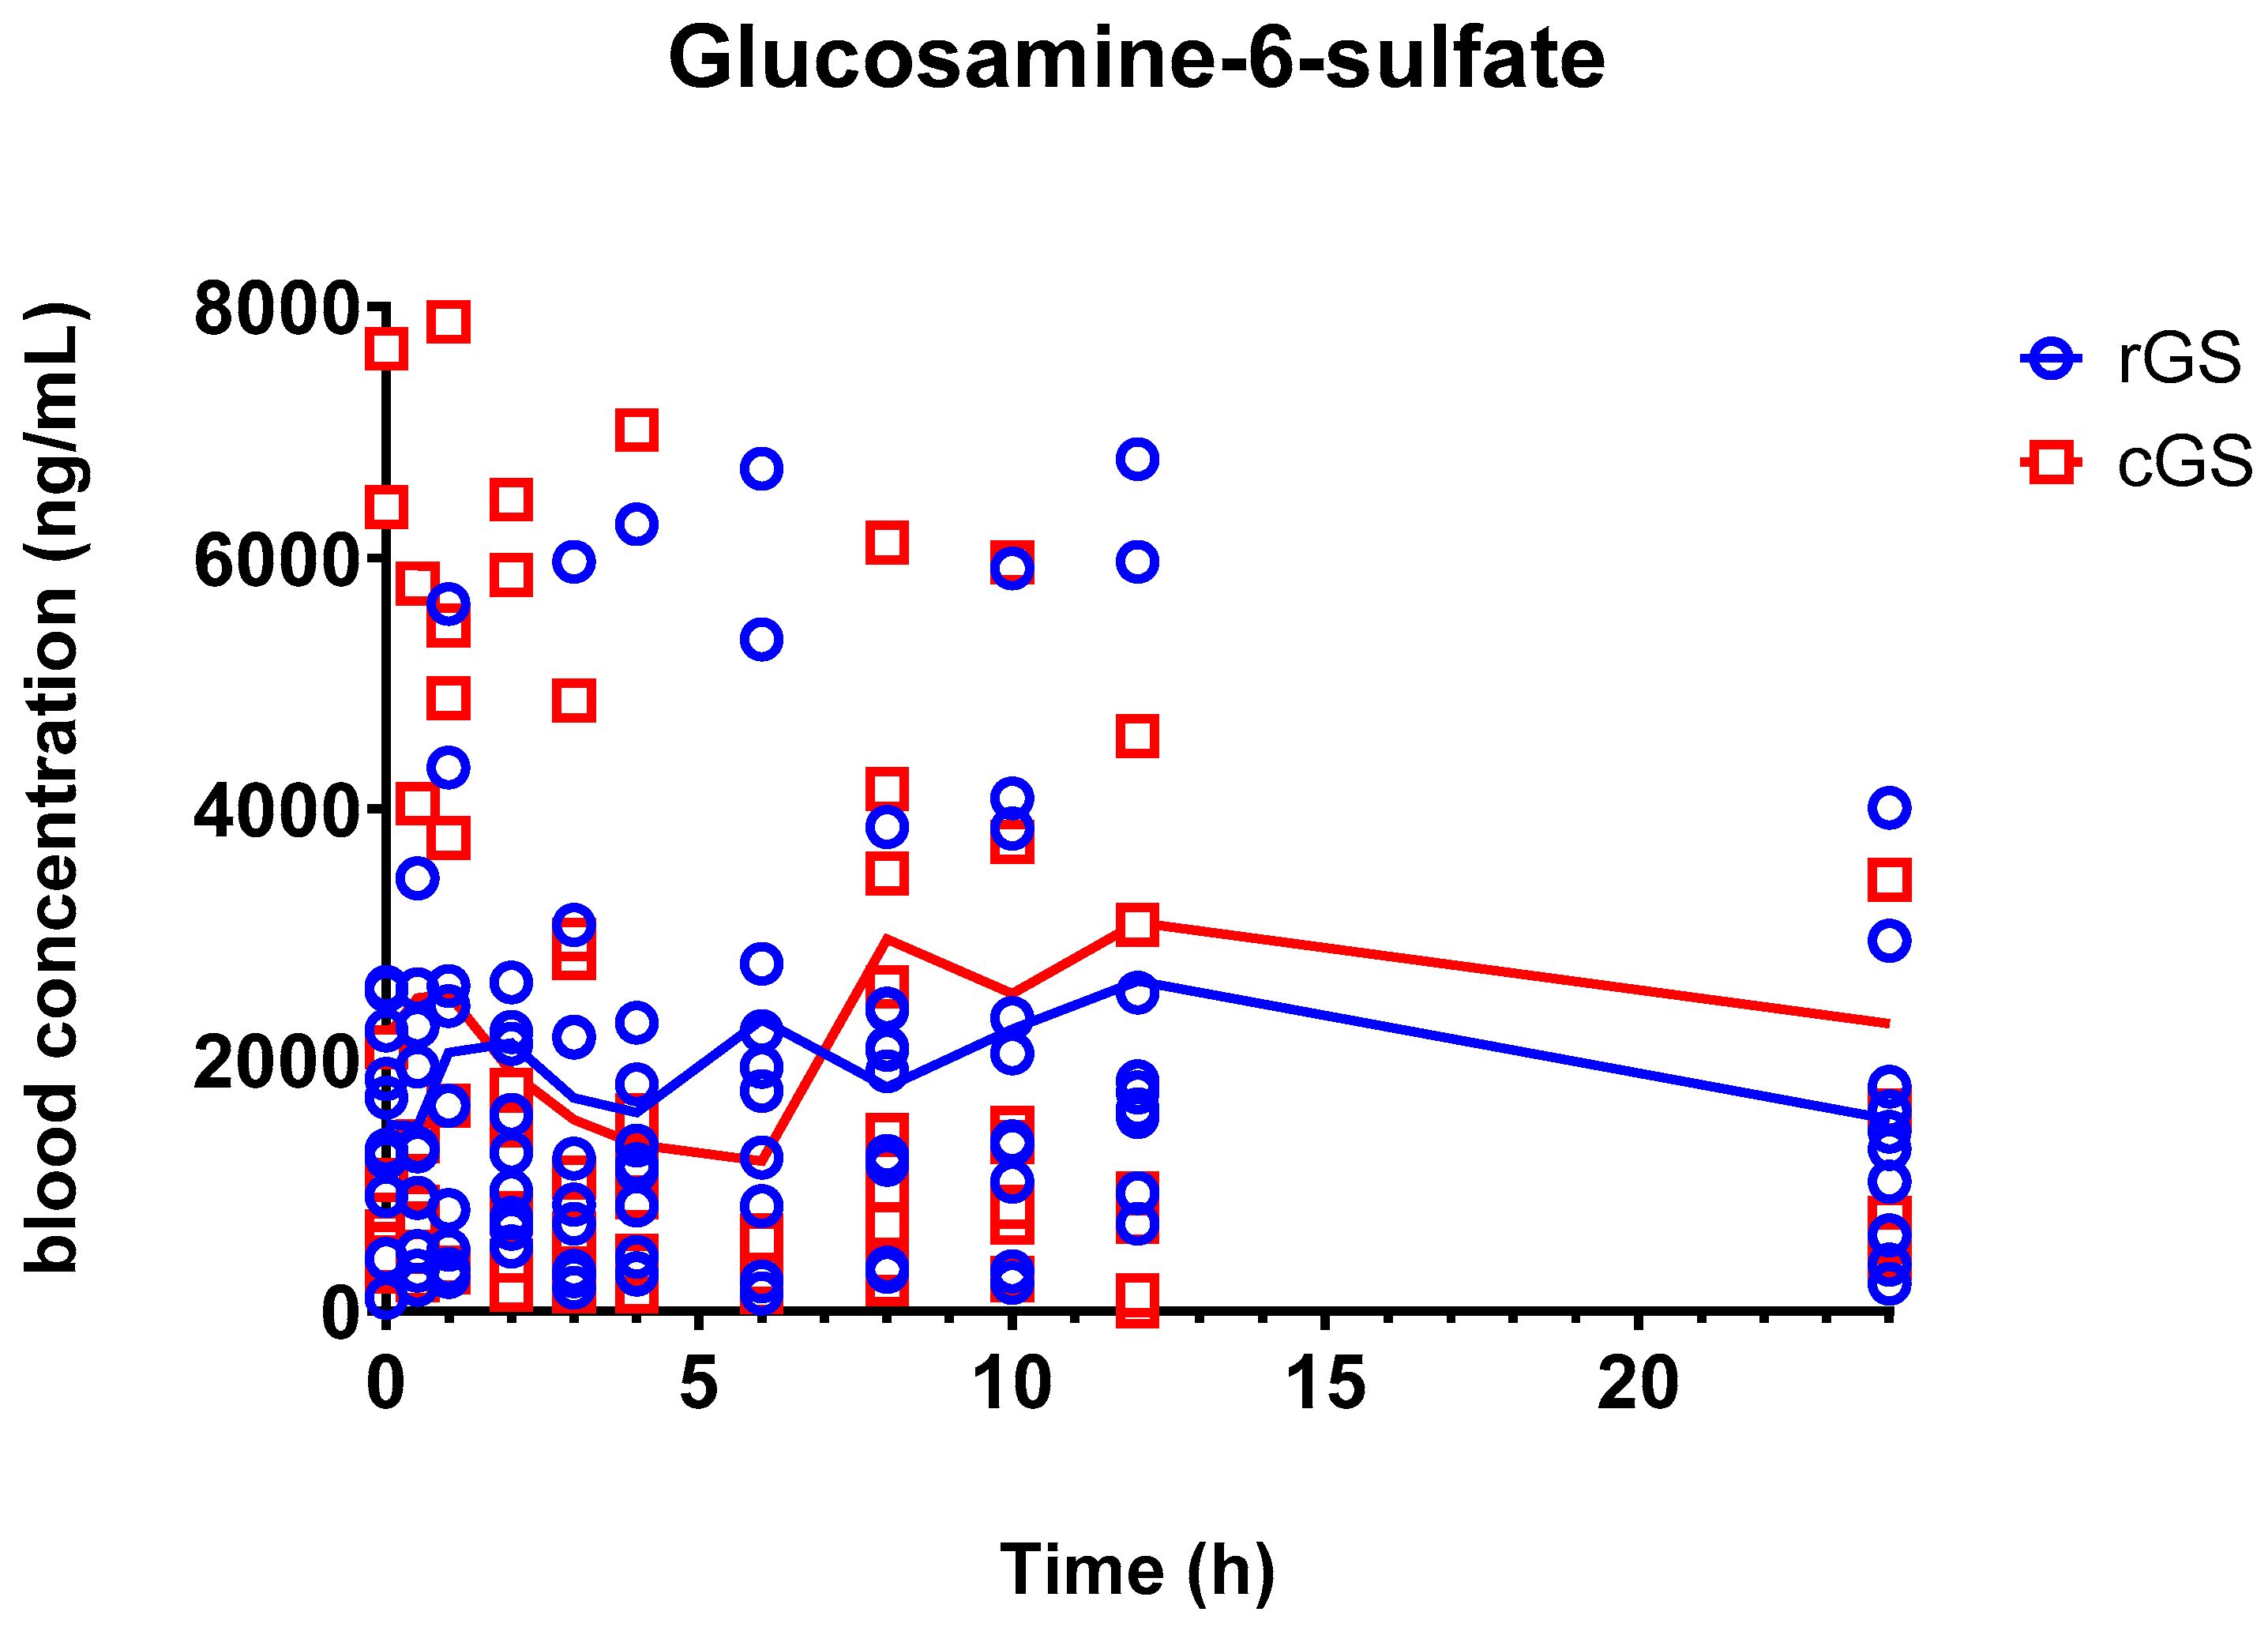
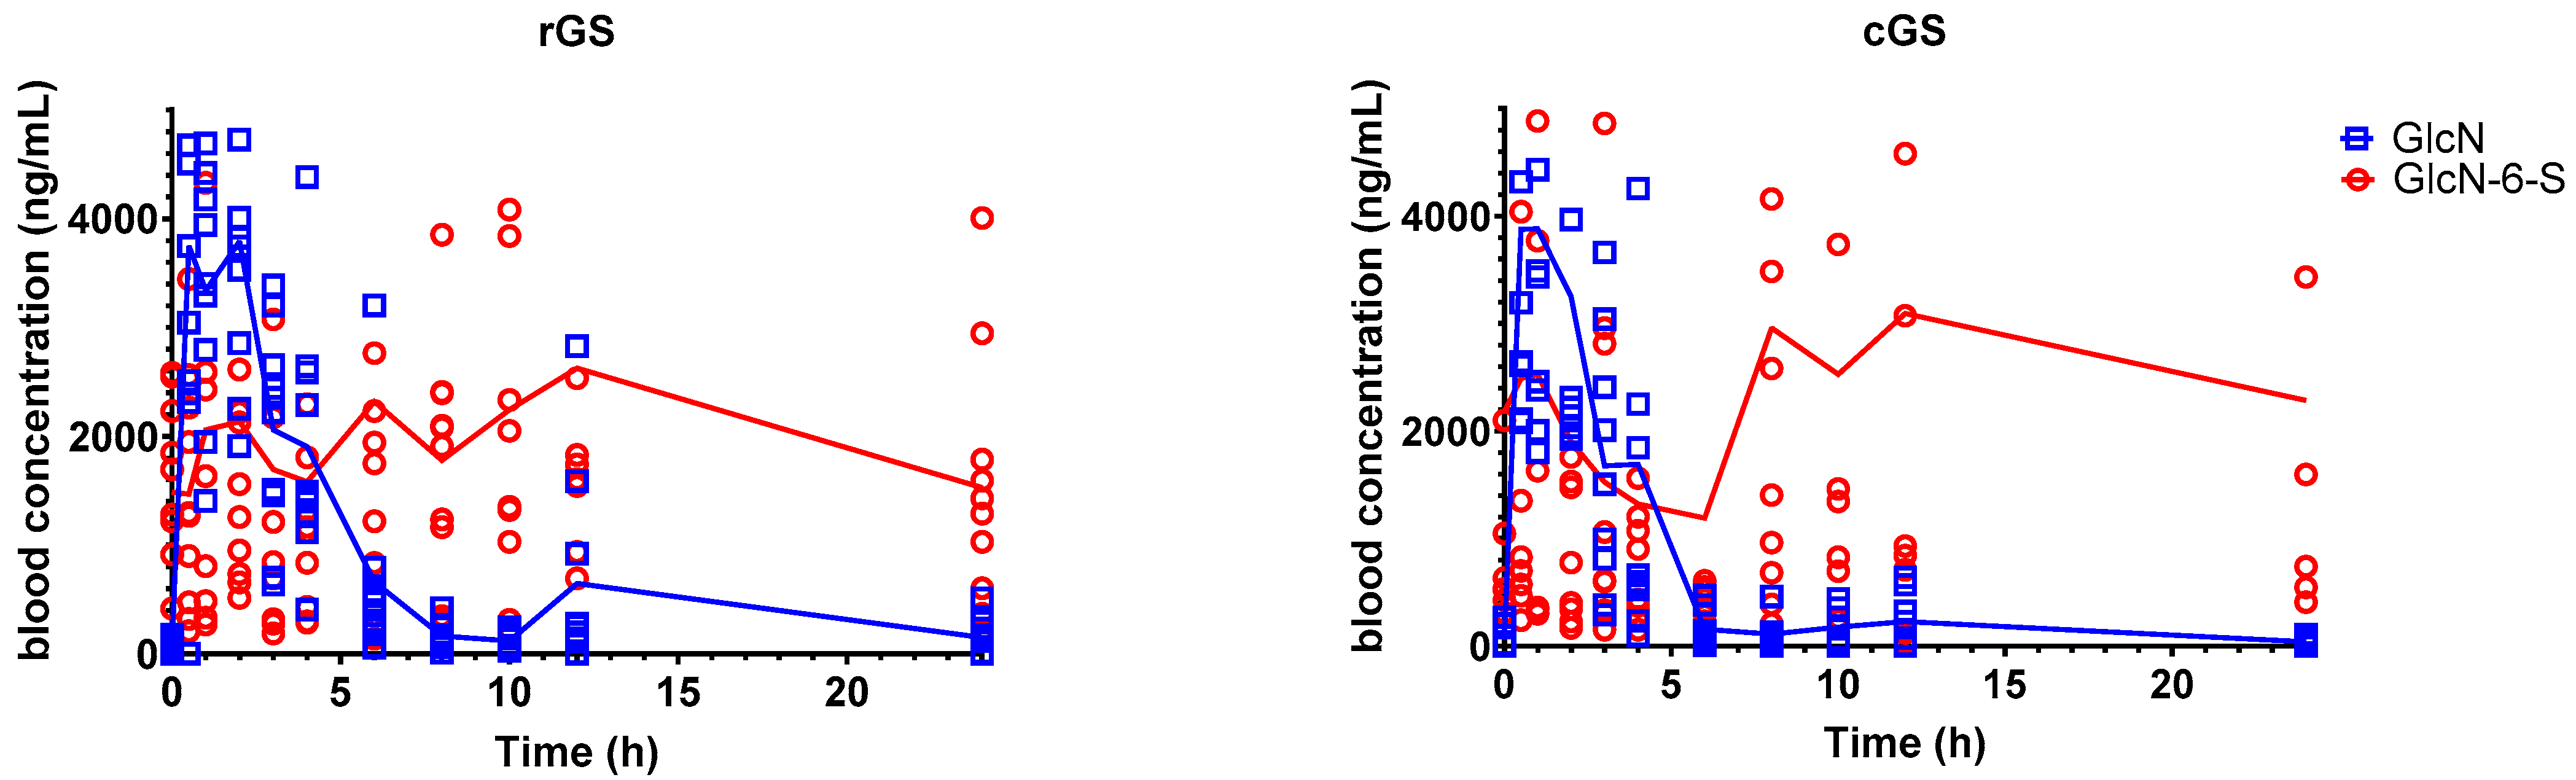
3.2.1. Glucosamine-6-Sulfate (GlcN-6-S)
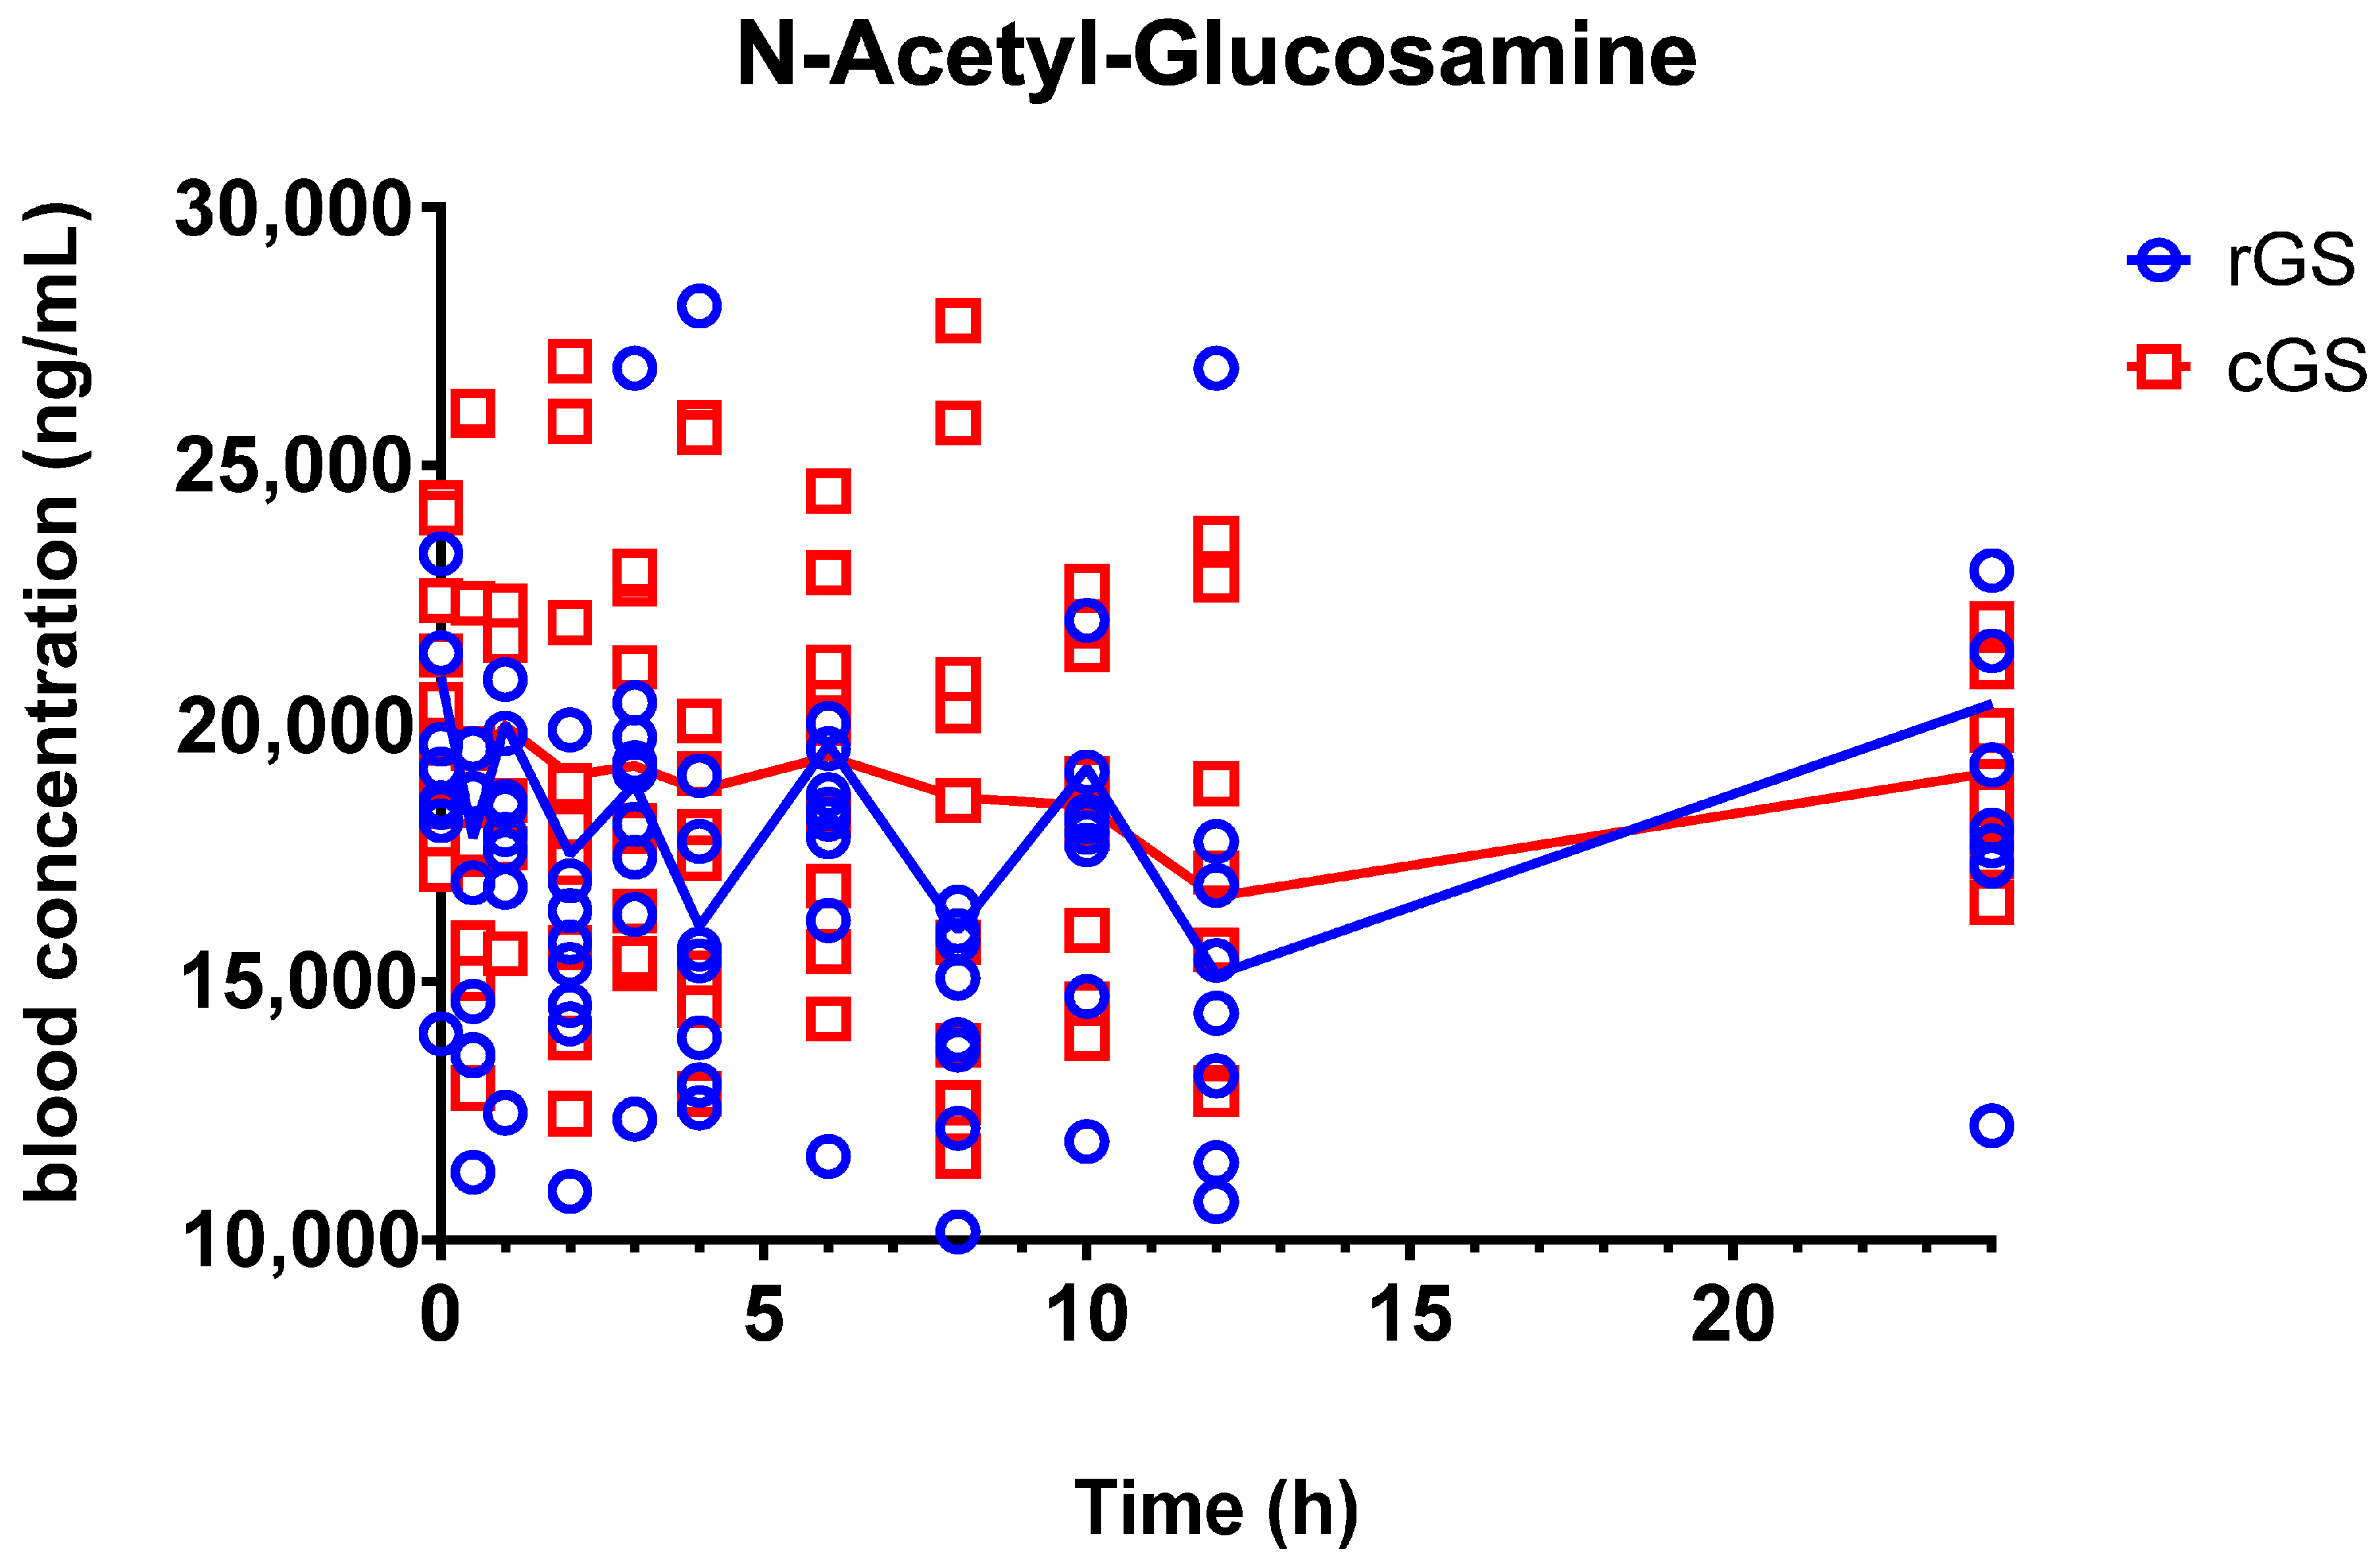
3.2.2. N-Acetyl-Glucosamine (GlcNAc)
3.2.3. Metabolite-to-Parent Ratio Profiles
3.3. Supplementary Safety Data
4. Discussion
4.1. Glucosamine Pharmacokinetics and Bioequivalence
4.2. Metabolite Insights: GlcN-6-S and GlcNAc
4.3. Metabolite-to-Parent Ratios
4.4. Clinical and Research Implications
4.5. Limitations
5. Conclusions
Supplementary Materials
Author Contributions
Funding
Institutional Review Board Statement
Informed Consent Statement
Data Availability Statement
Acknowledgments
Conflicts of Interest
Abbreviations
| GlcN-6-S | Glucosamine-6-sulfate |
| GlcNAc | N-acetyl-glucosamine |
| cGS | Crystalline glucosamine sulfate |
| rGS | Regular glucosamine |
| PK | Pharmacokinetic |
| AUC | Area under the curve |
| Cmax | Peak plasma concentration |
| Tmax | Time to maximum concentration |
| T½ | Elimination half-life |
| IRB | Institutional Review Board |
| CI | Confidence Interval |
| GMR | Geometric Mean Ratio |
| M/P | Metabolite-to-parent ratio |
References
- Mavrogonatou, E.; Kletsas, D. The Effect of Glucosamine Sulfate on the Proliferative Potential and Glycosaminoglycan Synthesis of Nucleus Pulposus Intervertebral Disc Cells. Spine 2013, 38, 308–314. [Google Scholar] [CrossRef]
- McCarty, M.F.; Russell, A.L.; Seed, M.P. Sulfated Glycosaminoglycans and Glucosamine May Synergize in Promoting Synovial Hyaluronic Acid Synthesis. Med. Hypotheses 2000, 54, 798–802. [Google Scholar] [CrossRef]
- Rabade, A.A.; Viswanatha, G.L.; Nandakumar, K.; Kishore, A. Evaluation of Efficacy and Safety of Glucosamine Sulfate, Chondroitin Sulfate, and Their Combination Regimen in the Management of Knee Osteoarthritis: A Systematic Review and Meta-Analysis. Inflammopharmacology 2024, 32, 1759–1775. [Google Scholar] [CrossRef]
- Thie, N.M.R.; Prasad, N.G.; Major, P.W. Evaluation of Glucosamine Sulfate Compared to Ibuprofen for the Treatment of Temporomandibular Joint Osteoarthritis: A Randomized Double Blind Controlled 3 Month Clinical Trial. J. Rheumatol. 2001, 28, 1347–1355. [Google Scholar] [PubMed]
- Al-Saadi, H.M.; Pang, K.-L.; Ima-Nirwana, S.; Chin, K.-Y. Multifaceted Protective Role of Glucosamine against Osteoarthritis: Review of Its Molecular Mechanisms. Sci. Pharm. 2019, 87, 34. [Google Scholar] [CrossRef]
- Nagaoka, I. Recent Aspects of the Chondroprotective and Anti-Inflammatory Actions of Glucosamine, a Functional Food. Juntendo Med. J. 2014, 60, 580–587. [Google Scholar] [CrossRef]
- Navarro, S.L.; White, E.; Kantor, E.D.; Zhang, Y.; Rho, J.; Song, X.; Milne, G.L.; Lampe, P.D.; Lampe, J.W. Randomized Trial of Glucosamine and Chondroitin Supplementation on Inflammation and Oxidative Stress Biomarkers and Plasma Proteomics Profiles in Healthy Humans. PLoS ONE 2015, 10, e0117534. [Google Scholar] [CrossRef]
- Varghese, S.; Theprungsirikul, P.; Sahani, S.; Hwang, N.; Yarema, K.J.; Elisseeff, J.H. Glucosamine Modulates Chondrocyte Proliferation, Matrix Synthesis, and Gene Expression. Osteoarthr. Cartil. 2007, 15, 59–68. [Google Scholar] [CrossRef]
- Riegger, J.; Baumert, J.; Zaucke, F.; Brenner, R.E. The Hexosamine Biosynthetic Pathway as a Therapeutic Target after Cartilage Trauma: Modification of Chondrocyte Survival and Metabolism by Glucosamine Derivatives and PUGNAc in an Ex Vivo Model. Int. J. Mol. Sci. 2021, 22, 7247. [Google Scholar] [CrossRef]
- Conrozier, T.; Lohse, T. Glucosamine as a Treatment for Osteoarthritis: What If It’s True? Front. Pharmacol. 2022, 13, 820971. [Google Scholar] [CrossRef]
- Kongtharvonskul, J.; Anothaisintawee, T.; McEvoy, M.; Attia, J.; Woratanarat, P.; Thakkinstian, A. Efficacy and Safety of Glucosamine, Diacerein, and NSAIDs in Osteoarthritis Knee: A Systematic Review and Network Meta-Analysis. Eur. J. Med. Res. 2015, 20, 24. [Google Scholar] [CrossRef]
- Anderson, J.W.; Nicolosi, R.J.; Borzelleca, J.F. Glucosamine Effects in Humans: A Review of Effects on Glucose Metabolism, Side Effects, Safety Considerations and Efficacy. Food Chem. Toxicol. 2005, 43, 187–201. [Google Scholar] [CrossRef] [PubMed]
- Aghazadeh-Habashi, A.; Jamali, F. The Glucosamine Controversy; A Pharmacokinetic Issue. J. Pharm. Pharm. Sci. 2011, 14, 264. [Google Scholar] [CrossRef]
- Kang, H.E.; Kim, S.J.; Yeo, E.; Hong, J.; Rajgopal, A.; Hu, C.; Murray, M.A.; Dang, J.; Park, E. Pharmacokinetic Comparison of Chitosan-Derived and Biofermentation-Derived Glucosamine in Nutritional Supplement for Bone Health. Nutrients 2022, 14, 3213. [Google Scholar] [CrossRef]
- Aghazadeh-Habashi, A.; Sattari, S.; Pasutto, F.M.; Jamali, F. Single Dose Pharmacokinetics and Bioavailability of Glucosamine in the Rat. J. Pharm. Pharm. Sci. 2002, 5, 181–184. [Google Scholar]
- Maxwell, L.K.; Regier, P.; Achanta, S. Comparison of Glucosamine Absorption After Administration of Oral Liquid, Chewable, and Tablet Formulations to Dogs. J. Am. Anim. Hosp. Assoc. 2016, 52, 90–94. [Google Scholar] [CrossRef]
- Abbas, J.; Ansari, Y.A.; Malik, T.A.; Sayed, I.A.; Sayyed, M.; Azharuddin, M. Formulation and Evaluation of Glucosamine Sulphate Potassuim Chloride 1500 Mg and Methyl Sulphonyl Methene 200 Mg Film Coated Tablet. J. Drug Deliv. Ther. 2019, 9, 469–477. [Google Scholar] [CrossRef]
- International Union of Pure and Applied Chemistry. IUPAC-Salt (S05447). Available online: https://goldbook.iupac.org/terms/view/S05447. (accessed on 9 June 2025).
- Henrotin, Y.; Mobasheri, A.; Marty, M. Is There Any Scientific Evidence for the Use of Glucosamine in the Management of Human Osteoarthritis? Arthritis Res. Ther. 2012, 14, 201. [Google Scholar] [CrossRef] [PubMed]
- Kucharz, E.J.; Kovalenko, V.; Szántó, S.; Bruyère, O.; Cooper, C.; Reginster, J.-Y. A Review of Glucosamine for Knee Osteoarthritis: Why Patented Crystalline Glucosamine Sulfate Should Be Differentiated from Other Glucosamines to Maximize Clinical Outcomes. Curr. Med. Res. Opin. 2016, 32, 997–1004. [Google Scholar] [CrossRef] [PubMed]
- NNHPD. Glucosamine Sulfate; Health Canada, Natural and Non-Prescription Health Products Directorate: Ottawa, ON, Canada, 2022. [Google Scholar]
- Chiusaroli, R.; Piepoli, T.; Zanelli, T.; Ballanti, P.; Lanza, M.; Rovati, L.C.; Caselli, G. Experimental Pharmacology of Glucosamine Sulfate. Int. J. Rheumatol. 2011, 2011, 939265. [Google Scholar] [CrossRef]
- Largo, R.; Alvarez-Soria, M.A.; Díez-Ortego, I.; Calvo, E.; Sánchez-Pernaute, O.; Egido, J.; Herrero-Beaumont, G. Glucosamine Inhibits IL-1β-Induced NFκB Activation in Human Osteoarthritic Chondrocytes. Osteoarthr. Cartil. 2003, 11, 290–298. [Google Scholar] [CrossRef]
- Shikhman, A.R.; Brinson, D.C.; Valbracht, J.; Lotz, M.K. Differential Metabolic Effects of Glucosamine and N-Acetylglucosamine in Human Articular Chondrocytes. Osteoarthr. Cartil. 2009, 17, 1022–1028. [Google Scholar] [CrossRef] [PubMed]
- Gouze, J.N.; Bianchi, A.; Bécuwe, P.; Dauça, M.; Netter, P.; Magdalou, J.; Terlain, B.; Bordji, K. Glucosamine Modulates IL-1-Induced Activation of Rat Chondrocytes at a Receptor Level, and by Inhibiting the NF-κB Pathway. FEBS Lett. 2002, 510, 166–170. [Google Scholar] [CrossRef] [PubMed]
- Persiani, S.; Roda, E.; Rovati, L.C.; Locatelli, M.; Giacovelli, G.; Roda, A. Glucosamine Oral Bioavailability and Plasma Pharmacokinetics after Increasing Doses of Crystalline Glucosamine Sulfate in Man. Osteoarthr. Cartil. 2005, 13, 1041–1049. [Google Scholar] [CrossRef] [PubMed]
- Jackson, C.G.; Plaas, A.H.; Sandy, J.D.; Hua, C.; Kim-Rolands, S.; Barnhill, J.G.; Harris, C.L.; Clegg, D.O. The Human Pharmacokinetics of Oral Ingestion of Glucosamine and Chondroitin Sulfate Taken Separately or in Combination. Osteoarthr. Cartil. 2010, 18, 297–302. [Google Scholar] [CrossRef]
- Toffoletto, O.; Tavares, A.; Casarini, D.E.; Redublo, B.M.; Ribeiro, A.B. Pharmacokinetic Profile of Glucosamine and Chondroitin Sulfate Association in Healthy Male Individuals. Acta Ortopédica Bras. 2005, 13, 235–237. [Google Scholar] [CrossRef]
- Biggee, B.A.; Blinn, C.M.; McAlindon, T.E.; Nuite, M.; Silbert, J.E. Low Levels of Human Serum Glucosamine after Ingestion of Glucosamine Sulphate Relative to Capability for Peripheral Effectiveness. Ann. Rheum. Dis. 2006, 65, 222–226. [Google Scholar] [CrossRef]
- Asthana, C.; Peterson, G.M.; Shastri, M.D.; Patel, R.P. Variation in the Pharmacokinetics of Glucosamine in Healthy Individuals. Rheumatology 2021, 60, 1205–1209. [Google Scholar] [CrossRef]
- Dwan, K.; Li, T.; Altman, D.G.; Elbourne, D. CONSORT 2010 Statement: Extension to Randomised Crossover Trials. BMJ 2019, 366, l4378. [Google Scholar] [CrossRef]
- César, I.; Byrro, R.; Cardoso, F.; Mundim, I.; Teixeira, L.; Rezende, K.; Silva, E.; Gomes, S.; Sousa, V.; Bonfim, R.; et al. Quantitation of Glucosamine Sulfate in Plasma by HPLC-MS/MS after Administration of Powder for Oral Solution Formulation. Biomed. Chromatogr. BMC 2011, 26, 851–856. [Google Scholar] [CrossRef]
- Akarasereenont, P.; Chatsiricharoenkul, S. Bioequivalence Study of 1,500 Mg Glucosamine Sulfate in Thai Healthy Volunteers. J. Bioequiv. Bioavailab. 2012, 4, 91–95. [Google Scholar] [CrossRef]
- Rani, S.; Pargal, A. Bioequivalence: An Overview of Statistical Concepts. Indian J. Pharmacol. 2004, 36, 209–216. [Google Scholar]
- Kousovista, R.; Karali, G.; Karalis, V. Modeling the Double Peak Phenomenon in Drug Absorption Kinetics: The Case of Amisulpride. BioMedInformatics 2023, 3, 177–192. [Google Scholar] [CrossRef]
- Setnikar, I.; Palumbo, R.; Canali, S.; Zanolo, G. Pharmacokinetics of Glucosamine in Man. Arzneimittelforschung 1993, 43, 1109–1113. [Google Scholar] [PubMed]
- Chen, C.; Yin, Q.; Tian, J.; Gao, X.; Qin, X.; Du, G.; Zhou, Y. Studies on the Changes of Pharmacokinetics Behaviors of Phytochemicals and the Influence on Endogenous Metabolites After the Combination of Radix Bupleuri and Radix Paeoniae Alba Based on Multi-Component Pharmacokinetics and Metabolomics. Front. Pharmacol. 2021, 12, 630970. [Google Scholar] [CrossRef] [PubMed]
- Cho, S.; Yoon, Y.-R. Understanding the Pharmacokinetics of Prodrug and Metabolite. Transl. Clin. Pharmacol. 2018, 26, 1–5. [Google Scholar] [CrossRef]
- Rothman, D.L.; Stearns, S.C.; Shulman, R.G. Gene Expression Regulates Metabolite Homeostasis during the Crabtree Effect: Implications for the Adaptation and Evolution of Metabolism. Proc. Natl. Acad. Sci. USA 2021, 118, e2014013118. [Google Scholar] [CrossRef]
- Marshall, S.; Bacote, V.; Traxinger, R.R. Discovery of a Metabolic Pathway Mediating Glucose-Induced Desensitization of the Glucose Transport System. Role of Hexosamine Biosynthesis in the Induction of Insulin Resistance. J. Biol. Chem. 1991, 266, 4706–4712. [Google Scholar] [CrossRef]
- Mannino, M.P.; Hart, G.W. The Beginner’s Guide to O-GlcNAc: From Nutrient Sensitive Pathway Regulation to Its Impact on the Immune System. Front. Immunol. 2022, 13, 828648. [Google Scholar] [CrossRef]
- Chen, L.; Zhou, Q.; Zhang, P.; Tan, W.; Li, Y.; Xu, Z.; Ma, J.; Kupfer, G.M.; Pei, Y.; Song, Q.; et al. Direct Stimulation of de Novo Nucleotide Synthesis by O-GlcNAcylation. Nat. Chem. Biol. 2024, 20, 19–29. [Google Scholar] [CrossRef] [PubMed]
- Callegari, E.; Varma, M.V.S.; Obach, R.S. Prediction of Metabolite-to-Parent Drug Exposure: Derivation and Application of a Mechanistic Static Model. Clin. Transl. Sci. 2020, 13, 520–528. [Google Scholar] [CrossRef] [PubMed]
| Males | Females | Combined | |
|---|---|---|---|
| N | 4 (40%) | 6 (60%) | 10 (100%) |
| Age | 42.3 ± 10.7 | 34.3 ± 7.4 | 37.5 ± 9.3 |
| Weight (kg) | 77.5 ± 9.7 | 66.8 ± 12.9 | 71.1 ± 12.4 |
| Height (cm) | 171.5 ± 5.8 | 165.3 ± 6.2 | 167.8 ± 6.5 |
| BMI (kg/m2) | 26.3 ± 2.8 | 24.2 ± 2.8 | 25.1 ± 2.9 |
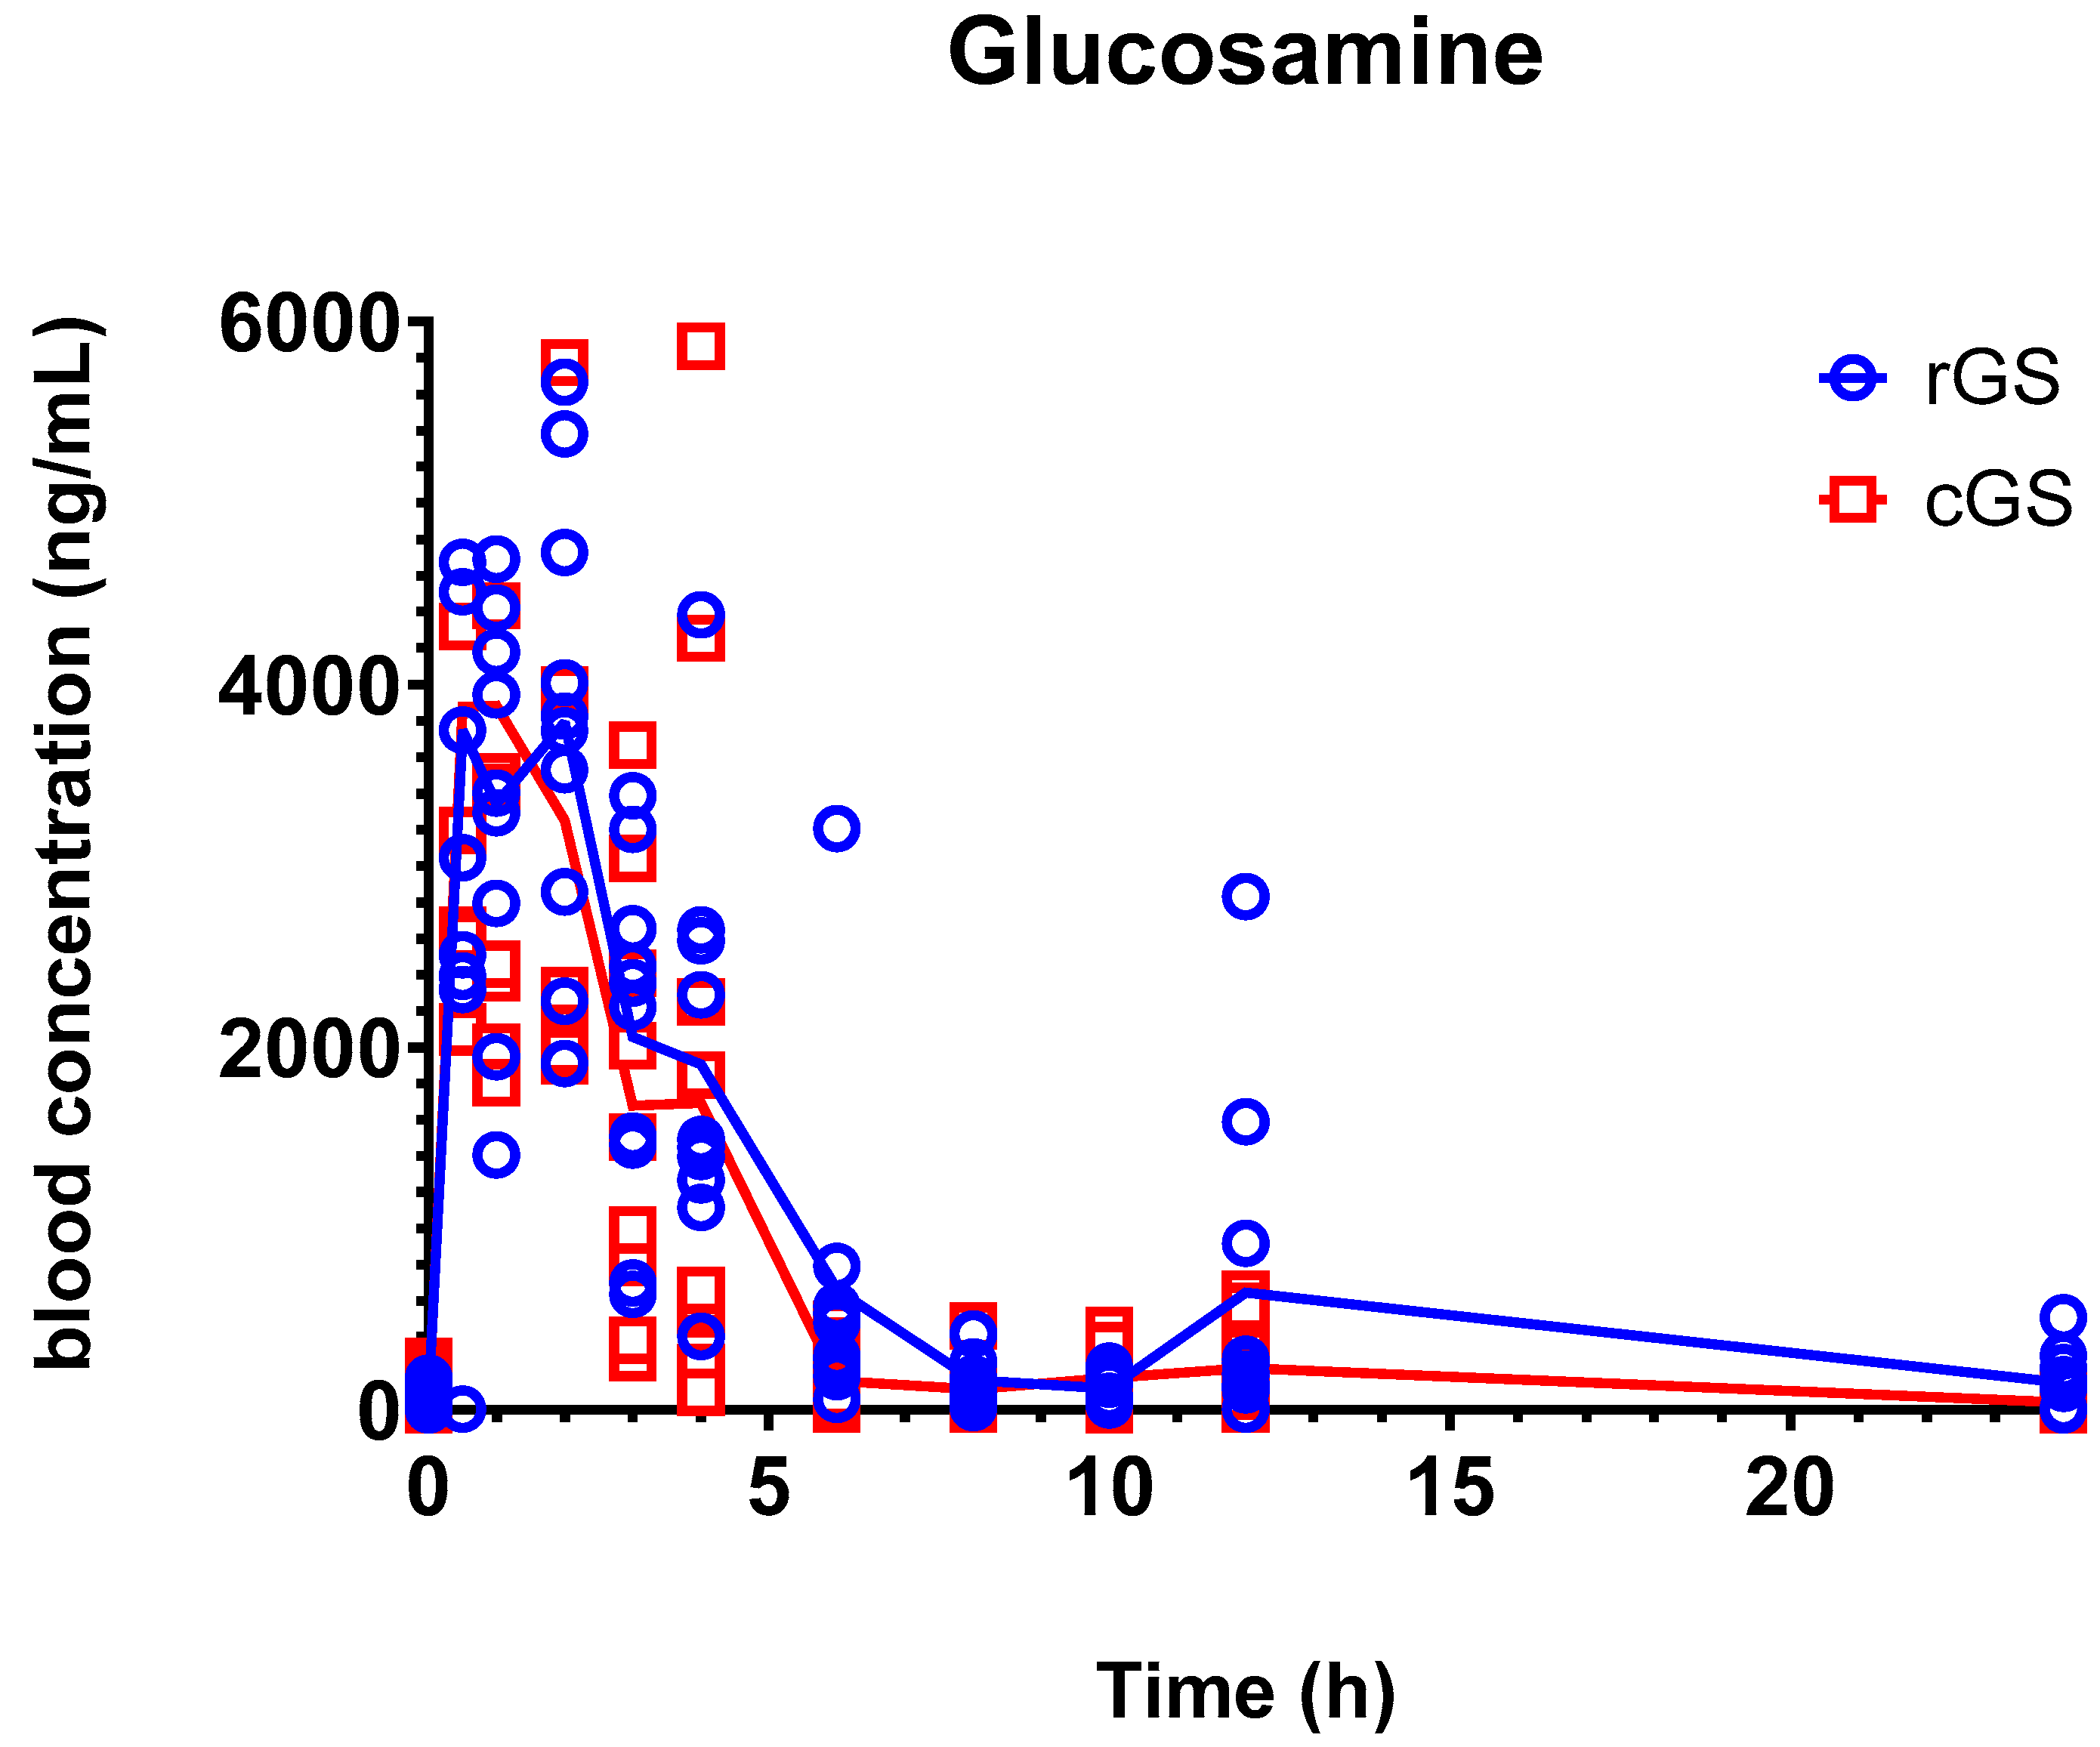
| Parameter | rGS | cGS | p-Value | GMR (rGS/cGS) | 90% CI |
|---|---|---|---|---|---|
| AUC0–24 (ng∙h/mL) | 18,300 (15,000–21,700) | 12,900 (8740–17,200) | 0.136 | 1.69 | 1.19–2.41 |
| Cmax (ng/mL) | 6000 (3500–8480) | 4160 (2080–6240) | 0.652 | 1.57 | 0.99–2.48 |
| Tmax (h) | 1.20 (0.69–1.71) | 0.93 (0.07–1.79) | 0.652 | ||
| T1/2 (h) | 8.17 (4.6–11.7) | 6.83 (0.86–12.8) | 0.652 |
| Parameter | rGS | cGS | p-Value | GMR (rGS/cGS) | 90% CI |
|---|---|---|---|---|---|
| AUC0–24 (ng∙h/mL) | 50,700 (27,500–73,900) | 50,600 (8730–92,500) | 0.795 | 1.39 | 0.641–3.02 |
| Cmax (ng/mL) | 3900 (2100–5700) | 5430 (3470–7390) | 0.341 | 0.703 | 0.465–1.063 |
| Tmax (h) | 6.75 (1.65–11.9) | 7.05 (3.8–10.3) | 0.795 | ||
| T1/2(h) | 38.7 (10–64.5) | 43.8 (−28.5–116) | >0.999 |
| rGS | cGS | p-Value | |
|---|---|---|---|
| Cmax M/P | 0.27 (0.13–0.558) | 0.54 (0.23–1.26) | 0.139 |
| AUC0–24 M/P | 0.50 (0.20–1.30) | 0.68 (0.23–1.99) | 0.179 |
Disclaimer/Publisher’s Note: The statements, opinions and data contained in all publications are solely those of the individual author(s) and contributor(s) and not of MDPI and/or the editor(s). MDPI and/or the editor(s) disclaim responsibility for any injury to people or property resulting from any ideas, methods, instructions or products referred to in the content. |
© 2025 by the authors. Licensee MDPI, Basel, Switzerland. This article is an open access article distributed under the terms and conditions of the Creative Commons Attribution (CC BY) license (https://creativecommons.org/licenses/by/4.0/).
Share and Cite
Chang, C.; Ibi, A.; Zhang, Y.; Du, M.; Roh, Y.S.; O’Brien, R.; Solnier, J. Does Salt Form Matter? A Pilot Randomized, Double-Blind, Crossover Pharmacokinetic Comparison of Crystalline and Regular Glucosamine Sulfate in Healthy Volunteers. Nutrients 2025, 17, 2491. https://doi.org/10.3390/nu17152491
Chang C, Ibi A, Zhang Y, Du M, Roh YS, O’Brien R, Solnier J. Does Salt Form Matter? A Pilot Randomized, Double-Blind, Crossover Pharmacokinetic Comparison of Crystalline and Regular Glucosamine Sulfate in Healthy Volunteers. Nutrients. 2025; 17(15):2491. https://doi.org/10.3390/nu17152491
Chicago/Turabian StyleChang, Chuck, Afoke Ibi, Yiming Zhang, Min Du, Yoon Seok Roh, Robert O’Brien, and Julia Solnier. 2025. "Does Salt Form Matter? A Pilot Randomized, Double-Blind, Crossover Pharmacokinetic Comparison of Crystalline and Regular Glucosamine Sulfate in Healthy Volunteers" Nutrients 17, no. 15: 2491. https://doi.org/10.3390/nu17152491
APA StyleChang, C., Ibi, A., Zhang, Y., Du, M., Roh, Y. S., O’Brien, R., & Solnier, J. (2025). Does Salt Form Matter? A Pilot Randomized, Double-Blind, Crossover Pharmacokinetic Comparison of Crystalline and Regular Glucosamine Sulfate in Healthy Volunteers. Nutrients, 17(15), 2491. https://doi.org/10.3390/nu17152491