
A Pilot EEG Study on the Acute Neurophysiological Effects of Single-Dose Astragaloside IV in Healthy Young Adults

 , , , and
 Highlights
- A single oral dose of AS-IV induces acute neurophysiological changes detectable by EEG in healthy young adults.
- AS-IV reduces absolute power in all bands except alpha and increases relative alpha power.
- Significant changes were observed in spectral ratios, including alpha-based and theta/beta indices.
- AS-IV may promote calmness, reduce mental stress, and support cognitive readiness.
- AS-IV shows promise as a functional neuroactive compound supporting a state of relaxed alertness.
Abstract

1. Introduction
2. Materials and Methods
2.1. Participants
2.2. Dose Determination
2.3. Experimental Process
2.4. EEG Recording and Preprocessing
2.5. Spectral Analysis
2.6. Statistical Analyses
3. Results
4. Discussion
5. Conclusions
Supplementary Materials
Author Contributions
Funding
Institutional Review Board Statement
Informed Consent Statement
Data Availability Statement
Acknowledgments
Conflicts of Interest
Abbreviations
| AS-IV | Astragaloside IV |
| AM | Astragalus membranaceus |
| EEG | Electroencephalography |
| SNR | Signal-to-noise ratio |
| ASR | Artifact Subspace Reconstruction |
| ICA | Independent Component Analysis |
| FAA | Frontal alpha asymmetry |
| FDR | False Discovery Rate |
| BSA | Body surface area |
| FDA | Food and Drug Administration |
| ICH | International Council for Harmonization |
| FIR | Finite impulse response |
| MARA | Multiple Artifact Rejection Algorithm |
| SD | Standard deviation |
| MAD | Median absolute deviation |
| ADHD | Attention deficit/hyperactivity disorder |
| CTC | Communication through coherence |
References
- Izzo, A.A.; Hoon-Kim, S.; Radhakrishnan, R.; Williamson, E.M. A critical approach to evaluating clinical efficacy, adverse events and drug interactions of herbal remedies. Phytother. Res. 2016, 30, 691–700. [Google Scholar] [CrossRef] [PubMed]
- Ny, V.; Houška, M.; Pavela, R.; Tříska, J. Potential benefits of incorporating Astragalus membranaceus into the diet of people undergoing disease treatment: An overview. J. Funct. Foods 2021, 77, 104339. [Google Scholar] [CrossRef]
- Chang, X.; Chen, X.; Guo, Y.; Gong, P.; Pei, S.; Wang, D.; Wang, P.; Wang, M.; Chen, F. Advances in chemical composition, extraction techniques, analytical methods, and biological activity of astragali radix. Molecules 2022, 27, 1058. [Google Scholar] [CrossRef] [PubMed]
- Liu, P.; Zhao, H.; Luo, Y. Anti-aging implications of Astragalus membranaceus (Huangqi): A well-known Chinese tonic. Aging Dis. 2017, 8, 868. [Google Scholar] [CrossRef] [PubMed]
- Kamal, G.; Anwar, F.; Hussain, A.; Sarri, N.; Ashraf, M. Yield and chemical composition of Citrus essential oils as affected by drying pretreatment of peels. Int. Food Res. J. 2011, 18, 1275–1282. [Google Scholar]
- Zhang, Z.; Wu, L.; Wang, J.; Yang, J.; Zhang, J.; Zhang, J.; Li, L.; Xia, Y.; Yao, L.; Qin, H.; et al. Astragaloside IV prevents MPP+-induced SH-SY5Y cell death via the inhibition of Bax-mediated pathways and ROS production. Mol. Cell. Biochem. 2012, 364, 209–216. [Google Scholar] [CrossRef] [PubMed]
- Sun, Q.; Jia, N.; Wang, W.; Jin, H.; Xu, J.; Hu, H. Protective effects of astragaloside IV against amyloid beta1-42 neurotoxicity by inhibiting the mitochondrial permeability transition pore opening. PLoS ONE 2014, 9, e98866. [Google Scholar] [CrossRef] [PubMed]
- Salehinejad, M.A.; Ghanavati, E.; Rashid, M.H.A.; Nitsche, M.A. Hot and cold executive functions in the brain: A prefrontal-cingular network. Brain Neurosci. Adv. 2021, 5, 23982128211007769. [Google Scholar] [CrossRef] [PubMed]
- Perry, R.J.; Hodges, J.R. Attention and executive deficits in Alzheimer’s disease: A critical review. Brain 1999, 122, 383–404. [Google Scholar] [CrossRef] [PubMed]
- Kudlicka, A.; Clare, L.; Hindle, J.V. Executive functions in Parkinson’s disease: Systematic review and meta-analysis. Mov. Disord. 2011, 26, 2305–2315. [Google Scholar] [CrossRef] [PubMed]
- Yang, Y.; Hong, M.; Lian, W.W.; Chen, Z. Review of the pharmacological effects of astragaloside IV and its autophagic mechanism in association with inflammation. World J. Clin. Cases 2022, 10, 10004. [Google Scholar] [CrossRef] [PubMed]
- Kang, X.; Su, S.; Hong, W.; Geng, W.; Tang, H. Research progress on the ability of astragaloside IV to protect the brain against ischemia-reperfusion injury. Front. Neurosci. 2021, 15, 755902. [Google Scholar] [CrossRef] [PubMed]
- World Health Organization. WHO Monographs on Selected Medicinal Plants; World Health Organization: Ravello-Salerno, Italy, 1999; Volume 2. [Google Scholar]
- Sowndhararajan, K.; Kim, S. Influence of fragrances on human psychophysiological activity: With special reference to human electroencephalographic response. Sci. Pharm. 2016, 84, 724–752. [Google Scholar] [CrossRef] [PubMed]
- Kaya, Ö.; Gündüz, D.H.; Yerlikaya, D.; Yener, G.G. Resting-state EEG Findings in Differentiating Alzheimer’s Disease From Amnestic Mild Cognitive Impairment and Healthy Elderly Controls. Turk. J. Neurol. 2021, 27, 248–256. [Google Scholar]
- Akdeniz, G. Delta and Theta Band Power Alterations During Face and Face Pareidolia Perception in Children with Autism Spectrum Disorder: An Electroencephalographic Analysis. Medicina 2025, 61, 754. [Google Scholar] [CrossRef] [PubMed]
- Muduroglu-Kirmizibekmez, A.; Cati, C.; Onder, A.; Aydin, S.; Kara, I. Investigation of the acute impact of rosemary consumption on brain activity in healthy volunteers. Nutr. Neurosci. 2025, 28, 321–332. [Google Scholar] [CrossRef] [PubMed]
- Okello, E.J.; Abadi, A.M.; Abadi, S.A. Effects of green and black tea consumption on brain wave activities in healthy volunteers as measured by a simplified electroencephalogram (EEG): A feasibility study. Nutr. Neurosci. 2016, 19, 196–205. [Google Scholar] [CrossRef] [PubMed]
- Sayorwan, W.; Siripornpanich, V.; Piriyapunyaporn, T.; Hongratanaworakit, T.; Kotchabhakdi, N.; Ruangrungsi, N. The effects of lavender oil inhalation on emotional states, autonomic nervous system, and brain electrical activity. J. Med. Assoc. Thail. 2012, 95, 598–606. [Google Scholar]
- Chandharakool, S.; Koomhin, P.; Sinlapasorn, J.; Suanjan, S.; Phungsai, J.; Suttipromma, N.; Songsamoe, S.; Matan, N.; Sattayakhom, A. Effects of tangerine essential oil on brain waves, moods, and sleep onset latency. Molecules 2020, 25, 4865. [Google Scholar] [CrossRef] [PubMed]
- Xia, D.; Li, W.; Tang, C.; Jiang, J. Astragaloside IV, as a potential anticancer agent. Front. Pharmacol. 2023, 14, 1065505. [Google Scholar] [CrossRef] [PubMed]
- Stępnik, K.; Jarząb, A.; Niedźwiadek, R.; Głowniak-Lipa, A.; Głowniak, K.; Kukula-Koch, W. In Vivo Insights into the Role of Astragaloside IV in Preventing and Treating Civilization Diseases: A Comprehensive Review. Int. J. Mol. Sci. 2025, 26, 4250. [Google Scholar] [CrossRef] [PubMed]
- Qing, L.S.; Chen, T.B.; Sun, W.X.; Chen, L.; Luo, P.; Zhang, Z.F.; Ding, L.S. Pharmacokinetics comparison, intestinal absorption and acute toxicity assessment of a novel water-soluble astragaloside IV derivative (astragalosidic acid, LS-102). Eur. J. Drug Metab. Pharmacokinet. 2019, 44, 251–259. [Google Scholar] [CrossRef] [PubMed]
- Reagan-Shaw, S.; Nihal, M.; Ahmad, N. Dose translation from animal to human studies revisited. FASEB J. 2008, 22, 659–661. [Google Scholar] [CrossRef] [PubMed]
- Zhang, R.; Zhai, Q.; Yu, Y.; Li, X.; Zhang, F.; Hou, Z.; Cao, Y.; Feng, J.; Xue, P. Safety assessment of crude saponins from Chenopodium quinoa willd. husks: 90-day oral toxicity and gut microbiota & metabonomics study in rats. Food Chem. 2022, 375, 131655. [Google Scholar] [CrossRef] [PubMed]
- Wu, L.; Song, H.; Zhang, C.; Wang, A.; Zhang, B.; Xiong, C.; Zhuang, X.; Zang, Y.; Li, C.; Fang, Q.; et al. Efficacy and safety of Panax notoginseng saponins in the treatment of adults with ischemic stroke in China: A randomized clinical trial. JAMA Netw. Open 2023, 6, e2317574. [Google Scholar] [CrossRef] [PubMed]
- Delorme, A.; Makeig, S. EEGLAB: An open source toolbox for analysis of single-trial EEG dynamics including independent component analysis. J. Neurosci. Methods 2004, 134, 9–21. [Google Scholar] [CrossRef] [PubMed]
- Mullen, T.R.; Kothe, C.A.; Chi, Y.M.; Ojeda, A.; Kerth, T.; Makeig, S.; Jung, T.P.; Cauwenberghs, G. Real-time neuroimaging and cognitive monitoring using wearable dry EEG. IEEE Trans. Biomed. Eng. 2015, 62, 2553–2567. [Google Scholar] [CrossRef] [PubMed]
- Kayser, J.; Tenke, C.E. Principal components analysis of Laplacian waveforms as a generic method for identifying ERP generator patterns: I. Evaluation with auditory oddball tasks. Clin. Neurophysiol. 2006, 117, 348–368. [Google Scholar] [CrossRef] [PubMed]
- Pion-Tonachini, L.; Kreutz-Delgado, K.; Makeig, S. ICLabel: An automated electroencephalographic independent component classifier, dataset, and website. NeuroImage 2019, 198, 181–197. [Google Scholar] [CrossRef] [PubMed]
- Winkler, I.; Haufe, S.; Tangermann, M. Automatic classification of artifactual ICA-components for artifact removal in EEG signals. Behav. Brain Funct. 2011, 7, 30. [Google Scholar] [CrossRef] [PubMed]
- Fitzgibbon, S.; DeLosAngeles, D.; Lewis, T.; Powers, D.; Grummett, T.; Whitham, E.; Ward, L.; Willoughby, J.; Pope, K. Automatic determination of EMG-contaminated components and validation of independent component analysis using EEG during pharmacologic paralysis. Clin. Neurophysiol. 2016, 127, 1781–1793. [Google Scholar] [CrossRef] [PubMed]
- Hayes, M.H. Statistical Digital Signal Processing and Modeling; John Wiley & Sons: Hoboken, NJ, USA, 1996; pp. 415–420. [Google Scholar]
- Stoica, P.; Moses, R. Spectral Analysis of Signals; Prentice Hall: Upper Saddle River, NJ, USA, 2005; Volume 452, pp. 50–52. [Google Scholar]
- Wilcox, R.R. Introduction to Robust Estimation and Hypothesis Testing; Academic Press: Cambridge, MA, USA, 2011; pp. 23–43, 137–215. [Google Scholar]
- Wang, Z.; Fei, X.; Liu, X.; Wang, Y.; Hu, Y.; Peng, W.; Wang, Y.w.; Zhang, S.; Xu, M. REM sleep is associated with distinct global cortical dynamics and controlled by occipital cortex. Nat. Commun. 2022, 13, 6896. [Google Scholar] [CrossRef] [PubMed]
- Freidlin, B.; Miao, W.; Gastwirth, J.L. On the use of the Shapiro-Wilk Test in two-stage adaptive inference for paired data from moderate to very heavy tailed distributions. Biom. J. J. Math. Methods Biosci. 2003, 45, 887–900. [Google Scholar] [CrossRef]
- Gasser, T.; Bächer, P.; Möcks, J. Transformations towards the normal distribution of broad band spectral parameters of the EEG. Electroencephalogr. Clin. Neurophysiol. 1982, 53, 119–124. [Google Scholar] [CrossRef] [PubMed]
- Putman, P.; Verkuil, B.; Arias-Garcia, E.; Pantazi, I.; van Schie, C. EEG theta/beta ratio as a potential biomarker for attentional control and resilience against deleterious effects of stress on attention. Cogn. Affect. Behav. Neurosci. 2014, 14, 782–791. [Google Scholar] [CrossRef] [PubMed]
- Güntekin, B.; Başar, E. Event-related beta oscillations are affected by emotional eliciting stimuli. Neurosci. Lett. 2010, 483, 173–178. [Google Scholar] [CrossRef] [PubMed]
- Klimesch, W. EEG alpha and theta oscillations reflect cognitive and memory performance: A review and analysis. Brain Res. Rev. 1999, 29, 169–195. [Google Scholar] [CrossRef] [PubMed]
- Barry, R.J.; Clarke, A.R.; Johnstone, S.J.; Magee, C.A.; Rushby, J.A. EEG differences between eyes-closed and eyes-open resting conditions. Clin. Neurophysiol. 2007, 118, 2765–2773. [Google Scholar] [CrossRef] [PubMed]
- Klimesch, W. Alpha-band oscillations, attention, and controlled access to stored information. Trends Cogn. Sci. 2012, 16, 606–617. [Google Scholar] [CrossRef] [PubMed]
- Lagopoulos, J.; Xu, J.; Rasmussen, I.; Vik, A.; Malhi, G.S.; Eliassen, C.F.; Arntsen, I.E.; Sæther, J.G.; Hollup, S.; Holen, A.; et al. Increased theta and alpha EEG activity during nondirective meditation. J. Altern. Complement. Med. 2009, 15, 1187–1192. [Google Scholar] [CrossRef] [PubMed]
- Scholey, A.; Downey, L.A.; Ciorciari, J.; Pipingas, A.; Nolidin, K.; Finn, M.; Wines, M.; Catchlove, S.; Terrens, A.; Barlow, E.; et al. Acute neurocognitive effects of epigallocatechin gallate (EGCG). Appetite 2012, 58, 767–770. [Google Scholar] [CrossRef] [PubMed]
- Palva, S.; Palva, J.M. New vistas for α-frequency band oscillations. Trends Neurosci. 2007, 30, 150–158. [Google Scholar] [CrossRef] [PubMed]
- Liu, N.H.; Chiang, C.Y.; Chu, H.C. Recognizing the degree of human attention using EEG signals from mobile sensors. sensors 2013, 13, 10273–10286. [Google Scholar] [CrossRef] [PubMed]
- Seo, S.H.; Lee, J.T.; Crisan, M. Stress and EEG. In Convergence and Hybrid Information Technologies; IntechOpen: London, UK, 2010; Chapter 27. [Google Scholar]
- Dasari, Y.; Chebolu, L.R.; Balasubramanian, V. Electroencephalogram analysis on alpha/beta and theta/beta ratios due to shirodhara. J. Ayurveda Integr. Med. 2025, 16, 101094. [Google Scholar] [CrossRef] [PubMed]
- Jap, B.T.; Lal, S.; Fischer, P.; Bekiaris, E. Using EEG spectral components to assess algorithms for detecting fatigue. Expert Syst. Appl. 2009, 36, 2352–2359. [Google Scholar] [CrossRef]
- Harmony, T. The functional significance of delta oscillations in cognitive processing. Front. Integr. Neurosci. 2013, 7, 83. [Google Scholar] [CrossRef] [PubMed]
- Gueguen, B.; Derouesne, C.; Bourdel, M.; Guillou, S.; Landre, E.; Gaches, J.; Hossard, H.; Ancri, D.; Mann, M. Quantified EEG in the diagnosis of Alzheimer’s type dementia. Neurophysiol. Clin. Clin. Neurophysiol. 1991, 21, 357–371. [Google Scholar] [CrossRef] [PubMed]
- Özbek, Y.; Fide, E.; Yener, G.G. Resting-state EEG alpha/theta power ratio discriminates early-onset Alzheimer’s disease from healthy controls. Clin. Neurophysiol. 2021, 132, 2019–2031. [Google Scholar] [CrossRef] [PubMed]
- Salma, N.; Mai, B.; Namuduri, K.; Mamun, R.; Hashem, Y.; Takabi, D.; Parde, N.; Nielsen, R. Using EEG signal to analyze IS decision making cognitive processes. In Information Systems and Neuroscience; Davis, F., Riedl, R., Vom Brocke, J., Léger, P.M., Randolph, A., Eds.; Springer: Cham, Switzerland, 2018; Volume 25, pp. 211–218. [Google Scholar]
- Lubar, J.F. Discourse on the development of EEG diagnostics and biofeedback for attention-deficit/hyperactivity disorders. Biofeedback Self-Regul. 1991, 16, 201–225. [Google Scholar] [CrossRef] [PubMed]
- Clarke, A.R.; Barry, R.J.; Karamacoska, D.; Johnstone, S.J. The EEG theta/beta ratio: A marker of arousal or cognitive processing capacity? Appl. Psychophysiol. Biofeedback 2019, 44, 123–129. [Google Scholar] [CrossRef] [PubMed]
- Wen, T.Y.; Aris, S.M. Electroencephalogram (EEG) stress analysis on alpha/beta ratio and theta/beta ratio. Indones. J. Electr. Eng. Comput. Sci. 2020, 17, 175–182. [Google Scholar]
- Xie, Y.H.; Zhang, Y.M.; Fan, F.F.; Song, X.Y.; Liu, L. Functional role of frontal electroencephalogram alpha asymmetry in the resting state in patients with depression: A review. World J. Clin. Cases 2023, 11, 1903–1917. [Google Scholar] [CrossRef] [PubMed]
- Coan, J.A.; Allen, J.J. Frontal EEG asymmetry as a moderator and mediator of emotion. Biol. Psychol. 2004, 67, 7–50. [Google Scholar] [CrossRef] [PubMed]
- Knyazev, G.G. Motivation, emotion, and their inhibitory control mirrored in brain oscillations. Neurosci. Biobehav. Rev. 2007, 31, 377–395. [Google Scholar] [CrossRef] [PubMed]
- Gruzelier, J.H. EEG-neurofeedback for optimising performance. I: A review of cognitive and affective outcome in healthy participants. Neurosci. Biobehav. Rev. 2014, 44, 124–141. [Google Scholar] [CrossRef] [PubMed]
- Davidson, R.J. Well–being and affective style: Neural substrates and biobehavioural correlates. Philos. Trans. R. Soc. Lond. Ser. B Biol. Sci. 2004, 359, 1395–1411. [Google Scholar] [CrossRef] [PubMed]
- Tang, Y.Y.; Ma, Y.; Fan, Y.; Feng, H.; Wang, J.; Feng, S.; Lu, Q.; Hu, B.; Lin, Y.; Li, J.; et al. Central and autonomic nervous system interaction is altered by short-term meditation. Proc. Natl. Acad. Sci. USA 2009, 106, 8865–8870. [Google Scholar] [CrossRef] [PubMed]
- Lomas, T.; Ivtzan, I.; Fu, C.H. A systematic review of the neurophysiology of mindfulness on EEG oscillations. Neurosci. Biobehav. Rev. 2015, 57, 401–410. [Google Scholar] [CrossRef] [PubMed]
- Li, L.; Hou, X.; Xu, R.; Liu, C.; Tu, M. Research review on the pharmacological effects of astragaloside IV. Fundam. Clin. Pharmacol. 2017, 31, 17–36. [Google Scholar] [CrossRef] [PubMed]
- Fries, P. A mechanism for cognitive dynamics: Neuronal communication through neuronal coherence. Trends Cogn. Sci. 2005, 9, 474–480. [Google Scholar] [CrossRef] [PubMed]
- Fries, P. Rhythms for cognition: Communication through coherence. Neuron 2015, 88, 220–235. [Google Scholar] [CrossRef] [PubMed]
- Brimson, J.M.; Brimson, S.; Prasanth, M.I.; Thitilertdecha, P.; Malar, D.S.; Tencomnao, T. The effectiveness of Bacopa monnieri (Linn.) Wettst. as a nootropic, neuroprotective, or antidepressant supplement: Analysis of the available clinical data. Sci. Rep. 2021, 11, 596. [Google Scholar] [CrossRef] [PubMed]
- Sadhu, A.; Upadhyay, P.; Agrawal, A.; Ilango, K.; Karmakar, D.; Singh, G.P.I.; Dubey, G.P. Management of cognitive determinants in senile dementia of Alzheimer’s type: Therapeutic potential of a novel polyherbal drug product. Clin. Drug Investig. 2014, 34, 857–869. [Google Scholar] [CrossRef] [PubMed]

| Characteristics | Informations |
|---|---|
| Participant Number | 20 |
| Laterality | 100% right-handed |
| Gender | 40% female |
| Age (years) | 23.4 ± 2.1 |
| Weight (kg) | 63.1 ± 10.7 |
| BMI | 21.52 ± 1.87 |
| Literacy rate | 100% |
| EEG Metric | Pre (Mean ± SE) | Post (Mean ± SE) | Test | p-Value | z-Value | r-Value |
|---|---|---|---|---|---|---|
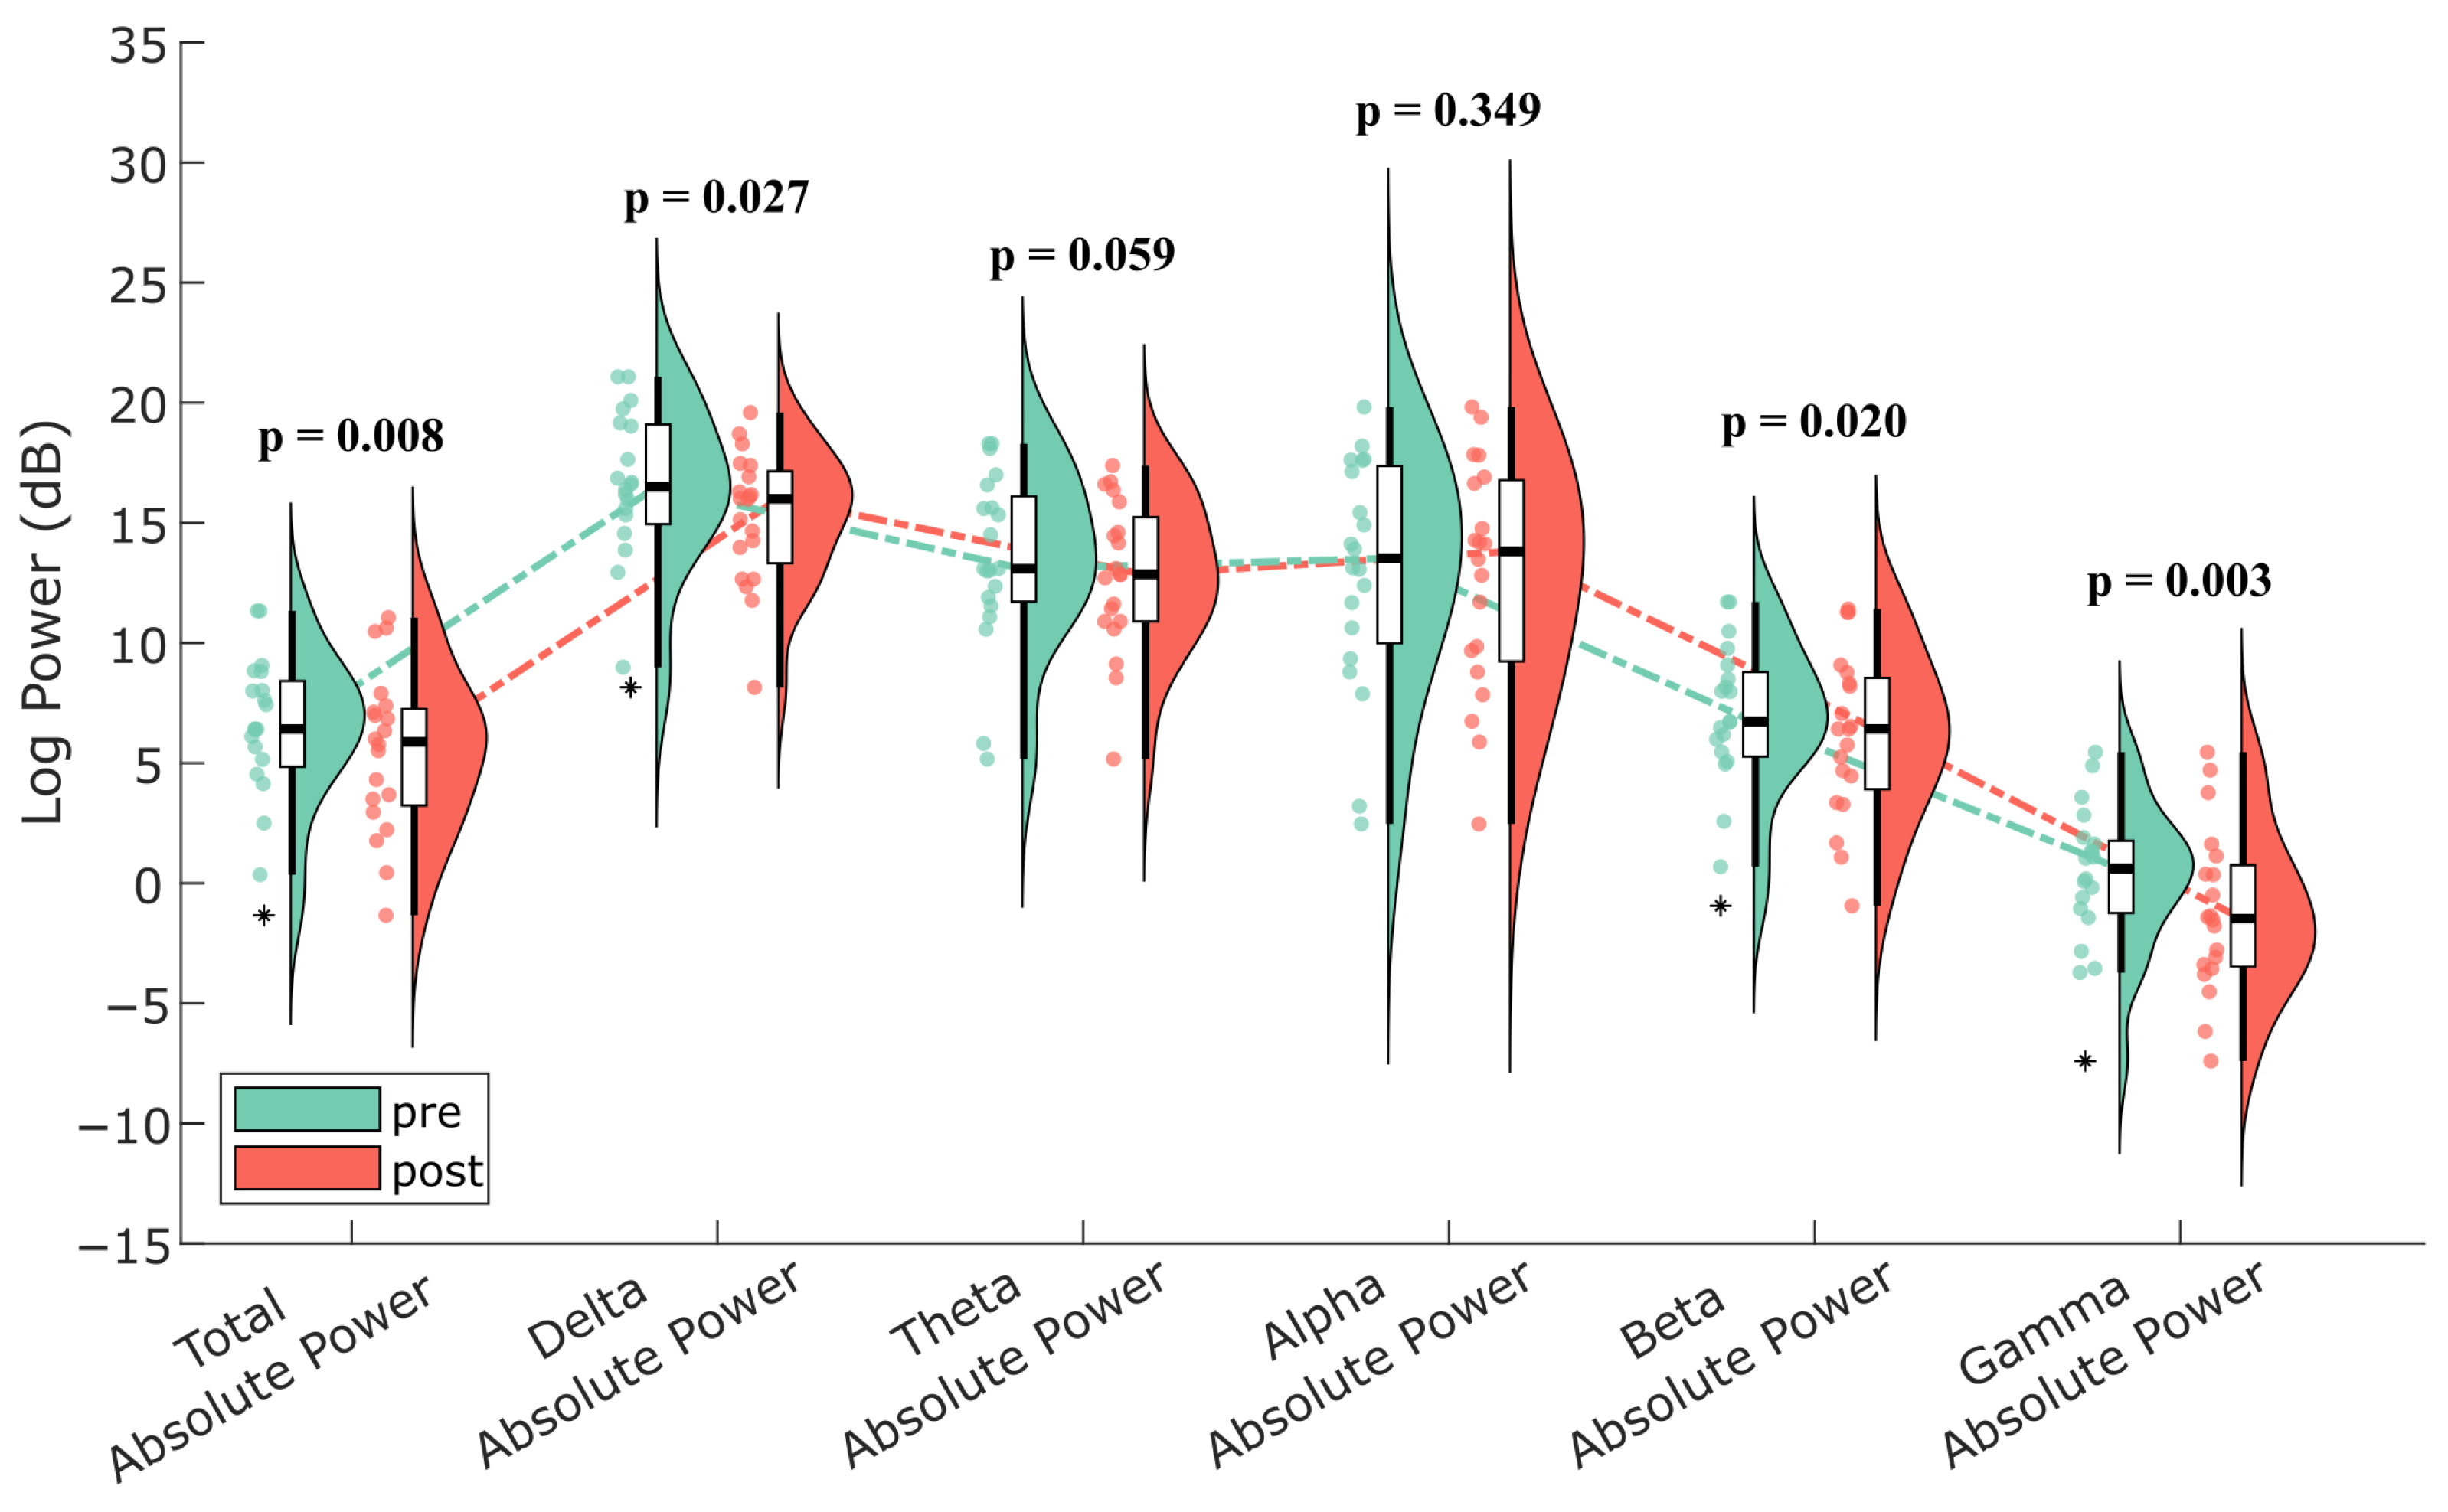
| Total Power | 6.341 ± 0.721 * | 5.478 ± 0.745 * | wilcoxon | 0.008 | 2.66 | 0.59 |
| Delta Power | 16.298 ± 0.781 * | 15.226 ± 0.615 * | wilcoxon | 0.027 | 2.21 | 0.49 |
| Theta Power | 13.499 ± 0.817 * | 12.797 ± 0.700 * | wilcoxon | 0.059 | 1.89 | 0.42 |
| Alpha Power | 12.948 ± 1.074 * | 12.752 ± 1.072 * | wilcoxon | 0.349 | 0.94 | 0.21 |
| Beta power | 6.765 ± 0.739 * | 6.169 ± 0.767 * | wilcoxon | 0.020 | 2.33 | 0.52 |
| Gamma Power | 0.225 ± 0.685 * | −1.194 ± 0.762 * | wilcoxon | 0.003 | 2.98 | 0.67 |
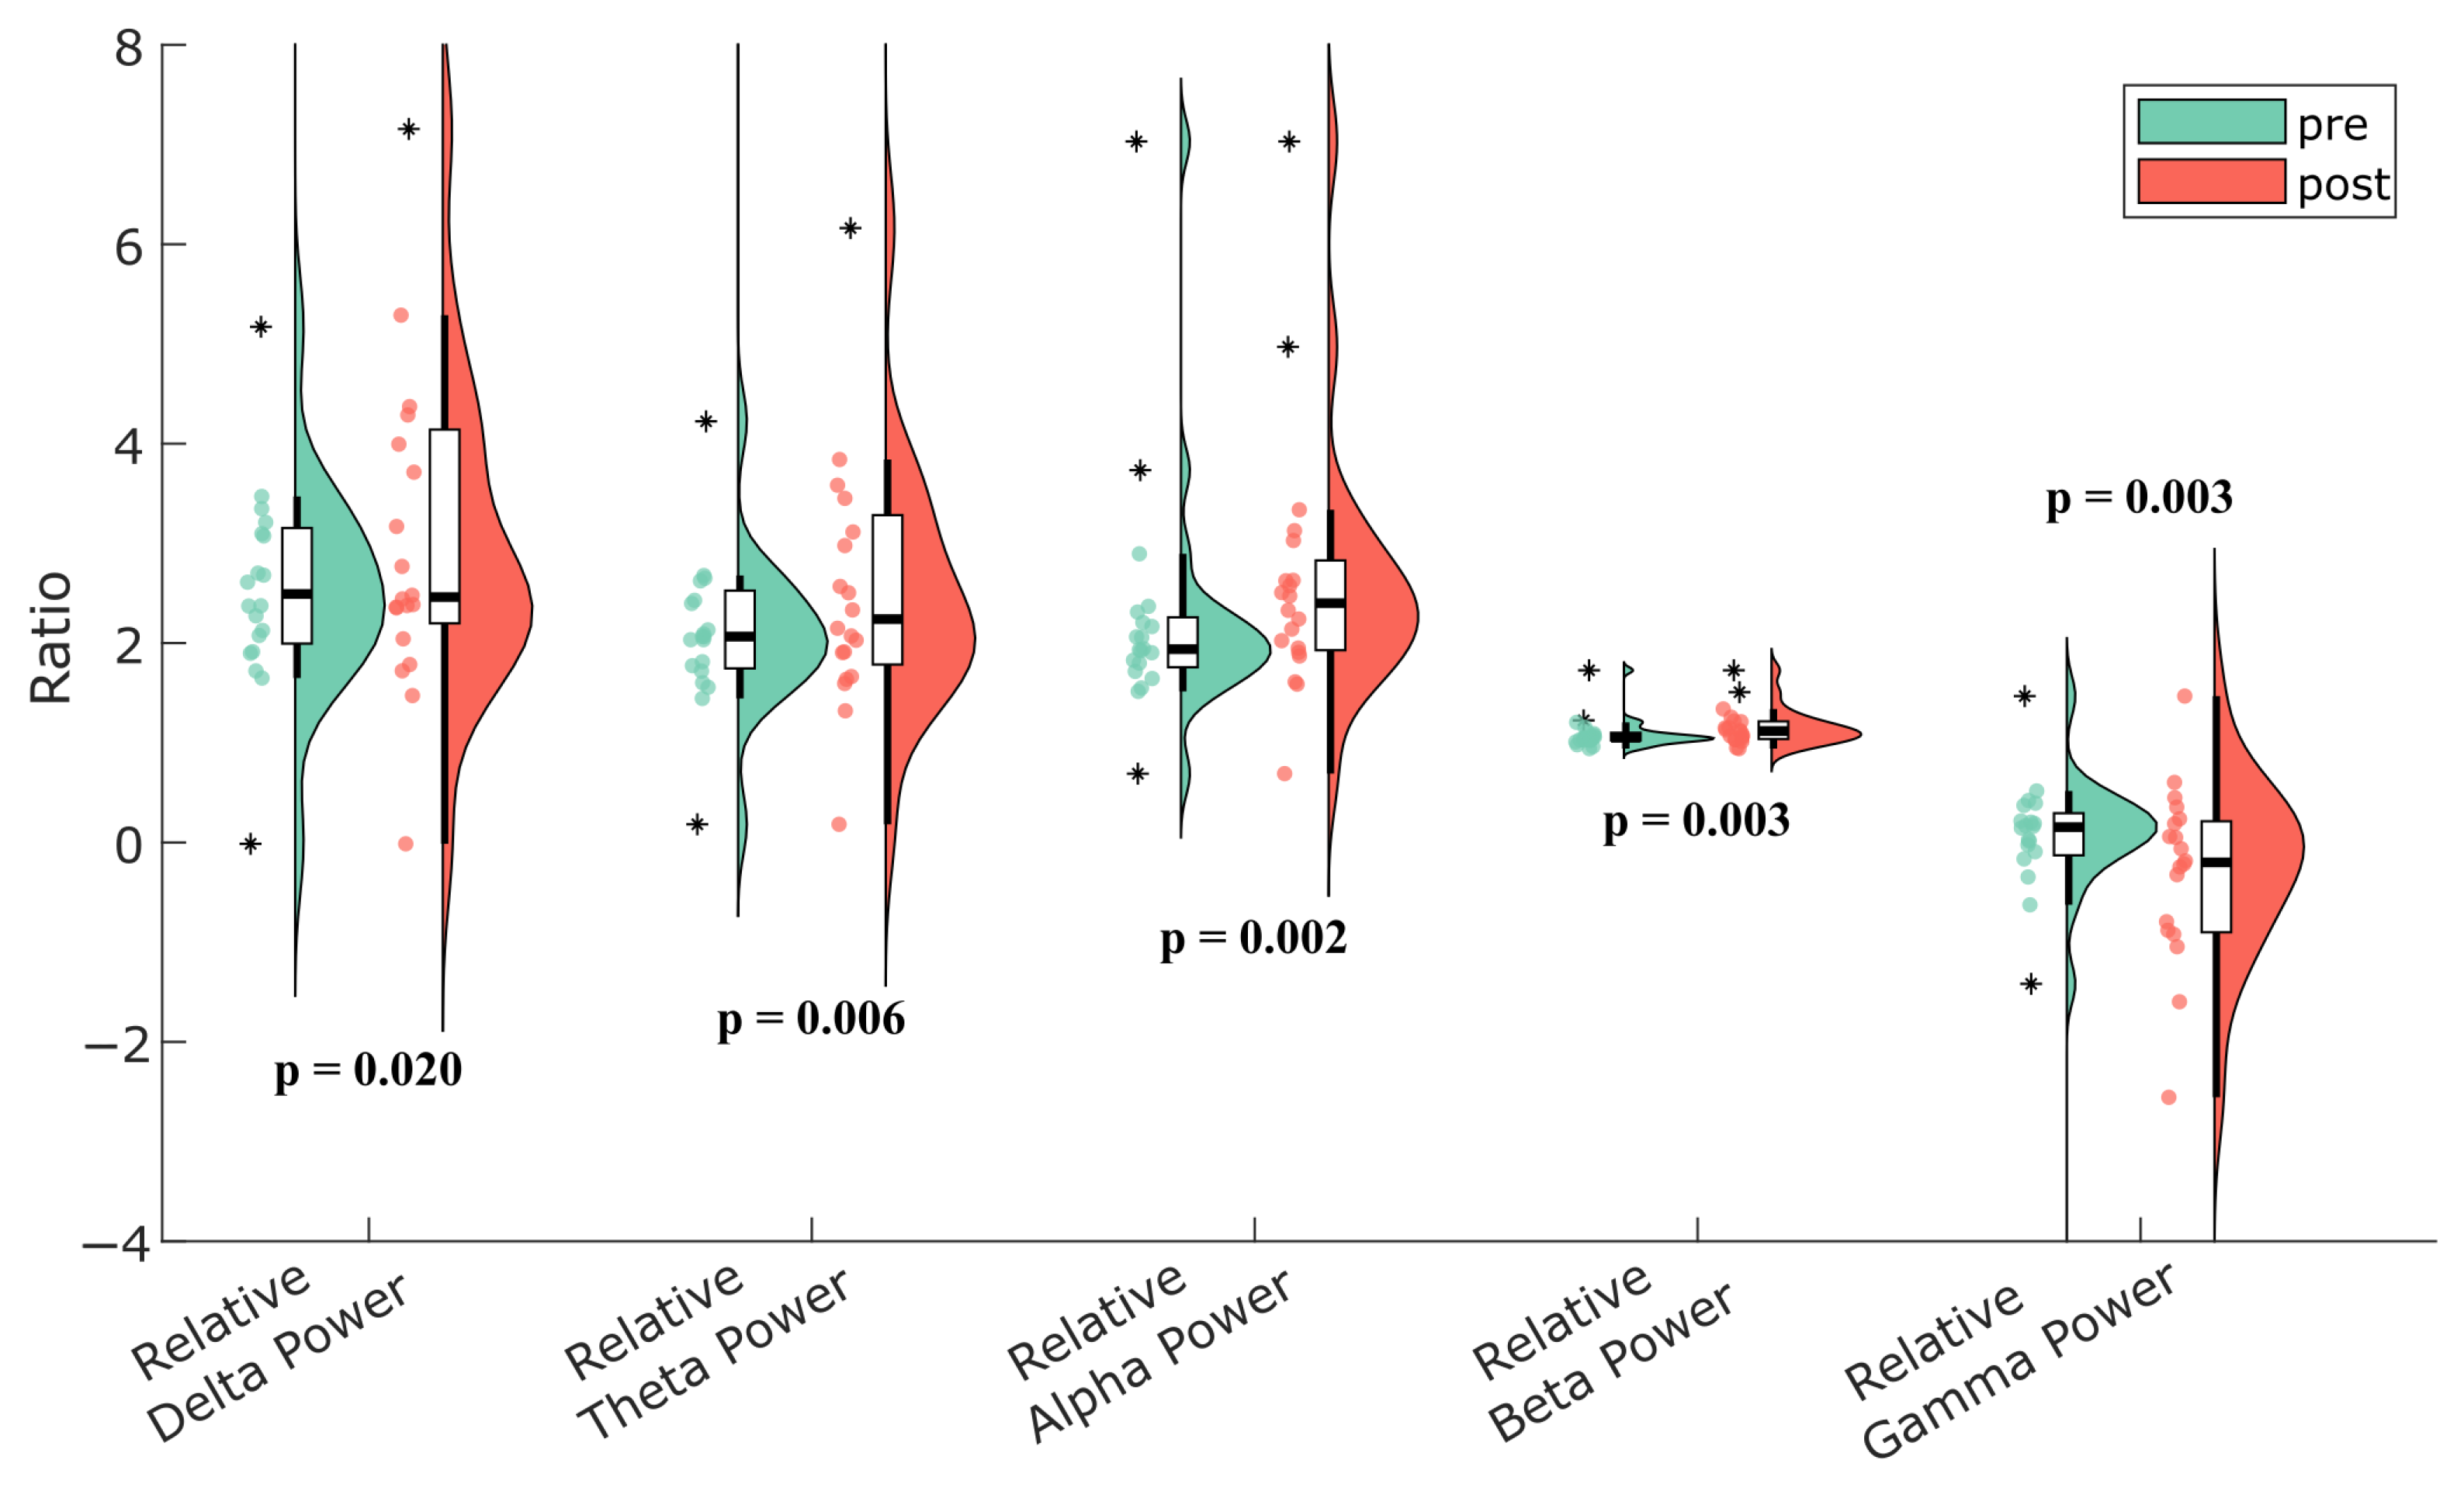
| Relative Delta | 3.204 ± 0.726 | 3.624 ± 0.752 | wilcoxon | 0.020 | −2.33 | −0.52 |
| Relative Theta | 2.542 ± 0.492 | 2.916 ± 0.520 | wilcoxon | 0.006 | −2.72 | −0.61 |
| Relative Alpha | 2.264 ± 0.283 | 2.633 ± 0.300 | wilcoxon | 0.002 | −3.11 | −0.7 |
| Relative Beta | 1.092 ± 0.037 | 1.157 ± 0.042 | wilcoxon | 0.003 | −2.98 | −0.67 |
| Relative Gamma | −0.246 ± 0.353 | −0.598 ± 0.368 | wilcoxon | 0.003 | 2.98 | 0.67 |
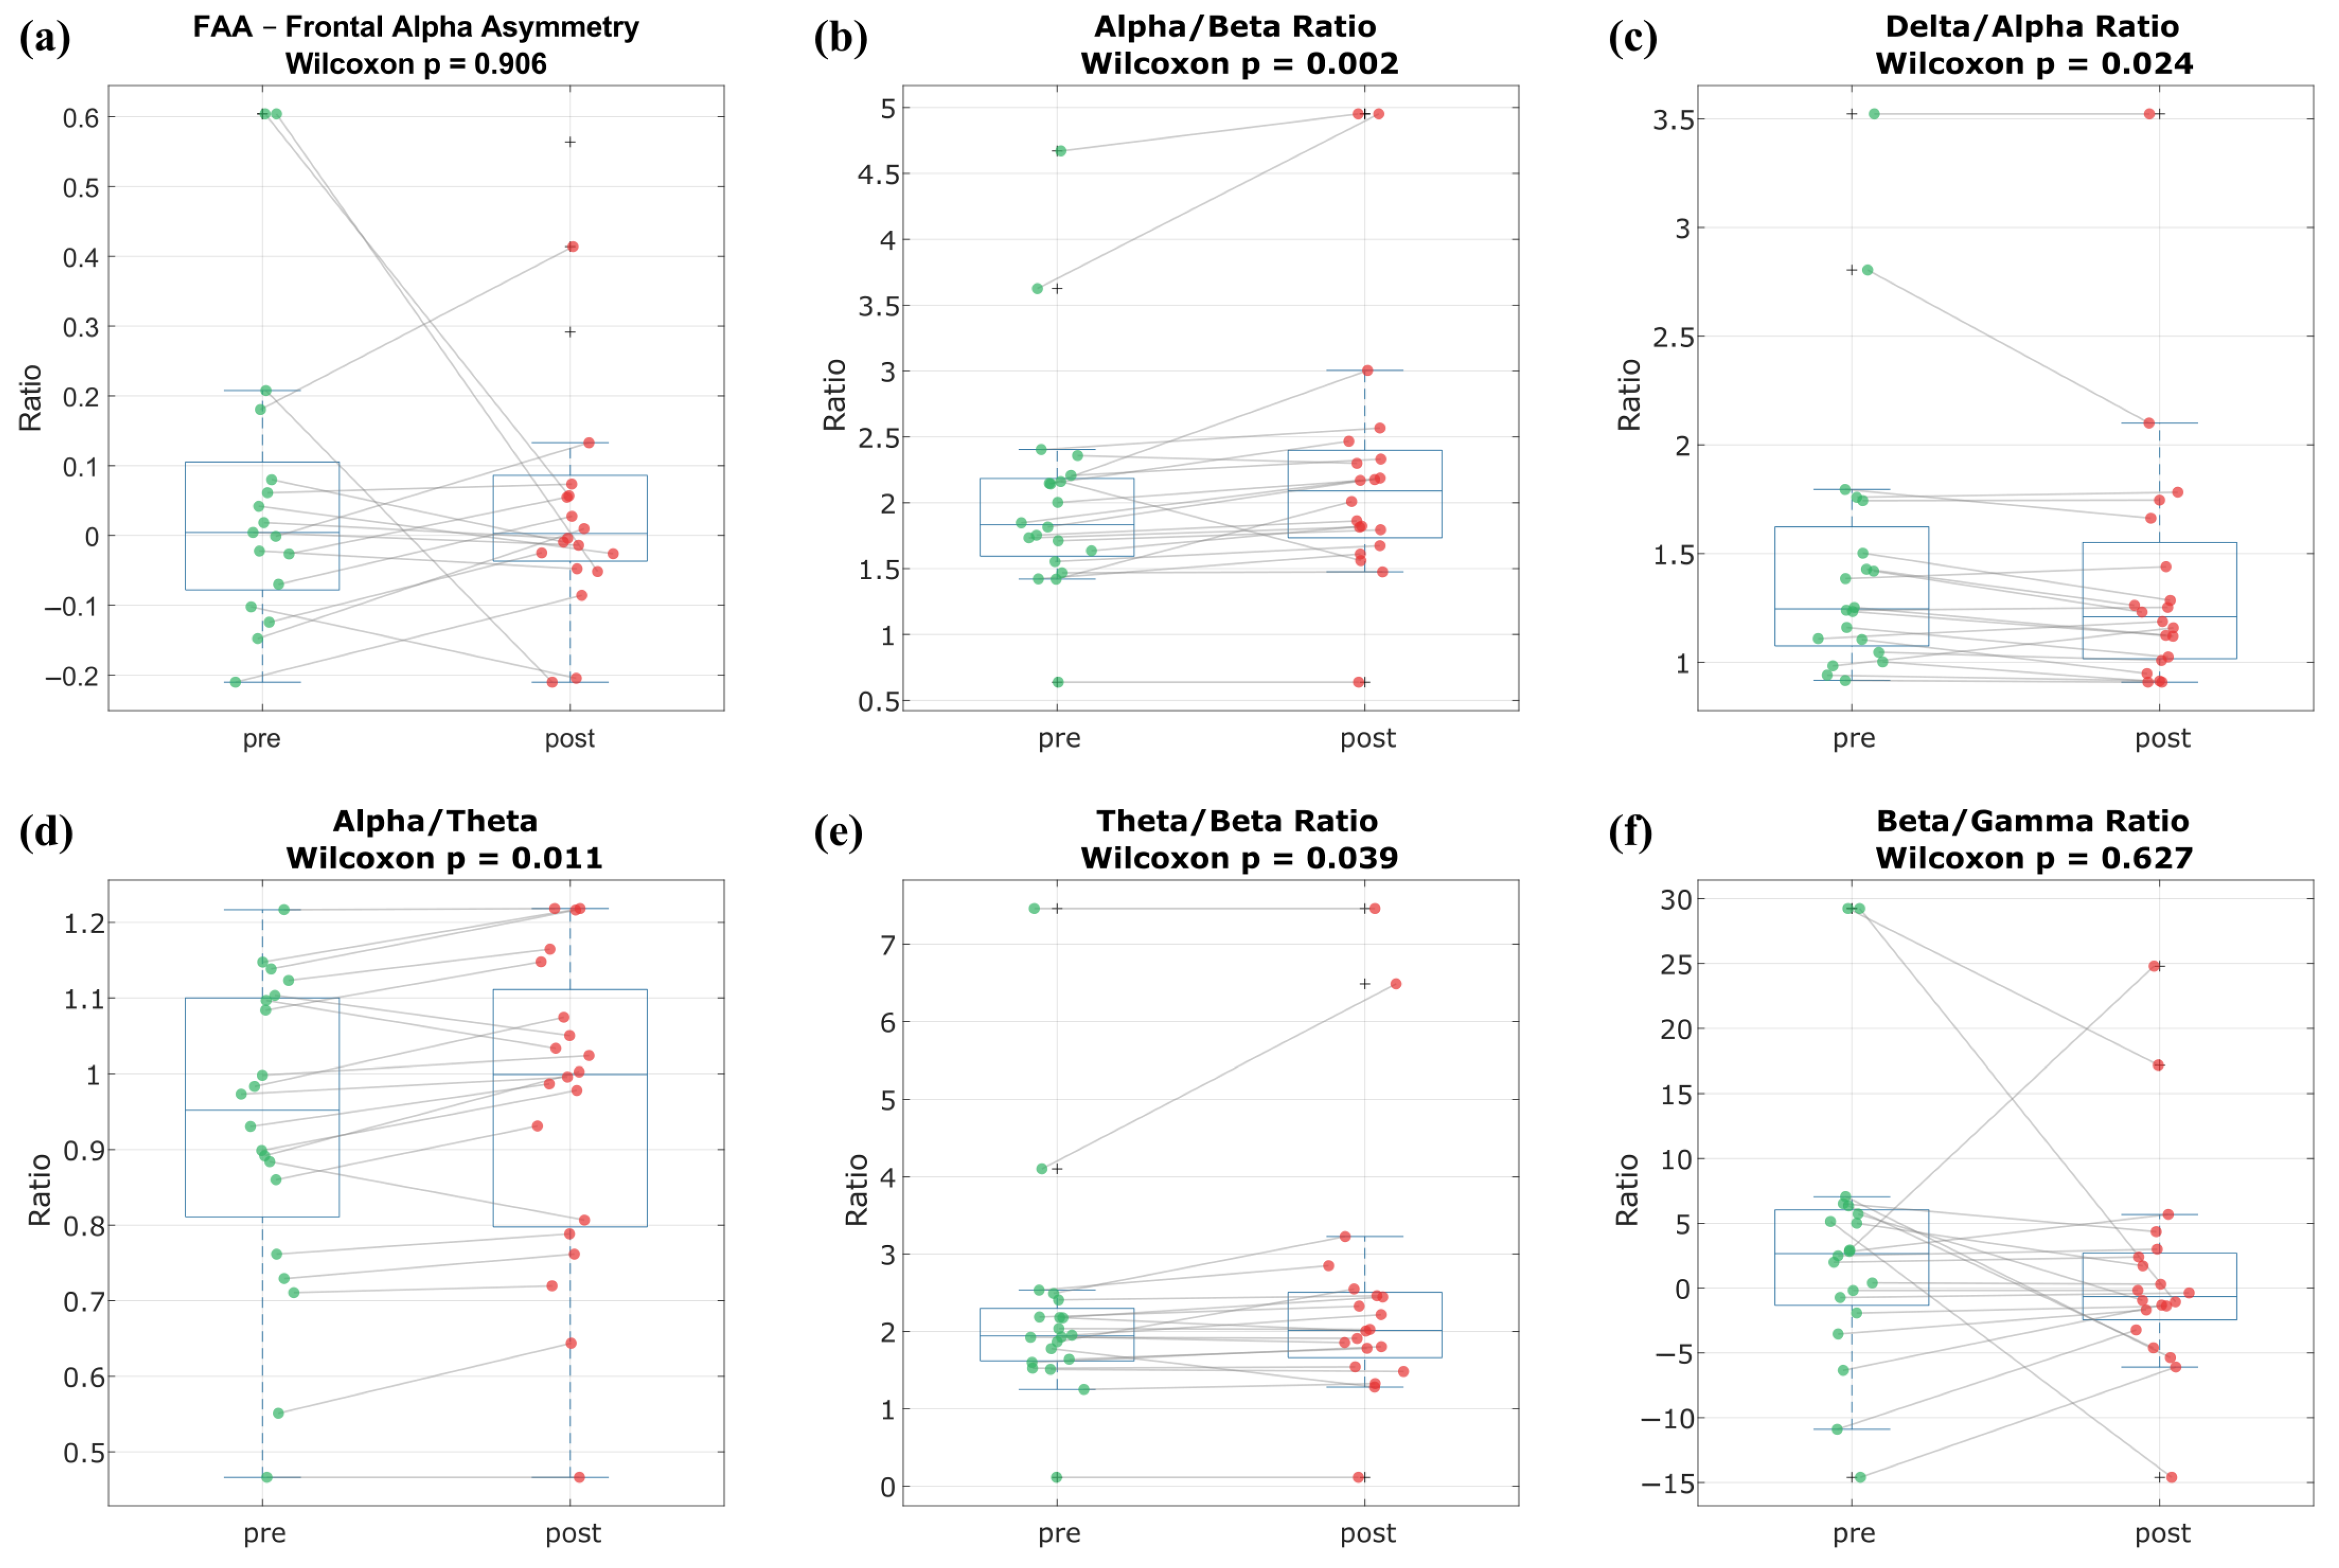
| FAA | 0.065 ± 0.056 | 0.005 ± 0.033 | wilcoxon | 0.906 | 0.12 | 0.03 |
| Alpha/Beta | 2.036 ± 0.189 | 2.268 ± 0.232 | wilcoxon | 0.002 | −3.06 | −0.68 |
| Delta/Alpha | 1.467 ± 0.145 | 1.379 ± 0.135 | wilcoxon | 0.024 | 2.25 | 0.50 |
| Alpha/Theta | 0.927 ± 0.045 | 0.961 ± 0.046 | wilcoxon | 0.011 | −2.54 | −0.57 |
| Theta/Beta | 2.232 ± 0.320 | 2.457 ± 0.377 | wilcoxon | 0.039 | −2.07 | −0.46 |
| Beta/Gamma | 3.334 ± 2.362 | 0.928 ± 1.836 | wilcoxon | 0.627 | 0.49 | 0.11 |
| Band | Ch | Pre (M ± SE) | Post (M ± SE) | Test | p | t/z | d/r | N | q |
|---|---|---|---|---|---|---|---|---|---|
| All | Cz | 5.236 ± 0.519 | 4.405 ± 0.701 | wilcoxon | 0.015 | 2.43 | 0.54 | 20 | 0.175 |
| All | F7 | 5.874 ± 1.268 | 4.468 ± 0.965 | wilcoxon | 0.040 | 2.05 | 0.47 | 19 | 0.241 |
| All | Fp2 | 5.417 ± 0.971 | 3.683 ± 1.272 | paired t-test | 0.048 | 2.13 | −0.50 | 18 | 0.241 |
| All | Fz | 6.947 ± 0.716 | 5.963 ± 0.636 | paired t-test | 0.032 | 2.31 | −0.52 | 20 | 0.241 |
| All | T4 | 5.734 ± 1.014 | 3.401 ± 0.993 | paired t-test | 0.004 | 3.47 | −0.90 | 15 | 0.142 |
| All | T6 | 6.193 ± 0.956 | 4.649 ± 1.122 | paired t-test | 0.012 | 2.83 | −0.69 | 17 | 0.153 |
| Alpha | P4 | 16.183 ± 1.489 | 15.230 ± 1.657 | paired t-test | 0.048 | 2.14 | −0.52 | 17 | 0.241 |
| Beta | T4 | 5.953 ± 1.004 | 3.802 ± 0.977 | paired t-test | 0.006 | 3.27 | −0.84 | 15 | 0.142 |
| Beta | T6 | 6.547 ± 0.960 | 5.195 ± 1.145 | paired t-test | 0.020 | 2.57 | −0.62 | 17 | 0.184 |
| Delta | Cz | 16.270 ± 0.610 | 14.693 ± 0.690 | wilcoxon | 0.008 | 2.65 | 0.59 | 20 | 0.145 |
| Delta | Fp2 | 16.550 ± 1.186 | 13.985 ± 1.354 | paired t-test | 0.039 | 2.24 | −0.53 | 18 | 0.241 |
| Delta | FpZ | 17.375 ± 1.429 | 14.126 ± 1.695 | paired t-test | 0.045 | 2.23 | −0.62 | 13 | 0.241 |
| Delta | Fz | 18.837 ± 0.766 | 17.342 ± 0.580 | paired t-test | 0.018 | 2.58 | −0.58 | 20 | 0.179 |
| Delta | OZ | 17.373 ± 0.629 | 15.509 ± 0.696 | paired t-test | 0.005 | 3.27 | −0.77 | 18 | 0.142 |
| Delta | Pz | 17.647 ± 0.628 | 15.505 ± 1.029 | wilcoxon | 0.017 | 2.39 | 0.53 | 20 | 0.177 |
| Gamma | Cz | −2.165 ± 0.478 | −3.283 ± 0.739 | wilcoxon | 0.004 | 2.87 | 0.64 | 20 | 0.142 |
| Gamma | F7 | 1.021 ± 1.393 | −1.348 ± 1.130 | paired t-test | 0.043 | 2.17 | −0.50 | 19 | 0.241 |
| Gamma | Fz | −0.364 ± 0.604 | −1.660 ± 0.581 | paired t-test | 0.009 | 2.90 | -0.65 | 20 | 0.145 |
| Gamma | Pz | −1.638 ± 0.481 | −2.961 ± 0.956 | wilcoxon | 0.044 | 2.02 | 0.45 | 20 | 0.241 |
| Gamma | T4 | 0.879 ± 1.217 | −2.522 ± 1.162 | paired t-test | 0.004 | 3.40 | −0.88 | 15 | 0.142 |
| Gamma | T5 | 0.624 ± 1.273 | −0.508 ± 1.259 | wilcoxon | 0.044 | 2.01 | 0.49 | 17 | 0.241 |
| Gamma | T6 | 0.033 ± 1.071 | −1.939 ± 1.178 | paired t-test | 0.011 | 2.88 | −0.70 | 17 | 0.151 |
| Theta | Cz | 14.475 ± 0.708 | 13.267 ± 0.789 | wilcoxon | 0.009 | 2.61 | 0.58 | 20 | 0.145 |
| Theta | Fp2 | 13.036 ± 1.066 | 11.138 ± 1.198 | paired t-test | 0.033 | 2.32 | −0.55 | 18 | 0.241 |
Disclaimer/Publisher’s Note: The statements, opinions and data contained in all publications are solely those of the individual author(s) and contributor(s) and not of MDPI and/or the editor(s). MDPI and/or the editor(s) disclaim responsibility for any injury to people or property resulting from any ideas, methods, instructions or products referred to in the content. |
© 2025 by the authors. Licensee MDPI, Basel, Switzerland. This article is an open access article distributed under the terms and conditions of the Creative Commons Attribution (CC BY) license (https://creativecommons.org/licenses/by/4.0/).
Share and Cite
Müdüroğlu Kırmızıbekmez, A.; Özdemir, M.Y.; Önder, A.; Çatı, C.; Kara, İ. A Pilot EEG Study on the Acute Neurophysiological Effects of Single-Dose Astragaloside IV in Healthy Young Adults. Nutrients 2025, 17, 2425. https://doi.org/10.3390/nu17152425
Müdüroğlu Kırmızıbekmez A, Özdemir MY, Önder A, Çatı C, Kara İ. A Pilot EEG Study on the Acute Neurophysiological Effects of Single-Dose Astragaloside IV in Healthy Young Adults. Nutrients. 2025; 17(15):2425. https://doi.org/10.3390/nu17152425
Chicago/Turabian StyleMüdüroğlu Kırmızıbekmez, Aynur, Mustafa Yasir Özdemir, Alparslan Önder, Ceren Çatı, and İhsan Kara. 2025. "A Pilot EEG Study on the Acute Neurophysiological Effects of Single-Dose Astragaloside IV in Healthy Young Adults" Nutrients 17, no. 15: 2425. https://doi.org/10.3390/nu17152425
APA StyleMüdüroğlu Kırmızıbekmez, A., Özdemir, M. Y., Önder, A., Çatı, C., & Kara, İ. (2025). A Pilot EEG Study on the Acute Neurophysiological Effects of Single-Dose Astragaloside IV in Healthy Young Adults. Nutrients, 17(15), 2425. https://doi.org/10.3390/nu17152425